Blackfeet vs Black/African American Unemployment Among Youth under 25 years
COMPARE
Blackfeet
Black/African American
Unemployment Among Youth under 25 years
Unemployment Among Youth under 25 years Comparison
Blackfeet
Blacks/African Americans
13.3%
UNEMPLOYMENT AMONG YOUTH UNDER 25 YEARS
0.0/ 100
METRIC RATING
286th/ 347
METRIC RANK
14.5%
UNEMPLOYMENT AMONG YOUTH UNDER 25 YEARS
0.0/ 100
METRIC RATING
317th/ 347
METRIC RANK
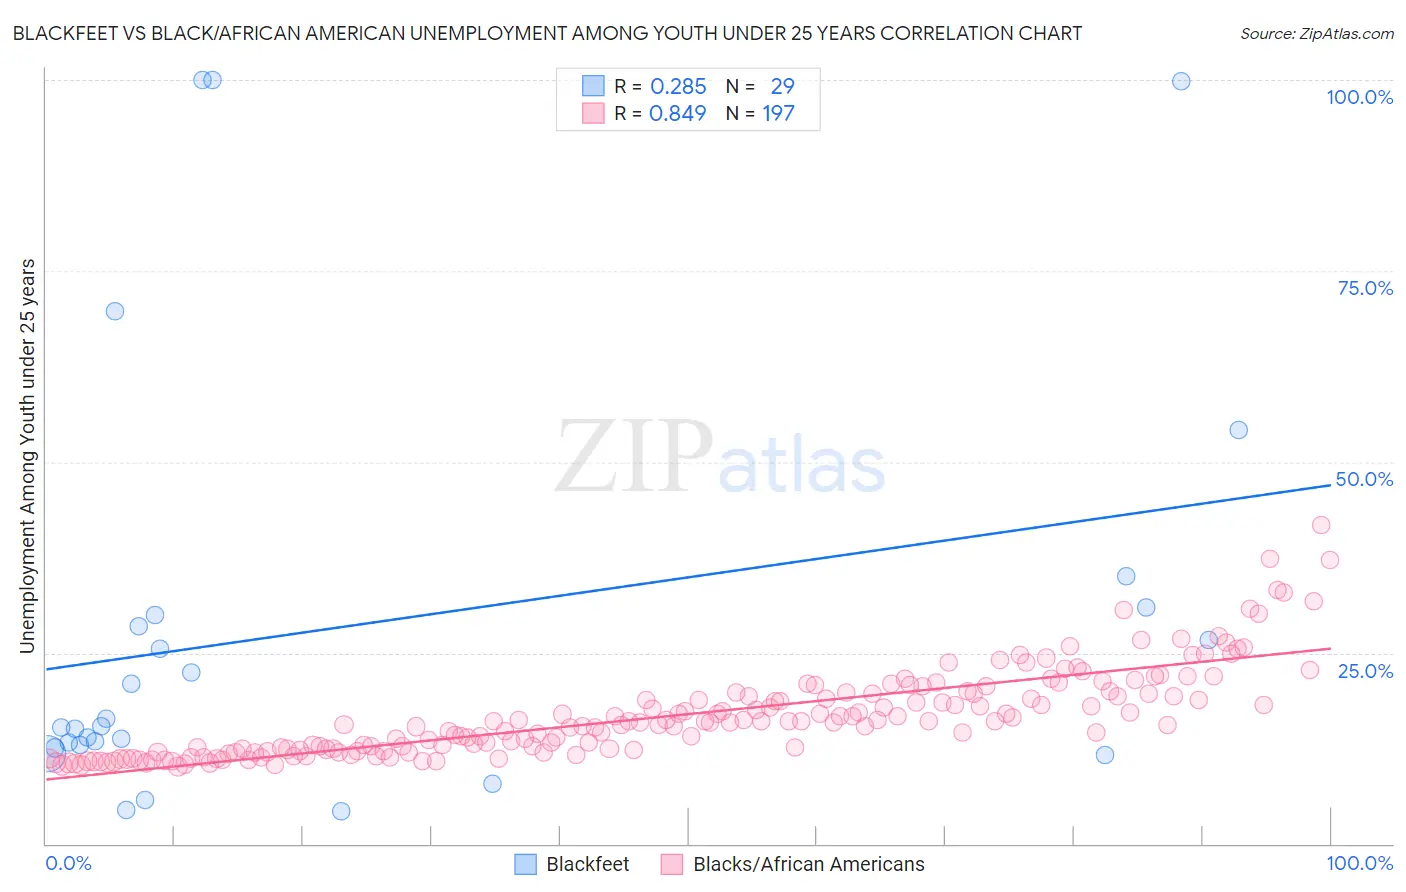
Blackfeet vs Black/African American Unemployment Among Youth under 25 years Correlation Chart
The statistical analysis conducted on geographies consisting of 306,373,464 people shows a weak positive correlation between the proportion of Blackfeet and unemployment rate among youth under the age of 25 in the United States with a correlation coefficient (R) of 0.285 and weighted average of 13.3%. Similarly, the statistical analysis conducted on geographies consisting of 545,283,249 people shows a very strong positive correlation between the proportion of Blacks/African Americans and unemployment rate among youth under the age of 25 in the United States with a correlation coefficient (R) of 0.849 and weighted average of 14.5%, a difference of 8.8%.
Unemployment Among Youth under 25 years Correlation Summary
| Measurement | Blackfeet | Black/African American |
| Minimum | 4.2% | 10.1% |
| Maximum | 100.0% | 41.8% |
| Range | 95.8% | 31.7% |
| Mean | 28.6% | 16.9% |
| Median | 15.4% | 15.9% |
| Interquartile 25% (IQ1) | 12.8% | 12.2% |
| Interquartile 75% (IQ3) | 30.4% | 19.6% |
| Interquartile Range (IQR) | 17.7% | 7.4% |
| Standard Deviation (Sample) | 28.4% | 5.8% |
| Standard Deviation (Population) | 27.9% | 5.8% |
Similar Demographics by Unemployment Among Youth under 25 years
Demographics Similar to Blackfeet by Unemployment Among Youth under 25 years
In terms of unemployment among youth under 25 years, the demographic groups most similar to Blackfeet are Ecuadorian (13.3%, a difference of 0.010%), Ghanaian (13.3%, a difference of 0.050%), Lumbee (13.3%, a difference of 0.14%), Immigrants from Cameroon (13.3%, a difference of 0.15%), and Sierra Leonean (13.3%, a difference of 0.17%).
| Demographics | Rating | Rank | Unemployment Among Youth under 25 years |
| Cajuns | 0.0 /100 | #279 | Tragic 13.2% |
| Ute | 0.0 /100 | #280 | Tragic 13.3% |
| Armenians | 0.0 /100 | #281 | Tragic 13.3% |
| Sierra Leoneans | 0.0 /100 | #282 | Tragic 13.3% |
| Immigrants | Cameroon | 0.0 /100 | #283 | Tragic 13.3% |
| Lumbee | 0.0 /100 | #284 | Tragic 13.3% |
| Ghanaians | 0.0 /100 | #285 | Tragic 13.3% |
| Blackfeet | 0.0 /100 | #286 | Tragic 13.3% |
| Ecuadorians | 0.0 /100 | #287 | Tragic 13.3% |
| Immigrants | Western Africa | 0.0 /100 | #288 | Tragic 13.4% |
| Immigrants | Ghana | 0.0 /100 | #289 | Tragic 13.4% |
| Immigrants | Ecuador | 0.0 /100 | #290 | Tragic 13.4% |
| Apache | 0.0 /100 | #291 | Tragic 13.5% |
| Central American Indians | 0.0 /100 | #292 | Tragic 13.5% |
| Spanish American Indians | 0.0 /100 | #293 | Tragic 13.5% |
Demographics Similar to Blacks/African Americans by Unemployment Among Youth under 25 years
In terms of unemployment among youth under 25 years, the demographic groups most similar to Blacks/African Americans are Native/Alaskan (14.5%, a difference of 0.090%), Sioux (14.4%, a difference of 0.51%), Jamaican (14.4%, a difference of 0.63%), Immigrants from Armenia (14.4%, a difference of 0.71%), and Immigrants from Dominica (14.6%, a difference of 0.72%).
| Demographics | Rating | Rank | Unemployment Among Youth under 25 years |
| Immigrants | West Indies | 0.0 /100 | #310 | Tragic 14.2% |
| Immigrants | Bangladesh | 0.0 /100 | #311 | Tragic 14.2% |
| Vietnamese | 0.0 /100 | #312 | Tragic 14.3% |
| Immigrants | Armenia | 0.0 /100 | #313 | Tragic 14.4% |
| Jamaicans | 0.0 /100 | #314 | Tragic 14.4% |
| Sioux | 0.0 /100 | #315 | Tragic 14.4% |
| Natives/Alaskans | 0.0 /100 | #316 | Tragic 14.5% |
| Blacks/African Americans | 0.0 /100 | #317 | Tragic 14.5% |
| Immigrants | Dominica | 0.0 /100 | #318 | Tragic 14.6% |
| West Indians | 0.0 /100 | #319 | Tragic 14.6% |
| Barbadians | 0.0 /100 | #320 | Tragic 14.6% |
| Cheyenne | 0.0 /100 | #321 | Tragic 14.6% |
| Trinidadians and Tobagonians | 0.0 /100 | #322 | Tragic 14.6% |
| Immigrants | Trinidad and Tobago | 0.0 /100 | #323 | Tragic 14.6% |
| Immigrants | Jamaica | 0.0 /100 | #324 | Tragic 14.8% |