Brazilian vs Immigrants from Uganda Unemployment Among Women with Children Under 18 years

COMPARE

Brazilian
Race
Ancestry
AfghanAfricanAlaska NativeAlaskan AthabascanAlbanianAleutAlsatianAmericanApacheArabArapahoArgentineanArmenianAssyrian/Chaldean/SyriacAustralianAustrianBahamianBangladeshiBarbadianBasqueBelgianBelizeanBermudanBhutaneseBlackfeetBolivianBrazilianBritishBritish West IndianBulgarianBurmeseCajunCambodianCanadianCape VerdeanCarpatho RusynCelticCentral AmericanCentral American IndianCherokeeCheyenneChickasawChileanChineseChippewaChoctawColombianColvilleComancheCosta RicanCreeCreekCroatianCrowCubanCypriotCzechCzechoslovakianDanishDelawareDominicanDutchDutch West IndianEastern EuropeanEcuadorianEgyptianEnglishEstonianEthiopianEuropeanFijianFilipinoFinnishFrenchFrench American IndianFrench CanadianGermanGerman RussianGhanaianGreekGuamanian/ChamorroGuatemalanGuyaneseHaitianHmongHonduranHopiHoumaHungarianIcelanderIndian (Asian)IndonesianInupiatIranianIraqiIrishIroquoisIsraeliItalianJamaicanJapaneseJordanianKenyanKiowaKoreanLaotianLatvianLebaneseLiberianLithuanianLumbeeLuxembourgerMacedonianMalaysianMalteseMarshalleseMenomineeMexicanMexican American IndianMongolianMoroccanNative HawaiianNavajoNepaleseNew ZealanderNicaraguanNigerianNorthern EuropeanNorwegianOkinawanOsageOttawaPaiutePakistaniPalestinianPanamanianParaguayanPennsylvania GermanPeruvianPimaPolishPortuguesePotawatomiPuebloPuerto RicanPuget Sound SalishRomanianRussianSalvadoranSamoanScandinavianScotch-IrishScottishSeminoleSenegaleseSerbianShoshoneSierra LeoneanSiouxSlavicSlovakSloveneSomaliSouth AfricanSouth AmericanSouth American IndianSoviet UnionSpaniardSpanishSpanish AmericanSpanish American IndianSri LankanSubsaharan AfricanSudaneseSwedishSwissSyrianTaiwaneseThaiTlingit-HaidaTohono O'OdhamTonganTrinidadian and TobagonianTsimshianTurkishU.S. Virgin IslanderUgandanUkrainianUruguayanUteVenezuelanVietnameseWelshWest IndianYakamaYaquiYugoslavianYumanYup'ikZimbabwean
Immigration
NonimmigrantsImmigrantsAfghanistanAfricaAlbaniaArgentinaArmeniaAsiaAustraliaAustriaBahamasBangladeshBarbadosBelarusBelgiumBelizeBoliviaBosnia and HerzegovinaBrazilBulgariaBurma/MyanmarCabo VerdeCambodiaCameroonCanadaCaribbeanCentral AmericaChileChinaColombiaCongoCosta RicaCroatiaCubaCzechoslovakiaDenmarkDominicaDominican RepublicEastern AfricaEastern AsiaEastern EuropeEcuadorEgyptEl SalvadorEnglandEritreaEthiopiaEuropeFijiFranceGermanyGhanaGreeceGrenadaGuatemalaGuyanaHaitiHondurasHong KongHungaryIndiaIndonesiaIranIraqIrelandIsraelItalyJamaicaJapanJordanKazakhstanKenyaKoreaKuwaitLaosLatin AmericaLatviaLebanonLiberiaLithuaniaMalaysiaMexicoMicronesiaMiddle AfricaMoldovaMoroccoNepalNetherlandsNicaraguaNigeriaNorth AmericaNorth MacedoniaNorthern AfricaNorthern EuropeNorwayOceaniaPakistanPanamaPeruPhilippinesPolandPortugalRomaniaRussiaSaudi ArabiaScotlandSenegalSerbiaSierra LeoneSingaporeSomaliaSouth AfricaSouth AmericaSouth Central AsiaSouth Eastern AsiaSouthern EuropeSpainSri LankaSt. Vincent and the GrenadinesSudanSwedenSwitzerlandSyriaTaiwanThailandTrinidad and TobagoTurkeyUkraineUruguayUzbekistanVenezuelaVietnamWest IndiesWestern AfricaWestern AsiaWestern EuropeYemenZaireZimbabweAzores
Immigrants from Uganda
Race
Ancestry
AfghanAfricanAlaska NativeAlaskan AthabascanAlbanianAleutAlsatianAmericanApacheArabArapahoArgentineanArmenianAssyrian/Chaldean/SyriacAustralianAustrianBahamianBangladeshiBarbadianBasqueBelgianBelizeanBermudanBhutaneseBlackfeetBolivianBritishBritish West IndianBulgarianBurmeseCajunCambodianCanadianCape VerdeanCarpatho RusynCelticCentral AmericanCentral American IndianCherokeeCheyenneChickasawChileanChineseChippewaChoctawColombianColvilleComancheCosta RicanCreeCreekCroatianCrowCubanCypriotCzechCzechoslovakianDanishDelawareDominicanDutchDutch West IndianEastern EuropeanEcuadorianEgyptianEnglishEstonianEthiopianEuropeanFijianFilipinoFinnishFrenchFrench American IndianFrench CanadianGermanGerman RussianGhanaianGreekGuamanian/ChamorroGuatemalanGuyaneseHaitianHmongHonduranHopiHoumaHungarianIcelanderIndian (Asian)IndonesianInupiatIranianIraqiIrishIroquoisIsraeliItalianJamaicanJapaneseJordanianKenyanKiowaKoreanLaotianLatvianLebaneseLiberianLithuanianLumbeeLuxembourgerMacedonianMalaysianMalteseMarshalleseMenomineeMexicanMexican American IndianMongolianMoroccanNative HawaiianNavajoNepaleseNew ZealanderNicaraguanNigerianNorthern EuropeanNorwegianOkinawanOsageOttawaPaiutePakistaniPalestinianPanamanianParaguayanPennsylvania GermanPeruvianPimaPolishPortuguesePotawatomiPuebloPuerto RicanPuget Sound SalishRomanianRussianSalvadoranSamoanScandinavianScotch-IrishScottishSeminoleSenegaleseSerbianShoshoneSierra LeoneanSiouxSlavicSlovakSloveneSomaliSouth AfricanSouth AmericanSouth American IndianSoviet UnionSpaniardSpanishSpanish AmericanSpanish American IndianSri LankanSubsaharan AfricanSudaneseSwedishSwissSyrianTaiwaneseThaiTlingit-HaidaTohono O'OdhamTonganTrinidadian and TobagonianTsimshianTurkishU.S. Virgin IslanderUgandanUkrainianUruguayanUteVenezuelanVietnameseWelshWest IndianYakamaYaquiYugoslavianYumanYup'ikZimbabwean
Immigration
NonimmigrantsImmigrantsAfghanistanAfricaAlbaniaArgentinaArmeniaAsiaAustraliaAustriaBahamasBangladeshBarbadosBelarusBelgiumBelizeBoliviaBosnia and HerzegovinaBrazilBulgariaBurma/MyanmarCabo VerdeCambodiaCameroonCanadaCaribbeanCentral AmericaChileChinaColombiaCongoCosta RicaCroatiaCubaCzechoslovakiaDenmarkDominicaDominican RepublicEastern AfricaEastern AsiaEastern EuropeEcuadorEgyptEl SalvadorEnglandEritreaEthiopiaEuropeFijiFranceGermanyGhanaGreeceGrenadaGuatemalaGuyanaHaitiHondurasHong KongHungaryIndiaIndonesiaIranIraqIrelandIsraelItalyJamaicaJapanJordanKazakhstanKenyaKoreaKuwaitLaosLatin AmericaLatviaLebanonLiberiaLithuaniaMalaysiaMexicoMicronesiaMiddle AfricaMoldovaMoroccoNepalNetherlandsNicaraguaNigeriaNorth AmericaNorth MacedoniaNorthern AfricaNorthern EuropeNorwayOceaniaPakistanPanamaPeruPhilippinesPolandPortugalRomaniaRussiaSaudi ArabiaScotlandSenegalSerbiaSierra LeoneSingaporeSomaliaSouth AfricaSouth AmericaSouth Central AsiaSouth Eastern AsiaSouthern EuropeSpainSri LankaSt. Vincent and the GrenadinesSudanSwedenSwitzerlandSyriaTaiwanThailandTrinidad and TobagoTurkeyUgandaUkraineUruguayUzbekistanVenezuelaVietnamWest IndiesWestern AfricaWestern AsiaWestern EuropeYemenZaireZimbabweAzores
Unemployment Among Women with Children Under 18 years
Income
Poverty
Unemployment
Labor Participation
Family Structure
Vehicle Availability
Education Level
Disability

Unemployment Among Women with Children Under 18 years Comparison

Brazilians

Immigrants from Uganda

Tragic
Tragic
5.8%
UNEMPLOYMENT AMONG WOMEN WITH CHILDREN UNDER 18 YEARS
1.6/ 100
METRIC RATING
241st/ 347
METRIC RANK
5.7%
UNEMPLOYMENT AMONG WOMEN WITH CHILDREN UNDER 18 YEARS
7.9/ 100
METRIC RATING
215th/ 347
METRIC RANK

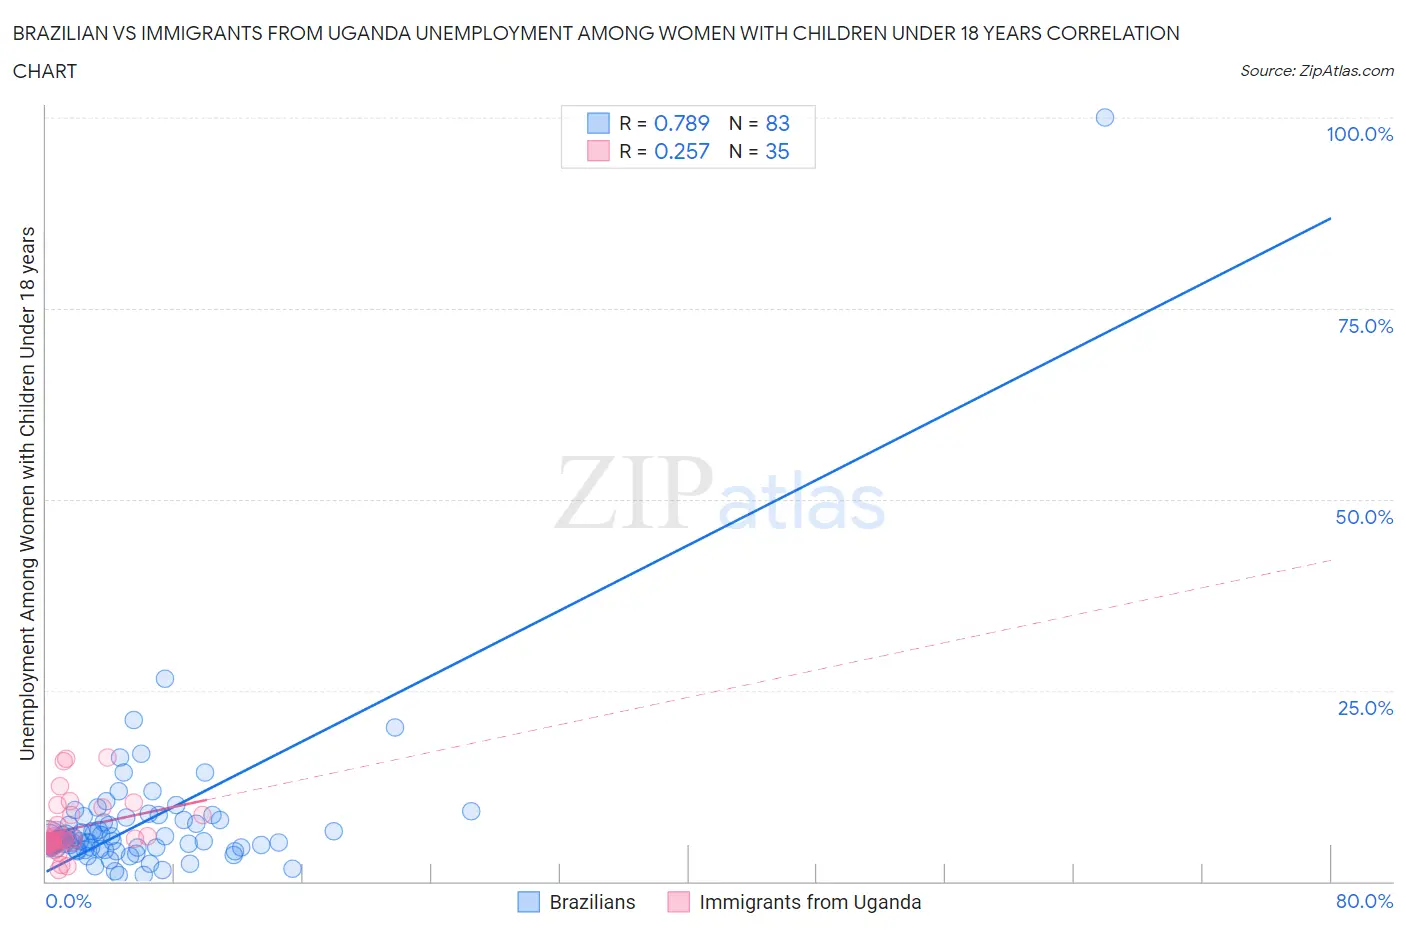
Brazilian vs Immigrants from Uganda Unemployment Among Women with Children Under 18 years Correlation Chart

The statistical analysis conducted on geographies consisting of 314,480,412 people shows a strong positive correlation between the proportion of Brazilians and unemployment rate among women with children under the age of 18 in the United States with a correlation coefficient (R) of 0.789 and weighted average of 5.8%. Similarly, the statistical analysis conducted on geographies consisting of 124,770,037 people shows a weak positive correlation between the proportion of Immigrants from Uganda and unemployment rate among women with children under the age of 18 in the United States with a correlation coefficient (R) of 0.257 and weighted average of 5.7%, a difference of 2.9%.
Brazilian vs Immigrants from Uganda Unemployment Among Women with Children Under 18 years

Unemployment Among Women with Children Under 18 years Correlation Summary

MeasurementBrazilianImmigrants from Uganda
Minimum0.80%1.6%
Maximum100.0%16.2%
Range99.2%14.6%
Mean7.8%6.9%
Median5.5%5.5%
Interquartile 25% (IQ1)4.4%5.1%
Interquartile 75% (IQ3)8.0%8.7%
Interquartile Range (IQR)3.6%3.6%
Standard Deviation (Sample)11.2%3.7%
Standard Deviation (Population)11.1%3.7%

Similar Demographics by Unemployment Among Women with Children Under 18 years

Demographics Similar to Brazilians by Unemployment Among Women with Children Under 18 years

In terms of unemployment among women with children under 18 years, the demographic groups most similar to Brazilians are Moroccan (5.9%, a difference of 0.22%), Immigrants (5.8%, a difference of 0.46%), Immigrants from Sierra Leone (5.8%, a difference of 0.47%), Immigrants from Uruguay (5.9%, a difference of 0.51%), and Immigrants from Somalia (5.8%, a difference of 0.55%).
DemographicsRating | RankUnemployment Among Women with Children Under 18 years
Guamanians/Chamorros
2.9
/100
|
#234
Tragic
5.8%
Immigrants | Middle Africa
2.8
/100
|
#235
Tragic
5.8%
Alsatians
2.5
/100
|
#236
Tragic
5.8%
Immigrants | Lebanon
2.4
/100
|
#237
Tragic
5.8%
Immigrants | Somalia
2.2
/100
|
#238
Tragic
5.8%
Immigrants | Sierra Leone
2.0
/100
|
#239
Tragic
5.8%
Immigrants | Immigrants
2.0
/100
|
#240
Tragic
5.8%
Brazilians
1.6
/100
|
#241
Tragic
5.8%
Moroccans
1.4
/100
|
#242
Tragic
5.9%
Immigrants | Uruguay
1.1
/100
|
#243
Tragic
5.9%
Choctaw
1.1
/100
|
#244
Tragic
5.9%
Ugandans
1.1
/100
|
#245
Tragic
5.9%
Uruguayans
1.0
/100
|
#246
Tragic
5.9%
Cape Verdeans
1.0
/100
|
#247
Tragic
5.9%
Delaware
0.8
/100
|
#248
Tragic
5.9%

Demographics Similar to Immigrants from Uganda by Unemployment Among Women with Children Under 18 years

In terms of unemployment among women with children under 18 years, the demographic groups most similar to Immigrants from Uganda are Immigrants from Peru (5.7%, a difference of 0.10%), Immigrants from Brazil (5.7%, a difference of 0.19%), Japanese (5.7%, a difference of 0.20%), Immigrants from Nicaragua (5.7%, a difference of 0.22%), and American (5.7%, a difference of 0.23%).
DemographicsRating | RankUnemployment Among Women with Children Under 18 years
Immigrants | Costa Rica
11.6
/100
|
#208
Poor
5.6%
Immigrants | Western Asia
11.3
/100
|
#209
Poor
5.6%
Immigrants | Nonimmigrants
10.6
/100
|
#210
Poor
5.7%
Panamanians
10.1
/100
|
#211
Poor
5.7%
South Americans
10.0
/100
|
#212
Poor
5.7%
Americans
8.9
/100
|
#213
Tragic
5.7%
Japanese
8.7
/100
|
#214
Tragic
5.7%
Immigrants | Uganda
7.9
/100
|
#215
Tragic
5.7%
Immigrants | Peru
7.4
/100
|
#216
Tragic
5.7%
Immigrants | Brazil
7.1
/100
|
#217
Tragic
5.7%
Immigrants | Nicaragua
7.0
/100
|
#218
Tragic
5.7%
Iroquois
6.5
/100
|
#219
Tragic
5.7%
Immigrants | Fiji
6.3
/100
|
#220
Tragic
5.7%
Pennsylvania Germans
5.7
/100
|
#221
Tragic
5.7%
Osage
5.0
/100
|
#222
Tragic
5.7%