Brazilian vs German Russian Unemployment Among Women with Children Under 18 years

COMPARE

Brazilian
Race
Ancestry
AfghanAfricanAlaska NativeAlaskan AthabascanAlbanianAleutAlsatianAmericanApacheArabArapahoArgentineanArmenianAssyrian/Chaldean/SyriacAustralianAustrianBahamianBangladeshiBarbadianBasqueBelgianBelizeanBermudanBhutaneseBlackfeetBolivianBrazilianBritishBritish West IndianBulgarianBurmeseCajunCambodianCanadianCape VerdeanCarpatho RusynCelticCentral AmericanCentral American IndianCherokeeCheyenneChickasawChileanChineseChippewaChoctawColombianColvilleComancheCosta RicanCreeCreekCroatianCrowCubanCypriotCzechCzechoslovakianDanishDelawareDominicanDutchDutch West IndianEastern EuropeanEcuadorianEgyptianEnglishEstonianEthiopianEuropeanFijianFilipinoFinnishFrenchFrench American IndianFrench CanadianGermanGhanaianGreekGuamanian/ChamorroGuatemalanGuyaneseHaitianHmongHonduranHopiHoumaHungarianIcelanderIndian (Asian)IndonesianInupiatIranianIraqiIrishIroquoisIsraeliItalianJamaicanJapaneseJordanianKenyanKiowaKoreanLaotianLatvianLebaneseLiberianLithuanianLumbeeLuxembourgerMacedonianMalaysianMalteseMarshalleseMenomineeMexicanMexican American IndianMongolianMoroccanNative HawaiianNavajoNepaleseNew ZealanderNicaraguanNigerianNorthern EuropeanNorwegianOkinawanOsageOttawaPaiutePakistaniPalestinianPanamanianParaguayanPennsylvania GermanPeruvianPimaPolishPortuguesePotawatomiPuebloPuerto RicanPuget Sound SalishRomanianRussianSalvadoranSamoanScandinavianScotch-IrishScottishSeminoleSenegaleseSerbianShoshoneSierra LeoneanSiouxSlavicSlovakSloveneSomaliSouth AfricanSouth AmericanSouth American IndianSoviet UnionSpaniardSpanishSpanish AmericanSpanish American IndianSri LankanSubsaharan AfricanSudaneseSwedishSwissSyrianTaiwaneseThaiTlingit-HaidaTohono O'OdhamTonganTrinidadian and TobagonianTsimshianTurkishU.S. Virgin IslanderUgandanUkrainianUruguayanUteVenezuelanVietnameseWelshWest IndianYakamaYaquiYugoslavianYumanYup'ikZimbabwean
Immigration
NonimmigrantsImmigrantsAfghanistanAfricaAlbaniaArgentinaArmeniaAsiaAustraliaAustriaBahamasBangladeshBarbadosBelarusBelgiumBelizeBoliviaBosnia and HerzegovinaBrazilBulgariaBurma/MyanmarCabo VerdeCambodiaCameroonCanadaCaribbeanCentral AmericaChileChinaColombiaCongoCosta RicaCroatiaCubaCzechoslovakiaDenmarkDominicaDominican RepublicEastern AfricaEastern AsiaEastern EuropeEcuadorEgyptEl SalvadorEnglandEritreaEthiopiaEuropeFijiFranceGermanyGhanaGreeceGrenadaGuatemalaGuyanaHaitiHondurasHong KongHungaryIndiaIndonesiaIranIraqIrelandIsraelItalyJamaicaJapanJordanKazakhstanKenyaKoreaKuwaitLaosLatin AmericaLatviaLebanonLiberiaLithuaniaMalaysiaMexicoMicronesiaMiddle AfricaMoldovaMoroccoNepalNetherlandsNicaraguaNigeriaNorth AmericaNorth MacedoniaNorthern AfricaNorthern EuropeNorwayOceaniaPakistanPanamaPeruPhilippinesPolandPortugalRomaniaRussiaSaudi ArabiaScotlandSenegalSerbiaSierra LeoneSingaporeSomaliaSouth AfricaSouth AmericaSouth Central AsiaSouth Eastern AsiaSouthern EuropeSpainSri LankaSt. Vincent and the GrenadinesSudanSwedenSwitzerlandSyriaTaiwanThailandTrinidad and TobagoTurkeyUgandaUkraineUruguayUzbekistanVenezuelaVietnamWest IndiesWestern AfricaWestern AsiaWestern EuropeYemenZaireZimbabweAzores
German Russian
Race
Ancestry
AfghanAfricanAlaska NativeAlaskan AthabascanAlbanianAleutAlsatianAmericanApacheArabArapahoArgentineanArmenianAssyrian/Chaldean/SyriacAustralianAustrianBahamianBangladeshiBarbadianBasqueBelgianBelizeanBermudanBhutaneseBlackfeetBolivianBritishBritish West IndianBulgarianBurmeseCajunCambodianCanadianCape VerdeanCarpatho RusynCelticCentral AmericanCentral American IndianCherokeeCheyenneChickasawChileanChineseChippewaChoctawColombianColvilleComancheCosta RicanCreeCreekCroatianCrowCubanCypriotCzechCzechoslovakianDanishDelawareDominicanDutchDutch West IndianEastern EuropeanEcuadorianEgyptianEnglishEstonianEthiopianEuropeanFijianFilipinoFinnishFrenchFrench American IndianFrench CanadianGermanGerman RussianGhanaianGreekGuamanian/ChamorroGuatemalanGuyaneseHaitianHmongHonduranHopiHoumaHungarianIcelanderIndian (Asian)IndonesianInupiatIranianIraqiIrishIroquoisIsraeliItalianJamaicanJapaneseJordanianKenyanKiowaKoreanLaotianLatvianLebaneseLiberianLithuanianLumbeeLuxembourgerMacedonianMalaysianMalteseMarshalleseMenomineeMexicanMexican American IndianMongolianMoroccanNative HawaiianNavajoNepaleseNew ZealanderNicaraguanNigerianNorthern EuropeanNorwegianOkinawanOsageOttawaPaiutePakistaniPalestinianPanamanianParaguayanPennsylvania GermanPeruvianPimaPolishPortuguesePotawatomiPuebloPuerto RicanPuget Sound SalishRomanianRussianSalvadoranSamoanScandinavianScotch-IrishScottishSeminoleSenegaleseSerbianShoshoneSierra LeoneanSiouxSlavicSlovakSloveneSomaliSouth AfricanSouth AmericanSouth American IndianSoviet UnionSpaniardSpanishSpanish AmericanSpanish American IndianSri LankanSubsaharan AfricanSudaneseSwedishSwissSyrianTaiwaneseThaiTlingit-HaidaTohono O'OdhamTonganTrinidadian and TobagonianTsimshianTurkishU.S. Virgin IslanderUgandanUkrainianUruguayanUteVenezuelanVietnameseWelshWest IndianYakamaYaquiYugoslavianYumanYup'ikZimbabwean
Immigration
NonimmigrantsImmigrantsAfghanistanAfricaAlbaniaArgentinaArmeniaAsiaAustraliaAustriaBahamasBangladeshBarbadosBelarusBelgiumBelizeBoliviaBosnia and HerzegovinaBrazilBulgariaBurma/MyanmarCabo VerdeCambodiaCameroonCanadaCaribbeanCentral AmericaChileChinaColombiaCongoCosta RicaCroatiaCubaCzechoslovakiaDenmarkDominicaDominican RepublicEastern AfricaEastern AsiaEastern EuropeEcuadorEgyptEl SalvadorEnglandEritreaEthiopiaEuropeFijiFranceGermanyGhanaGreeceGrenadaGuatemalaGuyanaHaitiHondurasHong KongHungaryIndiaIndonesiaIranIraqIrelandIsraelItalyJamaicaJapanJordanKazakhstanKenyaKoreaKuwaitLaosLatin AmericaLatviaLebanonLiberiaLithuaniaMalaysiaMexicoMicronesiaMiddle AfricaMoldovaMoroccoNepalNetherlandsNicaraguaNigeriaNorth AmericaNorth MacedoniaNorthern AfricaNorthern EuropeNorwayOceaniaPakistanPanamaPeruPhilippinesPolandPortugalRomaniaRussiaSaudi ArabiaScotlandSenegalSerbiaSierra LeoneSingaporeSomaliaSouth AfricaSouth AmericaSouth Central AsiaSouth Eastern AsiaSouthern EuropeSpainSri LankaSt. Vincent and the GrenadinesSudanSwedenSwitzerlandSyriaTaiwanThailandTrinidad and TobagoTurkeyUgandaUkraineUruguayUzbekistanVenezuelaVietnamWest IndiesWestern AfricaWestern AsiaWestern EuropeYemenZaireZimbabweAzores
Unemployment Among Women with Children Under 18 years
Income
Poverty
Unemployment
Labor Participation
Family Structure
Vehicle Availability
Education Level
Disability

Unemployment Among Women with Children Under 18 years Comparison

Brazilians

German Russians

Tragic
Good
5.8%
UNEMPLOYMENT AMONG WOMEN WITH CHILDREN UNDER 18 YEARS
1.6/ 100
METRIC RATING
241st/ 347
METRIC RANK
5.4%
UNEMPLOYMENT AMONG WOMEN WITH CHILDREN UNDER 18 YEARS
70.2/ 100
METRIC RATING
157th/ 347
METRIC RANK

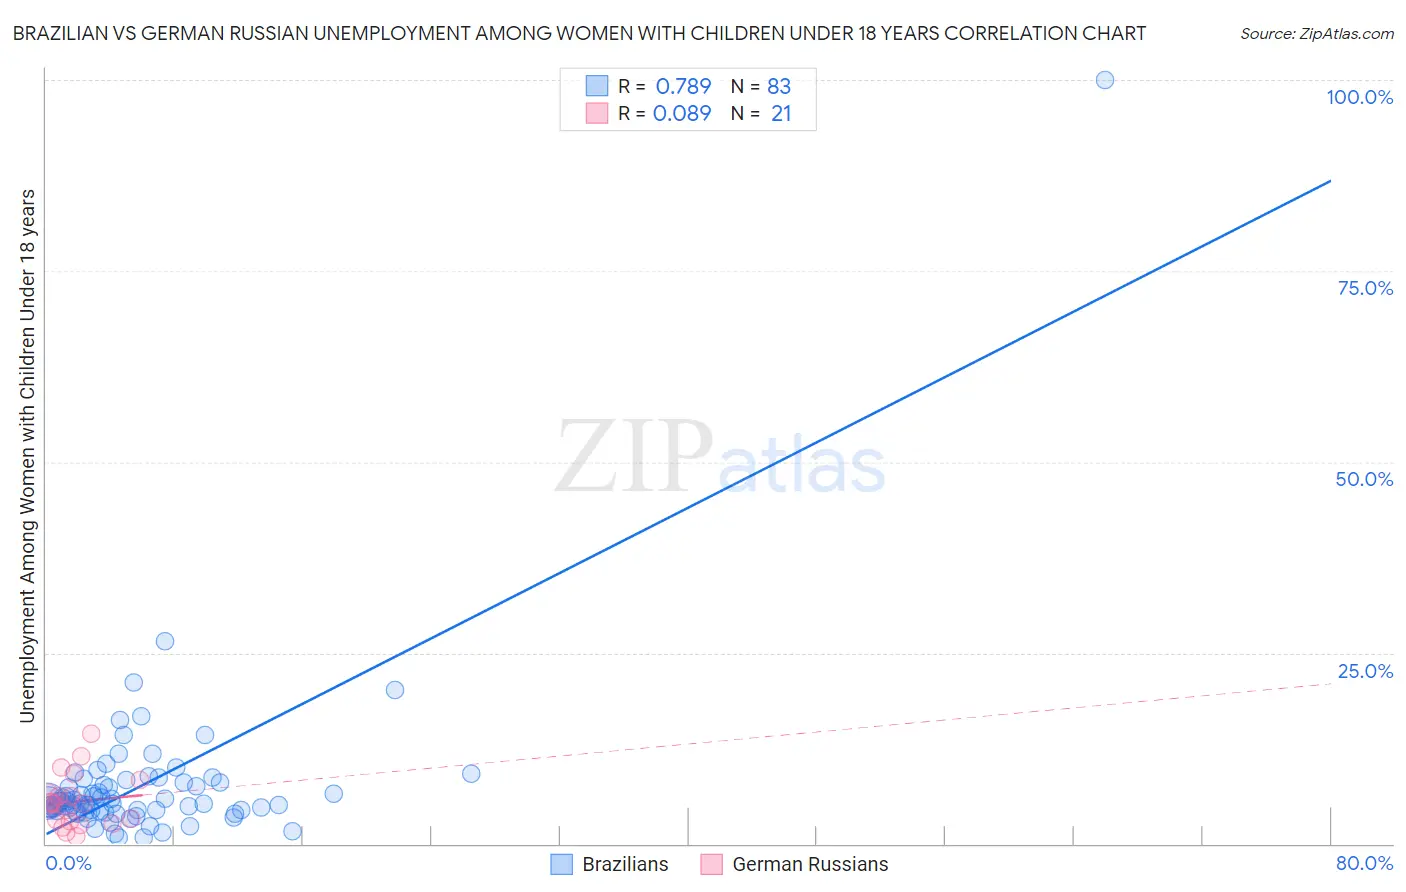
Brazilian vs German Russian Unemployment Among Women with Children Under 18 years Correlation Chart

The statistical analysis conducted on geographies consisting of 314,480,412 people shows a strong positive correlation between the proportion of Brazilians and unemployment rate among women with children under the age of 18 in the United States with a correlation coefficient (R) of 0.789 and weighted average of 5.8%. Similarly, the statistical analysis conducted on geographies consisting of 94,995,777 people shows a slight positive correlation between the proportion of German Russians and unemployment rate among women with children under the age of 18 in the United States with a correlation coefficient (R) of 0.089 and weighted average of 5.4%, a difference of 9.0%.
Brazilian vs German Russian Unemployment Among Women with Children Under 18 years

Unemployment Among Women with Children Under 18 years Correlation Summary

MeasurementBrazilianGerman Russian
Minimum0.80%0.98%
Maximum100.0%14.5%
Range99.2%13.5%
Mean7.8%5.5%
Median5.5%5.3%
Interquartile 25% (IQ1)4.4%2.8%
Interquartile 75% (IQ3)8.0%7.3%
Interquartile Range (IQR)3.6%4.5%
Standard Deviation (Sample)11.2%3.5%
Standard Deviation (Population)11.1%3.4%

Similar Demographics by Unemployment Among Women with Children Under 18 years

Demographics Similar to Brazilians by Unemployment Among Women with Children Under 18 years

In terms of unemployment among women with children under 18 years, the demographic groups most similar to Brazilians are Moroccan (5.9%, a difference of 0.22%), Immigrants (5.8%, a difference of 0.46%), Immigrants from Sierra Leone (5.8%, a difference of 0.47%), Immigrants from Uruguay (5.9%, a difference of 0.51%), and Immigrants from Somalia (5.8%, a difference of 0.55%).
DemographicsRating | RankUnemployment Among Women with Children Under 18 years
Guamanians/Chamorros
2.9
/100
|
#234
Tragic
5.8%
Immigrants | Middle Africa
2.8
/100
|
#235
Tragic
5.8%
Alsatians
2.5
/100
|
#236
Tragic
5.8%
Immigrants | Lebanon
2.4
/100
|
#237
Tragic
5.8%
Immigrants | Somalia
2.2
/100
|
#238
Tragic
5.8%
Immigrants | Sierra Leone
2.0
/100
|
#239
Tragic
5.8%
Immigrants | Immigrants
2.0
/100
|
#240
Tragic
5.8%
Brazilians
1.6
/100
|
#241
Tragic
5.8%
Moroccans
1.4
/100
|
#242
Tragic
5.9%
Immigrants | Uruguay
1.1
/100
|
#243
Tragic
5.9%
Choctaw
1.1
/100
|
#244
Tragic
5.9%
Ugandans
1.1
/100
|
#245
Tragic
5.9%
Uruguayans
1.0
/100
|
#246
Tragic
5.9%
Cape Verdeans
1.0
/100
|
#247
Tragic
5.9%
Delaware
0.8
/100
|
#248
Tragic
5.9%

Demographics Similar to German Russians by Unemployment Among Women with Children Under 18 years

In terms of unemployment among women with children under 18 years, the demographic groups most similar to German Russians are South African (5.4%, a difference of 0.010%), Korean (5.4%, a difference of 0.030%), Carpatho Rusyn (5.4%, a difference of 0.050%), Immigrants from Latvia (5.4%, a difference of 0.050%), and Immigrants from Burma/Myanmar (5.4%, a difference of 0.060%).
DemographicsRating | RankUnemployment Among Women with Children Under 18 years
Immigrants | Argentina
71.7
/100
|
#150
Good
5.4%
Immigrants | Iran
71.1
/100
|
#151
Good
5.4%
Immigrants | South Eastern Asia
71.1
/100
|
#152
Good
5.4%
Carpatho Rusyns
70.8
/100
|
#153
Good
5.4%
Immigrants | Latvia
70.8
/100
|
#154
Good
5.4%
Koreans
70.5
/100
|
#155
Good
5.4%
South Africans
70.3
/100
|
#156
Good
5.4%
German Russians
70.2
/100
|
#157
Good
5.4%
Immigrants | Burma/Myanmar
69.5
/100
|
#158
Good
5.4%
Chickasaw
68.4
/100
|
#159
Good
5.4%
Afghans
66.6
/100
|
#160
Good
5.4%
Immigrants | Iraq
65.9
/100
|
#161
Good
5.4%
Immigrants | Saudi Arabia
65.0
/100
|
#162
Good
5.4%
Lebanese
64.7
/100
|
#163
Good
5.4%
Celtics
63.0
/100
|
#164
Good
5.4%