Bolivian vs Immigrants from Latvia Male Unemployment
COMPARE
Bolivian
Immigrants from Latvia
Male Unemployment
Male Unemployment Comparison
Bolivians
Immigrants from Latvia
4.7%
MALE UNEMPLOYMENT
100.0/ 100
METRIC RATING
13th/ 347
METRIC RANK
5.1%
MALE UNEMPLOYMENT
87.5/ 100
METRIC RATING
124th/ 347
METRIC RANK
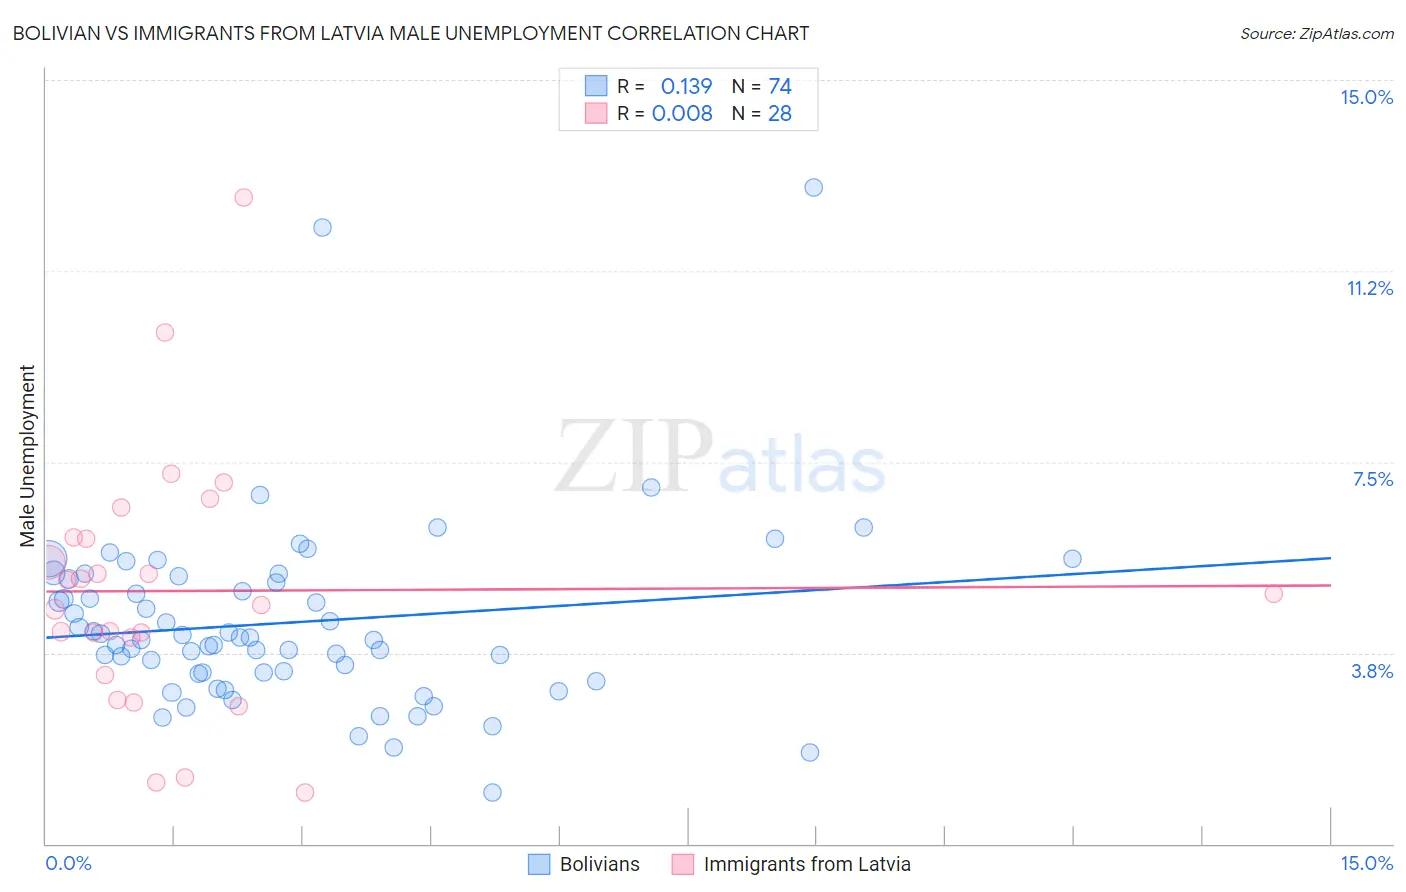
Bolivian vs Immigrants from Latvia Male Unemployment Correlation Chart
The statistical analysis conducted on geographies consisting of 184,402,671 people shows a poor positive correlation between the proportion of Bolivians and unemployment rate among males in the United States with a correlation coefficient (R) of 0.139 and weighted average of 4.7%. Similarly, the statistical analysis conducted on geographies consisting of 113,659,649 people shows no correlation between the proportion of Immigrants from Latvia and unemployment rate among males in the United States with a correlation coefficient (R) of 0.008 and weighted average of 5.1%, a difference of 9.6%.
Male Unemployment Correlation Summary
| Measurement | Bolivian | Immigrants from Latvia |
| Minimum | 1.0% | 1.0% |
| Maximum | 12.9% | 12.7% |
| Range | 11.9% | 11.7% |
| Mean | 4.3% | 5.0% |
| Median | 4.0% | 4.8% |
| Interquartile 25% (IQ1) | 3.4% | 3.7% |
| Interquartile 75% (IQ3) | 5.2% | 6.0% |
| Interquartile Range (IQR) | 1.8% | 2.3% |
| Standard Deviation (Sample) | 1.8% | 2.5% |
| Standard Deviation (Population) | 1.8% | 2.5% |
Similar Demographics by Male Unemployment
Demographics Similar to Bolivians by Male Unemployment
In terms of male unemployment, the demographic groups most similar to Bolivians are German (4.7%, a difference of 0.020%), Scandinavian (4.7%, a difference of 0.29%), Swiss (4.7%, a difference of 0.34%), Immigrants from Bolivia (4.7%, a difference of 0.68%), and Filipino (4.7%, a difference of 1.1%).
| Demographics | Rating | Rank | Male Unemployment |
| Venezuelans | 100.0 /100 | #6 | Exceptional 4.5% |
| Czechs | 100.0 /100 | #7 | Exceptional 4.5% |
| Luxembourgers | 100.0 /100 | #8 | Exceptional 4.5% |
| Thais | 100.0 /100 | #9 | Exceptional 4.6% |
| Cubans | 100.0 /100 | #10 | Exceptional 4.6% |
| Swedes | 100.0 /100 | #11 | Exceptional 4.6% |
| Immigrants | Bolivia | 100.0 /100 | #12 | Exceptional 4.7% |
| Bolivians | 100.0 /100 | #13 | Exceptional 4.7% |
| Germans | 100.0 /100 | #14 | Exceptional 4.7% |
| Scandinavians | 100.0 /100 | #15 | Exceptional 4.7% |
| Swiss | 99.9 /100 | #16 | Exceptional 4.7% |
| Filipinos | 99.9 /100 | #17 | Exceptional 4.7% |
| English | 99.9 /100 | #18 | Exceptional 4.8% |
| Europeans | 99.9 /100 | #19 | Exceptional 4.8% |
| Pennsylvania Germans | 99.9 /100 | #20 | Exceptional 4.8% |
Demographics Similar to Immigrants from Latvia by Male Unemployment
In terms of male unemployment, the demographic groups most similar to Immigrants from Latvia are Palestinian (5.1%, a difference of 0.030%), Immigrants from Lithuania (5.1%, a difference of 0.040%), Nicaraguan (5.1%, a difference of 0.10%), Immigrants from Colombia (5.1%, a difference of 0.10%), and Ukrainian (5.1%, a difference of 0.13%).
| Demographics | Rating | Rank | Male Unemployment |
| Estonians | 89.0 /100 | #117 | Excellent 5.1% |
| Cypriots | 88.8 /100 | #118 | Excellent 5.1% |
| French Canadians | 88.6 /100 | #119 | Excellent 5.1% |
| Ukrainians | 88.4 /100 | #120 | Excellent 5.1% |
| Mongolians | 88.4 /100 | #121 | Excellent 5.1% |
| Nicaraguans | 88.2 /100 | #122 | Excellent 5.1% |
| Palestinians | 87.7 /100 | #123 | Excellent 5.1% |
| Immigrants | Latvia | 87.5 /100 | #124 | Excellent 5.1% |
| Immigrants | Lithuania | 87.2 /100 | #125 | Excellent 5.1% |
| Immigrants | Colombia | 86.8 /100 | #126 | Excellent 5.1% |
| Immigrants | Brazil | 86.3 /100 | #127 | Excellent 5.2% |
| Hungarians | 85.1 /100 | #128 | Excellent 5.2% |
| Immigrants | Western Europe | 84.8 /100 | #129 | Excellent 5.2% |
| Immigrants | Malaysia | 83.5 /100 | #130 | Excellent 5.2% |
| Immigrants | Germany | 83.0 /100 | #131 | Excellent 5.2% |