Bolivian vs Immigrants from Latvia College, 1 year or more
COMPARE
Bolivian
Immigrants from Latvia
College, 1 year or more
College, 1 year or more Comparison
Bolivians
Immigrants from Latvia
63.5%
COLLEGE, 1 YEAR OR MORE
99.5/ 100
METRIC RATING
61st/ 347
METRIC RANK
64.8%
COLLEGE, 1 YEAR OR MORE
99.9/ 100
METRIC RATING
42nd/ 347
METRIC RANK
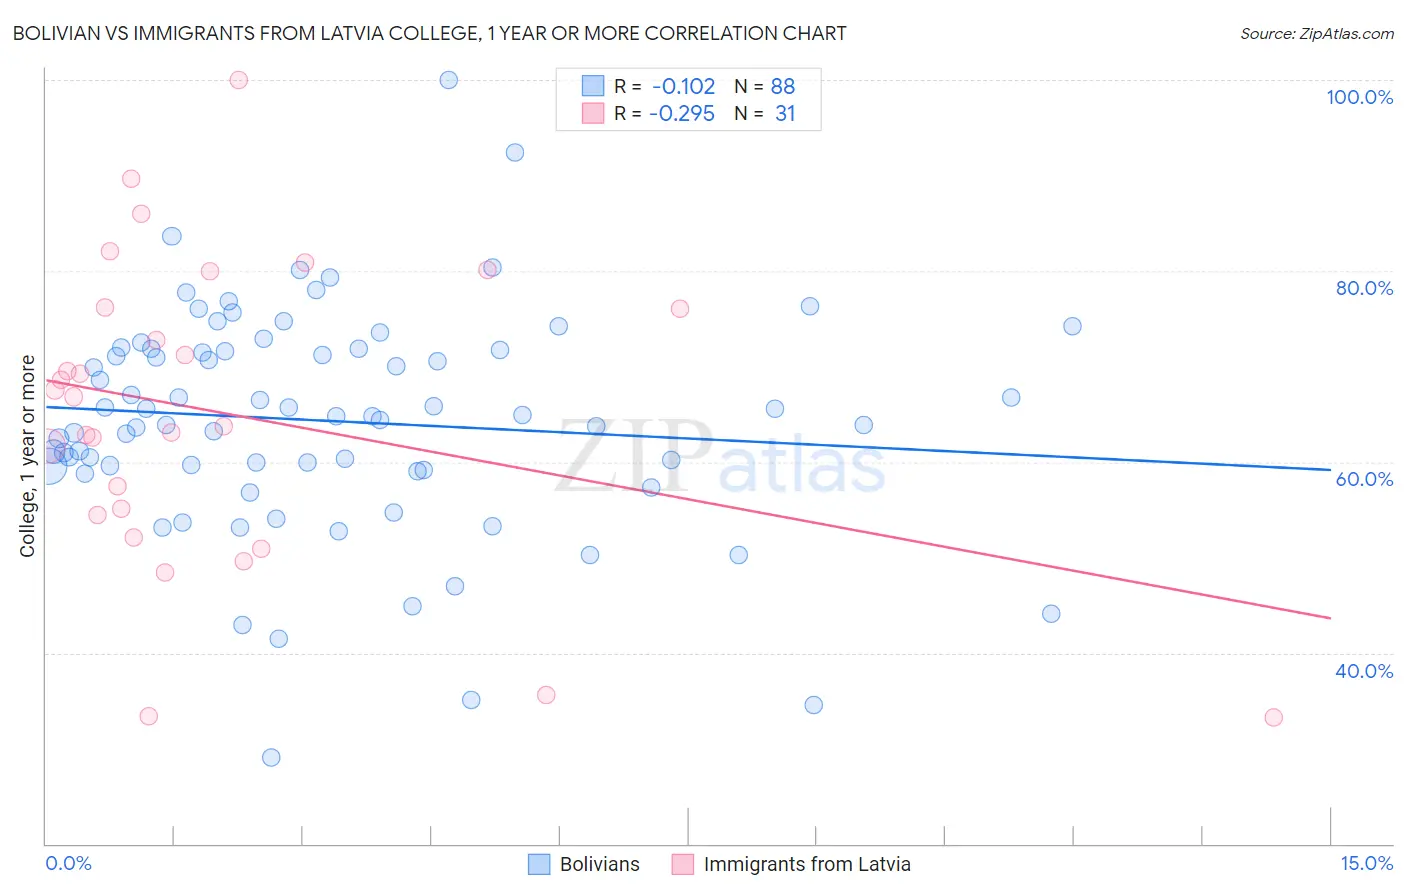
Bolivian vs Immigrants from Latvia College, 1 year or more Correlation Chart
The statistical analysis conducted on geographies consisting of 184,669,815 people shows a poor negative correlation between the proportion of Bolivians and percentage of population with at least college, 1 year or more education in the United States with a correlation coefficient (R) of -0.102 and weighted average of 63.5%. Similarly, the statistical analysis conducted on geographies consisting of 113,735,345 people shows a weak negative correlation between the proportion of Immigrants from Latvia and percentage of population with at least college, 1 year or more education in the United States with a correlation coefficient (R) of -0.295 and weighted average of 64.8%, a difference of 2.0%.
College, 1 year or more Correlation Summary
| Measurement | Bolivian | Immigrants from Latvia |
| Minimum | 29.1% | 33.2% |
| Maximum | 100.0% | 100.0% |
| Range | 70.9% | 66.8% |
| Mean | 64.3% | 65.2% |
| Median | 64.8% | 66.8% |
| Interquartile 25% (IQ1) | 59.4% | 54.4% |
| Interquartile 75% (IQ3) | 71.8% | 76.2% |
| Interquartile Range (IQR) | 12.4% | 21.8% |
| Standard Deviation (Sample) | 11.8% | 16.0% |
| Standard Deviation (Population) | 11.7% | 15.8% |
Demographics Similar to Bolivians and Immigrants from Latvia by College, 1 year or more
In terms of college, 1 year or more, the demographic groups most similar to Bolivians are Immigrants from Kazakhstan (63.6%, a difference of 0.10%), Immigrants from Serbia (63.8%, a difference of 0.38%), Immigrants from Asia (64.0%, a difference of 0.73%), South African (64.1%, a difference of 0.87%), and Immigrants from Czechoslovakia (64.1%, a difference of 0.88%). Similarly, the demographic groups most similar to Immigrants from Latvia are Mongolian (64.8%, a difference of 0.010%), Immigrants from Russia (64.7%, a difference of 0.12%), Immigrants from Norway (64.7%, a difference of 0.14%), Immigrants from Lithuania (64.6%, a difference of 0.31%), and Bhutanese (64.6%, a difference of 0.32%).
| Demographics | Rating | Rank | College, 1 year or more |
| Mongolians | 99.9 /100 | #41 | Exceptional 64.8% |
| Immigrants | Latvia | 99.9 /100 | #42 | Exceptional 64.8% |
| Immigrants | Russia | 99.9 /100 | #43 | Exceptional 64.7% |
| Immigrants | Norway | 99.9 /100 | #44 | Exceptional 64.7% |
| Immigrants | Lithuania | 99.9 /100 | #45 | Exceptional 64.6% |
| Bhutanese | 99.9 /100 | #46 | Exceptional 64.6% |
| Australians | 99.9 /100 | #47 | Exceptional 64.6% |
| Immigrants | Bulgaria | 99.9 /100 | #48 | Exceptional 64.6% |
| New Zealanders | 99.9 /100 | #49 | Exceptional 64.6% |
| Immigrants | Austria | 99.8 /100 | #50 | Exceptional 64.4% |
| Immigrants | Malaysia | 99.8 /100 | #51 | Exceptional 64.3% |
| Immigrants | Netherlands | 99.8 /100 | #52 | Exceptional 64.2% |
| Asians | 99.8 /100 | #53 | Exceptional 64.2% |
| Zimbabweans | 99.8 /100 | #54 | Exceptional 64.2% |
| Immigrants | Belarus | 99.7 /100 | #55 | Exceptional 64.1% |
| Immigrants | Czechoslovakia | 99.7 /100 | #56 | Exceptional 64.1% |
| South Africans | 99.7 /100 | #57 | Exceptional 64.1% |
| Immigrants | Asia | 99.7 /100 | #58 | Exceptional 64.0% |
| Immigrants | Serbia | 99.6 /100 | #59 | Exceptional 63.8% |
| Immigrants | Kazakhstan | 99.5 /100 | #60 | Exceptional 63.6% |
| Bolivians | 99.5 /100 | #61 | Exceptional 63.5% |