Black/African American vs Yuman Unemployment Among Ages 25 to 29 years
COMPARE
Black/African American
Yuman
Unemployment Among Ages 25 to 29 years
Unemployment Among Ages 25 to 29 years Comparison
Blacks/African Americans
Yuman
8.6%
UNEMPLOYMENT AMONG AGES 25 TO 29 YEARS
0.0/ 100
METRIC RATING
320th/ 347
METRIC RANK
11.0%
UNEMPLOYMENT AMONG AGES 25 TO 29 YEARS
0.0/ 100
METRIC RATING
334th/ 347
METRIC RANK
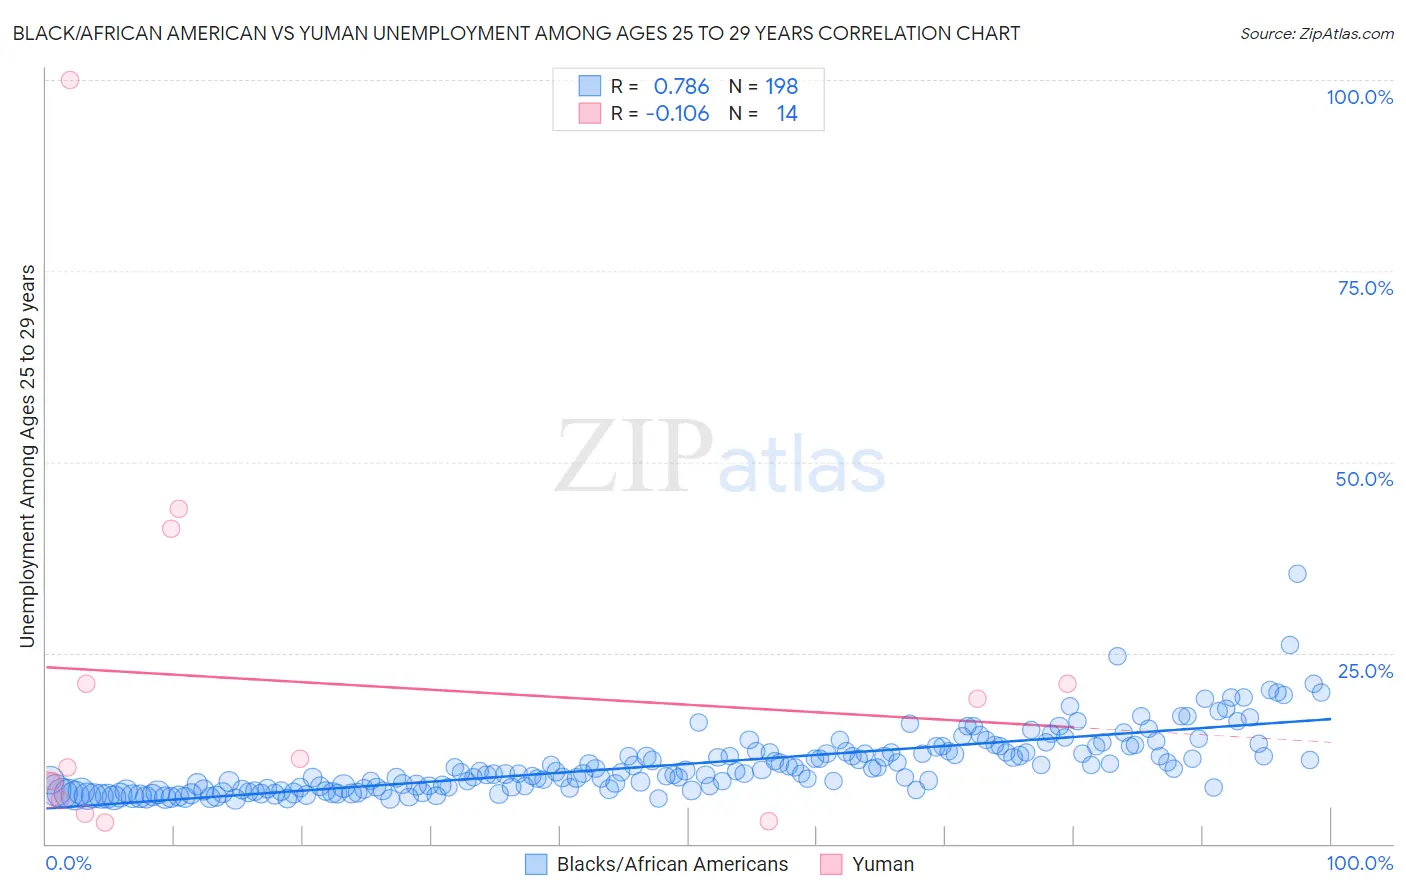
Black/African American vs Yuman Unemployment Among Ages 25 to 29 years Correlation Chart
The statistical analysis conducted on geographies consisting of 507,749,487 people shows a strong positive correlation between the proportion of Blacks/African Americans and unemployment rate among population between the ages 25 and 29 in the United States with a correlation coefficient (R) of 0.786 and weighted average of 8.6%. Similarly, the statistical analysis conducted on geographies consisting of 40,399,570 people shows a poor negative correlation between the proportion of Yuman and unemployment rate among population between the ages 25 and 29 in the United States with a correlation coefficient (R) of -0.106 and weighted average of 11.0%, a difference of 28.5%.
Unemployment Among Ages 25 to 29 years Correlation Summary
| Measurement | Black/African American | Yuman |
| Minimum | 5.8% | 2.8% |
| Maximum | 35.3% | 100.0% |
| Range | 29.5% | 97.2% |
| Mean | 10.4% | 21.3% |
| Median | 9.3% | 10.5% |
| Interquartile 25% (IQ1) | 7.1% | 5.8% |
| Interquartile 75% (IQ3) | 12.0% | 21.0% |
| Interquartile Range (IQR) | 5.0% | 15.2% |
| Standard Deviation (Sample) | 4.3% | 26.2% |
| Standard Deviation (Population) | 4.3% | 25.3% |
Demographics Similar to Blacks/African Americans and Yuman by Unemployment Among Ages 25 to 29 years
In terms of unemployment among ages 25 to 29 years, the demographic groups most similar to Blacks/African Americans are Immigrants from Dominican Republic (8.6%, a difference of 0.61%), Immigrants from Armenia (8.5%, a difference of 0.74%), Guyanese (8.5%, a difference of 0.97%), Immigrants from Guyana (8.5%, a difference of 1.2%), and Tlingit-Haida (8.7%, a difference of 1.4%). Similarly, the demographic groups most similar to Yuman are Puerto Rican (11.1%, a difference of 1.1%), Alaskan Athabascan (10.8%, a difference of 2.0%), Lumbee (11.2%, a difference of 2.2%), Menominee (11.3%, a difference of 2.5%), and Pueblo (10.4%, a difference of 5.4%).
| Demographics | Rating | Rank | Unemployment Among Ages 25 to 29 years |
| Immigrants | Guyana | 0.0 /100 | #317 | Tragic 8.5% |
| Guyanese | 0.0 /100 | #318 | Tragic 8.5% |
| Immigrants | Armenia | 0.0 /100 | #319 | Tragic 8.5% |
| Blacks/African Americans | 0.0 /100 | #320 | Tragic 8.6% |
| Immigrants | Dominican Republic | 0.0 /100 | #321 | Tragic 8.6% |
| Tlingit-Haida | 0.0 /100 | #322 | Tragic 8.7% |
| Dominicans | 0.0 /100 | #323 | Tragic 8.7% |
| Houma | 0.0 /100 | #324 | Tragic 8.7% |
| Yakama | 0.0 /100 | #325 | Tragic 8.8% |
| Shoshone | 0.0 /100 | #326 | Tragic 9.2% |
| Colville | 0.0 /100 | #327 | Tragic 9.2% |
| Apache | 0.0 /100 | #328 | Tragic 9.5% |
| Aleuts | 0.0 /100 | #329 | Tragic 9.7% |
| Natives/Alaskans | 0.0 /100 | #330 | Tragic 9.8% |
| Alaska Natives | 0.0 /100 | #331 | Tragic 10.2% |
| Pueblo | 0.0 /100 | #332 | Tragic 10.4% |
| Alaskan Athabascans | 0.0 /100 | #333 | Tragic 10.8% |
| Yuman | 0.0 /100 | #334 | Tragic 11.0% |
| Puerto Ricans | 0.0 /100 | #335 | Tragic 11.1% |
| Lumbee | 0.0 /100 | #336 | Tragic 11.2% |
| Menominee | 0.0 /100 | #337 | Tragic 11.3% |