Black/African American vs Immigrants from Trinidad and Tobago Unemployment Among Ages 25 to 29 years
COMPARE
Black/African American
Immigrants from Trinidad and Tobago
Unemployment Among Ages 25 to 29 years
Unemployment Among Ages 25 to 29 years Comparison
Blacks/African Americans
Immigrants from Trinidad and Tobago
8.6%
UNEMPLOYMENT AMONG AGES 25 TO 29 YEARS
0.0/ 100
METRIC RATING
320th/ 347
METRIC RANK
7.9%
UNEMPLOYMENT AMONG AGES 25 TO 29 YEARS
0.0/ 100
METRIC RATING
298th/ 347
METRIC RANK
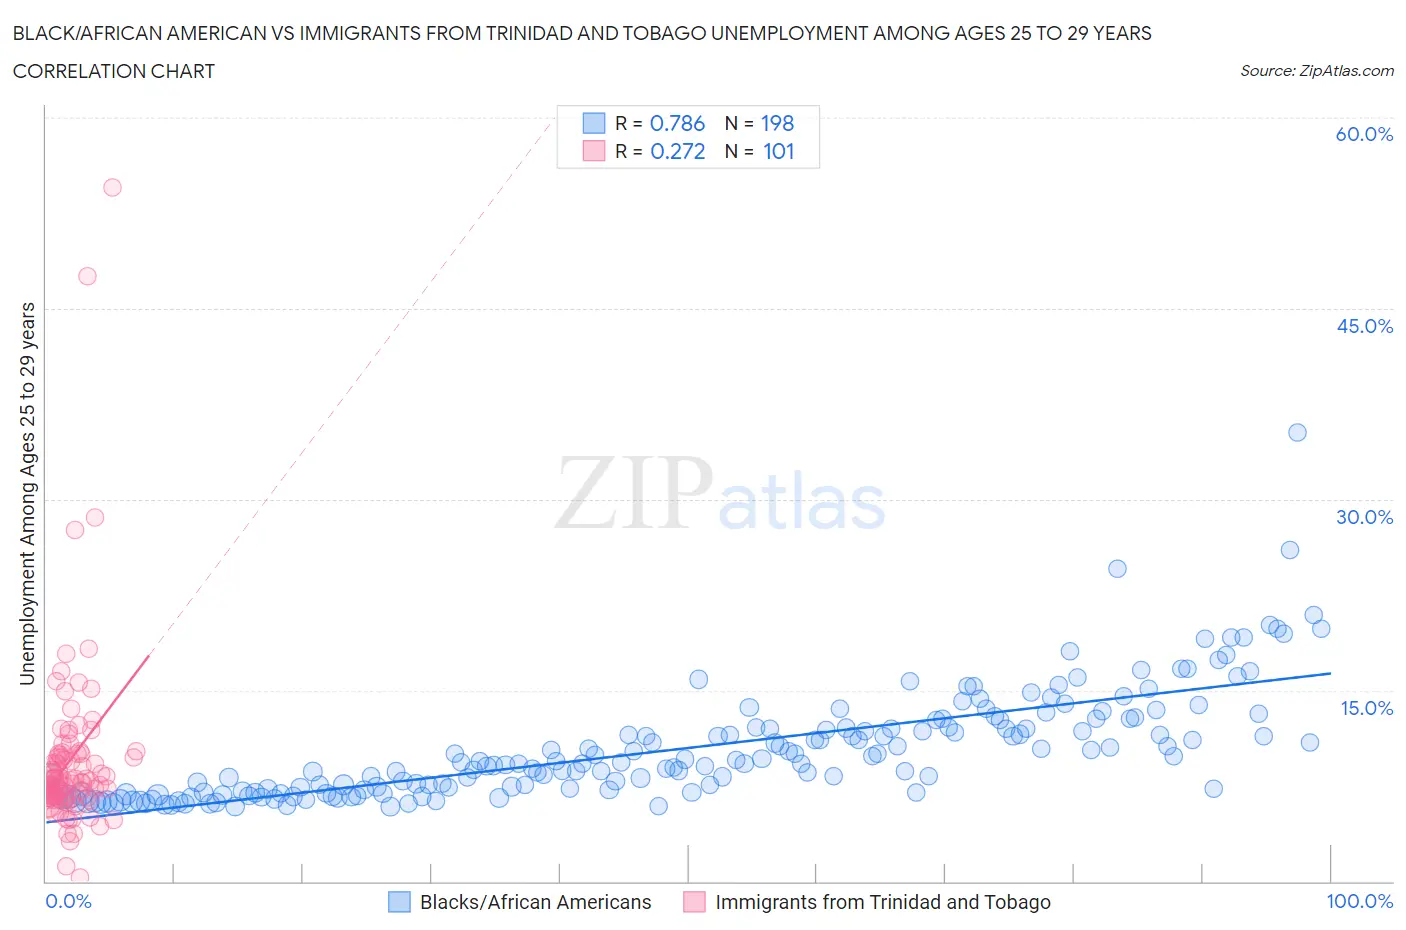
Black/African American vs Immigrants from Trinidad and Tobago Unemployment Among Ages 25 to 29 years Correlation Chart
The statistical analysis conducted on geographies consisting of 507,749,487 people shows a strong positive correlation between the proportion of Blacks/African Americans and unemployment rate among population between the ages 25 and 29 in the United States with a correlation coefficient (R) of 0.786 and weighted average of 8.6%. Similarly, the statistical analysis conducted on geographies consisting of 217,670,248 people shows a weak positive correlation between the proportion of Immigrants from Trinidad and Tobago and unemployment rate among population between the ages 25 and 29 in the United States with a correlation coefficient (R) of 0.272 and weighted average of 7.9%, a difference of 8.5%.
Unemployment Among Ages 25 to 29 years Correlation Summary
| Measurement | Black/African American | Immigrants from Trinidad and Tobago |
| Minimum | 5.8% | 0.30% |
| Maximum | 35.3% | 54.5% |
| Range | 29.5% | 54.2% |
| Mean | 10.4% | 9.6% |
| Median | 9.3% | 7.9% |
| Interquartile 25% (IQ1) | 7.1% | 6.6% |
| Interquartile 75% (IQ3) | 12.0% | 10.0% |
| Interquartile Range (IQR) | 5.0% | 3.4% |
| Standard Deviation (Sample) | 4.3% | 7.3% |
| Standard Deviation (Population) | 4.3% | 7.2% |
Similar Demographics by Unemployment Among Ages 25 to 29 years
Demographics Similar to Blacks/African Americans by Unemployment Among Ages 25 to 29 years
In terms of unemployment among ages 25 to 29 years, the demographic groups most similar to Blacks/African Americans are Immigrants from Dominican Republic (8.6%, a difference of 0.61%), Immigrants from Armenia (8.5%, a difference of 0.74%), Guyanese (8.5%, a difference of 0.97%), Immigrants from Guyana (8.5%, a difference of 1.2%), and Immigrants from Grenada (8.4%, a difference of 1.3%).
| Demographics | Rating | Rank | Unemployment Among Ages 25 to 29 years |
| Immigrants | St. Vincent and the Grenadines | 0.0 /100 | #313 | Tragic 8.4% |
| Immigrants | Dominica | 0.0 /100 | #314 | Tragic 8.4% |
| British West Indians | 0.0 /100 | #315 | Tragic 8.4% |
| Immigrants | Grenada | 0.0 /100 | #316 | Tragic 8.4% |
| Immigrants | Guyana | 0.0 /100 | #317 | Tragic 8.5% |
| Guyanese | 0.0 /100 | #318 | Tragic 8.5% |
| Immigrants | Armenia | 0.0 /100 | #319 | Tragic 8.5% |
| Blacks/African Americans | 0.0 /100 | #320 | Tragic 8.6% |
| Immigrants | Dominican Republic | 0.0 /100 | #321 | Tragic 8.6% |
| Tlingit-Haida | 0.0 /100 | #322 | Tragic 8.7% |
| Dominicans | 0.0 /100 | #323 | Tragic 8.7% |
| Houma | 0.0 /100 | #324 | Tragic 8.7% |
| Yakama | 0.0 /100 | #325 | Tragic 8.8% |
| Shoshone | 0.0 /100 | #326 | Tragic 9.2% |
| Colville | 0.0 /100 | #327 | Tragic 9.2% |
Demographics Similar to Immigrants from Trinidad and Tobago by Unemployment Among Ages 25 to 29 years
In terms of unemployment among ages 25 to 29 years, the demographic groups most similar to Immigrants from Trinidad and Tobago are Barbadian (7.9%, a difference of 0.18%), Central American Indian (7.9%, a difference of 0.19%), West Indian (7.9%, a difference of 0.22%), Blackfeet (7.9%, a difference of 0.26%), and Jamaican (7.9%, a difference of 0.38%).
| Demographics | Rating | Rank | Unemployment Among Ages 25 to 29 years |
| Hispanics or Latinos | 0.0 /100 | #291 | Tragic 7.7% |
| Chippewa | 0.0 /100 | #292 | Tragic 7.8% |
| Immigrants | Belize | 0.0 /100 | #293 | Tragic 7.8% |
| Trinidadians and Tobagonians | 0.0 /100 | #294 | Tragic 7.8% |
| Comanche | 0.0 /100 | #295 | Tragic 7.8% |
| Immigrants | West Indies | 0.0 /100 | #296 | Tragic 7.8% |
| Blackfeet | 0.0 /100 | #297 | Tragic 7.9% |
| Immigrants | Trinidad and Tobago | 0.0 /100 | #298 | Tragic 7.9% |
| Barbadians | 0.0 /100 | #299 | Tragic 7.9% |
| Central American Indians | 0.0 /100 | #300 | Tragic 7.9% |
| West Indians | 0.0 /100 | #301 | Tragic 7.9% |
| Jamaicans | 0.0 /100 | #302 | Tragic 7.9% |
| Immigrants | Yemen | 0.0 /100 | #303 | Tragic 8.0% |
| Cajuns | 0.0 /100 | #304 | Tragic 8.0% |
| Tsimshian | 0.0 /100 | #305 | Tragic 8.0% |