Bhutanese vs Immigrants from Southern Europe Male Unemployment

COMPARE

Bhutanese
Race
Ancestry
AfghanAfricanAlaska NativeAlaskan AthabascanAlbanianAleutAlsatianAmericanApacheArabArapahoArgentineanArmenianAssyrian/Chaldean/SyriacAustralianAustrianBahamianBangladeshiBarbadianBasqueBelgianBelizeanBermudanBhutaneseBlackfeetBolivianBrazilianBritishBritish West IndianBulgarianBurmeseCajunCambodianCanadianCape VerdeanCarpatho RusynCelticCentral AmericanCentral American IndianCherokeeCheyenneChickasawChileanChineseChippewaChoctawColombianColvilleComancheCosta RicanCreeCreekCroatianCrowCubanCypriotCzechCzechoslovakianDanishDelawareDominicanDutchDutch West IndianEastern EuropeanEcuadorianEgyptianEnglishEstonianEthiopianEuropeanFijianFilipinoFinnishFrenchFrench American IndianFrench CanadianGermanGerman RussianGhanaianGreekGuamanian/ChamorroGuatemalanGuyaneseHaitianHmongHonduranHopiHoumaHungarianIcelanderIndian (Asian)IndonesianInupiatIranianIraqiIrishIroquoisIsraeliItalianJamaicanJapaneseJordanianKenyanKiowaKoreanLaotianLatvianLebaneseLiberianLithuanianLumbeeLuxembourgerMacedonianMalaysianMalteseMarshalleseMenomineeMexicanMexican American IndianMongolianMoroccanNative HawaiianNavajoNepaleseNew ZealanderNicaraguanNigerianNorthern EuropeanNorwegianOkinawanOsageOttawaPaiutePakistaniPalestinianPanamanianParaguayanPennsylvania GermanPeruvianPimaPolishPortuguesePotawatomiPuebloPuerto RicanPuget Sound SalishRomanianRussianSalvadoranSamoanScandinavianScotch-IrishScottishSeminoleSenegaleseSerbianShoshoneSierra LeoneanSiouxSlavicSlovakSloveneSomaliSouth AfricanSouth AmericanSouth American IndianSoviet UnionSpaniardSpanishSpanish AmericanSpanish American IndianSri LankanSubsaharan AfricanSudaneseSwedishSwissSyrianTaiwaneseThaiTlingit-HaidaTohono O'OdhamTonganTrinidadian and TobagonianTsimshianTurkishU.S. Virgin IslanderUgandanUkrainianUruguayanUteVenezuelanVietnameseWelshWest IndianYakamaYaquiYugoslavianYumanYup'ikZimbabwean
Immigration
NonimmigrantsImmigrantsAfghanistanAfricaAlbaniaArgentinaArmeniaAsiaAustraliaAustriaBahamasBangladeshBarbadosBelarusBelgiumBelizeBoliviaBosnia and HerzegovinaBrazilBulgariaBurma/MyanmarCabo VerdeCambodiaCameroonCanadaCaribbeanCentral AmericaChileChinaColombiaCongoCosta RicaCroatiaCubaCzechoslovakiaDenmarkDominicaDominican RepublicEastern AfricaEastern AsiaEastern EuropeEcuadorEgyptEl SalvadorEnglandEritreaEthiopiaEuropeFijiFranceGermanyGhanaGreeceGrenadaGuatemalaGuyanaHaitiHondurasHong KongHungaryIndiaIndonesiaIranIraqIrelandIsraelItalyJamaicaJapanJordanKazakhstanKenyaKoreaKuwaitLaosLatin AmericaLatviaLebanonLiberiaLithuaniaMalaysiaMexicoMicronesiaMiddle AfricaMoldovaMoroccoNepalNetherlandsNicaraguaNigeriaNorth AmericaNorth MacedoniaNorthern AfricaNorthern EuropeNorwayOceaniaPakistanPanamaPeruPhilippinesPolandPortugalRomaniaRussiaSaudi ArabiaScotlandSenegalSerbiaSierra LeoneSingaporeSomaliaSouth AfricaSouth AmericaSouth Central AsiaSouth Eastern AsiaSpainSri LankaSt. Vincent and the GrenadinesSudanSwedenSwitzerlandSyriaTaiwanThailandTrinidad and TobagoTurkeyUgandaUkraineUruguayUzbekistanVenezuelaVietnamWest IndiesWestern AfricaWestern AsiaWestern EuropeYemenZaireZimbabweAzores
Immigrants from Southern Europe
Race
Ancestry
AfghanAfricanAlaska NativeAlaskan AthabascanAlbanianAleutAlsatianAmericanApacheArabArapahoArgentineanArmenianAssyrian/Chaldean/SyriacAustralianAustrianBahamianBangladeshiBarbadianBasqueBelgianBelizeanBermudanBlackfeetBolivianBrazilianBritishBritish West IndianBulgarianBurmeseCajunCambodianCanadianCape VerdeanCarpatho RusynCelticCentral AmericanCentral American IndianCherokeeCheyenneChickasawChileanChineseChippewaChoctawColombianColvilleComancheCosta RicanCreeCreekCroatianCrowCubanCypriotCzechCzechoslovakianDanishDelawareDominicanDutchDutch West IndianEastern EuropeanEcuadorianEgyptianEnglishEstonianEthiopianEuropeanFijianFilipinoFinnishFrenchFrench American IndianFrench CanadianGermanGerman RussianGhanaianGreekGuamanian/ChamorroGuatemalanGuyaneseHaitianHmongHonduranHopiHoumaHungarianIcelanderIndian (Asian)IndonesianInupiatIranianIraqiIrishIroquoisIsraeliItalianJamaicanJapaneseJordanianKenyanKiowaKoreanLaotianLatvianLebaneseLiberianLithuanianLumbeeLuxembourgerMacedonianMalaysianMalteseMarshalleseMenomineeMexicanMexican American IndianMongolianMoroccanNative HawaiianNavajoNepaleseNew ZealanderNicaraguanNigerianNorthern EuropeanNorwegianOkinawanOsageOttawaPaiutePakistaniPalestinianPanamanianParaguayanPennsylvania GermanPeruvianPimaPolishPortuguesePotawatomiPuebloPuerto RicanPuget Sound SalishRomanianRussianSalvadoranSamoanScandinavianScotch-IrishScottishSeminoleSenegaleseSerbianShoshoneSierra LeoneanSiouxSlavicSlovakSloveneSomaliSouth AfricanSouth AmericanSouth American IndianSoviet UnionSpaniardSpanishSpanish AmericanSpanish American IndianSri LankanSubsaharan AfricanSudaneseSwedishSwissSyrianTaiwaneseThaiTlingit-HaidaTohono O'OdhamTonganTrinidadian and TobagonianTsimshianTurkishU.S. Virgin IslanderUgandanUkrainianUruguayanUteVenezuelanVietnameseWelshWest IndianYakamaYaquiYugoslavianYumanYup'ikZimbabwean
Immigration
NonimmigrantsImmigrantsAfghanistanAfricaAlbaniaArgentinaArmeniaAsiaAustraliaAustriaBahamasBangladeshBarbadosBelarusBelgiumBelizeBoliviaBosnia and HerzegovinaBrazilBulgariaBurma/MyanmarCabo VerdeCambodiaCameroonCanadaCaribbeanCentral AmericaChileChinaColombiaCongoCosta RicaCroatiaCubaCzechoslovakiaDenmarkDominicaDominican RepublicEastern AfricaEastern AsiaEastern EuropeEcuadorEgyptEl SalvadorEnglandEritreaEthiopiaEuropeFijiFranceGermanyGhanaGreeceGrenadaGuatemalaGuyanaHaitiHondurasHong KongHungaryIndiaIndonesiaIranIraqIrelandIsraelItalyJamaicaJapanJordanKazakhstanKenyaKoreaKuwaitLaosLatin AmericaLatviaLebanonLiberiaLithuaniaMalaysiaMexicoMicronesiaMiddle AfricaMoldovaMoroccoNepalNetherlandsNicaraguaNigeriaNorth AmericaNorth MacedoniaNorthern AfricaNorthern EuropeNorwayOceaniaPakistanPanamaPeruPhilippinesPolandPortugalRomaniaRussiaSaudi ArabiaScotlandSenegalSerbiaSierra LeoneSingaporeSomaliaSouth AfricaSouth AmericaSouth Central AsiaSouth Eastern AsiaSouthern EuropeSpainSri LankaSt. Vincent and the GrenadinesSudanSwedenSwitzerlandSyriaTaiwanThailandTrinidad and TobagoTurkeyUgandaUkraineUruguayUzbekistanVenezuelaVietnamWest IndiesWestern AfricaWestern AsiaWestern EuropeYemenZaireZimbabweAzores
Male Unemployment
Income
Poverty
Unemployment
Labor Participation
Family Structure
Vehicle Availability
Education Level
Disability

Male Unemployment Comparison

Bhutanese

Immigrants from Southern Europe

Exceptional
Poor
4.9%
MALE UNEMPLOYMENT
98.9/ 100
METRIC RATING
46th/ 347
METRIC RANK
5.4%
MALE UNEMPLOYMENT
17.7/ 100
METRIC RATING
195th/ 347
METRIC RANK

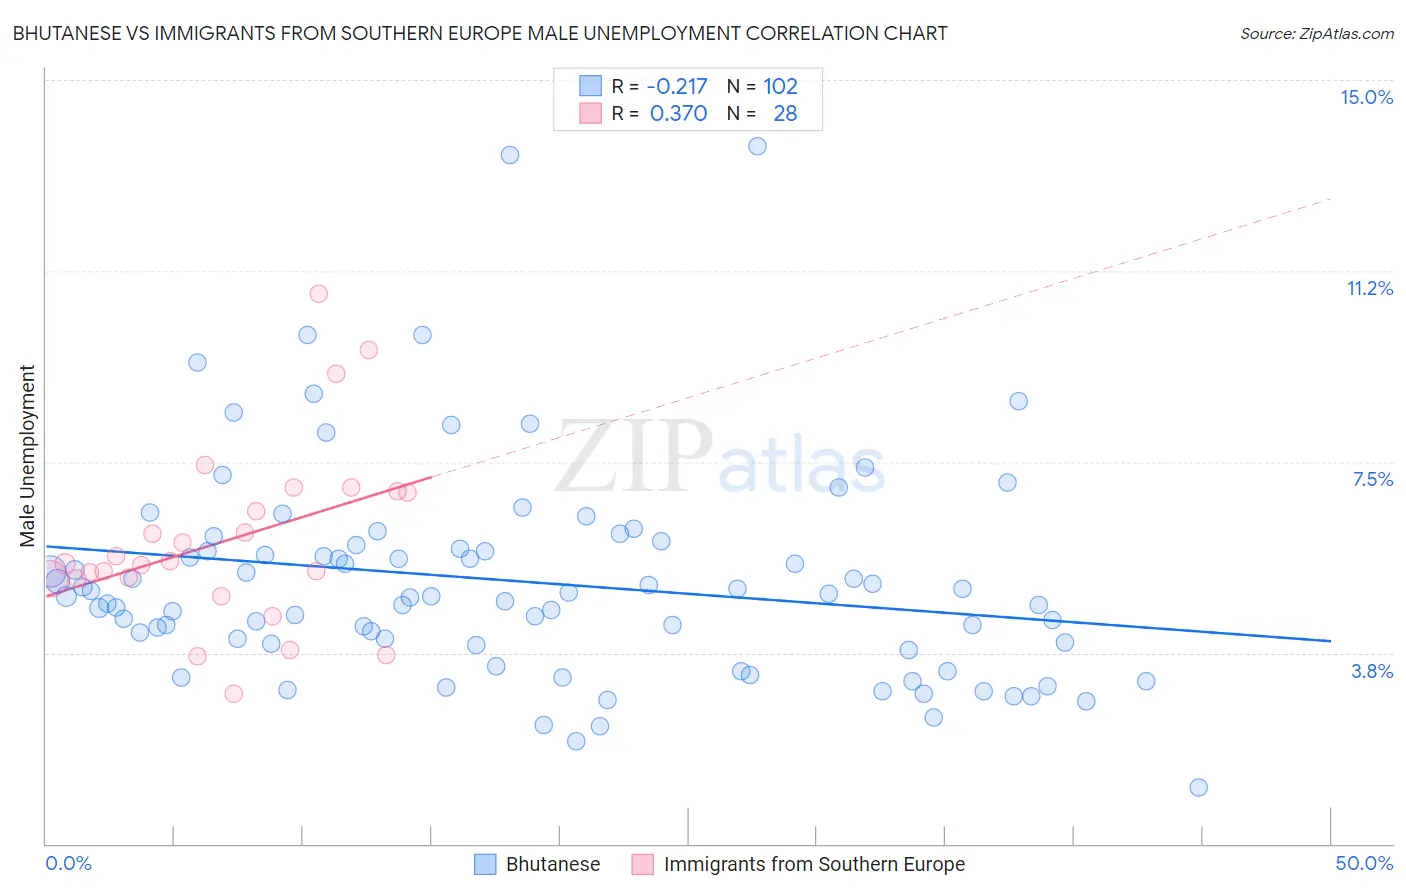
Bhutanese vs Immigrants from Southern Europe Male Unemployment Correlation Chart

The statistical analysis conducted on geographies consisting of 452,760,879 people shows a weak negative correlation between the proportion of Bhutanese and unemployment rate among males in the United States with a correlation coefficient (R) of -0.217 and weighted average of 4.9%. Similarly, the statistical analysis conducted on geographies consisting of 401,185,353 people shows a mild positive correlation between the proportion of Immigrants from Southern Europe and unemployment rate among males in the United States with a correlation coefficient (R) of 0.370 and weighted average of 5.4%, a difference of 9.5%.
Bhutanese vs Immigrants from Southern Europe Male Unemployment

Male Unemployment Correlation Summary

MeasurementBhutaneseImmigrants from Southern Europe
Minimum1.1%2.9%
Maximum13.7%10.8%
Range12.6%7.9%
Mean5.2%6.0%
Median4.9%5.5%
Interquartile 25% (IQ1)3.9%5.2%
Interquartile 75% (IQ3)5.8%6.9%
Interquartile Range (IQR)1.9%1.7%
Standard Deviation (Sample)2.1%1.8%
Standard Deviation (Population)2.1%1.7%

Similar Demographics by Male Unemployment

Demographics Similar to Bhutanese by Male Unemployment

In terms of male unemployment, the demographic groups most similar to Bhutanese are Austrian (4.9%, a difference of 0.070%), Immigrants from Zimbabwe (4.9%, a difference of 0.090%), Immigrants from Scotland (4.9%, a difference of 0.090%), Polish (4.9%, a difference of 0.10%), and Croatian (4.9%, a difference of 0.11%).
DemographicsRating | RankMale Unemployment
Burmese
99.3
/100
|
#39
Exceptional
4.9%
Northern Europeans
99.3
/100
|
#40
Exceptional
4.9%
Chinese
99.3
/100
|
#41
Exceptional
4.9%
Immigrants | Belgium
99.2
/100
|
#42
Exceptional
4.9%
Immigrants | Japan
99.2
/100
|
#43
Exceptional
4.9%
Immigrants | Korea
99.1
/100
|
#44
Exceptional
4.9%
Immigrants | Zimbabwe
99.0
/100
|
#45
Exceptional
4.9%
Bhutanese
98.9
/100
|
#46
Exceptional
4.9%
Austrians
98.9
/100
|
#47
Exceptional
4.9%
Immigrants | Scotland
98.9
/100
|
#48
Exceptional
4.9%
Poles
98.9
/100
|
#49
Exceptional
4.9%
Croatians
98.9
/100
|
#50
Exceptional
4.9%
Slovenes
98.8
/100
|
#51
Exceptional
5.0%
Irish
98.8
/100
|
#52
Exceptional
5.0%
Jordanians
98.8
/100
|
#53
Exceptional
5.0%

Demographics Similar to Immigrants from Southern Europe by Male Unemployment

In terms of male unemployment, the demographic groups most similar to Immigrants from Southern Europe are Albanian (5.4%, a difference of 0.040%), Alsatian (5.4%, a difference of 0.10%), Spanish (5.4%, a difference of 0.18%), Immigrants from Thailand (5.4%, a difference of 0.32%), and Immigrants from Greece (5.4%, a difference of 0.34%).
DemographicsRating | RankMale Unemployment
Arabs
30.2
/100
|
#188
Fair
5.4%
Immigrants | South America
29.4
/100
|
#189
Fair
5.4%
Immigrants | Uganda
28.8
/100
|
#190
Fair
5.4%
Immigrants | South Eastern Asia
28.2
/100
|
#191
Fair
5.4%
Immigrants | Belarus
26.0
/100
|
#192
Fair
5.4%
Immigrants | Israel
25.2
/100
|
#193
Fair
5.4%
Spanish
19.7
/100
|
#194
Poor
5.4%
Immigrants | Southern Europe
17.7
/100
|
#195
Poor
5.4%
Albanians
17.3
/100
|
#196
Poor
5.4%
Alsatians
16.7
/100
|
#197
Poor
5.4%
Immigrants | Thailand
14.7
/100
|
#198
Poor
5.4%
Immigrants | Greece
14.5
/100
|
#199
Poor
5.4%
Immigrants | Zaire
13.7
/100
|
#200
Poor
5.4%
Immigrants | Philippines
13.5
/100
|
#201
Poor
5.4%
Immigrants | Nonimmigrants
13.1
/100
|
#202
Poor
5.4%