Bhutanese vs Immigrants from England Male Unemployment

COMPARE

Bhutanese
Race
Ancestry
AfghanAfricanAlaska NativeAlaskan AthabascanAlbanianAleutAlsatianAmericanApacheArabArapahoArgentineanArmenianAssyrian/Chaldean/SyriacAustralianAustrianBahamianBangladeshiBarbadianBasqueBelgianBelizeanBermudanBhutaneseBlackfeetBolivianBrazilianBritishBritish West IndianBulgarianBurmeseCajunCambodianCanadianCape VerdeanCarpatho RusynCelticCentral AmericanCentral American IndianCherokeeCheyenneChickasawChileanChineseChippewaChoctawColombianColvilleComancheCosta RicanCreeCreekCroatianCrowCubanCypriotCzechCzechoslovakianDanishDelawareDominicanDutchDutch West IndianEastern EuropeanEcuadorianEgyptianEnglishEstonianEthiopianEuropeanFijianFilipinoFinnishFrenchFrench American IndianFrench CanadianGermanGerman RussianGhanaianGreekGuamanian/ChamorroGuatemalanGuyaneseHaitianHmongHonduranHopiHoumaHungarianIcelanderIndian (Asian)IndonesianInupiatIranianIraqiIrishIroquoisIsraeliItalianJamaicanJapaneseJordanianKenyanKiowaKoreanLaotianLatvianLebaneseLiberianLithuanianLumbeeLuxembourgerMacedonianMalaysianMalteseMarshalleseMenomineeMexicanMexican American IndianMongolianMoroccanNative HawaiianNavajoNepaleseNew ZealanderNicaraguanNigerianNorthern EuropeanNorwegianOkinawanOsageOttawaPaiutePakistaniPalestinianPanamanianParaguayanPennsylvania GermanPeruvianPimaPolishPortuguesePotawatomiPuebloPuerto RicanPuget Sound SalishRomanianRussianSalvadoranSamoanScandinavianScotch-IrishScottishSeminoleSenegaleseSerbianShoshoneSierra LeoneanSiouxSlavicSlovakSloveneSomaliSouth AfricanSouth AmericanSouth American IndianSoviet UnionSpaniardSpanishSpanish AmericanSpanish American IndianSri LankanSubsaharan AfricanSudaneseSwedishSwissSyrianTaiwaneseThaiTlingit-HaidaTohono O'OdhamTonganTrinidadian and TobagonianTsimshianTurkishU.S. Virgin IslanderUgandanUkrainianUruguayanUteVenezuelanVietnameseWelshWest IndianYakamaYaquiYugoslavianYumanYup'ikZimbabwean
Immigration
NonimmigrantsImmigrantsAfghanistanAfricaAlbaniaArgentinaArmeniaAsiaAustraliaAustriaBahamasBangladeshBarbadosBelarusBelgiumBelizeBoliviaBosnia and HerzegovinaBrazilBulgariaBurma/MyanmarCabo VerdeCambodiaCameroonCanadaCaribbeanCentral AmericaChileChinaColombiaCongoCosta RicaCroatiaCubaCzechoslovakiaDenmarkDominicaDominican RepublicEastern AfricaEastern AsiaEastern EuropeEcuadorEgyptEl SalvadorEritreaEthiopiaEuropeFijiFranceGermanyGhanaGreeceGrenadaGuatemalaGuyanaHaitiHondurasHong KongHungaryIndiaIndonesiaIranIraqIrelandIsraelItalyJamaicaJapanJordanKazakhstanKenyaKoreaKuwaitLaosLatin AmericaLatviaLebanonLiberiaLithuaniaMalaysiaMexicoMicronesiaMiddle AfricaMoldovaMoroccoNepalNetherlandsNicaraguaNigeriaNorth AmericaNorth MacedoniaNorthern AfricaNorthern EuropeNorwayOceaniaPakistanPanamaPeruPhilippinesPolandPortugalRomaniaRussiaSaudi ArabiaScotlandSenegalSerbiaSierra LeoneSingaporeSomaliaSouth AfricaSouth AmericaSouth Central AsiaSouth Eastern AsiaSouthern EuropeSpainSri LankaSt. Vincent and the GrenadinesSudanSwedenSwitzerlandSyriaTaiwanThailandTrinidad and TobagoTurkeyUgandaUkraineUruguayUzbekistanVenezuelaVietnamWest IndiesWestern AfricaWestern AsiaWestern EuropeYemenZaireZimbabweAzores
Immigrants from England
Race
Ancestry
AfghanAfricanAlaska NativeAlaskan AthabascanAlbanianAleutAlsatianAmericanApacheArabArapahoArgentineanArmenianAssyrian/Chaldean/SyriacAustralianAustrianBahamianBangladeshiBarbadianBasqueBelgianBelizeanBermudanBlackfeetBolivianBrazilianBritishBritish West IndianBulgarianBurmeseCajunCambodianCanadianCape VerdeanCarpatho RusynCelticCentral AmericanCentral American IndianCherokeeCheyenneChickasawChileanChineseChippewaChoctawColombianColvilleComancheCosta RicanCreeCreekCroatianCrowCubanCypriotCzechCzechoslovakianDanishDelawareDominicanDutchDutch West IndianEastern EuropeanEcuadorianEgyptianEnglishEstonianEthiopianEuropeanFijianFilipinoFinnishFrenchFrench American IndianFrench CanadianGermanGerman RussianGhanaianGreekGuamanian/ChamorroGuatemalanGuyaneseHaitianHmongHonduranHopiHoumaHungarianIcelanderIndian (Asian)IndonesianInupiatIranianIraqiIrishIroquoisIsraeliItalianJamaicanJapaneseJordanianKenyanKiowaKoreanLaotianLatvianLebaneseLiberianLithuanianLumbeeLuxembourgerMacedonianMalaysianMalteseMarshalleseMenomineeMexicanMexican American IndianMongolianMoroccanNative HawaiianNavajoNepaleseNew ZealanderNicaraguanNigerianNorthern EuropeanNorwegianOkinawanOsageOttawaPaiutePakistaniPalestinianPanamanianParaguayanPennsylvania GermanPeruvianPimaPolishPortuguesePotawatomiPuebloPuerto RicanPuget Sound SalishRomanianRussianSalvadoranSamoanScandinavianScotch-IrishScottishSeminoleSenegaleseSerbianShoshoneSierra LeoneanSiouxSlavicSlovakSloveneSomaliSouth AfricanSouth AmericanSouth American IndianSoviet UnionSpaniardSpanishSpanish AmericanSpanish American IndianSri LankanSubsaharan AfricanSudaneseSwedishSwissSyrianTaiwaneseThaiTlingit-HaidaTohono O'OdhamTonganTrinidadian and TobagonianTsimshianTurkishU.S. Virgin IslanderUgandanUkrainianUruguayanUteVenezuelanVietnameseWelshWest IndianYakamaYaquiYugoslavianYumanYup'ikZimbabwean
Immigration
NonimmigrantsImmigrantsAfghanistanAfricaAlbaniaArgentinaArmeniaAsiaAustraliaAustriaBahamasBangladeshBarbadosBelarusBelgiumBelizeBoliviaBosnia and HerzegovinaBrazilBulgariaBurma/MyanmarCabo VerdeCambodiaCameroonCanadaCaribbeanCentral AmericaChileChinaColombiaCongoCosta RicaCroatiaCubaCzechoslovakiaDenmarkDominicaDominican RepublicEastern AfricaEastern AsiaEastern EuropeEcuadorEgyptEl SalvadorEnglandEritreaEthiopiaEuropeFijiFranceGermanyGhanaGreeceGrenadaGuatemalaGuyanaHaitiHondurasHong KongHungaryIndiaIndonesiaIranIraqIrelandIsraelItalyJamaicaJapanJordanKazakhstanKenyaKoreaKuwaitLaosLatin AmericaLatviaLebanonLiberiaLithuaniaMalaysiaMexicoMicronesiaMiddle AfricaMoldovaMoroccoNepalNetherlandsNicaraguaNigeriaNorth AmericaNorth MacedoniaNorthern AfricaNorthern EuropeNorwayOceaniaPakistanPanamaPeruPhilippinesPolandPortugalRomaniaRussiaSaudi ArabiaScotlandSenegalSerbiaSierra LeoneSingaporeSomaliaSouth AfricaSouth AmericaSouth Central AsiaSouth Eastern AsiaSouthern EuropeSpainSri LankaSt. Vincent and the GrenadinesSudanSwedenSwitzerlandSyriaTaiwanThailandTrinidad and TobagoTurkeyUgandaUkraineUruguayUzbekistanVenezuelaVietnamWest IndiesWestern AfricaWestern AsiaWestern EuropeYemenZaireZimbabweAzores
Male Unemployment
Income
Poverty
Unemployment
Labor Participation
Family Structure
Vehicle Availability
Education Level
Disability

Male Unemployment Comparison

Bhutanese

Immigrants from England

Exceptional
Exceptional
4.9%
MALE UNEMPLOYMENT
98.9/ 100
METRIC RATING
46th/ 347
METRIC RANK
5.1%
MALE UNEMPLOYMENT
90.8/ 100
METRIC RATING
110th/ 347
METRIC RANK

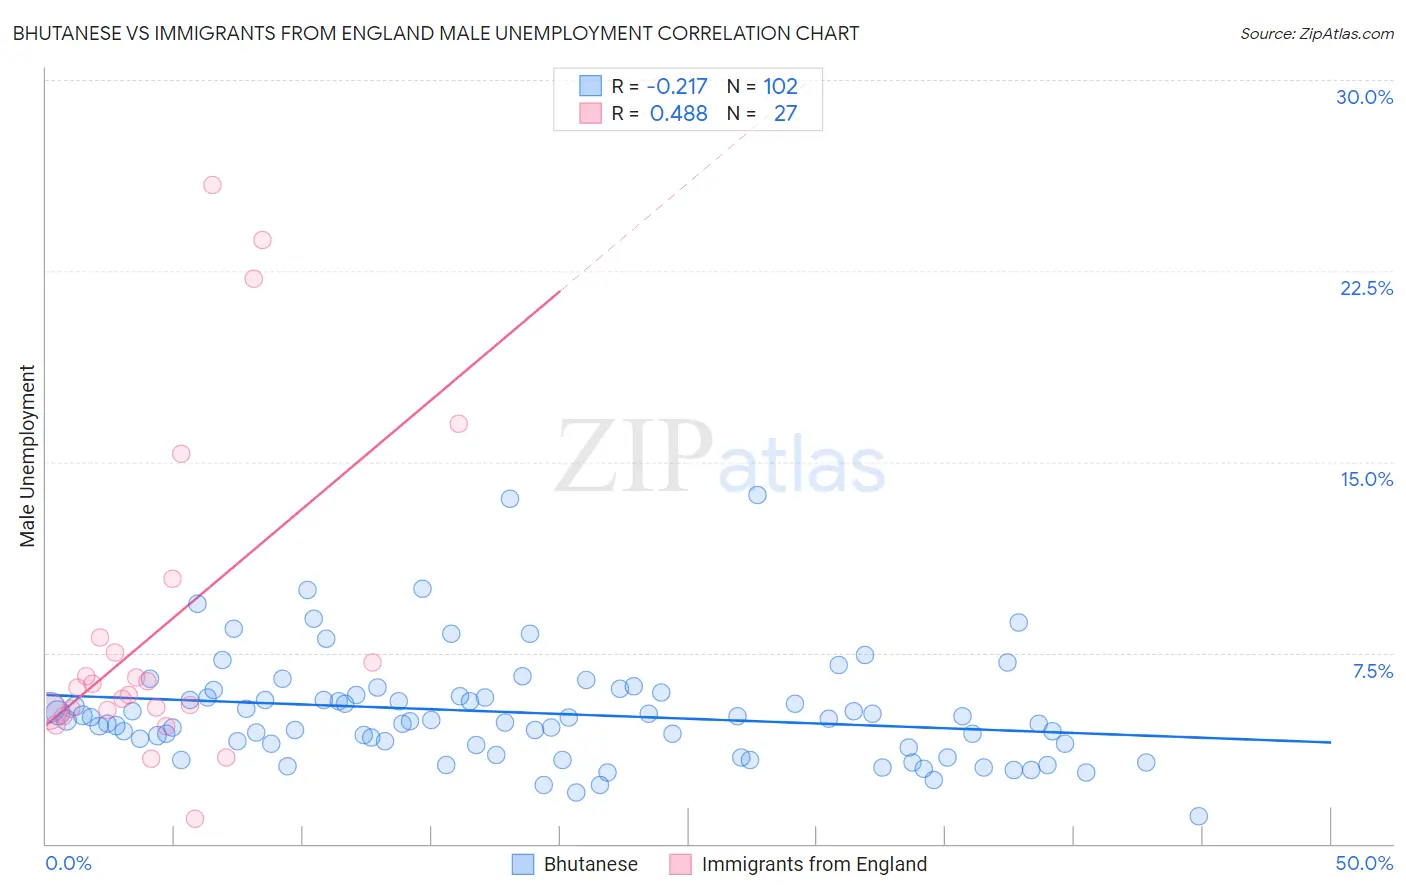
Bhutanese vs Immigrants from England Male Unemployment Correlation Chart

The statistical analysis conducted on geographies consisting of 452,760,879 people shows a weak negative correlation between the proportion of Bhutanese and unemployment rate among males in the United States with a correlation coefficient (R) of -0.217 and weighted average of 4.9%. Similarly, the statistical analysis conducted on geographies consisting of 390,096,041 people shows a moderate positive correlation between the proportion of Immigrants from England and unemployment rate among males in the United States with a correlation coefficient (R) of 0.488 and weighted average of 5.1%, a difference of 3.5%.
Bhutanese vs Immigrants from England Male Unemployment

Male Unemployment Correlation Summary

MeasurementBhutaneseImmigrants from England
Minimum1.1%1.0%
Maximum13.7%25.9%
Range12.6%24.9%
Mean5.2%8.5%
Median4.9%6.1%
Interquartile 25% (IQ1)3.9%5.2%
Interquartile 75% (IQ3)5.8%8.1%
Interquartile Range (IQR)1.9%2.9%
Standard Deviation (Sample)2.1%6.4%
Standard Deviation (Population)2.1%6.3%

Similar Demographics by Male Unemployment

Demographics Similar to Bhutanese by Male Unemployment

In terms of male unemployment, the demographic groups most similar to Bhutanese are Austrian (4.9%, a difference of 0.070%), Immigrants from Zimbabwe (4.9%, a difference of 0.090%), Immigrants from Scotland (4.9%, a difference of 0.090%), Polish (4.9%, a difference of 0.10%), and Croatian (4.9%, a difference of 0.11%).
DemographicsRating | RankMale Unemployment
Burmese
99.3
/100
|
#39
Exceptional
4.9%
Northern Europeans
99.3
/100
|
#40
Exceptional
4.9%
Chinese
99.3
/100
|
#41
Exceptional
4.9%
Immigrants | Belgium
99.2
/100
|
#42
Exceptional
4.9%
Immigrants | Japan
99.2
/100
|
#43
Exceptional
4.9%
Immigrants | Korea
99.1
/100
|
#44
Exceptional
4.9%
Immigrants | Zimbabwe
99.0
/100
|
#45
Exceptional
4.9%
Bhutanese
98.9
/100
|
#46
Exceptional
4.9%
Austrians
98.9
/100
|
#47
Exceptional
4.9%
Immigrants | Scotland
98.9
/100
|
#48
Exceptional
4.9%
Poles
98.9
/100
|
#49
Exceptional
4.9%
Croatians
98.9
/100
|
#50
Exceptional
4.9%
Slovenes
98.8
/100
|
#51
Exceptional
5.0%
Irish
98.8
/100
|
#52
Exceptional
5.0%
Jordanians
98.8
/100
|
#53
Exceptional
5.0%

Demographics Similar to Immigrants from England by Male Unemployment

In terms of male unemployment, the demographic groups most similar to Immigrants from England are Immigrants from Eastern Asia (5.1%, a difference of 0.010%), Immigrants from Pakistan (5.1%, a difference of 0.020%), Immigrants from Nicaragua (5.1%, a difference of 0.080%), Ethiopian (5.1%, a difference of 0.090%), and Immigrants from Moldova (5.1%, a difference of 0.090%).
DemographicsRating | RankMale Unemployment
Immigrants | Jordan
91.9
/100
|
#103
Exceptional
5.1%
Immigrants | Chile
91.8
/100
|
#104
Exceptional
5.1%
Immigrants | Czechoslovakia
91.7
/100
|
#105
Exceptional
5.1%
Immigrants | Ethiopia
91.5
/100
|
#106
Exceptional
5.1%
Ethiopians
91.3
/100
|
#107
Exceptional
5.1%
Immigrants | Nicaragua
91.2
/100
|
#108
Exceptional
5.1%
Immigrants | Pakistan
90.9
/100
|
#109
Exceptional
5.1%
Immigrants | England
90.8
/100
|
#110
Exceptional
5.1%
Immigrants | Eastern Asia
90.8
/100
|
#111
Exceptional
5.1%
Immigrants | Moldova
90.3
/100
|
#112
Exceptional
5.1%
Immigrants | Austria
90.3
/100
|
#113
Exceptional
5.1%
Romanians
89.8
/100
|
#114
Excellent
5.1%
Immigrants | Asia
89.6
/100
|
#115
Excellent
5.1%
Immigrants | Denmark
89.4
/100
|
#116
Excellent
5.1%
Estonians
89.0
/100
|
#117
Excellent
5.1%