Bhutanese vs Immigrants from Oceania Unemployment Among Seniors over 65 years

COMPARE

Bhutanese
Race
Ancestry
AfghanAfricanAlaska NativeAlaskan AthabascanAlbanianAleutAlsatianAmericanApacheArabArapahoArgentineanArmenianAssyrian/Chaldean/SyriacAustralianAustrianBahamianBangladeshiBarbadianBasqueBelgianBelizeanBermudanBhutaneseBlackfeetBolivianBrazilianBritishBritish West IndianBulgarianBurmeseCajunCambodianCanadianCape VerdeanCarpatho RusynCelticCentral AmericanCentral American IndianCherokeeCheyenneChickasawChileanChineseChippewaChoctawColombianColvilleComancheCosta RicanCreeCreekCroatianCrowCubanCypriotCzechCzechoslovakianDanishDelawareDominicanDutchDutch West IndianEastern EuropeanEcuadorianEgyptianEnglishEstonianEthiopianEuropeanFijianFilipinoFinnishFrenchFrench American IndianFrench CanadianGermanGerman RussianGhanaianGreekGuamanian/ChamorroGuatemalanGuyaneseHaitianHmongHonduranHopiHoumaHungarianIcelanderIndian (Asian)IndonesianInupiatIranianIraqiIrishIroquoisIsraeliItalianJamaicanJapaneseJordanianKenyanKiowaKoreanLaotianLatvianLebaneseLiberianLithuanianLumbeeLuxembourgerMacedonianMalaysianMalteseMarshalleseMenomineeMexicanMexican American IndianMongolianMoroccanNative HawaiianNavajoNepaleseNew ZealanderNicaraguanNigerianNorthern EuropeanNorwegianOkinawanOsageOttawaPaiutePakistaniPalestinianPanamanianParaguayanPennsylvania GermanPeruvianPimaPolishPortuguesePotawatomiPuebloPuerto RicanPuget Sound SalishRomanianRussianSalvadoranSamoanScandinavianScotch-IrishScottishSeminoleSenegaleseSerbianShoshoneSierra LeoneanSiouxSlavicSlovakSloveneSomaliSouth AfricanSouth AmericanSouth American IndianSoviet UnionSpaniardSpanishSpanish AmericanSpanish American IndianSri LankanSubsaharan AfricanSudaneseSwedishSwissSyrianTaiwaneseThaiTlingit-HaidaTohono O'OdhamTonganTrinidadian and TobagonianTsimshianTurkishU.S. Virgin IslanderUgandanUkrainianUruguayanUteVenezuelanVietnameseWelshWest IndianYakamaYaquiYugoslavianYumanYup'ikZimbabwean
Immigration
NonimmigrantsImmigrantsAfghanistanAfricaAlbaniaArgentinaArmeniaAsiaAustraliaAustriaBahamasBangladeshBarbadosBelarusBelgiumBelizeBoliviaBosnia and HerzegovinaBrazilBulgariaBurma/MyanmarCabo VerdeCambodiaCameroonCanadaCaribbeanCentral AmericaChileChinaColombiaCongoCosta RicaCroatiaCubaCzechoslovakiaDenmarkDominicaDominican RepublicEastern AfricaEastern AsiaEastern EuropeEcuadorEgyptEl SalvadorEnglandEritreaEthiopiaEuropeFijiFranceGermanyGhanaGreeceGrenadaGuatemalaGuyanaHaitiHondurasHong KongHungaryIndiaIndonesiaIranIraqIrelandIsraelItalyJamaicaJapanJordanKazakhstanKenyaKoreaKuwaitLaosLatin AmericaLatviaLebanonLiberiaLithuaniaMalaysiaMexicoMicronesiaMiddle AfricaMoldovaMoroccoNepalNetherlandsNicaraguaNigeriaNorth AmericaNorth MacedoniaNorthern AfricaNorthern EuropeNorwayPakistanPanamaPeruPhilippinesPolandPortugalRomaniaRussiaSaudi ArabiaScotlandSenegalSerbiaSierra LeoneSingaporeSomaliaSouth AfricaSouth AmericaSouth Central AsiaSouth Eastern AsiaSouthern EuropeSpainSri LankaSt. Vincent and the GrenadinesSudanSwedenSwitzerlandSyriaTaiwanThailandTrinidad and TobagoTurkeyUgandaUkraineUruguayUzbekistanVenezuelaVietnamWest IndiesWestern AfricaWestern AsiaWestern EuropeYemenZaireZimbabweAzores
Immigrants from Oceania
Race
Ancestry
AfghanAfricanAlaska NativeAlaskan AthabascanAlbanianAleutAlsatianAmericanApacheArabArapahoArgentineanArmenianAssyrian/Chaldean/SyriacAustralianAustrianBahamianBangladeshiBarbadianBasqueBelgianBelizeanBermudanBlackfeetBolivianBrazilianBritishBritish West IndianBulgarianBurmeseCajunCambodianCanadianCape VerdeanCarpatho RusynCelticCentral AmericanCentral American IndianCherokeeCheyenneChickasawChileanChineseChippewaChoctawColombianColvilleComancheCosta RicanCreeCreekCroatianCrowCubanCypriotCzechCzechoslovakianDanishDelawareDominicanDutchDutch West IndianEastern EuropeanEcuadorianEgyptianEnglishEstonianEthiopianEuropeanFijianFilipinoFinnishFrenchFrench American IndianFrench CanadianGermanGerman RussianGhanaianGreekGuamanian/ChamorroGuatemalanGuyaneseHaitianHmongHonduranHopiHoumaHungarianIcelanderIndian (Asian)IndonesianInupiatIranianIraqiIrishIroquoisIsraeliItalianJamaicanJapaneseJordanianKenyanKiowaKoreanLaotianLatvianLebaneseLiberianLithuanianLumbeeLuxembourgerMacedonianMalaysianMalteseMarshalleseMenomineeMexicanMexican American IndianMongolianMoroccanNative HawaiianNavajoNepaleseNew ZealanderNicaraguanNigerianNorthern EuropeanNorwegianOkinawanOsageOttawaPaiutePakistaniPalestinianPanamanianParaguayanPennsylvania GermanPeruvianPimaPolishPortuguesePotawatomiPuebloPuerto RicanPuget Sound SalishRomanianRussianSalvadoranSamoanScandinavianScotch-IrishScottishSeminoleSenegaleseSerbianShoshoneSierra LeoneanSiouxSlavicSlovakSloveneSomaliSouth AfricanSouth AmericanSouth American IndianSoviet UnionSpaniardSpanishSpanish AmericanSpanish American IndianSri LankanSubsaharan AfricanSudaneseSwedishSwissSyrianTaiwaneseThaiTlingit-HaidaTohono O'OdhamTonganTrinidadian and TobagonianTsimshianTurkishU.S. Virgin IslanderUgandanUkrainianUruguayanUteVenezuelanVietnameseWelshWest IndianYakamaYaquiYugoslavianYumanYup'ikZimbabwean
Immigration
NonimmigrantsImmigrantsAfghanistanAfricaAlbaniaArgentinaArmeniaAsiaAustraliaAustriaBahamasBangladeshBarbadosBelarusBelgiumBelizeBoliviaBosnia and HerzegovinaBrazilBulgariaBurma/MyanmarCabo VerdeCambodiaCameroonCanadaCaribbeanCentral AmericaChileChinaColombiaCongoCosta RicaCroatiaCubaCzechoslovakiaDenmarkDominicaDominican RepublicEastern AfricaEastern AsiaEastern EuropeEcuadorEgyptEl SalvadorEnglandEritreaEthiopiaEuropeFijiFranceGermanyGhanaGreeceGrenadaGuatemalaGuyanaHaitiHondurasHong KongHungaryIndiaIndonesiaIranIraqIrelandIsraelItalyJamaicaJapanJordanKazakhstanKenyaKoreaKuwaitLaosLatin AmericaLatviaLebanonLiberiaLithuaniaMalaysiaMexicoMicronesiaMiddle AfricaMoldovaMoroccoNepalNetherlandsNicaraguaNigeriaNorth AmericaNorth MacedoniaNorthern AfricaNorthern EuropeNorwayOceaniaPakistanPanamaPeruPhilippinesPolandPortugalRomaniaRussiaSaudi ArabiaScotlandSenegalSerbiaSierra LeoneSingaporeSomaliaSouth AfricaSouth AmericaSouth Central AsiaSouth Eastern AsiaSouthern EuropeSpainSri LankaSt. Vincent and the GrenadinesSudanSwedenSwitzerlandSyriaTaiwanThailandTrinidad and TobagoTurkeyUgandaUkraineUruguayUzbekistanVenezuelaVietnamWest IndiesWestern AfricaWestern AsiaWestern EuropeYemenZaireZimbabweAzores
Unemployment Among Seniors over 65 years
Income
Poverty
Unemployment
Labor Participation
Family Structure
Vehicle Availability
Education Level
Disability

Unemployment Among Seniors over 65 years Comparison

Bhutanese

Immigrants from Oceania

Exceptional
Exceptional
4.8%
UNEMPLOYMENT AMONG SENIORS OVER 65 YEARS
100.0/ 100
METRIC RATING
34th/ 347
METRIC RANK
5.0%
UNEMPLOYMENT AMONG SENIORS OVER 65 YEARS
96.8/ 100
METRIC RATING
97th/ 347
METRIC RANK

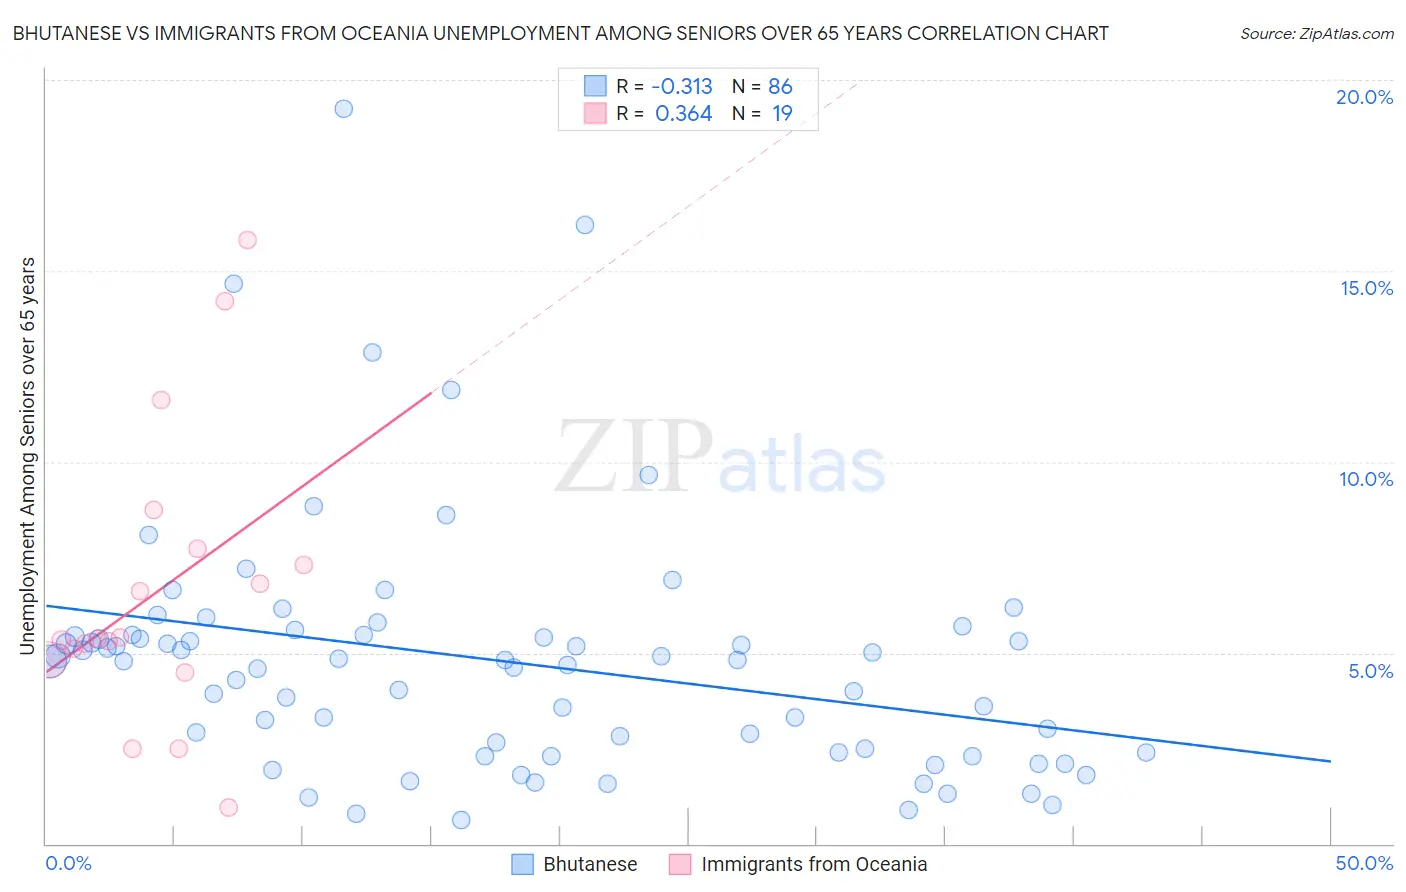
Bhutanese vs Immigrants from Oceania Unemployment Among Seniors over 65 years Correlation Chart

The statistical analysis conducted on geographies consisting of 401,080,570 people shows a mild negative correlation between the proportion of Bhutanese and unemployment rate amomg seniors over the age of 65 in the United States with a correlation coefficient (R) of -0.313 and weighted average of 4.8%. Similarly, the statistical analysis conducted on geographies consisting of 280,737,896 people shows a mild positive correlation between the proportion of Immigrants from Oceania and unemployment rate amomg seniors over the age of 65 in the United States with a correlation coefficient (R) of 0.364 and weighted average of 5.0%, a difference of 3.7%.
Bhutanese vs Immigrants from Oceania Unemployment Among Seniors over 65 years

Unemployment Among Seniors over 65 years Correlation Summary

MeasurementBhutaneseImmigrants from Oceania
Minimum0.63%0.94%
Maximum19.2%15.8%
Range18.6%14.9%
Mean4.8%6.6%
Median4.8%5.4%
Interquartile 25% (IQ1)2.4%4.8%
Interquartile 75% (IQ3)5.5%7.7%
Interquartile Range (IQR)3.1%2.9%
Standard Deviation (Sample)3.3%3.8%
Standard Deviation (Population)3.2%3.7%

Similar Demographics by Unemployment Among Seniors over 65 years

Demographics Similar to Bhutanese by Unemployment Among Seniors over 65 years

In terms of unemployment among seniors over 65 years, the demographic groups most similar to Bhutanese are Immigrants from Kuwait (4.8%, a difference of 0.020%), Cambodian (4.8%, a difference of 0.15%), Bulgarian (4.8%, a difference of 0.17%), Immigrants from India (4.8%, a difference of 0.23%), and Macedonian (4.8%, a difference of 0.26%).
DemographicsRating | RankUnemployment Among Seniors over 65 years
Houma
100.0
/100
|
#27
Exceptional
4.8%
Ugandans
100.0
/100
|
#28
Exceptional
4.8%
Immigrants | North Macedonia
100.0
/100
|
#29
Exceptional
4.8%
Belgians
100.0
/100
|
#30
Exceptional
4.8%
Immigrants | Uganda
100.0
/100
|
#31
Exceptional
4.8%
Slovenes
100.0
/100
|
#32
Exceptional
4.8%
Palestinians
100.0
/100
|
#33
Exceptional
4.8%
Bhutanese
100.0
/100
|
#34
Exceptional
4.8%
Immigrants | Kuwait
100.0
/100
|
#35
Exceptional
4.8%
Cambodians
100.0
/100
|
#36
Exceptional
4.8%
Bulgarians
99.9
/100
|
#37
Exceptional
4.8%
Immigrants | India
99.9
/100
|
#38
Exceptional
4.8%
Macedonians
99.9
/100
|
#39
Exceptional
4.8%
Immigrants | Sweden
99.9
/100
|
#40
Exceptional
4.8%
Kiowa
99.9
/100
|
#41
Exceptional
4.8%

Demographics Similar to Immigrants from Oceania by Unemployment Among Seniors over 65 years

In terms of unemployment among seniors over 65 years, the demographic groups most similar to Immigrants from Oceania are Immigrants from Singapore (5.0%, a difference of 0.0%), Assyrian/Chaldean/Syriac (5.0%, a difference of 0.010%), Czechoslovakian (5.0%, a difference of 0.010%), Burmese (5.0%, a difference of 0.020%), and South African (5.0%, a difference of 0.060%).
DemographicsRating | RankUnemployment Among Seniors over 65 years
Immigrants | South Africa
97.6
/100
|
#90
Exceptional
5.0%
Immigrants | Bolivia
97.3
/100
|
#91
Exceptional
5.0%
Immigrants | Bulgaria
97.3
/100
|
#92
Exceptional
5.0%
Austrians
97.3
/100
|
#93
Exceptional
5.0%
Burmese
96.8
/100
|
#94
Exceptional
5.0%
Assyrians/Chaldeans/Syriacs
96.8
/100
|
#95
Exceptional
5.0%
Immigrants | Singapore
96.8
/100
|
#96
Exceptional
5.0%
Immigrants | Oceania
96.8
/100
|
#97
Exceptional
5.0%
Czechoslovakians
96.7
/100
|
#98
Exceptional
5.0%
South Africans
96.5
/100
|
#99
Exceptional
5.0%
Romanians
95.5
/100
|
#100
Exceptional
5.0%
Yugoslavians
95.4
/100
|
#101
Exceptional
5.0%
Immigrants | Thailand
95.4
/100
|
#102
Exceptional
5.0%
Immigrants | Lithuania
95.1
/100
|
#103
Exceptional
5.0%
Immigrants | Scotland
95.0
/100
|
#104
Exceptional
5.0%