Belizean vs Slavic Female Unemployment
COMPARE
Belizean
Slavic
Female Unemployment
Female Unemployment Comparison
Belizeans
Slavs
6.3%
FEMALE UNEMPLOYMENT
0.0/ 100
METRIC RATING
313th/ 347
METRIC RANK
4.9%
FEMALE UNEMPLOYMENT
99.1/ 100
METRIC RATING
52nd/ 347
METRIC RANK
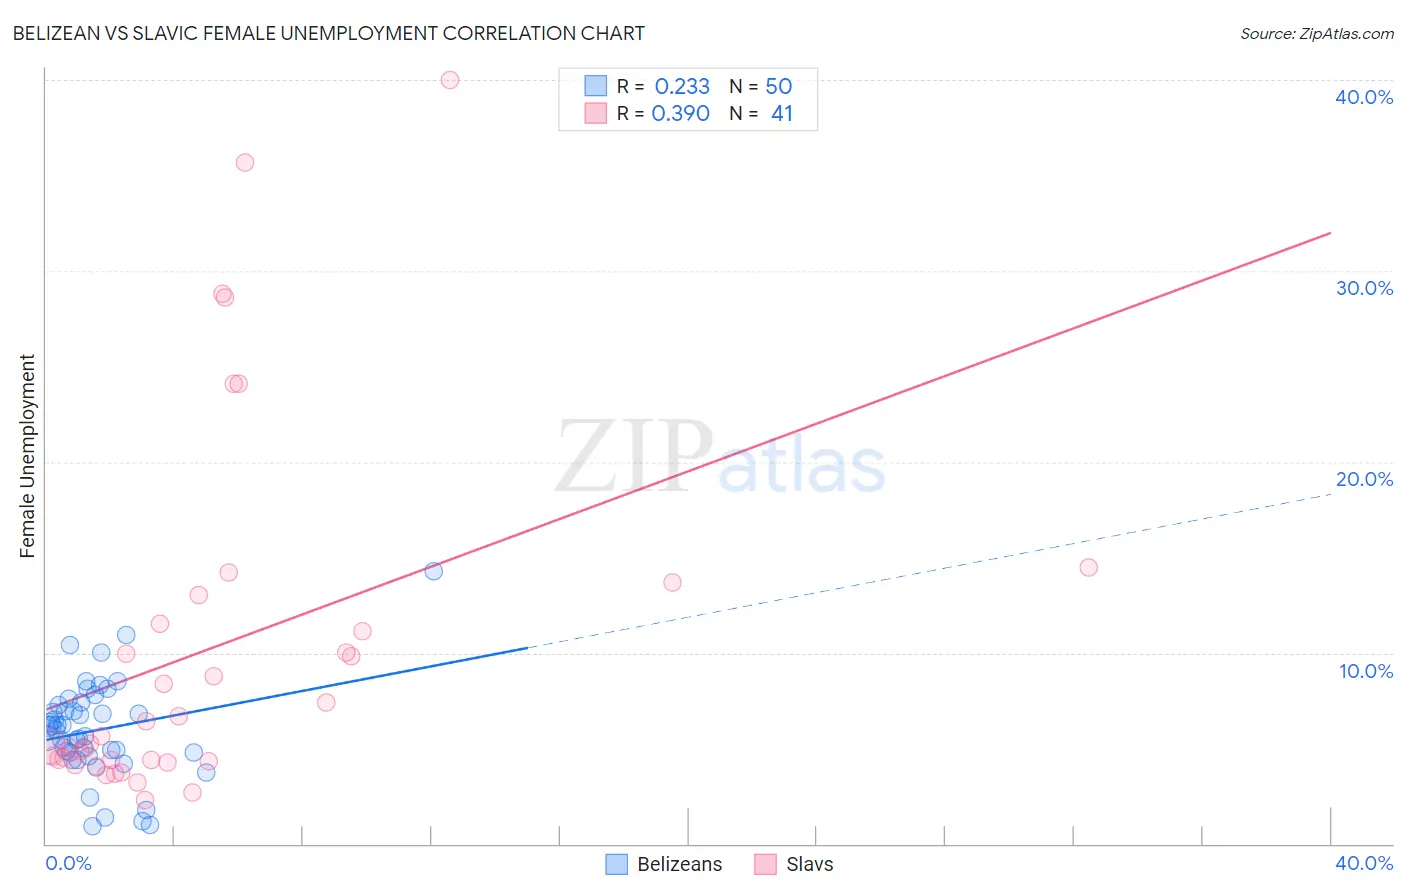
Belizean vs Slavic Female Unemployment Correlation Chart
The statistical analysis conducted on geographies consisting of 144,062,837 people shows a weak positive correlation between the proportion of Belizeans and unemploymnet rate among females in the United States with a correlation coefficient (R) of 0.233 and weighted average of 6.3%. Similarly, the statistical analysis conducted on geographies consisting of 269,881,664 people shows a mild positive correlation between the proportion of Slavs and unemploymnet rate among females in the United States with a correlation coefficient (R) of 0.390 and weighted average of 4.9%, a difference of 29.7%.
Female Unemployment Correlation Summary
| Measurement | Belizean | Slavic |
| Minimum | 0.90% | 2.3% |
| Maximum | 14.3% | 40.0% |
| Range | 13.4% | 37.7% |
| Mean | 6.0% | 10.1% |
| Median | 6.1% | 5.7% |
| Interquartile 25% (IQ1) | 4.8% | 4.3% |
| Interquartile 75% (IQ3) | 7.3% | 12.3% |
| Interquartile Range (IQR) | 2.5% | 7.9% |
| Standard Deviation (Sample) | 2.6% | 9.3% |
| Standard Deviation (Population) | 2.5% | 9.2% |
Similar Demographics by Female Unemployment
Demographics Similar to Belizeans by Female Unemployment
In terms of female unemployment, the demographic groups most similar to Belizeans are Immigrants from Grenada (6.3%, a difference of 0.010%), Immigrants from Ecuador (6.4%, a difference of 0.23%), Pueblo (6.4%, a difference of 0.54%), Immigrants from Mexico (6.3%, a difference of 0.67%), and Central American Indian (6.3%, a difference of 0.81%).
| Demographics | Rating | Rank | Female Unemployment |
| Immigrants | Central America | 0.0 /100 | #306 | Tragic 6.2% |
| Shoshone | 0.0 /100 | #307 | Tragic 6.2% |
| Hispanics or Latinos | 0.0 /100 | #308 | Tragic 6.2% |
| Ecuadorians | 0.0 /100 | #309 | Tragic 6.3% |
| Central American Indians | 0.0 /100 | #310 | Tragic 6.3% |
| Immigrants | Mexico | 0.0 /100 | #311 | Tragic 6.3% |
| Immigrants | Grenada | 0.0 /100 | #312 | Tragic 6.3% |
| Belizeans | 0.0 /100 | #313 | Tragic 6.3% |
| Immigrants | Ecuador | 0.0 /100 | #314 | Tragic 6.4% |
| Pueblo | 0.0 /100 | #315 | Tragic 6.4% |
| Houma | 0.0 /100 | #316 | Tragic 6.4% |
| Immigrants | St. Vincent and the Grenadines | 0.0 /100 | #317 | Tragic 6.4% |
| British West Indians | 0.0 /100 | #318 | Tragic 6.4% |
| Immigrants | Bangladesh | 0.0 /100 | #319 | Tragic 6.5% |
| Immigrants | Dominica | 0.0 /100 | #320 | Tragic 6.5% |
Demographics Similar to Slavs by Female Unemployment
In terms of female unemployment, the demographic groups most similar to Slavs are Cambodian (4.9%, a difference of 0.020%), White/Caucasian (4.9%, a difference of 0.030%), Immigrants from Cuba (4.9%, a difference of 0.040%), Immigrants from Zimbabwe (4.9%, a difference of 0.090%), and Immigrants from Moldova (4.9%, a difference of 0.10%).
| Demographics | Rating | Rank | Female Unemployment |
| Austrians | 99.3 /100 | #45 | Exceptional 4.9% |
| Immigrants | Bulgaria | 99.3 /100 | #46 | Exceptional 4.9% |
| Okinawans | 99.3 /100 | #47 | Exceptional 4.9% |
| Thais | 99.2 /100 | #48 | Exceptional 4.9% |
| Australians | 99.2 /100 | #49 | Exceptional 4.9% |
| Immigrants | Cuba | 99.1 /100 | #50 | Exceptional 4.9% |
| Cambodians | 99.1 /100 | #51 | Exceptional 4.9% |
| Slavs | 99.1 /100 | #52 | Exceptional 4.9% |
| Whites/Caucasians | 99.0 /100 | #53 | Exceptional 4.9% |
| Immigrants | Zimbabwe | 99.0 /100 | #54 | Exceptional 4.9% |
| Immigrants | Moldova | 99.0 /100 | #55 | Exceptional 4.9% |
| Serbians | 99.0 /100 | #56 | Exceptional 4.9% |
| Icelanders | 98.8 /100 | #57 | Exceptional 4.9% |
| Immigrants | Lithuania | 98.8 /100 | #58 | Exceptional 4.9% |
| Bhutanese | 98.7 /100 | #59 | Exceptional 4.9% |