Belizean vs Puget Sound Salish Female Unemployment
COMPARE
Belizean
Puget Sound Salish
Female Unemployment
Female Unemployment Comparison
Belizeans
Puget Sound Salish
6.3%
FEMALE UNEMPLOYMENT
0.0/ 100
METRIC RATING
313th/ 347
METRIC RANK
5.1%
FEMALE UNEMPLOYMENT
93.0/ 100
METRIC RATING
108th/ 347
METRIC RANK
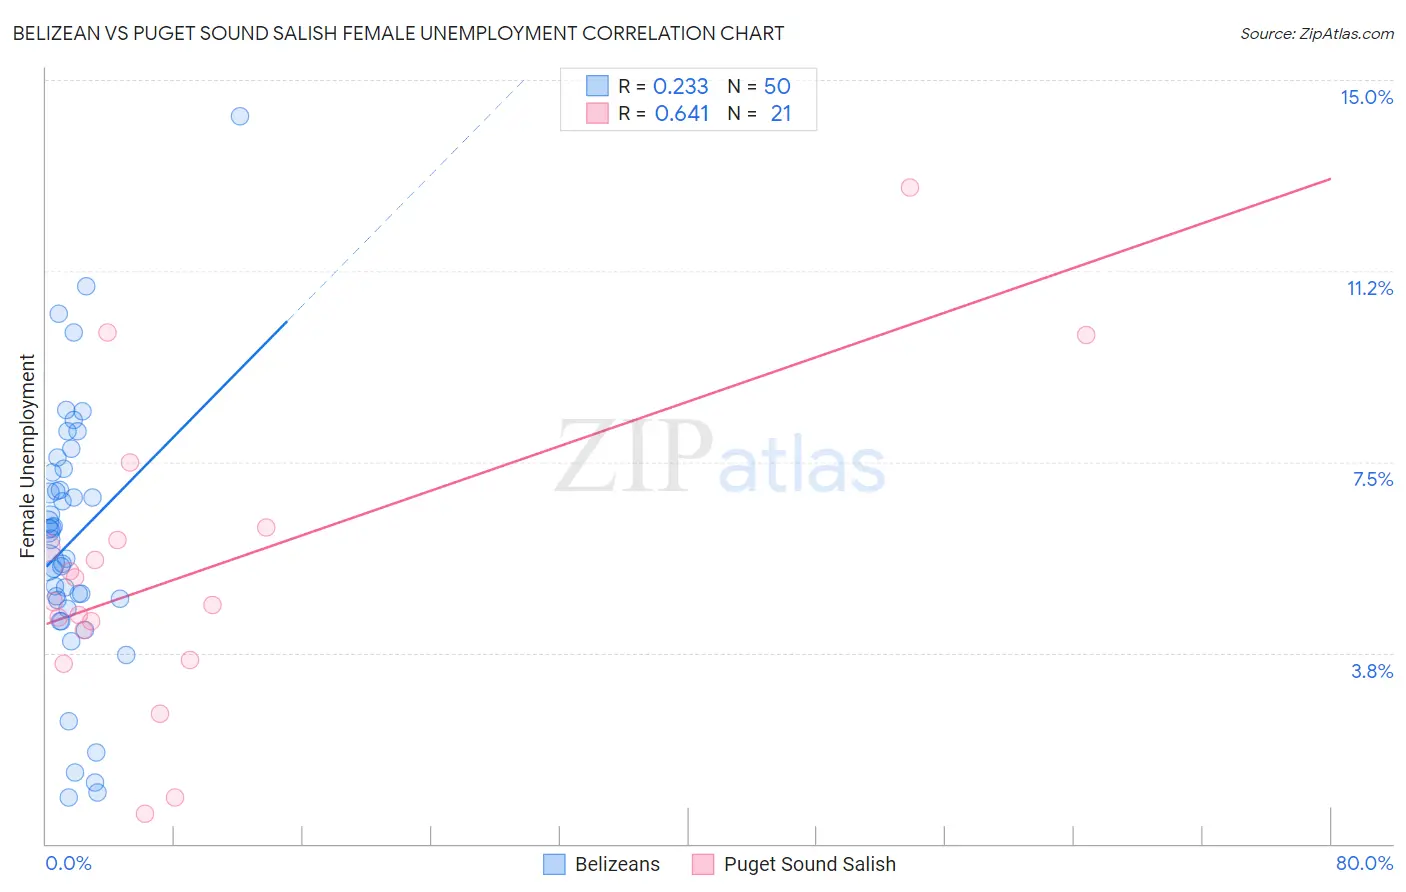
Belizean vs Puget Sound Salish Female Unemployment Correlation Chart
The statistical analysis conducted on geographies consisting of 144,062,837 people shows a weak positive correlation between the proportion of Belizeans and unemploymnet rate among females in the United States with a correlation coefficient (R) of 0.233 and weighted average of 6.3%. Similarly, the statistical analysis conducted on geographies consisting of 46,055,319 people shows a significant positive correlation between the proportion of Puget Sound Salish and unemploymnet rate among females in the United States with a correlation coefficient (R) of 0.641 and weighted average of 5.1%, a difference of 25.6%.
Female Unemployment Correlation Summary
| Measurement | Belizean | Puget Sound Salish |
| Minimum | 0.90% | 0.60% |
| Maximum | 14.3% | 12.9% |
| Range | 13.4% | 12.3% |
| Mean | 6.0% | 5.4% |
| Median | 6.1% | 4.8% |
| Interquartile 25% (IQ1) | 4.8% | 3.9% |
| Interquartile 75% (IQ3) | 7.3% | 6.1% |
| Interquartile Range (IQR) | 2.5% | 2.2% |
| Standard Deviation (Sample) | 2.6% | 2.9% |
| Standard Deviation (Population) | 2.5% | 2.8% |
Similar Demographics by Female Unemployment
Demographics Similar to Belizeans by Female Unemployment
In terms of female unemployment, the demographic groups most similar to Belizeans are Immigrants from Grenada (6.3%, a difference of 0.010%), Immigrants from Ecuador (6.4%, a difference of 0.23%), Pueblo (6.4%, a difference of 0.54%), Immigrants from Mexico (6.3%, a difference of 0.67%), and Central American Indian (6.3%, a difference of 0.81%).
| Demographics | Rating | Rank | Female Unemployment |
| Immigrants | Central America | 0.0 /100 | #306 | Tragic 6.2% |
| Shoshone | 0.0 /100 | #307 | Tragic 6.2% |
| Hispanics or Latinos | 0.0 /100 | #308 | Tragic 6.2% |
| Ecuadorians | 0.0 /100 | #309 | Tragic 6.3% |
| Central American Indians | 0.0 /100 | #310 | Tragic 6.3% |
| Immigrants | Mexico | 0.0 /100 | #311 | Tragic 6.3% |
| Immigrants | Grenada | 0.0 /100 | #312 | Tragic 6.3% |
| Belizeans | 0.0 /100 | #313 | Tragic 6.3% |
| Immigrants | Ecuador | 0.0 /100 | #314 | Tragic 6.4% |
| Pueblo | 0.0 /100 | #315 | Tragic 6.4% |
| Houma | 0.0 /100 | #316 | Tragic 6.4% |
| Immigrants | St. Vincent and the Grenadines | 0.0 /100 | #317 | Tragic 6.4% |
| British West Indians | 0.0 /100 | #318 | Tragic 6.4% |
| Immigrants | Bangladesh | 0.0 /100 | #319 | Tragic 6.5% |
| Immigrants | Dominica | 0.0 /100 | #320 | Tragic 6.5% |
Demographics Similar to Puget Sound Salish by Female Unemployment
In terms of female unemployment, the demographic groups most similar to Puget Sound Salish are Immigrants from Switzerland (5.1%, a difference of 0.020%), Immigrants from Eastern Africa (5.1%, a difference of 0.040%), Paraguayan (5.1%, a difference of 0.050%), Immigrants from England (5.0%, a difference of 0.14%), and Macedonian (5.1%, a difference of 0.14%).
| Demographics | Rating | Rank | Female Unemployment |
| Immigrants | Czechoslovakia | 95.0 /100 | #101 | Exceptional 5.0% |
| Immigrants | Kenya | 94.8 /100 | #102 | Exceptional 5.0% |
| Somalis | 94.6 /100 | #103 | Exceptional 5.0% |
| Kenyans | 93.7 /100 | #104 | Exceptional 5.0% |
| Immigrants | England | 93.6 /100 | #105 | Exceptional 5.0% |
| Paraguayans | 93.2 /100 | #106 | Exceptional 5.1% |
| Immigrants | Switzerland | 93.1 /100 | #107 | Exceptional 5.1% |
| Puget Sound Salish | 93.0 /100 | #108 | Exceptional 5.1% |
| Immigrants | Eastern Africa | 92.8 /100 | #109 | Exceptional 5.1% |
| Macedonians | 92.4 /100 | #110 | Exceptional 5.1% |
| Immigrants | Burma/Myanmar | 92.3 /100 | #111 | Exceptional 5.1% |
| Estonians | 92.1 /100 | #112 | Exceptional 5.1% |
| Immigrants | Saudi Arabia | 91.2 /100 | #113 | Exceptional 5.1% |
| Immigrants | Turkey | 91.0 /100 | #114 | Exceptional 5.1% |
| Lebanese | 91.0 /100 | #115 | Exceptional 5.1% |