Belizean vs Carpatho Rusyn Unemployment Among Ages 16 to 19 years
COMPARE
Belizean
Carpatho Rusyn
Unemployment Among Ages 16 to 19 years
Unemployment Among Ages 16 to 19 years Comparison
Belizeans
Carpatho Rusyns
21.6%
UNEMPLOYMENT AMONG AGES 16 TO 19 YEARS
0.0/ 100
METRIC RATING
311th/ 347
METRIC RANK
17.9%
UNEMPLOYMENT AMONG AGES 16 TO 19 YEARS
15.6/ 100
METRIC RATING
210th/ 347
METRIC RANK
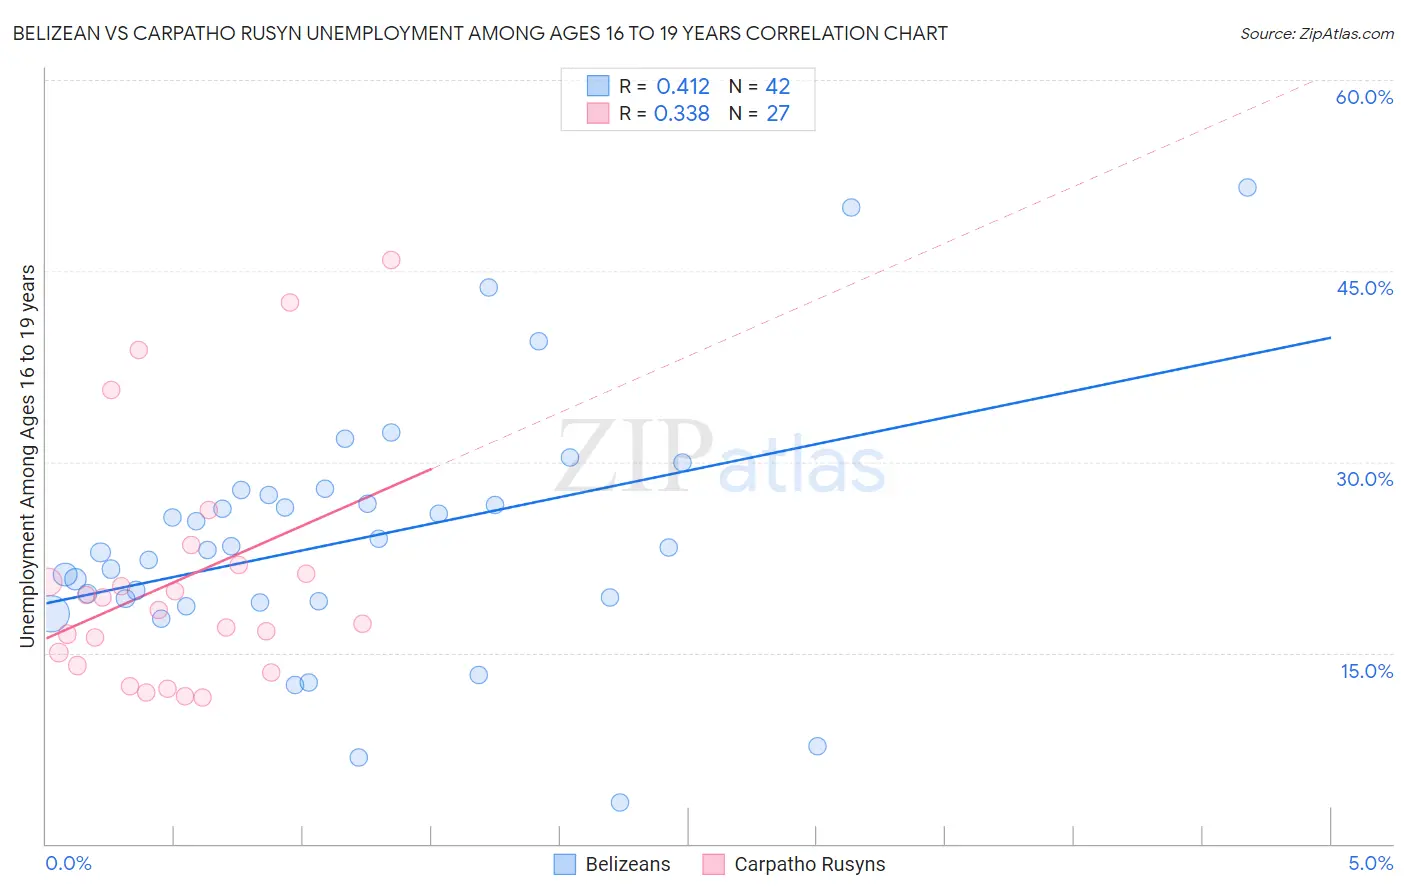
Belizean vs Carpatho Rusyn Unemployment Among Ages 16 to 19 years Correlation Chart
The statistical analysis conducted on geographies consisting of 141,937,009 people shows a moderate positive correlation between the proportion of Belizeans and unemployment rate among population between the ages 16 and 19 in the United States with a correlation coefficient (R) of 0.412 and weighted average of 21.6%. Similarly, the statistical analysis conducted on geographies consisting of 57,767,385 people shows a mild positive correlation between the proportion of Carpatho Rusyns and unemployment rate among population between the ages 16 and 19 in the United States with a correlation coefficient (R) of 0.338 and weighted average of 17.9%, a difference of 20.3%.
Unemployment Among Ages 16 to 19 years Correlation Summary
| Measurement | Belizean | Carpatho Rusyn |
| Minimum | 3.2% | 11.5% |
| Maximum | 51.6% | 45.9% |
| Range | 48.4% | 34.4% |
| Mean | 23.9% | 20.7% |
| Median | 23.2% | 18.3% |
| Interquartile 25% (IQ1) | 19.1% | 14.0% |
| Interquartile 75% (IQ3) | 27.4% | 21.9% |
| Interquartile Range (IQR) | 8.3% | 7.9% |
| Standard Deviation (Sample) | 9.8% | 9.4% |
| Standard Deviation (Population) | 9.7% | 9.2% |
Similar Demographics by Unemployment Among Ages 16 to 19 years
Demographics Similar to Belizeans by Unemployment Among Ages 16 to 19 years
In terms of unemployment among ages 16 to 19 years, the demographic groups most similar to Belizeans are Vietnamese (21.5%, a difference of 0.22%), Houma (21.6%, a difference of 0.26%), Native/Alaskan (21.5%, a difference of 0.28%), Immigrants from Bangladesh (21.5%, a difference of 0.44%), and Jamaican (21.7%, a difference of 0.67%).
| Demographics | Rating | Rank | Unemployment Among Ages 16 to 19 years |
| Aleuts | 0.0 /100 | #304 | Tragic 21.2% |
| Immigrants | Senegal | 0.0 /100 | #305 | Tragic 21.2% |
| U.S. Virgin Islanders | 0.0 /100 | #306 | Tragic 21.3% |
| Blacks/African Americans | 0.0 /100 | #307 | Tragic 21.4% |
| Immigrants | Bangladesh | 0.0 /100 | #308 | Tragic 21.5% |
| Natives/Alaskans | 0.0 /100 | #309 | Tragic 21.5% |
| Vietnamese | 0.0 /100 | #310 | Tragic 21.5% |
| Belizeans | 0.0 /100 | #311 | Tragic 21.6% |
| Houma | 0.0 /100 | #312 | Tragic 21.6% |
| Jamaicans | 0.0 /100 | #313 | Tragic 21.7% |
| Alaska Natives | 0.0 /100 | #314 | Tragic 21.8% |
| Immigrants | Dominica | 0.0 /100 | #315 | Tragic 21.9% |
| Tohono O'odham | 0.0 /100 | #316 | Tragic 22.1% |
| Immigrants | Belize | 0.0 /100 | #317 | Tragic 22.2% |
| Immigrants | Jamaica | 0.0 /100 | #318 | Tragic 22.2% |
Demographics Similar to Carpatho Rusyns by Unemployment Among Ages 16 to 19 years
In terms of unemployment among ages 16 to 19 years, the demographic groups most similar to Carpatho Rusyns are Cherokee (17.9%, a difference of 0.010%), Hawaiian (17.9%, a difference of 0.10%), Guamanian/Chamorro (17.9%, a difference of 0.10%), Argentinean (18.0%, a difference of 0.16%), and Chippewa (18.0%, a difference of 0.17%).
| Demographics | Rating | Rank | Unemployment Among Ages 16 to 19 years |
| Immigrants | Eastern Europe | 23.6 /100 | #203 | Fair 17.8% |
| Immigrants | Nonimmigrants | 20.9 /100 | #204 | Fair 17.9% |
| Assyrians/Chaldeans/Syriacs | 20.8 /100 | #205 | Fair 17.9% |
| Immigrants | Southern Europe | 18.9 /100 | #206 | Poor 17.9% |
| Liberians | 18.6 /100 | #207 | Poor 17.9% |
| Hawaiians | 16.8 /100 | #208 | Poor 17.9% |
| Cherokee | 15.7 /100 | #209 | Poor 17.9% |
| Carpatho Rusyns | 15.6 /100 | #210 | Poor 17.9% |
| Guamanians/Chamorros | 14.5 /100 | #211 | Poor 17.9% |
| Argentineans | 13.8 /100 | #212 | Poor 18.0% |
| Chippewa | 13.7 /100 | #213 | Poor 18.0% |
| Immigrants | Morocco | 13.5 /100 | #214 | Poor 18.0% |
| Immigrants | Syria | 13.3 /100 | #215 | Poor 18.0% |
| Immigrants | Kazakhstan | 13.0 /100 | #216 | Poor 18.0% |
| South American Indians | 13.0 /100 | #217 | Poor 18.0% |