Belizean vs Brazilian Unemployment Among Ages 16 to 19 years
COMPARE
Belizean
Brazilian
Unemployment Among Ages 16 to 19 years
Unemployment Among Ages 16 to 19 years Comparison
Belizeans
Brazilians
21.6%
UNEMPLOYMENT AMONG AGES 16 TO 19 YEARS
0.0/ 100
METRIC RATING
311th/ 347
METRIC RANK
17.1%
UNEMPLOYMENT AMONG AGES 16 TO 19 YEARS
92.3/ 100
METRIC RATING
115th/ 347
METRIC RANK
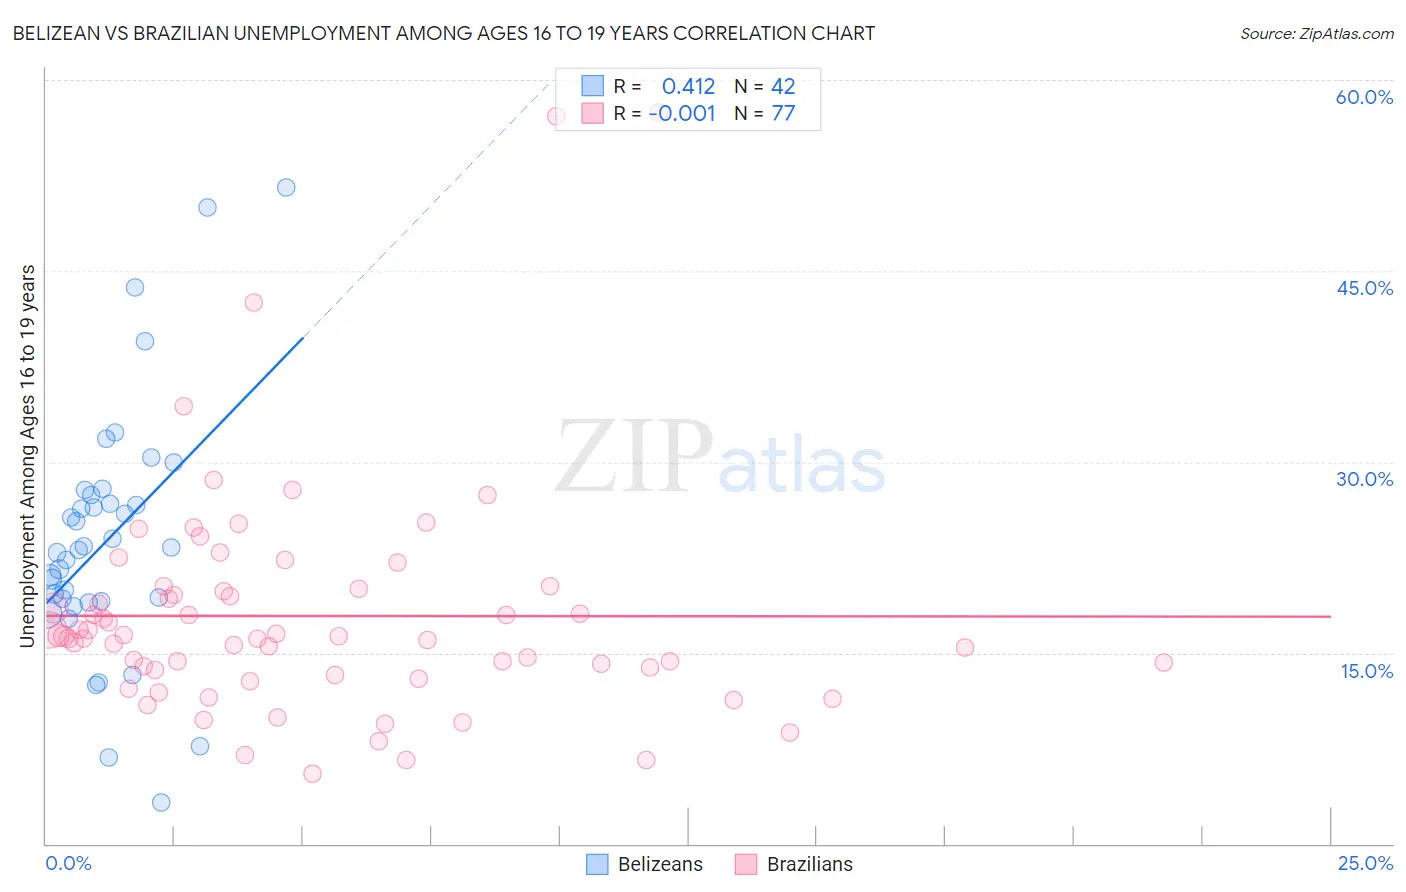
Belizean vs Brazilian Unemployment Among Ages 16 to 19 years Correlation Chart
The statistical analysis conducted on geographies consisting of 141,937,009 people shows a moderate positive correlation between the proportion of Belizeans and unemployment rate among population between the ages 16 and 19 in the United States with a correlation coefficient (R) of 0.412 and weighted average of 21.6%. Similarly, the statistical analysis conducted on geographies consisting of 310,579,987 people shows no correlation between the proportion of Brazilians and unemployment rate among population between the ages 16 and 19 in the United States with a correlation coefficient (R) of -0.001 and weighted average of 17.1%, a difference of 26.5%.
Unemployment Among Ages 16 to 19 years Correlation Summary
| Measurement | Belizean | Brazilian |
| Minimum | 3.2% | 5.5% |
| Maximum | 51.6% | 57.4% |
| Range | 48.4% | 51.9% |
| Mean | 23.9% | 17.9% |
| Median | 23.2% | 16.3% |
| Interquartile 25% (IQ1) | 19.1% | 13.5% |
| Interquartile 75% (IQ3) | 27.4% | 19.9% |
| Interquartile Range (IQR) | 8.3% | 6.5% |
| Standard Deviation (Sample) | 9.8% | 9.0% |
| Standard Deviation (Population) | 9.7% | 8.9% |
Similar Demographics by Unemployment Among Ages 16 to 19 years
Demographics Similar to Belizeans by Unemployment Among Ages 16 to 19 years
In terms of unemployment among ages 16 to 19 years, the demographic groups most similar to Belizeans are Vietnamese (21.5%, a difference of 0.22%), Houma (21.6%, a difference of 0.26%), Native/Alaskan (21.5%, a difference of 0.28%), Immigrants from Bangladesh (21.5%, a difference of 0.44%), and Jamaican (21.7%, a difference of 0.67%).
| Demographics | Rating | Rank | Unemployment Among Ages 16 to 19 years |
| Aleuts | 0.0 /100 | #304 | Tragic 21.2% |
| Immigrants | Senegal | 0.0 /100 | #305 | Tragic 21.2% |
| U.S. Virgin Islanders | 0.0 /100 | #306 | Tragic 21.3% |
| Blacks/African Americans | 0.0 /100 | #307 | Tragic 21.4% |
| Immigrants | Bangladesh | 0.0 /100 | #308 | Tragic 21.5% |
| Natives/Alaskans | 0.0 /100 | #309 | Tragic 21.5% |
| Vietnamese | 0.0 /100 | #310 | Tragic 21.5% |
| Belizeans | 0.0 /100 | #311 | Tragic 21.6% |
| Houma | 0.0 /100 | #312 | Tragic 21.6% |
| Jamaicans | 0.0 /100 | #313 | Tragic 21.7% |
| Alaska Natives | 0.0 /100 | #314 | Tragic 21.8% |
| Immigrants | Dominica | 0.0 /100 | #315 | Tragic 21.9% |
| Tohono O'odham | 0.0 /100 | #316 | Tragic 22.1% |
| Immigrants | Belize | 0.0 /100 | #317 | Tragic 22.2% |
| Immigrants | Jamaica | 0.0 /100 | #318 | Tragic 22.2% |
Demographics Similar to Brazilians by Unemployment Among Ages 16 to 19 years
In terms of unemployment among ages 16 to 19 years, the demographic groups most similar to Brazilians are Immigrants from Korea (17.1%, a difference of 0.020%), Immigrants from Sri Lanka (17.1%, a difference of 0.050%), Venezuelan (17.1%, a difference of 0.070%), Hungarian (17.1%, a difference of 0.11%), and Immigrants from Poland (17.0%, a difference of 0.14%).
| Demographics | Rating | Rank | Unemployment Among Ages 16 to 19 years |
| Malaysians | 94.2 /100 | #108 | Exceptional 17.0% |
| Iranians | 94.1 /100 | #109 | Exceptional 17.0% |
| Immigrants | Netherlands | 93.9 /100 | #110 | Exceptional 17.0% |
| Immigrants | Asia | 93.9 /100 | #111 | Exceptional 17.0% |
| Immigrants | Iraq | 93.7 /100 | #112 | Exceptional 17.0% |
| Icelanders | 93.4 /100 | #113 | Exceptional 17.0% |
| Immigrants | Poland | 93.1 /100 | #114 | Exceptional 17.0% |
| Brazilians | 92.3 /100 | #115 | Exceptional 17.1% |
| Immigrants | Korea | 92.2 /100 | #116 | Exceptional 17.1% |
| Immigrants | Sri Lanka | 92.0 /100 | #117 | Exceptional 17.1% |
| Venezuelans | 91.8 /100 | #118 | Exceptional 17.1% |
| Hungarians | 91.6 /100 | #119 | Exceptional 17.1% |
| Immigrants | Middle Africa | 90.9 /100 | #120 | Exceptional 17.1% |
| Immigrants | Moldova | 90.7 /100 | #121 | Exceptional 17.1% |
| Immigrants | South Eastern Asia | 90.7 /100 | #122 | Exceptional 17.1% |