Bangladeshi vs Palestinian Unemployment Among Ages 20 to 24 years
COMPARE
Bangladeshi
Palestinian
Unemployment Among Ages 20 to 24 years
Unemployment Among Ages 20 to 24 years Comparison
Bangladeshis
Palestinians
10.0%
UNEMPLOYMENT AMONG AGES 20 TO 24 YEARS
96.9/ 100
METRIC RATING
92nd/ 347
METRIC RANK
10.6%
UNEMPLOYMENT AMONG AGES 20 TO 24 YEARS
4.9/ 100
METRIC RATING
227th/ 347
METRIC RANK
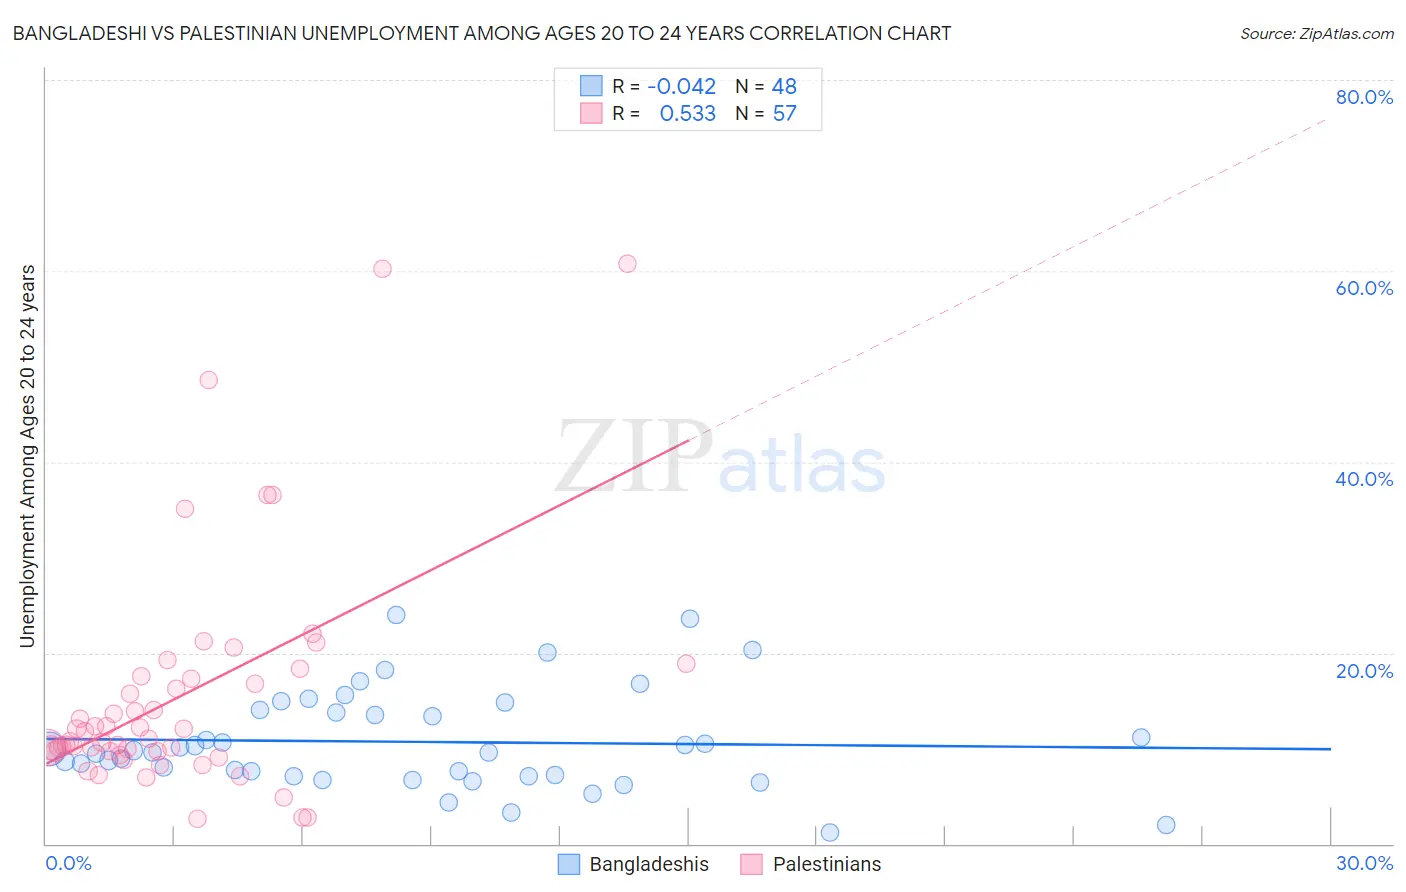
Bangladeshi vs Palestinian Unemployment Among Ages 20 to 24 years Correlation Chart
The statistical analysis conducted on geographies consisting of 139,664,928 people shows no correlation between the proportion of Bangladeshis and unemployment rate among population between the ages 20 and 24 in the United States with a correlation coefficient (R) of -0.042 and weighted average of 10.0%. Similarly, the statistical analysis conducted on geographies consisting of 214,060,905 people shows a substantial positive correlation between the proportion of Palestinians and unemployment rate among population between the ages 20 and 24 in the United States with a correlation coefficient (R) of 0.533 and weighted average of 10.6%, a difference of 6.1%.
Unemployment Among Ages 20 to 24 years Correlation Summary
| Measurement | Bangladeshi | Palestinian |
| Minimum | 1.2% | 2.6% |
| Maximum | 24.0% | 60.8% |
| Range | 22.8% | 58.2% |
| Mean | 10.7% | 15.4% |
| Median | 9.7% | 11.1% |
| Interquartile 25% (IQ1) | 7.2% | 9.7% |
| Interquartile 75% (IQ3) | 13.9% | 17.4% |
| Interquartile Range (IQR) | 6.8% | 7.8% |
| Standard Deviation (Sample) | 5.1% | 12.1% |
| Standard Deviation (Population) | 5.1% | 12.0% |
Similar Demographics by Unemployment Among Ages 20 to 24 years
Demographics Similar to Bangladeshis by Unemployment Among Ages 20 to 24 years
In terms of unemployment among ages 20 to 24 years, the demographic groups most similar to Bangladeshis are Bhutanese (10.0%, a difference of 0.010%), Immigrants from Malaysia (10.0%, a difference of 0.010%), Macedonian (10.0%, a difference of 0.040%), Chilean (10.0%, a difference of 0.040%), and Polish (10.0%, a difference of 0.060%).
| Demographics | Rating | Rank | Unemployment Among Ages 20 to 24 years |
| New Zealanders | 97.8 /100 | #85 | Exceptional 9.9% |
| Immigrants | Vietnam | 97.5 /100 | #86 | Exceptional 10.0% |
| Immigrants | Oceania | 97.4 /100 | #87 | Exceptional 10.0% |
| Poles | 97.1 /100 | #88 | Exceptional 10.0% |
| Macedonians | 97.0 /100 | #89 | Exceptional 10.0% |
| Chileans | 97.0 /100 | #90 | Exceptional 10.0% |
| Bhutanese | 96.9 /100 | #91 | Exceptional 10.0% |
| Bangladeshis | 96.9 /100 | #92 | Exceptional 10.0% |
| Immigrants | Malaysia | 96.9 /100 | #93 | Exceptional 10.0% |
| Immigrants | Micronesia | 96.6 /100 | #94 | Exceptional 10.0% |
| Scotch-Irish | 96.2 /100 | #95 | Exceptional 10.0% |
| Thais | 96.2 /100 | #96 | Exceptional 10.0% |
| Slavs | 96.1 /100 | #97 | Exceptional 10.0% |
| Japanese | 95.4 /100 | #98 | Exceptional 10.0% |
| Fijians | 95.3 /100 | #99 | Exceptional 10.0% |
Demographics Similar to Palestinians by Unemployment Among Ages 20 to 24 years
In terms of unemployment among ages 20 to 24 years, the demographic groups most similar to Palestinians are Immigrants from Costa Rica (10.6%, a difference of 0.0%), Immigrants from South America (10.6%, a difference of 0.030%), Nepalese (10.6%, a difference of 0.040%), Mexican American Indian (10.6%, a difference of 0.070%), and American (10.6%, a difference of 0.11%).
| Demographics | Rating | Rank | Unemployment Among Ages 20 to 24 years |
| Eastern Europeans | 6.9 /100 | #220 | Tragic 10.6% |
| Central Americans | 6.8 /100 | #221 | Tragic 10.6% |
| Immigrants | Poland | 6.4 /100 | #222 | Tragic 10.6% |
| Arabs | 5.6 /100 | #223 | Tragic 10.6% |
| Nepalese | 5.1 /100 | #224 | Tragic 10.6% |
| Immigrants | South America | 5.1 /100 | #225 | Tragic 10.6% |
| Immigrants | Costa Rica | 4.9 /100 | #226 | Tragic 10.6% |
| Palestinians | 4.9 /100 | #227 | Tragic 10.6% |
| Mexican American Indians | 4.6 /100 | #228 | Tragic 10.6% |
| Americans | 4.4 /100 | #229 | Tragic 10.6% |
| French American Indians | 4.1 /100 | #230 | Tragic 10.6% |
| Native Hawaiians | 3.9 /100 | #231 | Tragic 10.6% |
| Israelis | 3.7 /100 | #232 | Tragic 10.6% |
| Choctaw | 3.6 /100 | #233 | Tragic 10.6% |
| Immigrants | Africa | 3.5 /100 | #234 | Tragic 10.6% |