Bangladeshi vs Cajun Unemployment Among Ages 20 to 24 years
COMPARE
Bangladeshi
Cajun
Unemployment Among Ages 20 to 24 years
Unemployment Among Ages 20 to 24 years Comparison
Bangladeshis
Cajuns
10.0%
UNEMPLOYMENT AMONG AGES 20 TO 24 YEARS
96.9/ 100
METRIC RATING
92nd/ 347
METRIC RANK
12.0%
UNEMPLOYMENT AMONG AGES 20 TO 24 YEARS
0.0/ 100
METRIC RATING
296th/ 347
METRIC RANK
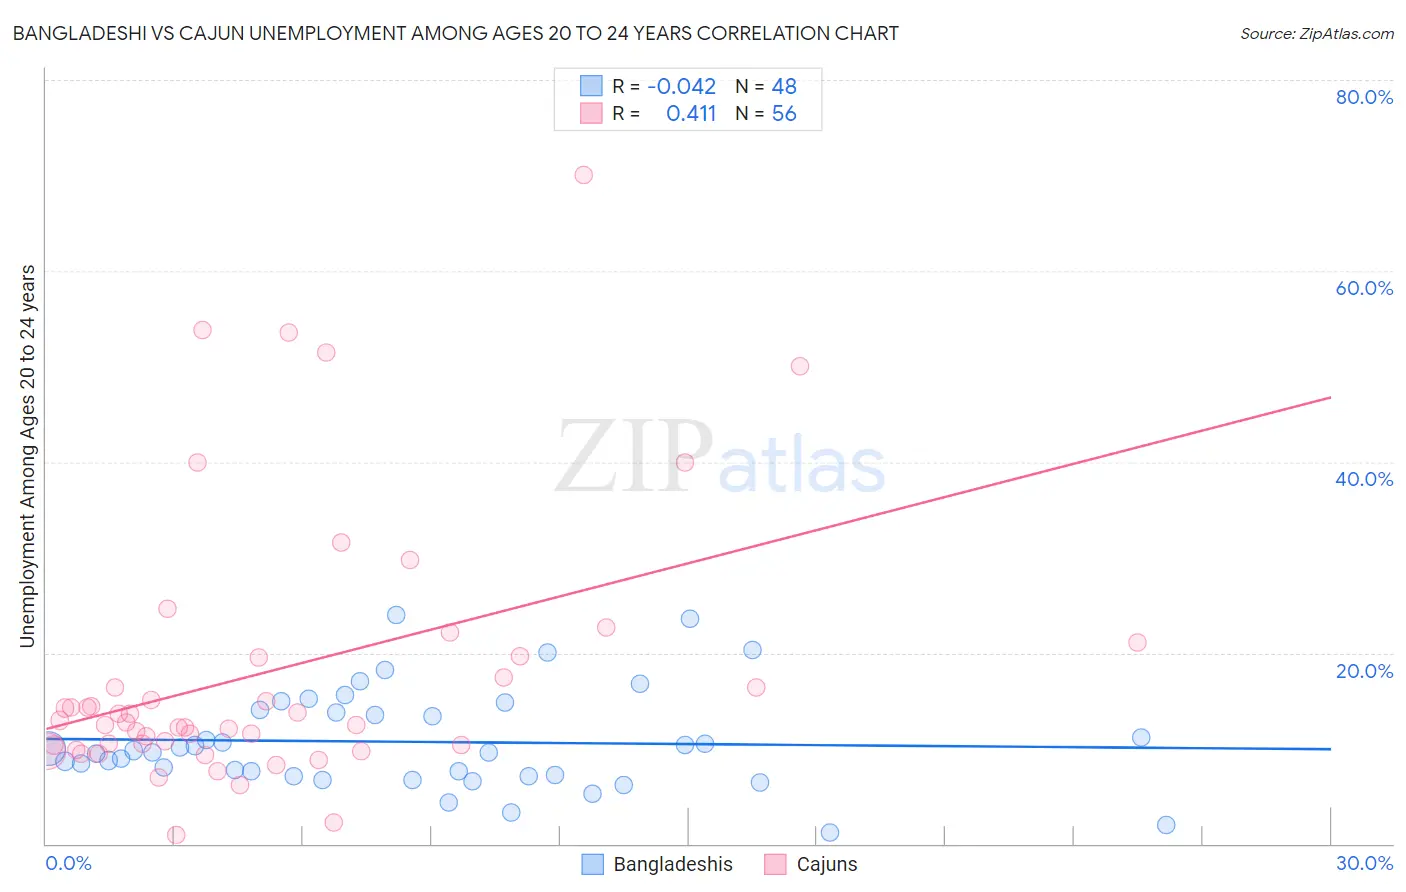
Bangladeshi vs Cajun Unemployment Among Ages 20 to 24 years Correlation Chart
The statistical analysis conducted on geographies consisting of 139,664,928 people shows no correlation between the proportion of Bangladeshis and unemployment rate among population between the ages 20 and 24 in the United States with a correlation coefficient (R) of -0.042 and weighted average of 10.0%. Similarly, the statistical analysis conducted on geographies consisting of 146,212,599 people shows a moderate positive correlation between the proportion of Cajuns and unemployment rate among population between the ages 20 and 24 in the United States with a correlation coefficient (R) of 0.411 and weighted average of 12.0%, a difference of 20.0%.
Unemployment Among Ages 20 to 24 years Correlation Summary
| Measurement | Bangladeshi | Cajun |
| Minimum | 1.2% | 0.88% |
| Maximum | 24.0% | 70.0% |
| Range | 22.8% | 69.1% |
| Mean | 10.7% | 18.1% |
| Median | 9.7% | 12.8% |
| Interquartile 25% (IQ1) | 7.2% | 10.3% |
| Interquartile 75% (IQ3) | 13.9% | 19.6% |
| Interquartile Range (IQR) | 6.8% | 9.2% |
| Standard Deviation (Sample) | 5.1% | 14.2% |
| Standard Deviation (Population) | 5.1% | 14.1% |
Similar Demographics by Unemployment Among Ages 20 to 24 years
Demographics Similar to Bangladeshis by Unemployment Among Ages 20 to 24 years
In terms of unemployment among ages 20 to 24 years, the demographic groups most similar to Bangladeshis are Bhutanese (10.0%, a difference of 0.010%), Immigrants from Malaysia (10.0%, a difference of 0.010%), Macedonian (10.0%, a difference of 0.040%), Chilean (10.0%, a difference of 0.040%), and Polish (10.0%, a difference of 0.060%).
| Demographics | Rating | Rank | Unemployment Among Ages 20 to 24 years |
| New Zealanders | 97.8 /100 | #85 | Exceptional 9.9% |
| Immigrants | Vietnam | 97.5 /100 | #86 | Exceptional 10.0% |
| Immigrants | Oceania | 97.4 /100 | #87 | Exceptional 10.0% |
| Poles | 97.1 /100 | #88 | Exceptional 10.0% |
| Macedonians | 97.0 /100 | #89 | Exceptional 10.0% |
| Chileans | 97.0 /100 | #90 | Exceptional 10.0% |
| Bhutanese | 96.9 /100 | #91 | Exceptional 10.0% |
| Bangladeshis | 96.9 /100 | #92 | Exceptional 10.0% |
| Immigrants | Malaysia | 96.9 /100 | #93 | Exceptional 10.0% |
| Immigrants | Micronesia | 96.6 /100 | #94 | Exceptional 10.0% |
| Scotch-Irish | 96.2 /100 | #95 | Exceptional 10.0% |
| Thais | 96.2 /100 | #96 | Exceptional 10.0% |
| Slavs | 96.1 /100 | #97 | Exceptional 10.0% |
| Japanese | 95.4 /100 | #98 | Exceptional 10.0% |
| Fijians | 95.3 /100 | #99 | Exceptional 10.0% |
Demographics Similar to Cajuns by Unemployment Among Ages 20 to 24 years
In terms of unemployment among ages 20 to 24 years, the demographic groups most similar to Cajuns are Blackfeet (12.0%, a difference of 0.010%), Immigrants from Armenia (12.0%, a difference of 0.030%), Immigrants from Belize (12.0%, a difference of 0.21%), Immigrants from Ghana (11.9%, a difference of 0.24%), and Immigrants from Senegal (11.9%, a difference of 0.47%).
| Demographics | Rating | Rank | Unemployment Among Ages 20 to 24 years |
| Belizeans | 0.0 /100 | #289 | Tragic 11.8% |
| Immigrants | Caribbean | 0.0 /100 | #290 | Tragic 11.8% |
| Central American Indians | 0.0 /100 | #291 | Tragic 11.9% |
| Immigrants | Senegal | 0.0 /100 | #292 | Tragic 11.9% |
| Immigrants | Ghana | 0.0 /100 | #293 | Tragic 11.9% |
| Immigrants | Belize | 0.0 /100 | #294 | Tragic 12.0% |
| Immigrants | Armenia | 0.0 /100 | #295 | Tragic 12.0% |
| Cajuns | 0.0 /100 | #296 | Tragic 12.0% |
| Blackfeet | 0.0 /100 | #297 | Tragic 12.0% |
| Lumbee | 0.0 /100 | #298 | Tragic 12.0% |
| Apache | 0.0 /100 | #299 | Tragic 12.0% |
| Spanish American Indians | 0.0 /100 | #300 | Tragic 12.1% |
| Immigrants | Sierra Leone | 0.0 /100 | #301 | Tragic 12.1% |
| Immigrants | Cabo Verde | 0.0 /100 | #302 | Tragic 12.2% |
| Haitians | 0.0 /100 | #303 | Tragic 12.2% |