Bahamian vs Belizean Unemployment Among Ages 35 to 44 years
COMPARE
Bahamian
Belizean
Unemployment Among Ages 35 to 44 years
Unemployment Among Ages 35 to 44 years Comparison
Bahamians
Belizeans
5.2%
UNEMPLOYMENT AMONG AGES 35 TO 44 YEARS
0.4/ 100
METRIC RATING
245th/ 347
METRIC RANK
5.7%
UNEMPLOYMENT AMONG AGES 35 TO 44 YEARS
0.0/ 100
METRIC RATING
305th/ 347
METRIC RANK
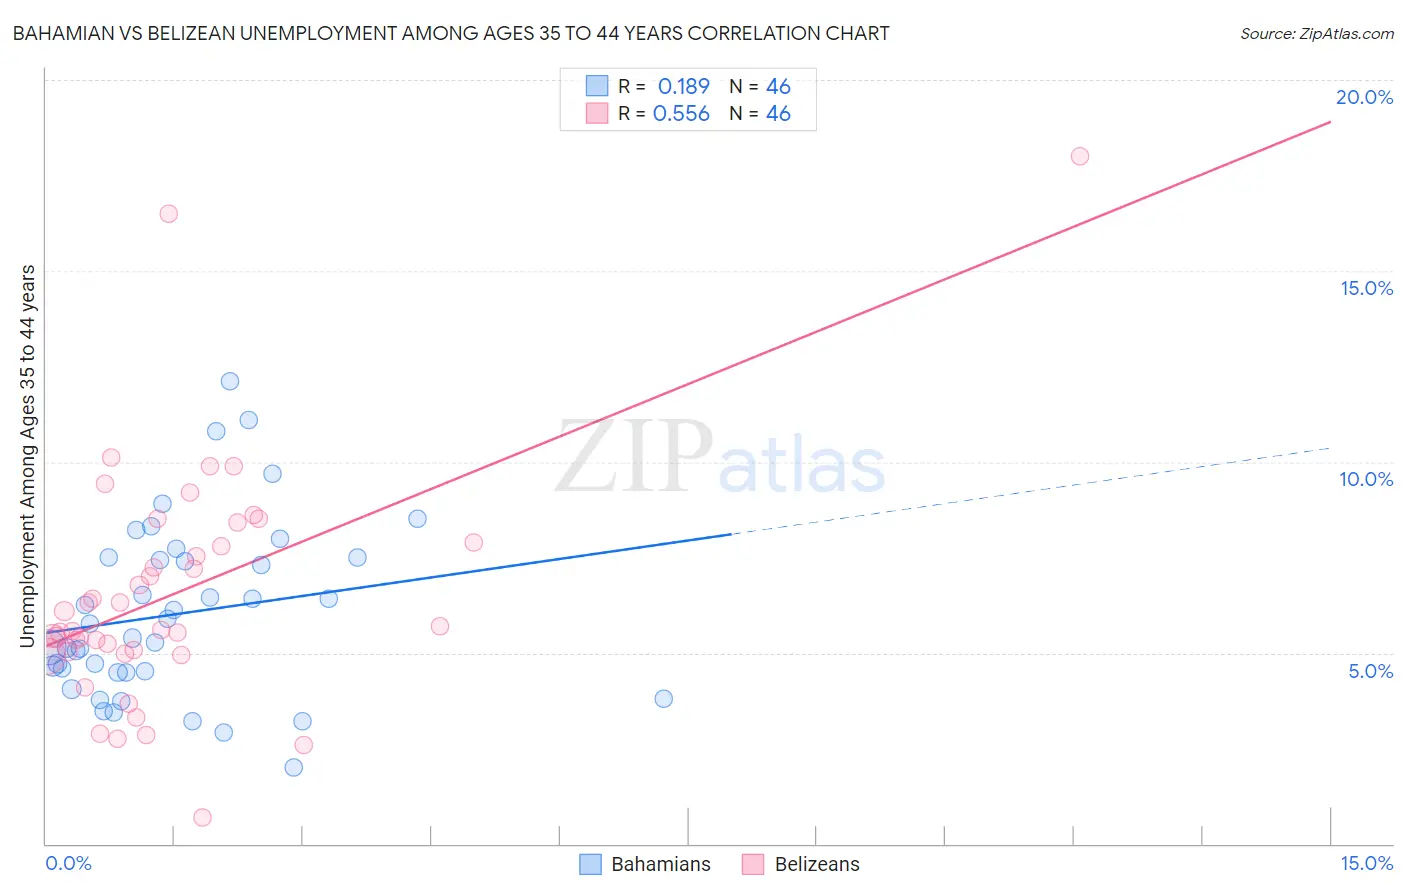
Bahamian vs Belizean Unemployment Among Ages 35 to 44 years Correlation Chart
The statistical analysis conducted on geographies consisting of 111,795,509 people shows a poor positive correlation between the proportion of Bahamians and unemployment rate among population between the ages 35 and 44 in the United States with a correlation coefficient (R) of 0.189 and weighted average of 5.2%. Similarly, the statistical analysis conducted on geographies consisting of 143,523,398 people shows a substantial positive correlation between the proportion of Belizeans and unemployment rate among population between the ages 35 and 44 in the United States with a correlation coefficient (R) of 0.556 and weighted average of 5.7%, a difference of 9.8%.
Unemployment Among Ages 35 to 44 years Correlation Summary
| Measurement | Bahamian | Belizean |
| Minimum | 2.0% | 0.70% |
| Maximum | 12.1% | 18.0% |
| Range | 10.1% | 17.3% |
| Mean | 6.0% | 6.6% |
| Median | 5.6% | 5.6% |
| Interquartile 25% (IQ1) | 4.5% | 5.0% |
| Interquartile 75% (IQ3) | 7.5% | 7.9% |
| Interquartile Range (IQR) | 3.0% | 2.9% |
| Standard Deviation (Sample) | 2.3% | 3.1% |
| Standard Deviation (Population) | 2.3% | 3.1% |
Similar Demographics by Unemployment Among Ages 35 to 44 years
Demographics Similar to Bahamians by Unemployment Among Ages 35 to 44 years
In terms of unemployment among ages 35 to 44 years, the demographic groups most similar to Bahamians are Immigrants from Guatemala (5.2%, a difference of 0.0%), Immigrants from Somalia (5.2%, a difference of 0.16%), Guatemalan (5.1%, a difference of 0.25%), Salvadoran (5.1%, a difference of 0.26%), and Delaware (5.1%, a difference of 0.38%).
| Demographics | Rating | Rank | Unemployment Among Ages 35 to 44 years |
| Hondurans | 0.7 /100 | #238 | Tragic 5.1% |
| Nigerians | 0.7 /100 | #239 | Tragic 5.1% |
| Somalis | 0.7 /100 | #240 | Tragic 5.1% |
| Immigrants | Honduras | 0.6 /100 | #241 | Tragic 5.1% |
| Delaware | 0.5 /100 | #242 | Tragic 5.1% |
| Salvadorans | 0.4 /100 | #243 | Tragic 5.1% |
| Guatemalans | 0.4 /100 | #244 | Tragic 5.1% |
| Bahamians | 0.4 /100 | #245 | Tragic 5.2% |
| Immigrants | Guatemala | 0.4 /100 | #246 | Tragic 5.2% |
| Immigrants | Somalia | 0.3 /100 | #247 | Tragic 5.2% |
| Alsatians | 0.2 /100 | #248 | Tragic 5.2% |
| Immigrants | Liberia | 0.2 /100 | #249 | Tragic 5.2% |
| Immigrants | El Salvador | 0.2 /100 | #250 | Tragic 5.2% |
| Comanche | 0.2 /100 | #251 | Tragic 5.2% |
| Armenians | 0.2 /100 | #252 | Tragic 5.2% |
Demographics Similar to Belizeans by Unemployment Among Ages 35 to 44 years
In terms of unemployment among ages 35 to 44 years, the demographic groups most similar to Belizeans are West Indian (5.7%, a difference of 0.14%), Yakama (5.6%, a difference of 0.40%), Nepalese (5.6%, a difference of 1.1%), Barbadian (5.7%, a difference of 1.2%), and African (5.6%, a difference of 1.2%).
| Demographics | Rating | Rank | Unemployment Among Ages 35 to 44 years |
| Aleuts | 0.0 /100 | #298 | Tragic 5.6% |
| Immigrants | Jamaica | 0.0 /100 | #299 | Tragic 5.6% |
| Immigrants | West Indies | 0.0 /100 | #300 | Tragic 5.6% |
| Africans | 0.0 /100 | #301 | Tragic 5.6% |
| Nepalese | 0.0 /100 | #302 | Tragic 5.6% |
| Yakama | 0.0 /100 | #303 | Tragic 5.6% |
| West Indians | 0.0 /100 | #304 | Tragic 5.7% |
| Belizeans | 0.0 /100 | #305 | Tragic 5.7% |
| Barbadians | 0.0 /100 | #306 | Tragic 5.7% |
| Immigrants | Belize | 0.0 /100 | #307 | Tragic 5.8% |
| Immigrants | Azores | 0.0 /100 | #308 | Tragic 5.8% |
| Immigrants | Barbados | 0.0 /100 | #309 | Tragic 5.8% |
| Guyanese | 0.0 /100 | #310 | Tragic 5.9% |
| Marshallese | 0.0 /100 | #311 | Tragic 5.9% |
| Immigrants | Guyana | 0.0 /100 | #312 | Tragic 6.0% |