Bahamian vs Belizean Female Unemployment
COMPARE
Bahamian
Belizean
Female Unemployment
Female Unemployment Comparison
Bahamians
Belizeans
6.0%
FEMALE UNEMPLOYMENT
0.0/ 100
METRIC RATING
276th/ 347
METRIC RANK
6.3%
FEMALE UNEMPLOYMENT
0.0/ 100
METRIC RATING
313th/ 347
METRIC RANK
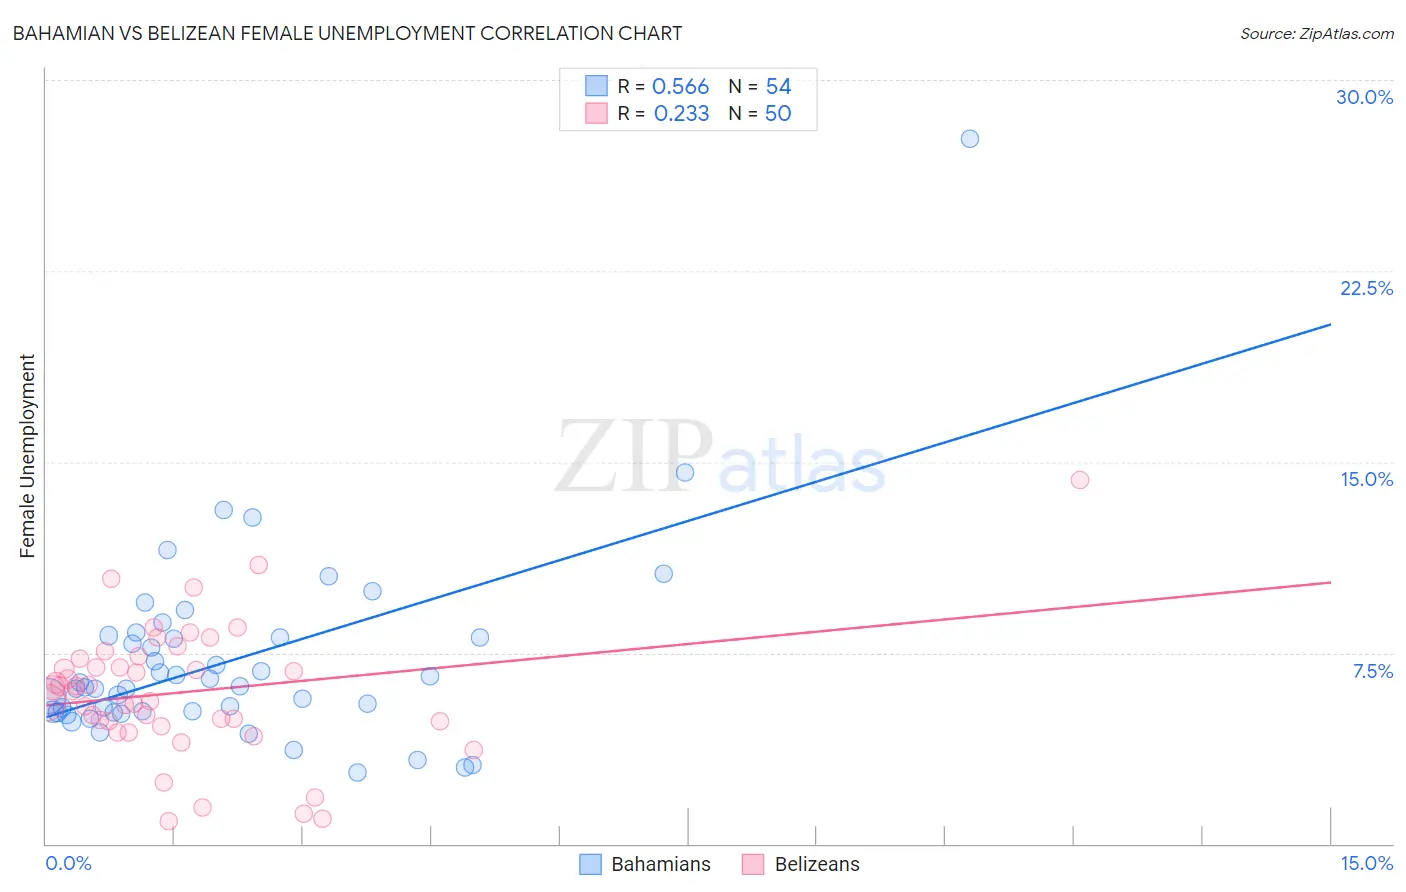
Bahamian vs Belizean Female Unemployment Correlation Chart
The statistical analysis conducted on geographies consisting of 112,545,227 people shows a substantial positive correlation between the proportion of Bahamians and unemploymnet rate among females in the United States with a correlation coefficient (R) of 0.566 and weighted average of 6.0%. Similarly, the statistical analysis conducted on geographies consisting of 144,062,837 people shows a weak positive correlation between the proportion of Belizeans and unemploymnet rate among females in the United States with a correlation coefficient (R) of 0.233 and weighted average of 6.3%, a difference of 6.1%.
Female Unemployment Correlation Summary
| Measurement | Bahamian | Belizean |
| Minimum | 2.8% | 0.90% |
| Maximum | 27.7% | 14.3% |
| Range | 24.9% | 13.4% |
| Mean | 7.2% | 6.0% |
| Median | 6.2% | 6.1% |
| Interquartile 25% (IQ1) | 5.2% | 4.8% |
| Interquartile 75% (IQ3) | 8.1% | 7.3% |
| Interquartile Range (IQR) | 2.9% | 2.5% |
| Standard Deviation (Sample) | 3.8% | 2.6% |
| Standard Deviation (Population) | 3.8% | 2.5% |
Similar Demographics by Female Unemployment
Demographics Similar to Bahamians by Female Unemployment
In terms of female unemployment, the demographic groups most similar to Bahamians are Senegalese (6.0%, a difference of 0.040%), Immigrants from Ghana (6.0%, a difference of 0.40%), Yaqui (6.0%, a difference of 0.40%), Armenian (6.0%, a difference of 0.51%), and African (5.9%, a difference of 0.53%).
| Demographics | Rating | Rank | Female Unemployment |
| Immigrants | Western Africa | 0.0 /100 | #269 | Tragic 5.9% |
| Immigrants | Honduras | 0.0 /100 | #270 | Tragic 5.9% |
| Central Americans | 0.0 /100 | #271 | Tragic 5.9% |
| Lumbee | 0.0 /100 | #272 | Tragic 5.9% |
| Ghanaians | 0.0 /100 | #273 | Tragic 5.9% |
| Africans | 0.0 /100 | #274 | Tragic 5.9% |
| Senegalese | 0.0 /100 | #275 | Tragic 6.0% |
| Bahamians | 0.0 /100 | #276 | Tragic 6.0% |
| Immigrants | Ghana | 0.0 /100 | #277 | Tragic 6.0% |
| Yaqui | 0.0 /100 | #278 | Tragic 6.0% |
| Armenians | 0.0 /100 | #279 | Tragic 6.0% |
| Mexican American Indians | 0.0 /100 | #280 | Tragic 6.0% |
| Guatemalans | 0.0 /100 | #281 | Tragic 6.0% |
| Colville | 0.0 /100 | #282 | Tragic 6.0% |
| Salvadorans | 0.0 /100 | #283 | Tragic 6.0% |
Demographics Similar to Belizeans by Female Unemployment
In terms of female unemployment, the demographic groups most similar to Belizeans are Immigrants from Grenada (6.3%, a difference of 0.010%), Immigrants from Ecuador (6.4%, a difference of 0.23%), Pueblo (6.4%, a difference of 0.54%), Immigrants from Mexico (6.3%, a difference of 0.67%), and Central American Indian (6.3%, a difference of 0.81%).
| Demographics | Rating | Rank | Female Unemployment |
| Immigrants | Central America | 0.0 /100 | #306 | Tragic 6.2% |
| Shoshone | 0.0 /100 | #307 | Tragic 6.2% |
| Hispanics or Latinos | 0.0 /100 | #308 | Tragic 6.2% |
| Ecuadorians | 0.0 /100 | #309 | Tragic 6.3% |
| Central American Indians | 0.0 /100 | #310 | Tragic 6.3% |
| Immigrants | Mexico | 0.0 /100 | #311 | Tragic 6.3% |
| Immigrants | Grenada | 0.0 /100 | #312 | Tragic 6.3% |
| Belizeans | 0.0 /100 | #313 | Tragic 6.3% |
| Immigrants | Ecuador | 0.0 /100 | #314 | Tragic 6.4% |
| Pueblo | 0.0 /100 | #315 | Tragic 6.4% |
| Houma | 0.0 /100 | #316 | Tragic 6.4% |
| Immigrants | St. Vincent and the Grenadines | 0.0 /100 | #317 | Tragic 6.4% |
| British West Indians | 0.0 /100 | #318 | Tragic 6.4% |
| Immigrants | Bangladesh | 0.0 /100 | #319 | Tragic 6.5% |
| Immigrants | Dominica | 0.0 /100 | #320 | Tragic 6.5% |