Assyrian/Chaldean/Syriac vs Iroquois Unemployment Among Ages 25 to 29 years
COMPARE
Assyrian/Chaldean/Syriac
Iroquois
Unemployment Among Ages 25 to 29 years
Unemployment Among Ages 25 to 29 years Comparison
Assyrians/Chaldeans/Syriacs
Iroquois
7.3%
UNEMPLOYMENT AMONG AGES 25 TO 29 YEARS
0.2/ 100
METRIC RATING
257th/ 347
METRIC RANK
7.5%
UNEMPLOYMENT AMONG AGES 25 TO 29 YEARS
0.0/ 100
METRIC RATING
277th/ 347
METRIC RANK
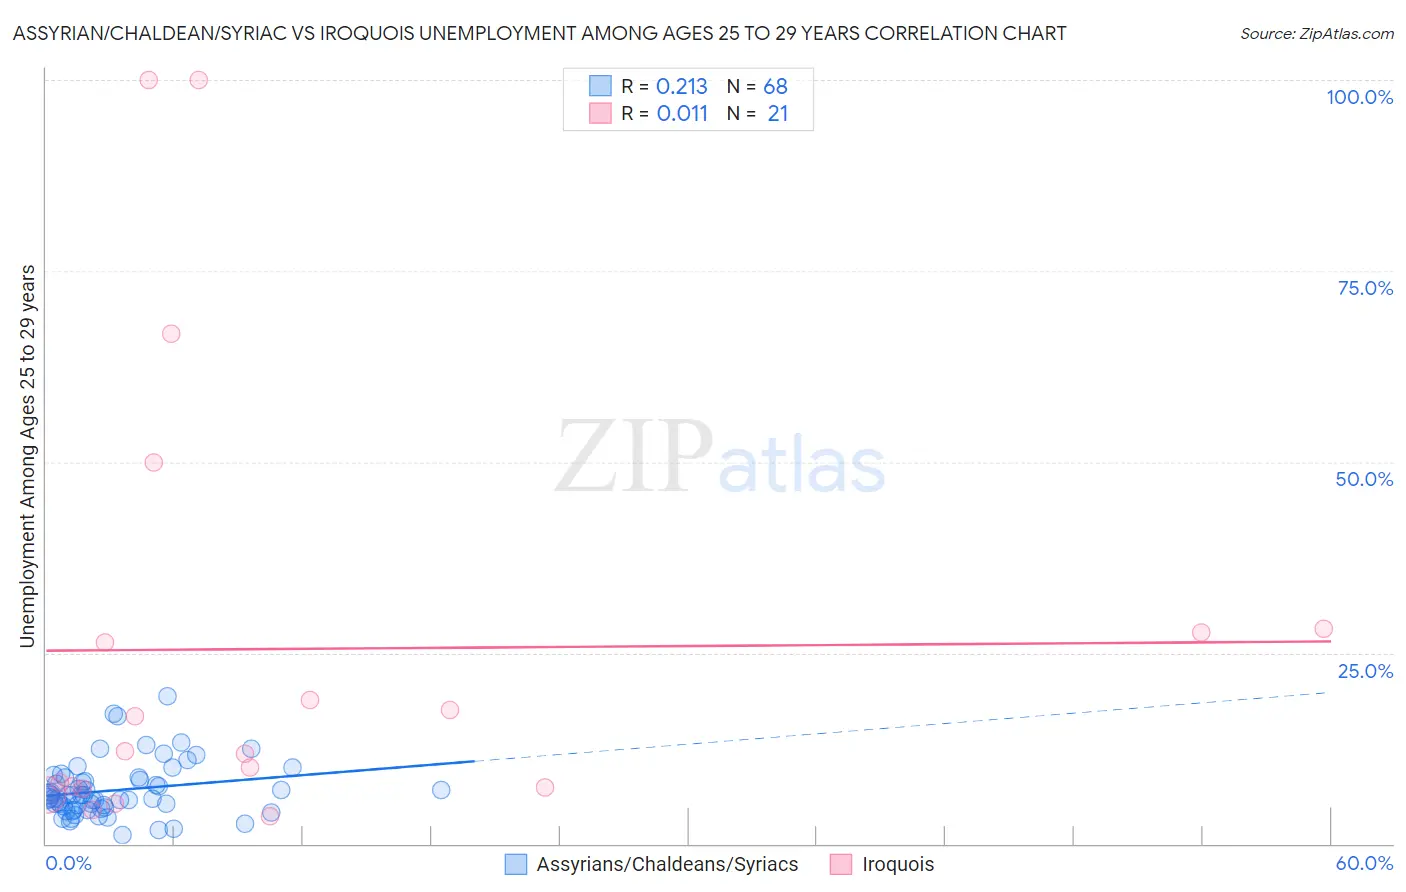
Assyrian/Chaldean/Syriac vs Iroquois Unemployment Among Ages 25 to 29 years Correlation Chart
The statistical analysis conducted on geographies consisting of 108,796,100 people shows a weak positive correlation between the proportion of Assyrians/Chaldeans/Syriacs and unemployment rate among population between the ages 25 and 29 in the United States with a correlation coefficient (R) of 0.213 and weighted average of 7.3%. Similarly, the statistical analysis conducted on geographies consisting of 200,181,681 people shows no correlation between the proportion of Iroquois and unemployment rate among population between the ages 25 and 29 in the United States with a correlation coefficient (R) of 0.011 and weighted average of 7.5%, a difference of 3.1%.
Unemployment Among Ages 25 to 29 years Correlation Summary
| Measurement | Assyrian/Chaldean/Syriac | Iroquois |
| Minimum | 1.2% | 3.6% |
| Maximum | 19.3% | 100.0% |
| Range | 18.1% | 96.4% |
| Mean | 7.0% | 25.5% |
| Median | 6.3% | 12.1% |
| Interquartile 25% (IQ1) | 4.8% | 7.3% |
| Interquartile 75% (IQ3) | 8.6% | 27.9% |
| Interquartile Range (IQR) | 3.7% | 20.6% |
| Standard Deviation (Sample) | 3.6% | 29.3% |
| Standard Deviation (Population) | 3.6% | 28.6% |
Demographics Similar to Assyrians/Chaldeans/Syriacs and Iroquois by Unemployment Among Ages 25 to 29 years
In terms of unemployment among ages 25 to 29 years, the demographic groups most similar to Assyrians/Chaldeans/Syriacs are Ottawa (7.3%, a difference of 0.40%), Cree (7.3%, a difference of 0.61%), American (7.4%, a difference of 1.1%), Nigerian (7.4%, a difference of 1.2%), and Ecuadorian (7.4%, a difference of 1.3%). Similarly, the demographic groups most similar to Iroquois are French American Indian (7.5%, a difference of 0.060%), Immigrants from Ghana (7.5%, a difference of 0.40%), Immigrants from Central America (7.5%, a difference of 0.49%), Immigrants from Nigeria (7.5%, a difference of 0.70%), and Immigrants from Bahamas (7.5%, a difference of 0.72%).
| Demographics | Rating | Rank | Unemployment Among Ages 25 to 29 years |
| Assyrians/Chaldeans/Syriacs | 0.2 /100 | #257 | Tragic 7.3% |
| Ottawa | 0.1 /100 | #258 | Tragic 7.3% |
| Cree | 0.1 /100 | #259 | Tragic 7.3% |
| Americans | 0.1 /100 | #260 | Tragic 7.4% |
| Nigerians | 0.1 /100 | #261 | Tragic 7.4% |
| Ecuadorians | 0.1 /100 | #262 | Tragic 7.4% |
| Kiowa | 0.1 /100 | #263 | Tragic 7.4% |
| Immigrants | Western Africa | 0.1 /100 | #264 | Tragic 7.4% |
| Immigrants | Fiji | 0.1 /100 | #265 | Tragic 7.4% |
| Paiute | 0.1 /100 | #266 | Tragic 7.4% |
| Pennsylvania Germans | 0.1 /100 | #267 | Tragic 7.4% |
| Immigrants | Ecuador | 0.1 /100 | #268 | Tragic 7.4% |
| Immigrants | Latin America | 0.1 /100 | #269 | Tragic 7.4% |
| Bahamians | 0.0 /100 | #270 | Tragic 7.5% |
| Choctaw | 0.0 /100 | #271 | Tragic 7.5% |
| Immigrants | Bahamas | 0.0 /100 | #272 | Tragic 7.5% |
| Immigrants | Nigeria | 0.0 /100 | #273 | Tragic 7.5% |
| Immigrants | Central America | 0.0 /100 | #274 | Tragic 7.5% |
| Immigrants | Ghana | 0.0 /100 | #275 | Tragic 7.5% |
| French American Indians | 0.0 /100 | #276 | Tragic 7.5% |
| Iroquois | 0.0 /100 | #277 | Tragic 7.5% |