Assyrian/Chaldean/Syriac vs Iroquois Child Poverty Among Boys Under 16
COMPARE
Assyrian/Chaldean/Syriac
Iroquois
Child Poverty Among Boys Under 16
Child Poverty Among Boys Under 16 Comparison
Assyrians/Chaldeans/Syriacs
Iroquois
13.6%
CHILD POVERTY AMONG BOYS UNDER 16
99.8/ 100
METRIC RATING
34th/ 347
METRIC RANK
19.6%
CHILD POVERTY AMONG BOYS UNDER 16
0.1/ 100
METRIC RATING
264th/ 347
METRIC RANK
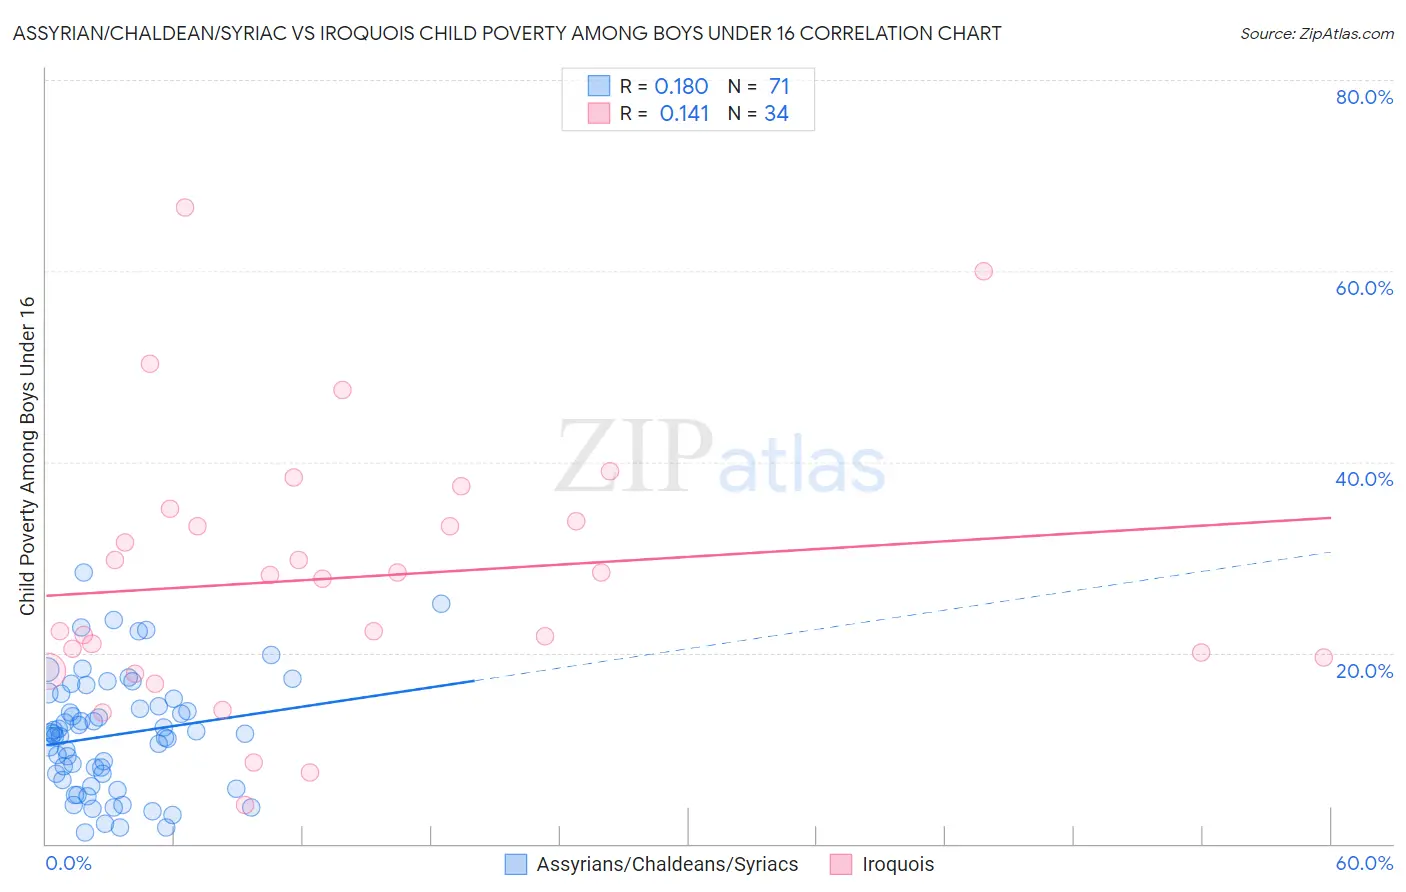
Assyrian/Chaldean/Syriac vs Iroquois Child Poverty Among Boys Under 16 Correlation Chart
The statistical analysis conducted on geographies consisting of 109,529,261 people shows a poor positive correlation between the proportion of Assyrians/Chaldeans/Syriacs and poverty level among boys under the age of 16 in the United States with a correlation coefficient (R) of 0.180 and weighted average of 13.6%. Similarly, the statistical analysis conducted on geographies consisting of 205,755,154 people shows a poor positive correlation between the proportion of Iroquois and poverty level among boys under the age of 16 in the United States with a correlation coefficient (R) of 0.141 and weighted average of 19.6%, a difference of 43.5%.
Child Poverty Among Boys Under 16 Correlation Summary
| Measurement | Assyrian/Chaldean/Syriac | Iroquois |
| Minimum | 1.2% | 4.1% |
| Maximum | 28.5% | 66.7% |
| Range | 27.3% | 62.6% |
| Mean | 11.4% | 27.9% |
| Median | 11.5% | 27.9% |
| Interquartile 25% (IQ1) | 6.7% | 19.5% |
| Interquartile 75% (IQ3) | 15.2% | 33.7% |
| Interquartile Range (IQR) | 8.4% | 14.3% |
| Standard Deviation (Sample) | 6.1% | 13.9% |
| Standard Deviation (Population) | 6.0% | 13.7% |
Similar Demographics by Child Poverty Among Boys Under 16
Demographics Similar to Assyrians/Chaldeans/Syriacs by Child Poverty Among Boys Under 16
In terms of child poverty among boys under 16, the demographic groups most similar to Assyrians/Chaldeans/Syriacs are Danish (13.6%, a difference of 0.11%), Immigrants from China (13.6%, a difference of 0.29%), Turkish (13.6%, a difference of 0.38%), Swedish (13.6%, a difference of 0.46%), and Cypriot (13.6%, a difference of 0.55%).
| Demographics | Rating | Rank | Child Poverty Among Boys Under 16 |
| Asians | 99.8 /100 | #27 | Exceptional 13.5% |
| Eastern Europeans | 99.8 /100 | #28 | Exceptional 13.5% |
| Cypriots | 99.8 /100 | #29 | Exceptional 13.6% |
| Swedes | 99.8 /100 | #30 | Exceptional 13.6% |
| Turks | 99.8 /100 | #31 | Exceptional 13.6% |
| Immigrants | China | 99.8 /100 | #32 | Exceptional 13.6% |
| Danes | 99.8 /100 | #33 | Exceptional 13.6% |
| Assyrians/Chaldeans/Syriacs | 99.8 /100 | #34 | Exceptional 13.6% |
| Russians | 99.7 /100 | #35 | Exceptional 13.8% |
| Luxembourgers | 99.7 /100 | #36 | Exceptional 13.8% |
| Immigrants | Sri Lanka | 99.6 /100 | #37 | Exceptional 13.9% |
| Immigrants | Northern Europe | 99.6 /100 | #38 | Exceptional 13.9% |
| Immigrants | Australia | 99.6 /100 | #39 | Exceptional 13.9% |
| Immigrants | Asia | 99.6 /100 | #40 | Exceptional 13.9% |
| Lithuanians | 99.6 /100 | #41 | Exceptional 14.0% |
Demographics Similar to Iroquois by Child Poverty Among Boys Under 16
In terms of child poverty among boys under 16, the demographic groups most similar to Iroquois are Guyanese (19.6%, a difference of 0.090%), Immigrants from El Salvador (19.6%, a difference of 0.14%), Vietnamese (19.6%, a difference of 0.15%), Ottawa (19.5%, a difference of 0.22%), and Spanish American Indian (19.6%, a difference of 0.26%).
| Demographics | Rating | Rank | Child Poverty Among Boys Under 16 |
| Mexican American Indians | 0.2 /100 | #257 | Tragic 19.4% |
| Potawatomi | 0.2 /100 | #258 | Tragic 19.4% |
| Spanish Americans | 0.2 /100 | #259 | Tragic 19.4% |
| Shoshone | 0.2 /100 | #260 | Tragic 19.4% |
| Immigrants | Ghana | 0.2 /100 | #261 | Tragic 19.4% |
| Immigrants | Guyana | 0.1 /100 | #262 | Tragic 19.5% |
| Ottawa | 0.1 /100 | #263 | Tragic 19.5% |
| Iroquois | 0.1 /100 | #264 | Tragic 19.6% |
| Guyanese | 0.1 /100 | #265 | Tragic 19.6% |
| Immigrants | El Salvador | 0.1 /100 | #266 | Tragic 19.6% |
| Vietnamese | 0.1 /100 | #267 | Tragic 19.6% |
| Spanish American Indians | 0.1 /100 | #268 | Tragic 19.6% |
| Immigrants | Cabo Verde | 0.1 /100 | #269 | Tragic 19.7% |
| Cherokee | 0.1 /100 | #270 | Tragic 19.7% |
| Chickasaw | 0.1 /100 | #271 | Tragic 19.8% |