Armenian vs Potawatomi Unemployment Among Women with Children Ages 6 to 17 years
COMPARE
Armenian
Potawatomi
Unemployment Among Women with Children Ages 6 to 17 years
Unemployment Among Women with Children Ages 6 to 17 years Comparison
Armenians
Potawatomi
8.3%
UNEMPLOYMENT AMONG WOMEN WITH CHILDREN AGES 6 TO 17 YEARS
99.9/ 100
METRIC RATING
67th/ 347
METRIC RANK
8.5%
UNEMPLOYMENT AMONG WOMEN WITH CHILDREN AGES 6 TO 17 YEARS
99.0/ 100
METRIC RATING
92nd/ 347
METRIC RANK
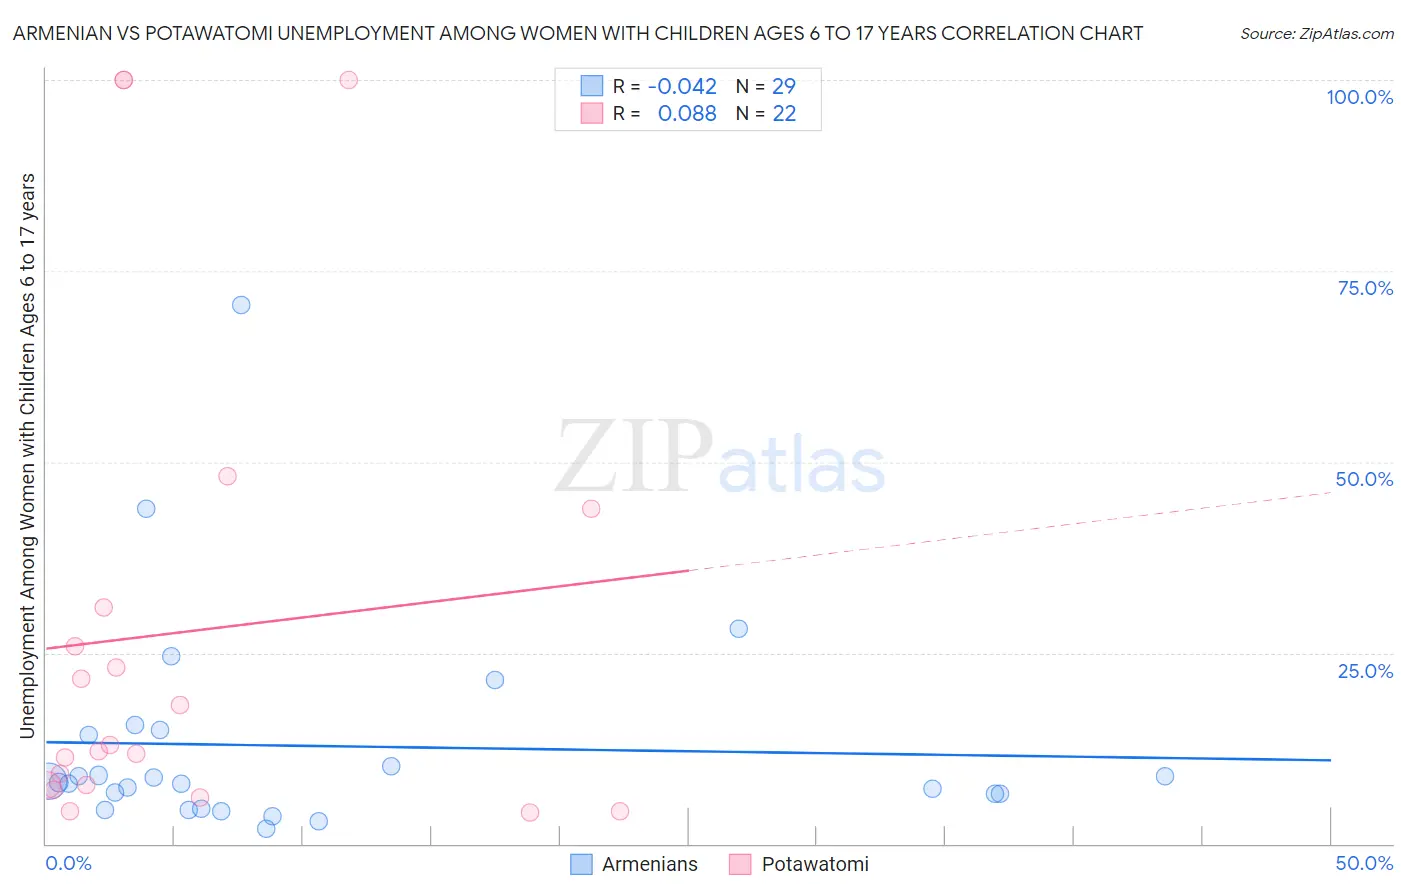
Armenian vs Potawatomi Unemployment Among Women with Children Ages 6 to 17 years Correlation Chart
The statistical analysis conducted on geographies consisting of 229,483,477 people shows no correlation between the proportion of Armenians and unemployment rate among women with children between the ages 6 and 17 in the United States with a correlation coefficient (R) of -0.042 and weighted average of 8.3%. Similarly, the statistical analysis conducted on geographies consisting of 100,614,314 people shows a slight positive correlation between the proportion of Potawatomi and unemployment rate among women with children between the ages 6 and 17 in the United States with a correlation coefficient (R) of 0.088 and weighted average of 8.5%, a difference of 2.6%.
Unemployment Among Women with Children Ages 6 to 17 years Correlation Summary
| Measurement | Armenian | Potawatomi |
| Minimum | 1.9% | 4.1% |
| Maximum | 70.6% | 100.0% |
| Range | 68.7% | 95.9% |
| Mean | 12.8% | 27.7% |
| Median | 8.0% | 12.5% |
| Interquartile 25% (IQ1) | 5.6% | 7.7% |
| Interquartile 75% (IQ3) | 14.6% | 31.0% |
| Interquartile Range (IQR) | 9.0% | 23.3% |
| Standard Deviation (Sample) | 14.2% | 31.8% |
| Standard Deviation (Population) | 14.0% | 31.0% |
Similar Demographics by Unemployment Among Women with Children Ages 6 to 17 years
Demographics Similar to Armenians by Unemployment Among Women with Children Ages 6 to 17 years
In terms of unemployment among women with children ages 6 to 17 years, the demographic groups most similar to Armenians are Marshallese (8.3%, a difference of 0.080%), Luxembourger (8.3%, a difference of 0.10%), Immigrants from Thailand (8.3%, a difference of 0.11%), Norwegian (8.3%, a difference of 0.19%), and Immigrants from Albania (8.3%, a difference of 0.23%).
| Demographics | Rating | Rank | Unemployment Among Women with Children Ages 6 to 17 years |
| Basques | 100.0 /100 | #60 | Exceptional 8.2% |
| Koreans | 100.0 /100 | #61 | Exceptional 8.2% |
| Spanish American Indians | 100.0 /100 | #62 | Exceptional 8.2% |
| Immigrants | South Eastern Asia | 99.9 /100 | #63 | Exceptional 8.2% |
| Immigrants | Kuwait | 99.9 /100 | #64 | Exceptional 8.3% |
| Immigrants | Albania | 99.9 /100 | #65 | Exceptional 8.3% |
| Luxembourgers | 99.9 /100 | #66 | Exceptional 8.3% |
| Armenians | 99.9 /100 | #67 | Exceptional 8.3% |
| Marshallese | 99.9 /100 | #68 | Exceptional 8.3% |
| Immigrants | Thailand | 99.9 /100 | #69 | Exceptional 8.3% |
| Norwegians | 99.9 /100 | #70 | Exceptional 8.3% |
| Immigrants | Australia | 99.8 /100 | #71 | Exceptional 8.3% |
| Immigrants | Nepal | 99.8 /100 | #72 | Exceptional 8.3% |
| Spanish Americans | 99.8 /100 | #73 | Exceptional 8.4% |
| Samoans | 99.7 /100 | #74 | Exceptional 8.4% |
Demographics Similar to Potawatomi by Unemployment Among Women with Children Ages 6 to 17 years
In terms of unemployment among women with children ages 6 to 17 years, the demographic groups most similar to Potawatomi are Immigrants from Eastern Europe (8.5%, a difference of 0.030%), Yugoslavian (8.5%, a difference of 0.090%), Australian (8.5%, a difference of 0.12%), Paiute (8.5%, a difference of 0.13%), and Immigrants from Vietnam (8.5%, a difference of 0.21%).
| Demographics | Rating | Rank | Unemployment Among Women with Children Ages 6 to 17 years |
| Immigrants | North Macedonia | 99.4 /100 | #85 | Exceptional 8.5% |
| Alaskan Athabascans | 99.4 /100 | #86 | Exceptional 8.5% |
| Immigrants | Israel | 99.1 /100 | #87 | Exceptional 8.5% |
| Immigrants | Vietnam | 99.1 /100 | #88 | Exceptional 8.5% |
| Paiute | 99.1 /100 | #89 | Exceptional 8.5% |
| Yugoslavians | 99.0 /100 | #90 | Exceptional 8.5% |
| Immigrants | Eastern Europe | 99.0 /100 | #91 | Exceptional 8.5% |
| Potawatomi | 99.0 /100 | #92 | Exceptional 8.5% |
| Australians | 98.9 /100 | #93 | Exceptional 8.5% |
| Immigrants | Barbados | 98.8 /100 | #94 | Exceptional 8.5% |
| Sri Lankans | 98.7 /100 | #95 | Exceptional 8.5% |
| German Russians | 98.6 /100 | #96 | Exceptional 8.5% |
| Bolivians | 98.5 /100 | #97 | Exceptional 8.5% |
| Malaysians | 98.5 /100 | #98 | Exceptional 8.6% |
| Immigrants | Lithuania | 98.4 /100 | #99 | Exceptional 8.6% |