Albanian vs Immigrants from Zaire Unemployment Among Ages 30 to 34 years
COMPARE
Albanian
Immigrants from Zaire
Unemployment Among Ages 30 to 34 years
Unemployment Among Ages 30 to 34 years Comparison
Albanians
Immigrants from Zaire
5.4%
UNEMPLOYMENT AMONG AGES 30 TO 34 YEARS
63.7/ 100
METRIC RATING
157th/ 347
METRIC RANK
5.0%
UNEMPLOYMENT AMONG AGES 30 TO 34 YEARS
99.3/ 100
METRIC RATING
32nd/ 347
METRIC RANK
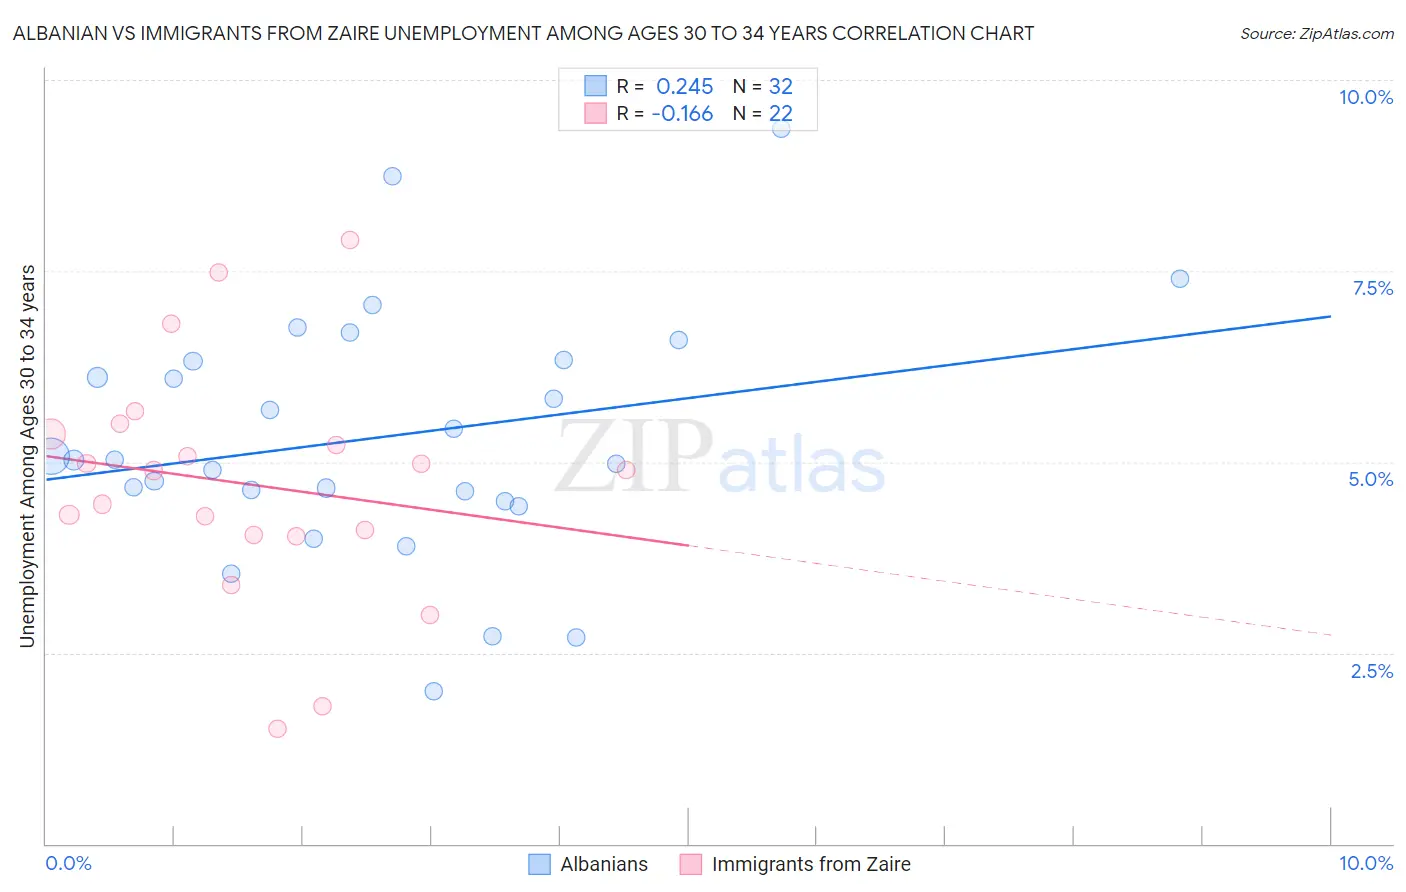
Albanian vs Immigrants from Zaire Unemployment Among Ages 30 to 34 years Correlation Chart
The statistical analysis conducted on geographies consisting of 186,030,176 people shows a weak positive correlation between the proportion of Albanians and unemployment rate among population between the ages 30 and 34 in the United States with a correlation coefficient (R) of 0.245 and weighted average of 5.4%. Similarly, the statistical analysis conducted on geographies consisting of 105,959,857 people shows a poor negative correlation between the proportion of Immigrants from Zaire and unemployment rate among population between the ages 30 and 34 in the United States with a correlation coefficient (R) of -0.166 and weighted average of 5.0%, a difference of 8.4%.
Unemployment Among Ages 30 to 34 years Correlation Summary
| Measurement | Albanian | Immigrants from Zaire |
| Minimum | 2.0% | 1.5% |
| Maximum | 9.4% | 7.9% |
| Range | 7.4% | 6.4% |
| Mean | 5.3% | 4.7% |
| Median | 5.0% | 4.9% |
| Interquartile 25% (IQ1) | 4.6% | 4.0% |
| Interquartile 75% (IQ3) | 6.3% | 5.4% |
| Interquartile Range (IQR) | 1.8% | 1.3% |
| Standard Deviation (Sample) | 1.6% | 1.5% |
| Standard Deviation (Population) | 1.6% | 1.5% |
Similar Demographics by Unemployment Among Ages 30 to 34 years
Demographics Similar to Albanians by Unemployment Among Ages 30 to 34 years
In terms of unemployment among ages 30 to 34 years, the demographic groups most similar to Albanians are Czechoslovakian (5.4%, a difference of 0.010%), Immigrants from Belarus (5.4%, a difference of 0.070%), Immigrants from Hungary (5.4%, a difference of 0.19%), Immigrants from Croatia (5.4%, a difference of 0.20%), and Immigrants from South Eastern Asia (5.4%, a difference of 0.22%).
| Demographics | Rating | Rank | Unemployment Among Ages 30 to 34 years |
| Colombians | 68.7 /100 | #150 | Good 5.4% |
| Immigrants | Oceania | 68.1 /100 | #151 | Good 5.4% |
| Lebanese | 67.2 /100 | #152 | Good 5.4% |
| Immigrants | South Eastern Asia | 66.5 /100 | #153 | Good 5.4% |
| South Africans | 66.5 /100 | #154 | Good 5.4% |
| Immigrants | Hungary | 66.1 /100 | #155 | Good 5.4% |
| Czechoslovakians | 63.7 /100 | #156 | Good 5.4% |
| Albanians | 63.7 /100 | #157 | Good 5.4% |
| Immigrants | Belarus | 62.7 /100 | #158 | Good 5.4% |
| Immigrants | Croatia | 61.0 /100 | #159 | Good 5.4% |
| Immigrants | Scotland | 59.3 /100 | #160 | Average 5.4% |
| Austrians | 59.0 /100 | #161 | Average 5.4% |
| Brazilians | 58.2 /100 | #162 | Average 5.4% |
| Arabs | 57.7 /100 | #163 | Average 5.4% |
| Basques | 57.3 /100 | #164 | Average 5.4% |
Demographics Similar to Immigrants from Zaire by Unemployment Among Ages 30 to 34 years
In terms of unemployment among ages 30 to 34 years, the demographic groups most similar to Immigrants from Zaire are Somali (5.0%, a difference of 0.040%), Immigrants from Saudi Arabia (5.0%, a difference of 0.10%), Norwegian (5.0%, a difference of 0.13%), Latvian (5.0%, a difference of 0.14%), and German Russian (5.0%, a difference of 0.15%).
| Demographics | Rating | Rank | Unemployment Among Ages 30 to 34 years |
| Immigrants | Singapore | 99.5 /100 | #25 | Exceptional 5.0% |
| Immigrants | Kuwait | 99.5 /100 | #26 | Exceptional 5.0% |
| Danes | 99.5 /100 | #27 | Exceptional 5.0% |
| Immigrants | Cuba | 99.4 /100 | #28 | Exceptional 5.0% |
| German Russians | 99.4 /100 | #29 | Exceptional 5.0% |
| Norwegians | 99.4 /100 | #30 | Exceptional 5.0% |
| Somalis | 99.3 /100 | #31 | Exceptional 5.0% |
| Immigrants | Zaire | 99.3 /100 | #32 | Exceptional 5.0% |
| Immigrants | Saudi Arabia | 99.3 /100 | #33 | Exceptional 5.0% |
| Latvians | 99.3 /100 | #34 | Exceptional 5.0% |
| Immigrants | Ethiopia | 99.2 /100 | #35 | Exceptional 5.0% |
| Czechs | 99.2 /100 | #36 | Exceptional 5.0% |
| Immigrants | Turkey | 99.0 /100 | #37 | Exceptional 5.0% |
| Sri Lankans | 99.0 /100 | #38 | Exceptional 5.0% |
| Fijians | 99.0 /100 | #39 | Exceptional 5.0% |