Albanian vs Black/African American Unemployment Among Ages 30 to 34 years
COMPARE
Albanian
Black/African American
Unemployment Among Ages 30 to 34 years
Unemployment Among Ages 30 to 34 years Comparison
Albanians
Blacks/African Americans
5.4%
UNEMPLOYMENT AMONG AGES 30 TO 34 YEARS
63.7/ 100
METRIC RATING
157th/ 347
METRIC RANK
7.2%
UNEMPLOYMENT AMONG AGES 30 TO 34 YEARS
0.0/ 100
METRIC RATING
318th/ 347
METRIC RANK
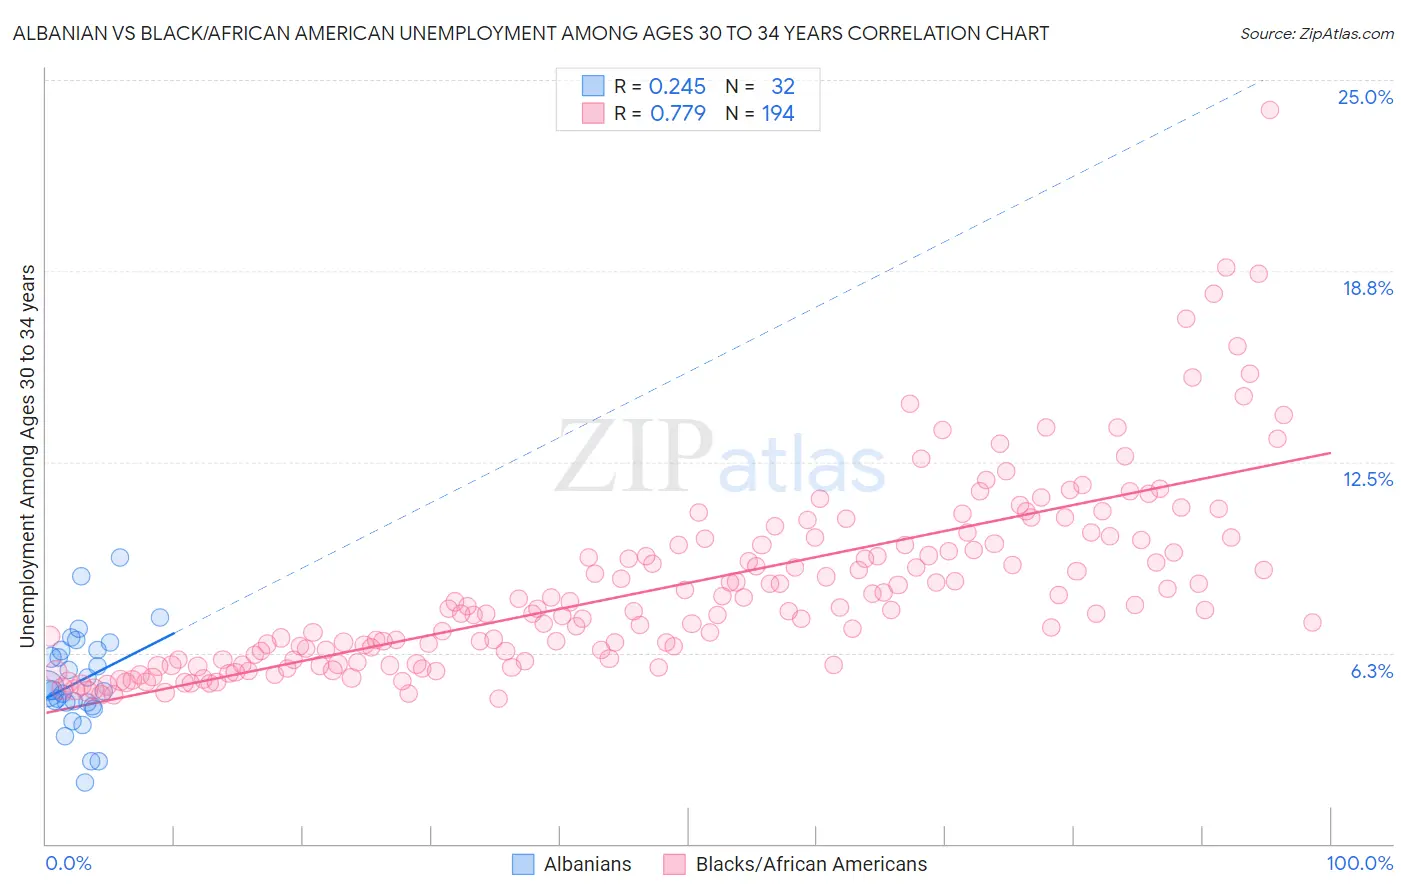
Albanian vs Black/African American Unemployment Among Ages 30 to 34 years Correlation Chart
The statistical analysis conducted on geographies consisting of 186,030,176 people shows a weak positive correlation between the proportion of Albanians and unemployment rate among population between the ages 30 and 34 in the United States with a correlation coefficient (R) of 0.245 and weighted average of 5.4%. Similarly, the statistical analysis conducted on geographies consisting of 499,385,483 people shows a strong positive correlation between the proportion of Blacks/African Americans and unemployment rate among population between the ages 30 and 34 in the United States with a correlation coefficient (R) of 0.779 and weighted average of 7.2%, a difference of 32.8%.
Unemployment Among Ages 30 to 34 years Correlation Summary
| Measurement | Albanian | Black/African American |
| Minimum | 2.0% | 4.7% |
| Maximum | 9.4% | 24.0% |
| Range | 7.4% | 19.3% |
| Mean | 5.3% | 8.4% |
| Median | 5.0% | 7.7% |
| Interquartile 25% (IQ1) | 4.6% | 6.0% |
| Interquartile 75% (IQ3) | 6.3% | 9.8% |
| Interquartile Range (IQR) | 1.8% | 3.8% |
| Standard Deviation (Sample) | 1.6% | 3.1% |
| Standard Deviation (Population) | 1.6% | 3.1% |
Similar Demographics by Unemployment Among Ages 30 to 34 years
Demographics Similar to Albanians by Unemployment Among Ages 30 to 34 years
In terms of unemployment among ages 30 to 34 years, the demographic groups most similar to Albanians are Czechoslovakian (5.4%, a difference of 0.010%), Immigrants from Belarus (5.4%, a difference of 0.070%), Immigrants from Hungary (5.4%, a difference of 0.19%), Immigrants from Croatia (5.4%, a difference of 0.20%), and Immigrants from South Eastern Asia (5.4%, a difference of 0.22%).
| Demographics | Rating | Rank | Unemployment Among Ages 30 to 34 years |
| Colombians | 68.7 /100 | #150 | Good 5.4% |
| Immigrants | Oceania | 68.1 /100 | #151 | Good 5.4% |
| Lebanese | 67.2 /100 | #152 | Good 5.4% |
| Immigrants | South Eastern Asia | 66.5 /100 | #153 | Good 5.4% |
| South Africans | 66.5 /100 | #154 | Good 5.4% |
| Immigrants | Hungary | 66.1 /100 | #155 | Good 5.4% |
| Czechoslovakians | 63.7 /100 | #156 | Good 5.4% |
| Albanians | 63.7 /100 | #157 | Good 5.4% |
| Immigrants | Belarus | 62.7 /100 | #158 | Good 5.4% |
| Immigrants | Croatia | 61.0 /100 | #159 | Good 5.4% |
| Immigrants | Scotland | 59.3 /100 | #160 | Average 5.4% |
| Austrians | 59.0 /100 | #161 | Average 5.4% |
| Brazilians | 58.2 /100 | #162 | Average 5.4% |
| Arabs | 57.7 /100 | #163 | Average 5.4% |
| Basques | 57.3 /100 | #164 | Average 5.4% |
Demographics Similar to Blacks/African Americans by Unemployment Among Ages 30 to 34 years
In terms of unemployment among ages 30 to 34 years, the demographic groups most similar to Blacks/African Americans are Guyanese (7.2%, a difference of 0.060%), Cape Verdean (7.2%, a difference of 0.090%), Immigrants from Cabo Verde (7.2%, a difference of 0.10%), Houma (7.2%, a difference of 0.37%), and Immigrants from Guyana (7.2%, a difference of 0.38%).
| Demographics | Rating | Rank | Unemployment Among Ages 30 to 34 years |
| Alaskan Athabascans | 0.0 /100 | #311 | Tragic 7.0% |
| British West Indians | 0.0 /100 | #312 | Tragic 7.0% |
| Ute | 0.0 /100 | #313 | Tragic 7.0% |
| Lumbee | 0.0 /100 | #314 | Tragic 7.1% |
| Aleuts | 0.0 /100 | #315 | Tragic 7.1% |
| Houma | 0.0 /100 | #316 | Tragic 7.2% |
| Immigrants | Cabo Verde | 0.0 /100 | #317 | Tragic 7.2% |
| Blacks/African Americans | 0.0 /100 | #318 | Tragic 7.2% |
| Guyanese | 0.0 /100 | #319 | Tragic 7.2% |
| Cape Verdeans | 0.0 /100 | #320 | Tragic 7.2% |
| Immigrants | Guyana | 0.0 /100 | #321 | Tragic 7.2% |
| Marshallese | 0.0 /100 | #322 | Tragic 7.2% |
| Immigrants | Yemen | 0.0 /100 | #323 | Tragic 7.3% |
| Immigrants | Dominica | 0.0 /100 | #324 | Tragic 7.3% |
| Apache | 0.0 /100 | #325 | Tragic 7.3% |