Alaska Native vs Yakama Unemployment Among Women with Children Under 6 years
COMPARE
Alaska Native
Yakama
Unemployment Among Women with Children Under 6 years
Unemployment Among Women with Children Under 6 years Comparison
Alaska Natives
Yakama
9.6%
UNEMPLOYMENT AMONG WOMEN WITH CHILDREN UNDER 6 YEARS
0.0/ 100
METRIC RATING
322nd/ 347
METRIC RANK
6.6%
UNEMPLOYMENT AMONG WOMEN WITH CHILDREN UNDER 6 YEARS
100.0/ 100
METRIC RATING
35th/ 347
METRIC RANK
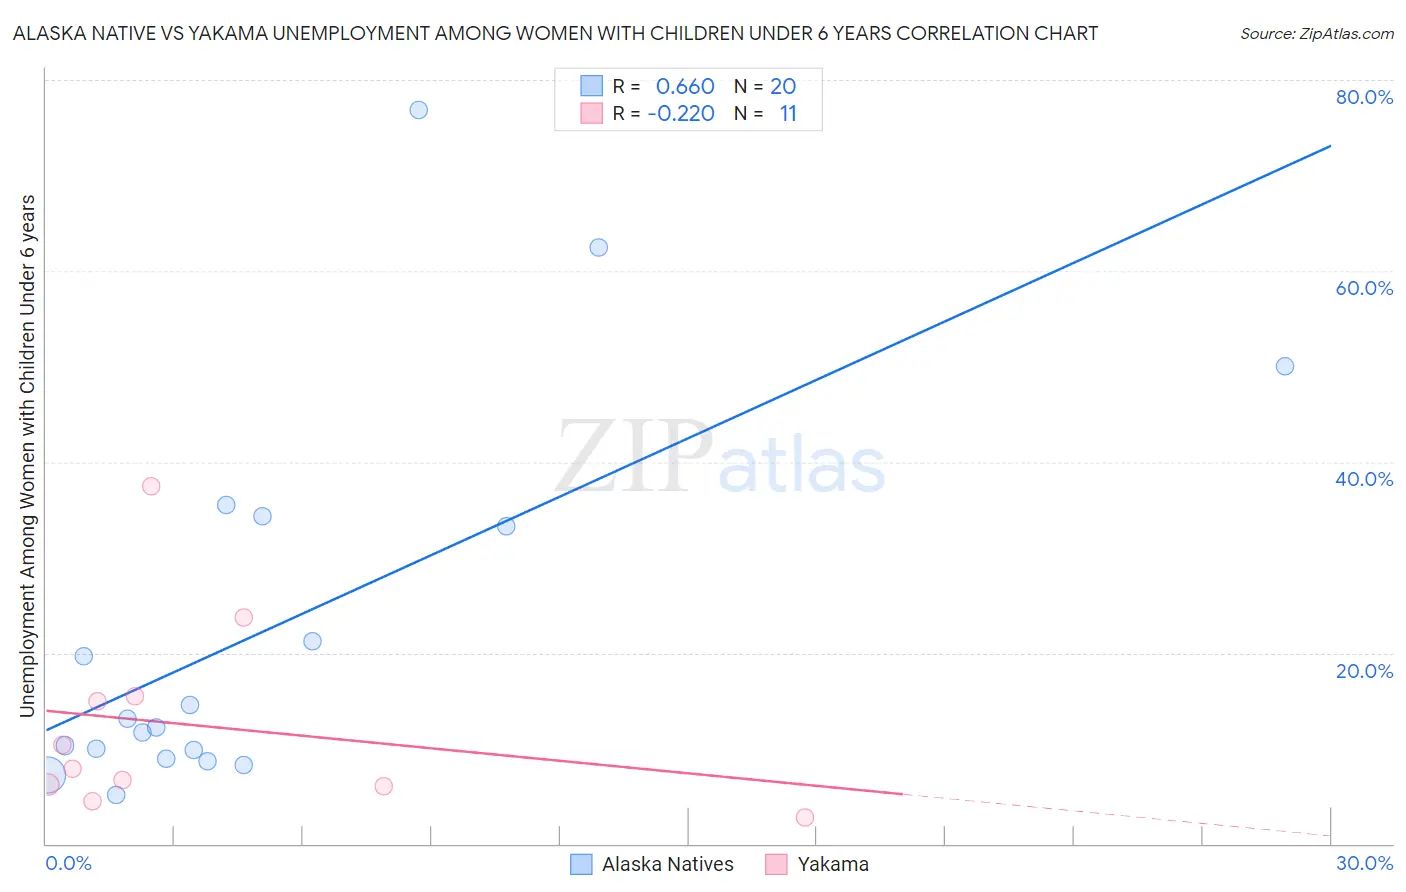
Alaska Native vs Yakama Unemployment Among Women with Children Under 6 years Correlation Chart
The statistical analysis conducted on geographies consisting of 70,993,722 people shows a significant positive correlation between the proportion of Alaska Natives and unemployment rate among women with children under the age of 6 in the United States with a correlation coefficient (R) of 0.660 and weighted average of 9.6%. Similarly, the statistical analysis conducted on geographies consisting of 17,322,416 people shows a weak negative correlation between the proportion of Yakama and unemployment rate among women with children under the age of 6 in the United States with a correlation coefficient (R) of -0.220 and weighted average of 6.6%, a difference of 45.1%.
Unemployment Among Women with Children Under 6 years Correlation Summary
| Measurement | Alaska Native | Yakama |
| Minimum | 5.1% | 2.8% |
| Maximum | 76.9% | 37.5% |
| Range | 71.8% | 34.7% |
| Mean | 22.6% | 12.3% |
| Median | 12.7% | 7.9% |
| Interquartile 25% (IQ1) | 9.4% | 6.0% |
| Interquartile 75% (IQ3) | 33.8% | 15.4% |
| Interquartile Range (IQR) | 24.4% | 9.4% |
| Standard Deviation (Sample) | 20.1% | 10.3% |
| Standard Deviation (Population) | 19.6% | 9.8% |
Similar Demographics by Unemployment Among Women with Children Under 6 years
Demographics Similar to Alaska Natives by Unemployment Among Women with Children Under 6 years
In terms of unemployment among women with children under 6 years, the demographic groups most similar to Alaska Natives are Immigrants from Bahamas (9.6%, a difference of 0.19%), Central American Indian (9.6%, a difference of 0.25%), Potawatomi (9.6%, a difference of 0.31%), Marshallese (9.6%, a difference of 0.36%), and Paiute (9.7%, a difference of 0.89%).
| Demographics | Rating | Rank | Unemployment Among Women with Children Under 6 years |
| Cherokee | 0.0 /100 | #315 | Tragic 9.3% |
| Houma | 0.0 /100 | #316 | Tragic 9.4% |
| Dutch West Indians | 0.0 /100 | #317 | Tragic 9.5% |
| Osage | 0.0 /100 | #318 | Tragic 9.5% |
| Marshallese | 0.0 /100 | #319 | Tragic 9.6% |
| Potawatomi | 0.0 /100 | #320 | Tragic 9.6% |
| Central American Indians | 0.0 /100 | #321 | Tragic 9.6% |
| Alaska Natives | 0.0 /100 | #322 | Tragic 9.6% |
| Immigrants | Bahamas | 0.0 /100 | #323 | Tragic 9.6% |
| Paiute | 0.0 /100 | #324 | Tragic 9.7% |
| Choctaw | 0.0 /100 | #325 | Tragic 9.8% |
| Delaware | 0.0 /100 | #326 | Tragic 9.8% |
| Ottawa | 0.0 /100 | #327 | Tragic 9.9% |
| Tohono O'odham | 0.0 /100 | #328 | Tragic 10.2% |
| Blacks/African Americans | 0.0 /100 | #329 | Tragic 10.3% |
Demographics Similar to Yakama by Unemployment Among Women with Children Under 6 years
In terms of unemployment among women with children under 6 years, the demographic groups most similar to Yakama are Luxembourger (6.6%, a difference of 0.070%), Immigrants from South Central Asia (6.6%, a difference of 0.27%), Immigrants from Vietnam (6.6%, a difference of 0.28%), Tsimshian (6.6%, a difference of 0.30%), and Sri Lankan (6.6%, a difference of 0.32%).
| Demographics | Rating | Rank | Unemployment Among Women with Children Under 6 years |
| Immigrants | Israel | 100.0 /100 | #28 | Exceptional 6.5% |
| Immigrants | Sweden | 100.0 /100 | #29 | Exceptional 6.6% |
| Immigrants | Belarus | 100.0 /100 | #30 | Exceptional 6.6% |
| Immigrants | Moldova | 100.0 /100 | #31 | Exceptional 6.6% |
| Tsimshian | 100.0 /100 | #32 | Exceptional 6.6% |
| Immigrants | Vietnam | 100.0 /100 | #33 | Exceptional 6.6% |
| Immigrants | South Central Asia | 100.0 /100 | #34 | Exceptional 6.6% |
| Yakama | 100.0 /100 | #35 | Exceptional 6.6% |
| Luxembourgers | 100.0 /100 | #36 | Exceptional 6.6% |
| Sri Lankans | 100.0 /100 | #37 | Exceptional 6.6% |
| Hmong | 100.0 /100 | #38 | Exceptional 6.7% |
| Immigrants | Russia | 100.0 /100 | #39 | Exceptional 6.7% |
| Asians | 100.0 /100 | #40 | Exceptional 6.7% |
| Immigrants | Indonesia | 99.9 /100 | #41 | Exceptional 6.7% |
| Immigrants | Cuba | 99.9 /100 | #42 | Exceptional 6.7% |