Alaska Native vs Yakama Currently Married
COMPARE
Alaska Native
Yakama
Currently Married
Currently Married Comparison
Alaska Natives
Yakama
45.5%
CURRENTLY MARRIED
7.0/ 100
METRIC RATING
213th/ 347
METRIC RANK
44.0%
CURRENTLY MARRIED
0.2/ 100
METRIC RATING
255th/ 347
METRIC RANK
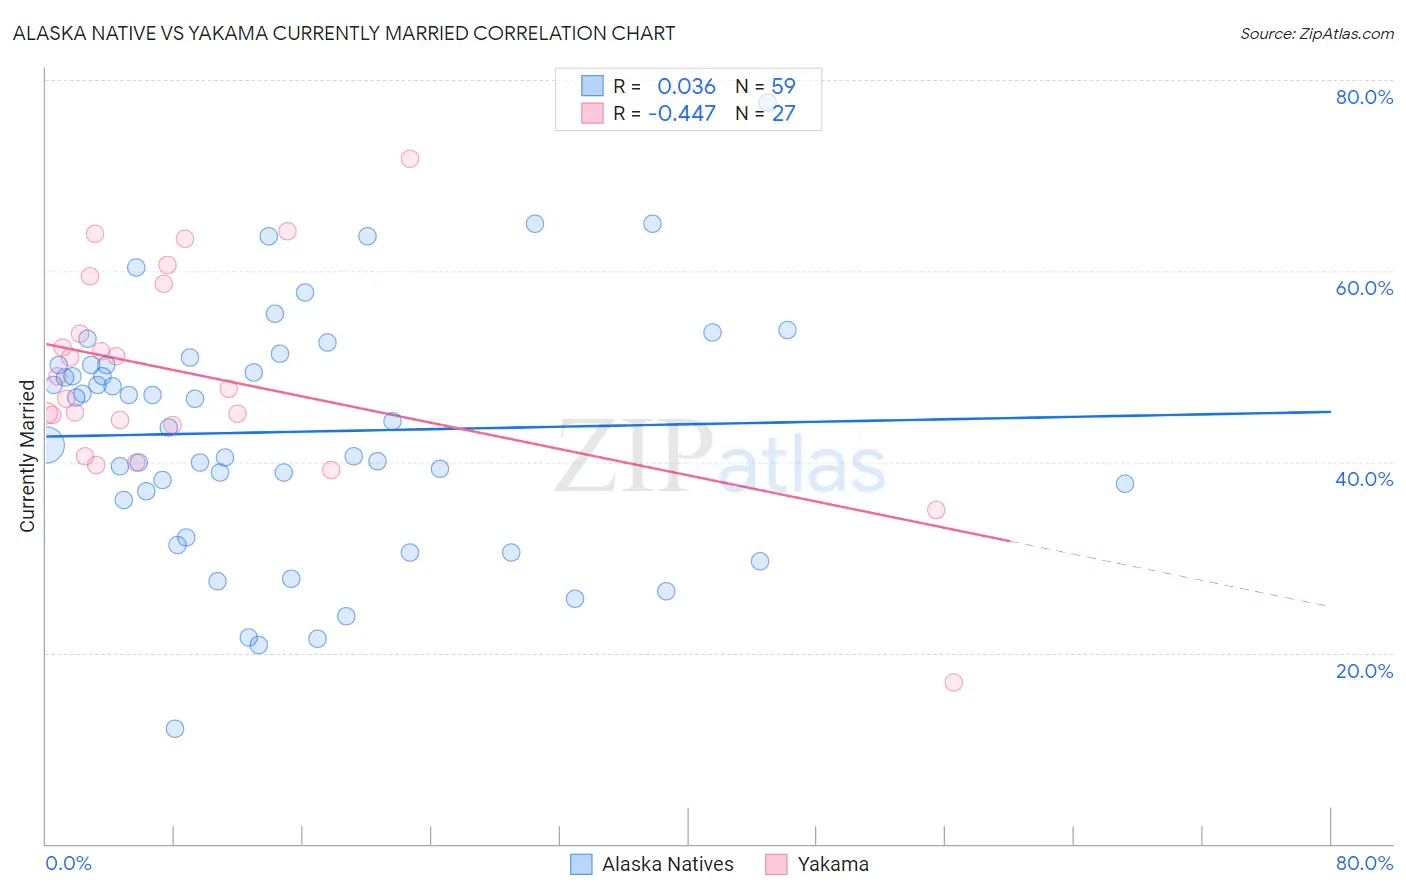
Alaska Native vs Yakama Currently Married Correlation Chart
The statistical analysis conducted on geographies consisting of 76,776,837 people shows no correlation between the proportion of Alaska Natives and percentage of population currently married in the United States with a correlation coefficient (R) of 0.036 and weighted average of 45.5%. Similarly, the statistical analysis conducted on geographies consisting of 19,923,144 people shows a moderate negative correlation between the proportion of Yakama and percentage of population currently married in the United States with a correlation coefficient (R) of -0.447 and weighted average of 44.0%, a difference of 3.5%.
Currently Married Correlation Summary
| Measurement | Alaska Native | Yakama |
| Minimum | 12.1% | 16.9% |
| Maximum | 77.7% | 71.8% |
| Range | 65.6% | 54.9% |
| Mean | 43.1% | 49.0% |
| Median | 44.2% | 47.7% |
| Interquartile 25% (IQ1) | 36.0% | 43.8% |
| Interquartile 75% (IQ3) | 50.2% | 58.6% |
| Interquartile Range (IQR) | 14.1% | 14.8% |
| Standard Deviation (Sample) | 12.8% | 11.2% |
| Standard Deviation (Population) | 12.7% | 11.0% |
Similar Demographics by Currently Married
Demographics Similar to Alaska Natives by Currently Married
In terms of currently married, the demographic groups most similar to Alaska Natives are Marshallese (45.5%, a difference of 0.030%), Houma (45.5%, a difference of 0.040%), Dutch West Indian (45.5%, a difference of 0.040%), German Russian (45.5%, a difference of 0.040%), and Uruguayan (45.6%, a difference of 0.12%).
| Demographics | Rating | Rank | Currently Married |
| Immigrants | Immigrants | 11.2 /100 | #206 | Poor 45.8% |
| Immigrants | South America | 10.8 /100 | #207 | Poor 45.7% |
| Alsatians | 10.8 /100 | #208 | Poor 45.7% |
| Immigrants | Micronesia | 8.8 /100 | #209 | Tragic 45.6% |
| Uruguayans | 7.9 /100 | #210 | Tragic 45.6% |
| Houma | 7.2 /100 | #211 | Tragic 45.5% |
| Marshallese | 7.2 /100 | #212 | Tragic 45.5% |
| Alaska Natives | 7.0 /100 | #213 | Tragic 45.5% |
| Dutch West Indians | 6.7 /100 | #214 | Tragic 45.5% |
| German Russians | 6.7 /100 | #215 | Tragic 45.5% |
| Immigrants | Morocco | 5.5 /100 | #216 | Tragic 45.4% |
| Immigrants | Thailand | 5.1 /100 | #217 | Tragic 45.4% |
| Panamanians | 4.0 /100 | #218 | Tragic 45.3% |
| Immigrants | Portugal | 3.5 /100 | #219 | Tragic 45.2% |
| Kenyans | 3.1 /100 | #220 | Tragic 45.2% |
Demographics Similar to Yakama by Currently Married
In terms of currently married, the demographic groups most similar to Yakama are Shoshone (44.0%, a difference of 0.050%), Vietnamese (44.0%, a difference of 0.070%), Immigrants from Africa (43.9%, a difference of 0.25%), Ute (43.9%, a difference of 0.26%), and Immigrants from Central America (44.1%, a difference of 0.32%).
| Demographics | Rating | Rank | Currently Married |
| Nicaraguans | 0.3 /100 | #248 | Tragic 44.2% |
| Immigrants | Cameroon | 0.3 /100 | #249 | Tragic 44.2% |
| Immigrants | Eastern Africa | 0.3 /100 | #250 | Tragic 44.2% |
| Blackfeet | 0.3 /100 | #251 | Tragic 44.2% |
| Hispanics or Latinos | 0.3 /100 | #252 | Tragic 44.1% |
| Immigrants | Central America | 0.3 /100 | #253 | Tragic 44.1% |
| Vietnamese | 0.2 /100 | #254 | Tragic 44.0% |
| Yakama | 0.2 /100 | #255 | Tragic 44.0% |
| Shoshone | 0.2 /100 | #256 | Tragic 44.0% |
| Immigrants | Africa | 0.2 /100 | #257 | Tragic 43.9% |
| Ute | 0.2 /100 | #258 | Tragic 43.9% |
| Immigrants | Sierra Leone | 0.1 /100 | #259 | Tragic 43.8% |
| Immigrants | Latin America | 0.1 /100 | #260 | Tragic 43.8% |
| Immigrants | Nicaragua | 0.1 /100 | #261 | Tragic 43.7% |
| Bangladeshis | 0.1 /100 | #262 | Tragic 43.7% |