Alaska Native vs Immigrants from Philippines Female Unemployment
COMPARE
Alaska Native
Immigrants from Philippines
Female Unemployment
Female Unemployment Comparison
Alaska Natives
Immigrants from Philippines
6.6%
FEMALE UNEMPLOYMENT
0.0/ 100
METRIC RATING
327th/ 347
METRIC RANK
5.5%
FEMALE UNEMPLOYMENT
5.3/ 100
METRIC RATING
227th/ 347
METRIC RANK
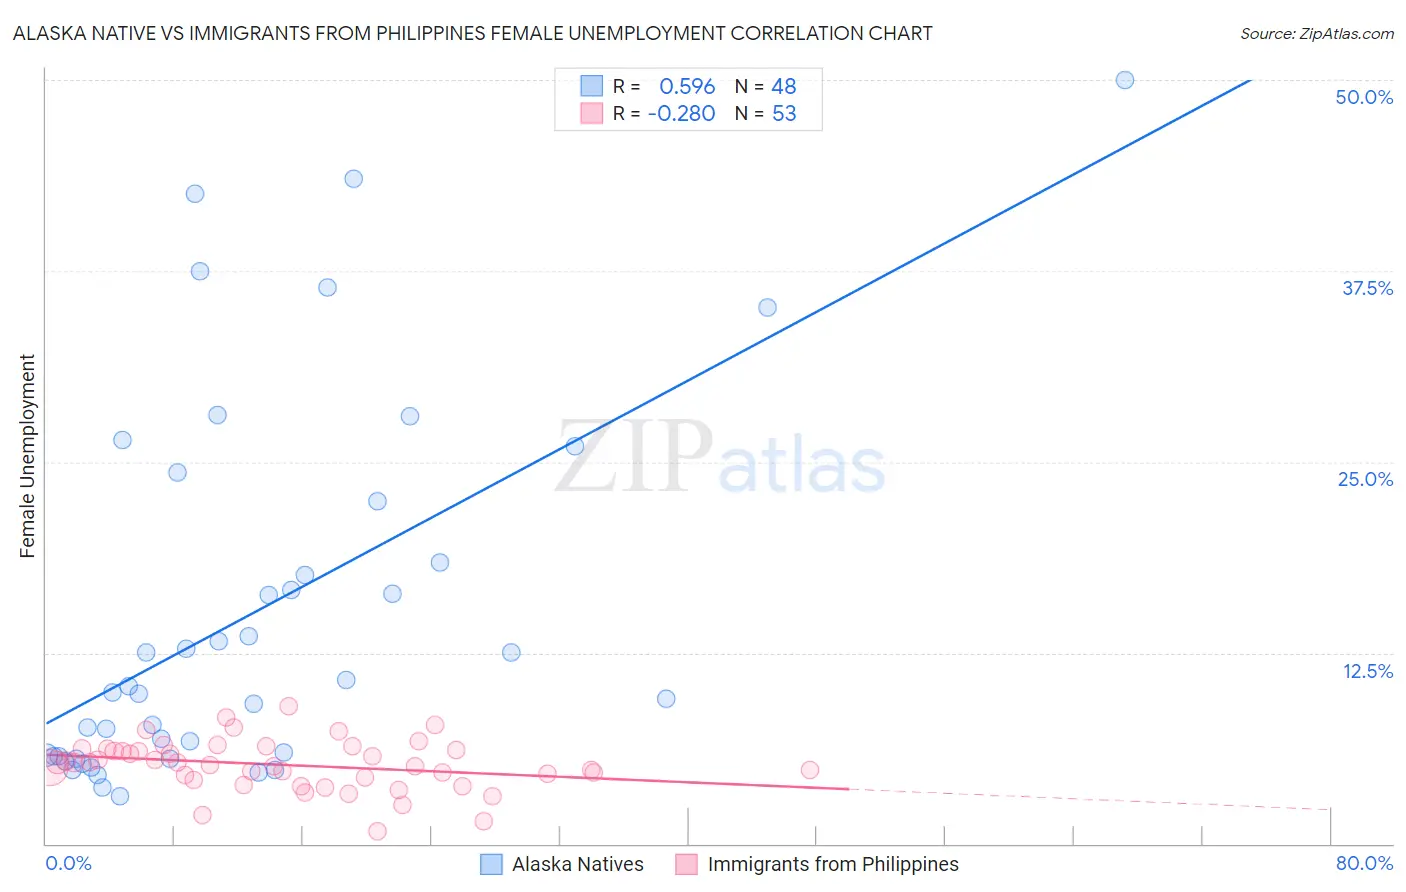
Alaska Native vs Immigrants from Philippines Female Unemployment Correlation Chart
The statistical analysis conducted on geographies consisting of 76,648,149 people shows a substantial positive correlation between the proportion of Alaska Natives and unemploymnet rate among females in the United States with a correlation coefficient (R) of 0.596 and weighted average of 6.6%. Similarly, the statistical analysis conducted on geographies consisting of 468,047,266 people shows a weak negative correlation between the proportion of Immigrants from Philippines and unemploymnet rate among females in the United States with a correlation coefficient (R) of -0.280 and weighted average of 5.5%, a difference of 20.9%.
Female Unemployment Correlation Summary
| Measurement | Alaska Native | Immigrants from Philippines |
| Minimum | 3.1% | 0.80% |
| Maximum | 50.0% | 9.0% |
| Range | 46.9% | 8.2% |
| Mean | 15.0% | 5.2% |
| Median | 10.1% | 5.3% |
| Interquartile 25% (IQ1) | 5.7% | 4.2% |
| Interquartile 75% (IQ3) | 20.4% | 6.2% |
| Interquartile Range (IQR) | 14.7% | 1.9% |
| Standard Deviation (Sample) | 12.1% | 1.6% |
| Standard Deviation (Population) | 12.0% | 1.6% |
Similar Demographics by Female Unemployment
Demographics Similar to Alaska Natives by Female Unemployment
In terms of female unemployment, the demographic groups most similar to Alaska Natives are Native/Alaskan (6.6%, a difference of 0.090%), Guyanese (6.7%, a difference of 0.44%), Apache (6.6%, a difference of 0.64%), Immigrants from Guyana (6.7%, a difference of 0.80%), and Cheyenne (6.6%, a difference of 0.91%).
| Demographics | Rating | Rank | Female Unemployment |
| Immigrants | Dominica | 0.0 /100 | #320 | Tragic 6.5% |
| Blacks/African Americans | 0.0 /100 | #321 | Tragic 6.5% |
| Vietnamese | 0.0 /100 | #322 | Tragic 6.5% |
| Immigrants | Belize | 0.0 /100 | #323 | Tragic 6.5% |
| Cheyenne | 0.0 /100 | #324 | Tragic 6.6% |
| Apache | 0.0 /100 | #325 | Tragic 6.6% |
| Natives/Alaskans | 0.0 /100 | #326 | Tragic 6.6% |
| Alaska Natives | 0.0 /100 | #327 | Tragic 6.6% |
| Guyanese | 0.0 /100 | #328 | Tragic 6.7% |
| Immigrants | Guyana | 0.0 /100 | #329 | Tragic 6.7% |
| Yakama | 0.0 /100 | #330 | Tragic 6.7% |
| Paiute | 0.0 /100 | #331 | Tragic 6.8% |
| Sioux | 0.0 /100 | #332 | Tragic 7.0% |
| Menominee | 0.0 /100 | #333 | Tragic 7.0% |
| Immigrants | Armenia | 0.0 /100 | #334 | Tragic 7.1% |
Demographics Similar to Immigrants from Philippines by Female Unemployment
In terms of female unemployment, the demographic groups most similar to Immigrants from Philippines are Israeli (5.5%, a difference of 0.16%), Immigrants from Peru (5.5%, a difference of 0.17%), Panamanian (5.5%, a difference of 0.17%), Immigrants from Uruguay (5.5%, a difference of 0.18%), and French American Indian (5.5%, a difference of 0.21%).
| Demographics | Rating | Rank | Female Unemployment |
| Immigrants | Africa | 8.5 /100 | #220 | Tragic 5.4% |
| Brazilians | 7.3 /100 | #221 | Tragic 5.5% |
| Nicaraguans | 7.2 /100 | #222 | Tragic 5.5% |
| Delaware | 7.2 /100 | #223 | Tragic 5.5% |
| Iraqis | 7.1 /100 | #224 | Tragic 5.5% |
| French American Indians | 6.1 /100 | #225 | Tragic 5.5% |
| Immigrants | Peru | 5.9 /100 | #226 | Tragic 5.5% |
| Immigrants | Philippines | 5.3 /100 | #227 | Tragic 5.5% |
| Israelis | 4.8 /100 | #228 | Tragic 5.5% |
| Panamanians | 4.7 /100 | #229 | Tragic 5.5% |
| Immigrants | Uruguay | 4.7 /100 | #230 | Tragic 5.5% |
| Immigrants | Iraq | 3.9 /100 | #231 | Tragic 5.5% |
| Liberians | 3.9 /100 | #232 | Tragic 5.5% |
| Moroccans | 3.4 /100 | #233 | Tragic 5.5% |
| Immigrants | Lebanon | 3.3 /100 | #234 | Tragic 5.5% |