Alaska Native vs Immigrants from Croatia Unemployment Among Youth under 25 years
COMPARE
Alaska Native
Immigrants from Croatia
Unemployment Among Youth under 25 years
Unemployment Among Youth under 25 years Comparison
Alaska Natives
Immigrants from Croatia
14.9%
UNEMPLOYMENT AMONG YOUTH UNDER 25 YEARS
0.0/ 100
METRIC RATING
325th/ 347
METRIC RANK
11.1%
UNEMPLOYMENT AMONG YOUTH UNDER 25 YEARS
98.1/ 100
METRIC RATING
63rd/ 347
METRIC RANK
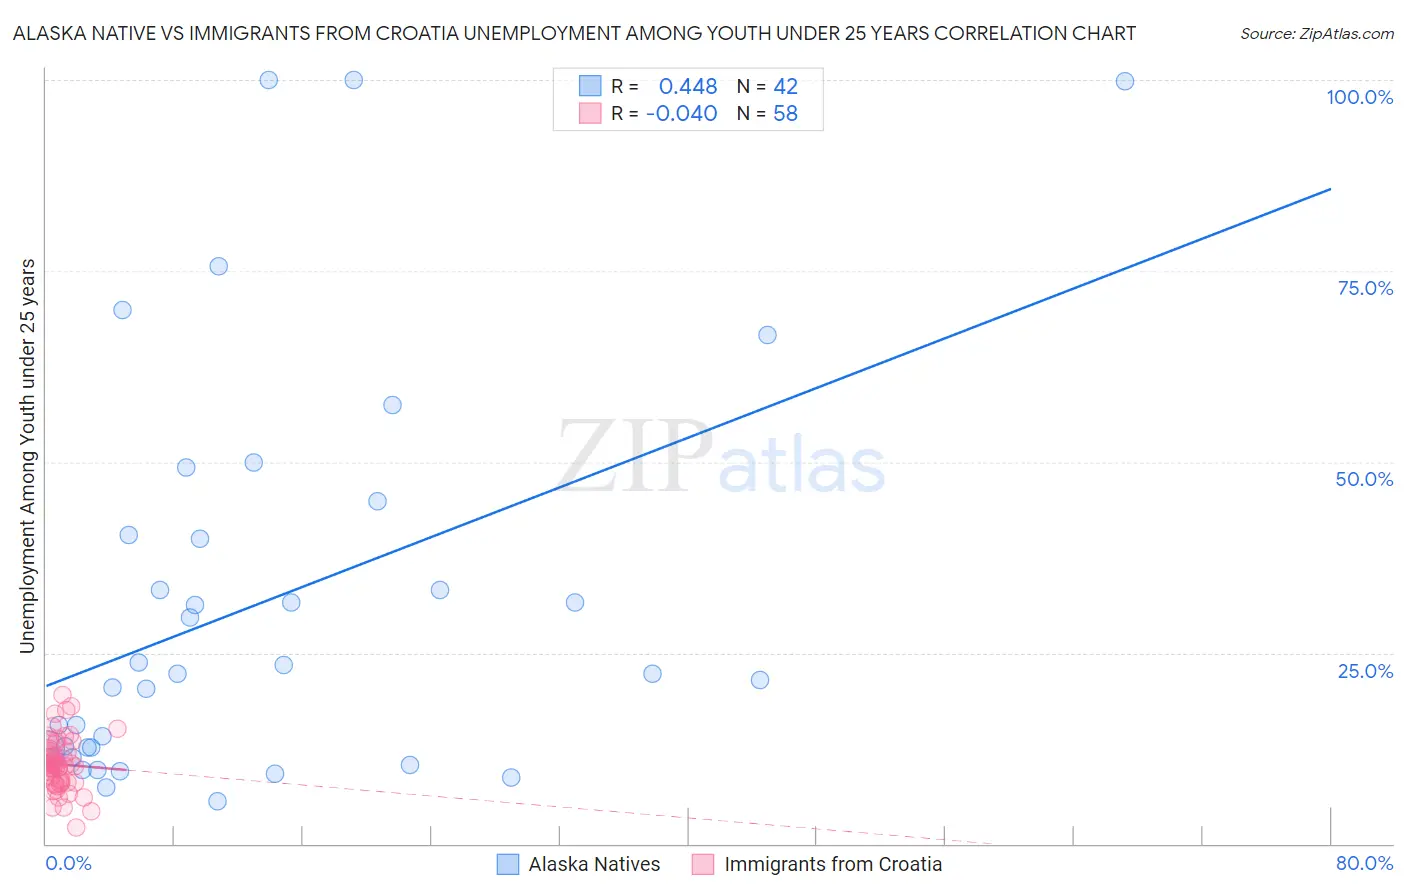
Alaska Native vs Immigrants from Croatia Unemployment Among Youth under 25 years Correlation Chart
The statistical analysis conducted on geographies consisting of 76,575,345 people shows a moderate positive correlation between the proportion of Alaska Natives and unemployment rate among youth under the age of 25 in the United States with a correlation coefficient (R) of 0.448 and weighted average of 14.9%. Similarly, the statistical analysis conducted on geographies consisting of 132,077,248 people shows no correlation between the proportion of Immigrants from Croatia and unemployment rate among youth under the age of 25 in the United States with a correlation coefficient (R) of -0.040 and weighted average of 11.1%, a difference of 33.9%.
Unemployment Among Youth under 25 years Correlation Summary
| Measurement | Alaska Native | Immigrants from Croatia |
| Minimum | 5.6% | 2.2% |
| Maximum | 100.0% | 19.5% |
| Range | 94.4% | 17.3% |
| Mean | 31.6% | 10.4% |
| Median | 22.2% | 10.2% |
| Interquartile 25% (IQ1) | 12.5% | 8.1% |
| Interquartile 75% (IQ3) | 40.4% | 11.9% |
| Interquartile Range (IQR) | 28.0% | 3.9% |
| Standard Deviation (Sample) | 26.3% | 3.4% |
| Standard Deviation (Population) | 25.9% | 3.4% |
Similar Demographics by Unemployment Among Youth under 25 years
Demographics Similar to Alaska Natives by Unemployment Among Youth under 25 years
In terms of unemployment among youth under 25 years, the demographic groups most similar to Alaska Natives are Immigrants from Jamaica (14.8%, a difference of 0.67%), Immigrants from Trinidad and Tobago (14.6%, a difference of 1.8%), Trinidadian and Tobagonian (14.6%, a difference of 1.9%), Cheyenne (14.6%, a difference of 2.0%), and Barbadian (14.6%, a difference of 2.2%).
| Demographics | Rating | Rank | Unemployment Among Youth under 25 years |
| Immigrants | Dominica | 0.0 /100 | #318 | Tragic 14.6% |
| West Indians | 0.0 /100 | #319 | Tragic 14.6% |
| Barbadians | 0.0 /100 | #320 | Tragic 14.6% |
| Cheyenne | 0.0 /100 | #321 | Tragic 14.6% |
| Trinidadians and Tobagonians | 0.0 /100 | #322 | Tragic 14.6% |
| Immigrants | Trinidad and Tobago | 0.0 /100 | #323 | Tragic 14.6% |
| Immigrants | Jamaica | 0.0 /100 | #324 | Tragic 14.8% |
| Alaska Natives | 0.0 /100 | #325 | Tragic 14.9% |
| Immigrants | Barbados | 0.0 /100 | #326 | Tragic 15.2% |
| British West Indians | 0.0 /100 | #327 | Tragic 15.5% |
| Immigrants | Dominican Republic | 0.0 /100 | #328 | Tragic 15.6% |
| Immigrants | Yemen | 0.0 /100 | #329 | Tragic 15.6% |
| Yakama | 0.0 /100 | #330 | Tragic 15.6% |
| Dominicans | 0.0 /100 | #331 | Tragic 15.7% |
| Immigrants | Grenada | 0.0 /100 | #332 | Tragic 15.8% |
Demographics Similar to Immigrants from Croatia by Unemployment Among Youth under 25 years
In terms of unemployment among youth under 25 years, the demographic groups most similar to Immigrants from Croatia are Immigrants from Netherlands (11.1%, a difference of 0.010%), Filipino (11.1%, a difference of 0.10%), Jordanian (11.1%, a difference of 0.12%), Immigrants from Singapore (11.2%, a difference of 0.18%), and Macedonian (11.2%, a difference of 0.21%).
| Demographics | Rating | Rank | Unemployment Among Youth under 25 years |
| Immigrants | Saudi Arabia | 98.8 /100 | #56 | Exceptional 11.1% |
| Immigrants | Eritrea | 98.8 /100 | #57 | Exceptional 11.1% |
| Scotch-Irish | 98.8 /100 | #58 | Exceptional 11.1% |
| Immigrants | Eastern Africa | 98.7 /100 | #59 | Exceptional 11.1% |
| South Africans | 98.5 /100 | #60 | Exceptional 11.1% |
| Filipinos | 98.3 /100 | #61 | Exceptional 11.1% |
| Immigrants | Netherlands | 98.1 /100 | #62 | Exceptional 11.1% |
| Immigrants | Croatia | 98.1 /100 | #63 | Exceptional 11.1% |
| Jordanians | 97.9 /100 | #64 | Exceptional 11.1% |
| Immigrants | Singapore | 97.8 /100 | #65 | Exceptional 11.2% |
| Macedonians | 97.7 /100 | #66 | Exceptional 11.2% |
| Chickasaw | 97.7 /100 | #67 | Exceptional 11.2% |
| Immigrants | Kenya | 97.6 /100 | #68 | Exceptional 11.2% |
| Immigrants | Moldova | 97.5 /100 | #69 | Exceptional 11.2% |
| Slavs | 97.5 /100 | #70 | Exceptional 11.2% |