Alaska Native vs Ghanaian Unemployment Among Youth under 25 years
COMPARE
Alaska Native
Ghanaian
Unemployment Among Youth under 25 years
Unemployment Among Youth under 25 years Comparison
Alaska Natives
Ghanaians
14.9%
UNEMPLOYMENT AMONG YOUTH UNDER 25 YEARS
0.0/ 100
METRIC RATING
325th/ 347
METRIC RANK
13.3%
UNEMPLOYMENT AMONG YOUTH UNDER 25 YEARS
0.0/ 100
METRIC RATING
285th/ 347
METRIC RANK
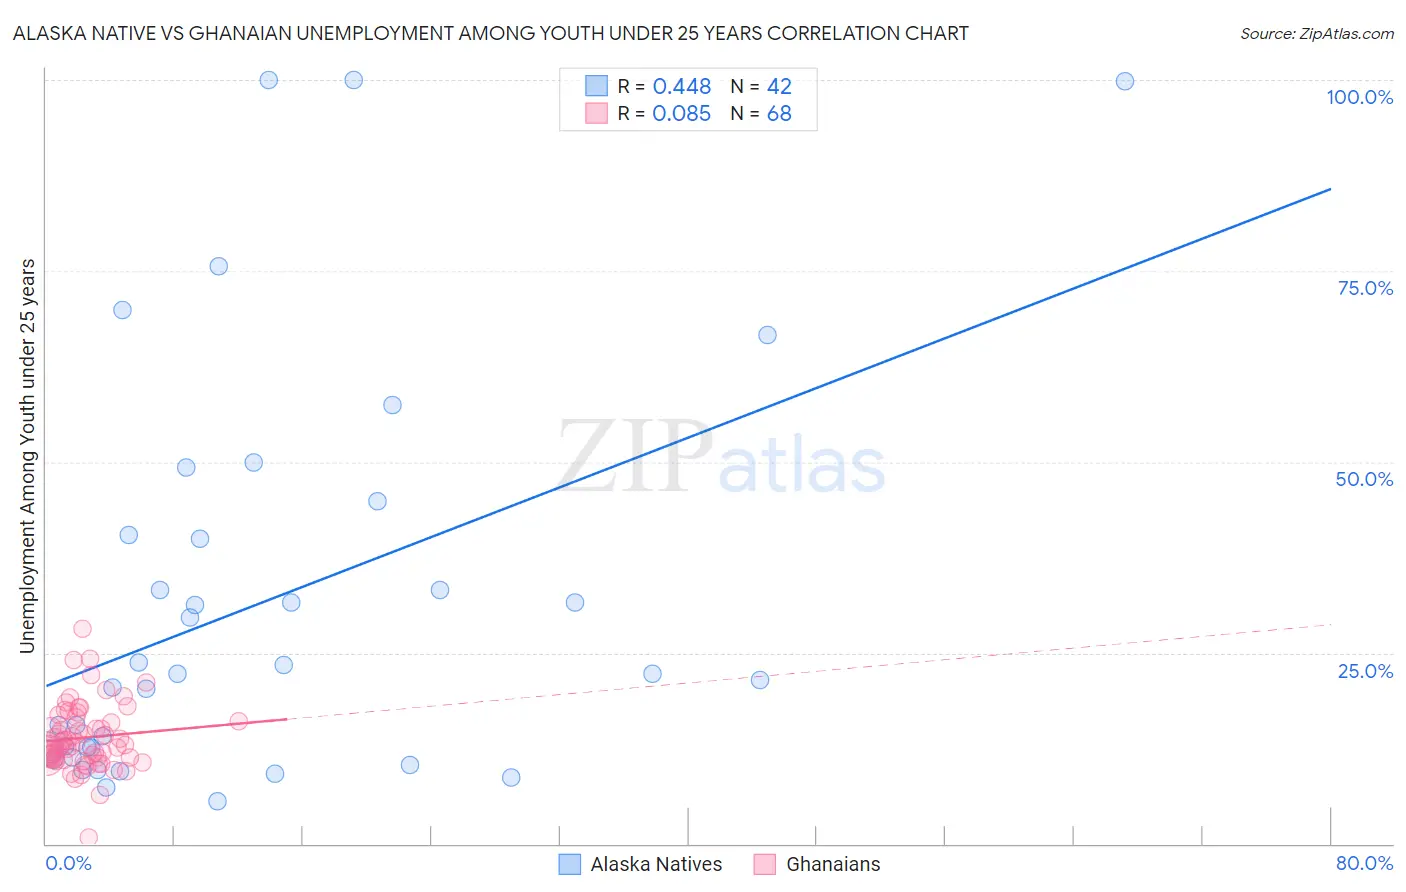
Alaska Native vs Ghanaian Unemployment Among Youth under 25 years Correlation Chart
The statistical analysis conducted on geographies consisting of 76,575,345 people shows a moderate positive correlation between the proportion of Alaska Natives and unemployment rate among youth under the age of 25 in the United States with a correlation coefficient (R) of 0.448 and weighted average of 14.9%. Similarly, the statistical analysis conducted on geographies consisting of 190,112,993 people shows a slight positive correlation between the proportion of Ghanaians and unemployment rate among youth under the age of 25 in the United States with a correlation coefficient (R) of 0.085 and weighted average of 13.3%, a difference of 12.1%.
Unemployment Among Youth under 25 years Correlation Summary
| Measurement | Alaska Native | Ghanaian |
| Minimum | 5.6% | 0.90% |
| Maximum | 100.0% | 28.2% |
| Range | 94.4% | 27.3% |
| Mean | 31.6% | 13.9% |
| Median | 22.2% | 13.1% |
| Interquartile 25% (IQ1) | 12.5% | 11.3% |
| Interquartile 75% (IQ3) | 40.4% | 16.3% |
| Interquartile Range (IQR) | 28.0% | 5.1% |
| Standard Deviation (Sample) | 26.3% | 4.4% |
| Standard Deviation (Population) | 25.9% | 4.3% |
Similar Demographics by Unemployment Among Youth under 25 years
Demographics Similar to Alaska Natives by Unemployment Among Youth under 25 years
In terms of unemployment among youth under 25 years, the demographic groups most similar to Alaska Natives are Immigrants from Jamaica (14.8%, a difference of 0.67%), Immigrants from Trinidad and Tobago (14.6%, a difference of 1.8%), Trinidadian and Tobagonian (14.6%, a difference of 1.9%), Cheyenne (14.6%, a difference of 2.0%), and Barbadian (14.6%, a difference of 2.2%).
| Demographics | Rating | Rank | Unemployment Among Youth under 25 years |
| Immigrants | Dominica | 0.0 /100 | #318 | Tragic 14.6% |
| West Indians | 0.0 /100 | #319 | Tragic 14.6% |
| Barbadians | 0.0 /100 | #320 | Tragic 14.6% |
| Cheyenne | 0.0 /100 | #321 | Tragic 14.6% |
| Trinidadians and Tobagonians | 0.0 /100 | #322 | Tragic 14.6% |
| Immigrants | Trinidad and Tobago | 0.0 /100 | #323 | Tragic 14.6% |
| Immigrants | Jamaica | 0.0 /100 | #324 | Tragic 14.8% |
| Alaska Natives | 0.0 /100 | #325 | Tragic 14.9% |
| Immigrants | Barbados | 0.0 /100 | #326 | Tragic 15.2% |
| British West Indians | 0.0 /100 | #327 | Tragic 15.5% |
| Immigrants | Dominican Republic | 0.0 /100 | #328 | Tragic 15.6% |
| Immigrants | Yemen | 0.0 /100 | #329 | Tragic 15.6% |
| Yakama | 0.0 /100 | #330 | Tragic 15.6% |
| Dominicans | 0.0 /100 | #331 | Tragic 15.7% |
| Immigrants | Grenada | 0.0 /100 | #332 | Tragic 15.8% |
Demographics Similar to Ghanaians by Unemployment Among Youth under 25 years
In terms of unemployment among youth under 25 years, the demographic groups most similar to Ghanaians are Blackfeet (13.3%, a difference of 0.050%), Ecuadorian (13.3%, a difference of 0.060%), Lumbee (13.3%, a difference of 0.090%), Immigrants from Cameroon (13.3%, a difference of 0.10%), and Sierra Leonean (13.3%, a difference of 0.12%).
| Demographics | Rating | Rank | Unemployment Among Youth under 25 years |
| Africans | 0.0 /100 | #278 | Tragic 13.2% |
| Cajuns | 0.0 /100 | #279 | Tragic 13.2% |
| Ute | 0.0 /100 | #280 | Tragic 13.3% |
| Armenians | 0.0 /100 | #281 | Tragic 13.3% |
| Sierra Leoneans | 0.0 /100 | #282 | Tragic 13.3% |
| Immigrants | Cameroon | 0.0 /100 | #283 | Tragic 13.3% |
| Lumbee | 0.0 /100 | #284 | Tragic 13.3% |
| Ghanaians | 0.0 /100 | #285 | Tragic 13.3% |
| Blackfeet | 0.0 /100 | #286 | Tragic 13.3% |
| Ecuadorians | 0.0 /100 | #287 | Tragic 13.3% |
| Immigrants | Western Africa | 0.0 /100 | #288 | Tragic 13.4% |
| Immigrants | Ghana | 0.0 /100 | #289 | Tragic 13.4% |
| Immigrants | Ecuador | 0.0 /100 | #290 | Tragic 13.4% |
| Apache | 0.0 /100 | #291 | Tragic 13.5% |
| Central American Indians | 0.0 /100 | #292 | Tragic 13.5% |