Woodway, TX Map & Demographics
Woodway Map
Woodway Overview
$55,902
PER CAPITA INCOME
$130,489
AVG FAMILY INCOME
$111,014
AVG HOUSEHOLD INCOME
48.0%
WAGE / INCOME GAP [ % ]
52.0¢/ $1
WAGE / INCOME GAP [ $ ]
0.43
INEQUALITY / GINI INDEX
9,399
TOTAL POPULATION
4,519
MALE POPULATION
4,880
FEMALE POPULATION
92.60
MALES / 100 FEMALES
107.99
FEMALES / 100 MALES
42.7
MEDIAN AGE
3.1
AVG FAMILY SIZE
2.7
AVG HOUSEHOLD SIZE
4,528
LABOR FORCE [ PEOPLE ]
60.2%
PERCENT IN LABOR FORCE
4.1%
UNEMPLOYMENT RATE
Woodway Zip Codes
Woodway Area Codes
Income in Woodway
Income Overview in Woodway
Per Capita Income in Woodway is $55,902, while median incomes of families and households are $130,489 and $111,014 respectively.
| Characteristic | Number | Measure |
| Per Capita Income | 9,399 | $55,902 |
| Median Family Income | 2,647 | $130,489 |
| Mean Family Income | 2,647 | $165,376 |
| Median Household Income | 3,444 | $111,014 |
| Mean Household Income | 3,444 | $149,168 |
| Income Deficit | 2,647 | $0 |
| Wage / Income Gap (%) | 9,399 | 47.96% |
| Wage / Income Gap ($) | 9,399 | 52.04¢ per $1 |
| Gini / Inequality Index | 9,399 | 0.43 |
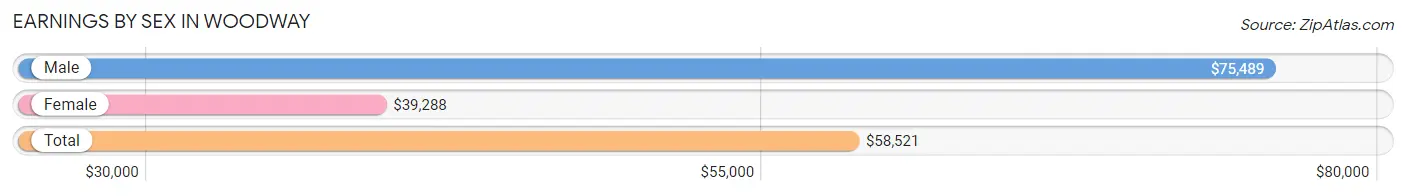
Earnings by Sex in Woodway
Average Earnings in Woodway are $58,521, $75,489 for men and $39,288 for women, a difference of 48.0%.
| Sex | Number | Average Earnings |
| Male | 2,651 (53.4%) | $75,489 |
| Female | 2,309 (46.6%) | $39,288 |
| Total | 4,960 (100.0%) | $58,521 |
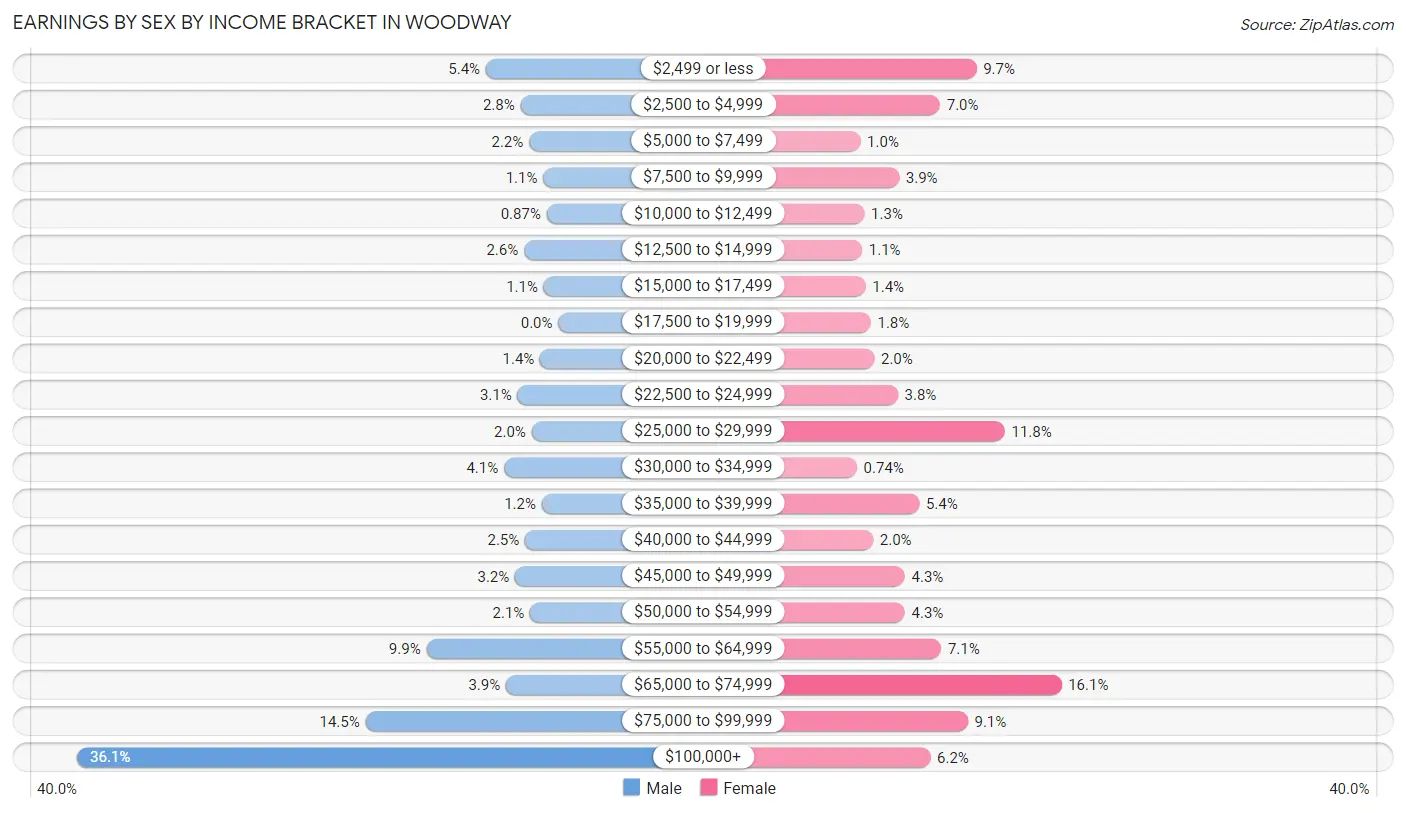
Earnings by Sex by Income Bracket in Woodway
The most common earnings brackets in Woodway are $100,000+ for men (956 | 36.1%) and $65,000 to $74,999 for women (371 | 16.1%).
| Income | Male | Female |
| $2,499 or less | 144 (5.4%) | 224 (9.7%) |
| $2,500 to $4,999 | 75 (2.8%) | 161 (7.0%) |
| $5,000 to $7,499 | 58 (2.2%) | 23 (1.0%) |
| $7,500 to $9,999 | 30 (1.1%) | 90 (3.9%) |
| $10,000 to $12,499 | 23 (0.9%) | 30 (1.3%) |
| $12,500 to $14,999 | 68 (2.6%) | 26 (1.1%) |
| $15,000 to $17,499 | 29 (1.1%) | 32 (1.4%) |
| $17,500 to $19,999 | 0 (0.0%) | 41 (1.8%) |
| $20,000 to $22,499 | 36 (1.4%) | 47 (2.0%) |
| $22,500 to $24,999 | 81 (3.1%) | 88 (3.8%) |
| $25,000 to $29,999 | 53 (2.0%) | 273 (11.8%) |
| $30,000 to $34,999 | 108 (4.1%) | 17 (0.7%) |
| $35,000 to $39,999 | 33 (1.2%) | 125 (5.4%) |
| $40,000 to $44,999 | 66 (2.5%) | 45 (1.9%) |
| $45,000 to $49,999 | 86 (3.2%) | 100 (4.3%) |
| $50,000 to $54,999 | 56 (2.1%) | 100 (4.3%) |
| $55,000 to $64,999 | 262 (9.9%) | 163 (7.1%) |
| $65,000 to $74,999 | 104 (3.9%) | 371 (16.1%) |
| $75,000 to $99,999 | 383 (14.4%) | 209 (9.0%) |
| $100,000+ | 956 (36.1%) | 144 (6.2%) |
| Total | 2,651 (100.0%) | 2,309 (100.0%) |
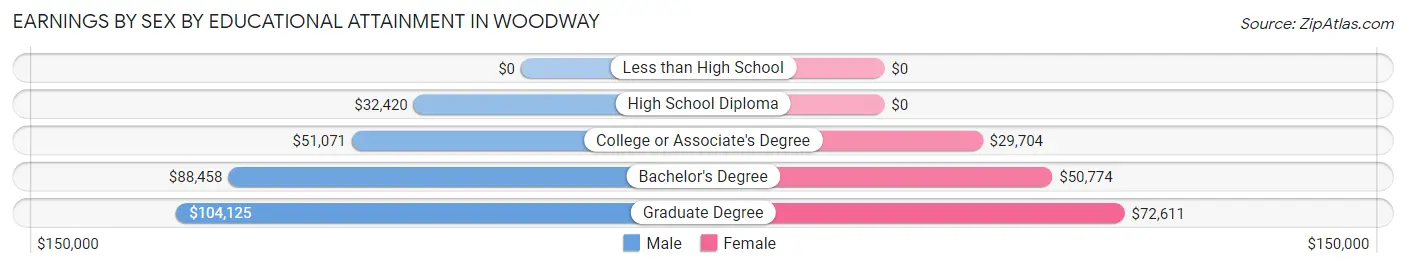
Earnings by Sex by Educational Attainment in Woodway
Average earnings in Woodway are $83,668 for men and $48,385 for women, a difference of 42.2%. Men with an educational attainment of graduate degree enjoy the highest average annual earnings of $104,125, while those with high school diploma education earn the least with $32,420. Women with an educational attainment of graduate degree earn the most with the average annual earnings of $72,611, while those with college or associate's degree education have the smallest earnings of $29,704.
| Educational Attainment | Male Income | Female Income |
| Less than High School | - | - |
| High School Diploma | $32,420 | $0 |
| College or Associate's Degree | $51,071 | $29,704 |
| Bachelor's Degree | $88,458 | $50,774 |
| Graduate Degree | $104,125 | $72,611 |
| Total | $83,668 | $48,385 |
Family Income in Woodway
Family Income Brackets in Woodway
According to the Woodway family income data, there are 672 families falling into the $200,000+ income range, which is the most common income bracket and makes up 25.4% of all families.
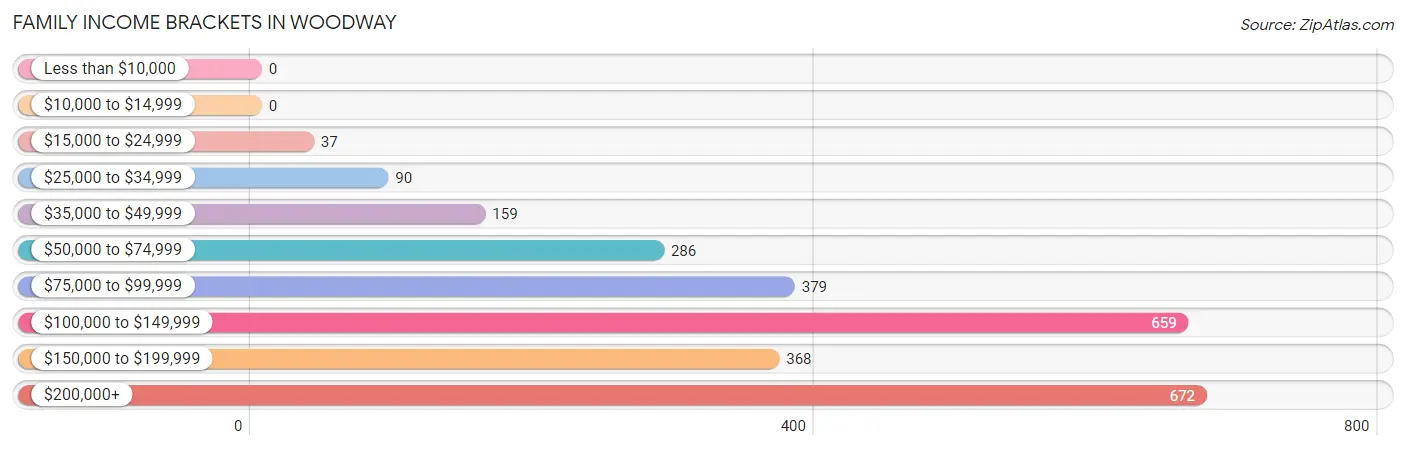
| Income Bracket | # Families | % Families |
| Less than $10,000 | 0 | 0.0% |
| $10,000 to $14,999 | 0 | 0.0% |
| $15,000 to $24,999 | 37 | 1.4% |
| $25,000 to $34,999 | 90 | 3.4% |
| $35,000 to $49,999 | 159 | 6.0% |
| $50,000 to $74,999 | 286 | 10.8% |
| $75,000 to $99,999 | 379 | 14.3% |
| $100,000 to $149,999 | 659 | 24.9% |
| $150,000 to $199,999 | 368 | 13.9% |
| $200,000+ | 672 | 25.4% |
Family Income by Famaliy Size in Woodway
5-person families (305 | 11.5%) account for the highest median family income in Woodway with $204,063 per family, while 3-person families (349 | 13.2%) have the highest median income of $67,260 per family member.
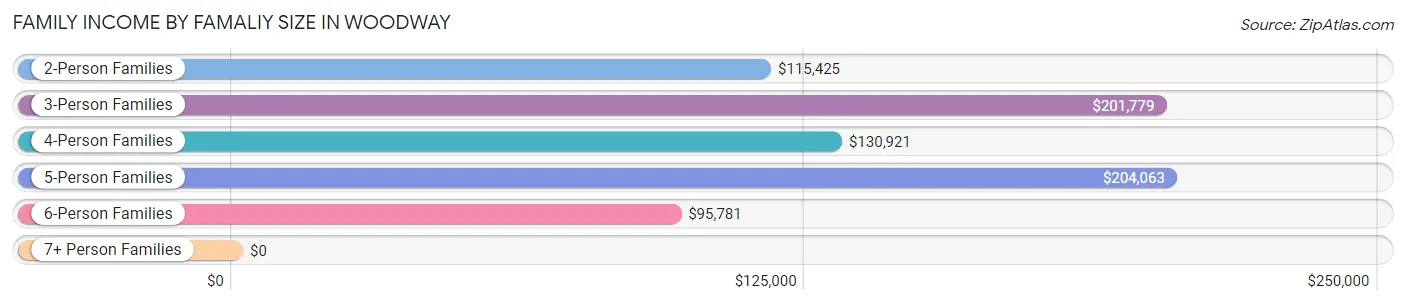
| Income Bracket | # Families | Median Income |
| 2-Person Families | 1,447 (54.7%) | $115,425 |
| 3-Person Families | 349 (13.2%) | $201,779 |
| 4-Person Families | 406 (15.3%) | $130,921 |
| 5-Person Families | 305 (11.5%) | $204,063 |
| 6-Person Families | 108 (4.1%) | $95,781 |
| 7+ Person Families | 32 (1.2%) | $0 |
| Total | 2,647 (100.0%) | $130,489 |
Family Income by Number of Earners in Woodway
The median family income in Woodway is $130,489, with families comprising 3+ earners (283) having the highest median family income of $176,688, while families with 1 earner (790) have the lowest median family income of $95,122, accounting for 10.7% and 29.8% of families, respectively.
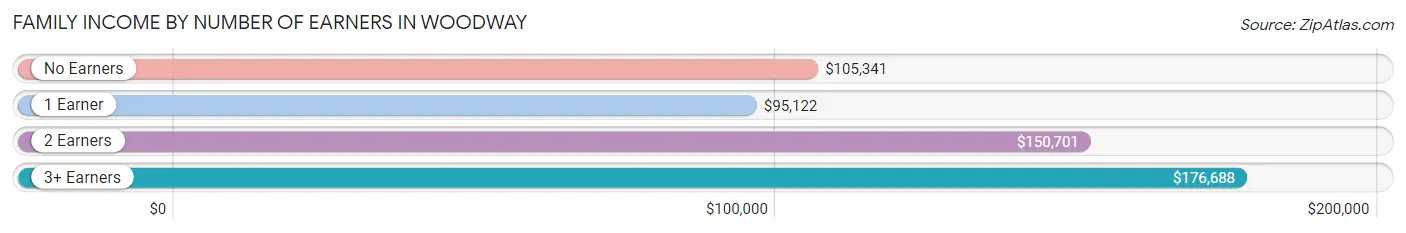
| Number of Earners | # Families | Median Income |
| No Earners | 471 (17.8%) | $105,341 |
| 1 Earner | 790 (29.8%) | $95,122 |
| 2 Earners | 1,103 (41.7%) | $150,701 |
| 3+ Earners | 283 (10.7%) | $176,688 |
| Total | 2,647 (100.0%) | $130,489 |
Household Income in Woodway
Household Income Brackets in Woodway
With 751 households falling in the category, the $100,000 to $149,999 income range is the most frequent in Woodway, accounting for 21.8% of all households. In contrast, only 17 households (0.5%) fall into the less than $10,000 income bracket, making it the least populous group.
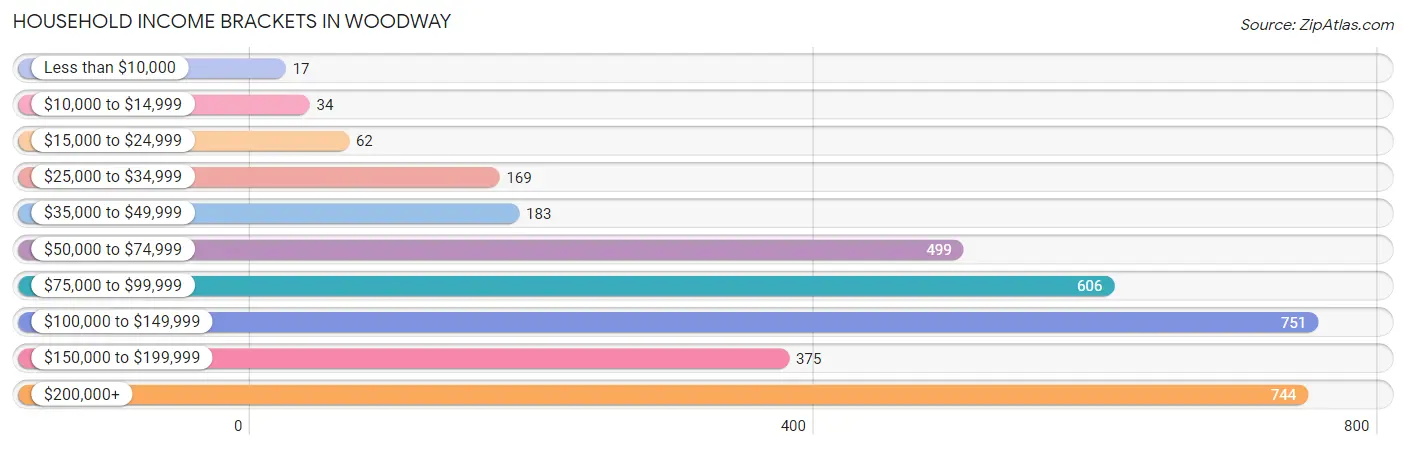
| Income Bracket | # Households | % Households |
| Less than $10,000 | 17 | 0.5% |
| $10,000 to $14,999 | 34 | 1.0% |
| $15,000 to $24,999 | 62 | 1.8% |
| $25,000 to $34,999 | 169 | 4.9% |
| $35,000 to $49,999 | 183 | 5.3% |
| $50,000 to $74,999 | 499 | 14.5% |
| $75,000 to $99,999 | 606 | 17.6% |
| $100,000 to $149,999 | 751 | 21.8% |
| $150,000 to $199,999 | 375 | 10.9% |
| $200,000+ | 744 | 21.6% |
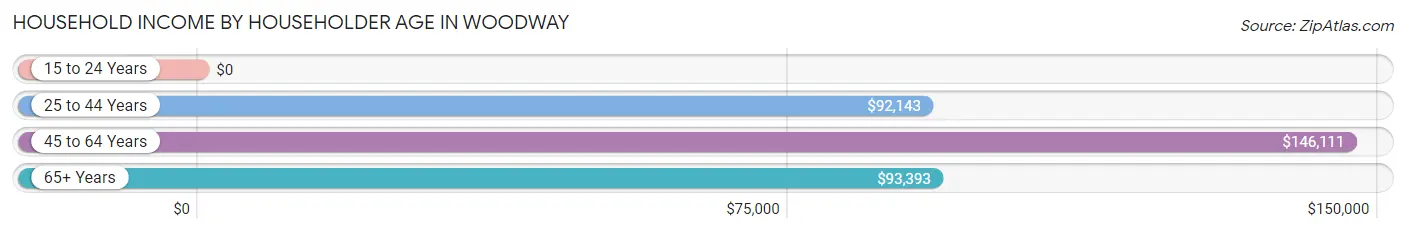
Household Income by Householder Age in Woodway
The median household income in Woodway is $111,014, with the highest median household income of $146,111 found in the 45 to 64 years age bracket for the primary householder. A total of 1,282 households (37.2%) fall into this category. Meanwhile, the 15 to 24 years age bracket for the primary householder has the lowest median household income of $0, with 45 households (1.3%) in this group.
| Income Bracket | # Households | Median Income |
| 15 to 24 Years | 45 (1.3%) | $0 |
| 25 to 44 Years | 852 (24.7%) | $92,143 |
| 45 to 64 Years | 1,282 (37.2%) | $146,111 |
| 65+ Years | 1,265 (36.7%) | $93,393 |
| Total | 3,444 (100.0%) | $111,014 |
Poverty in Woodway
Income Below Poverty by Sex and Age in Woodway
With 2.8% poverty level for males and 5.0% for females among the residents of Woodway, 16 and 17 year old males and 5 year old females are the most vulnerable to poverty, with 61 males (44.9%) and 45 females (32.4%) in their respective age groups living below the poverty level.
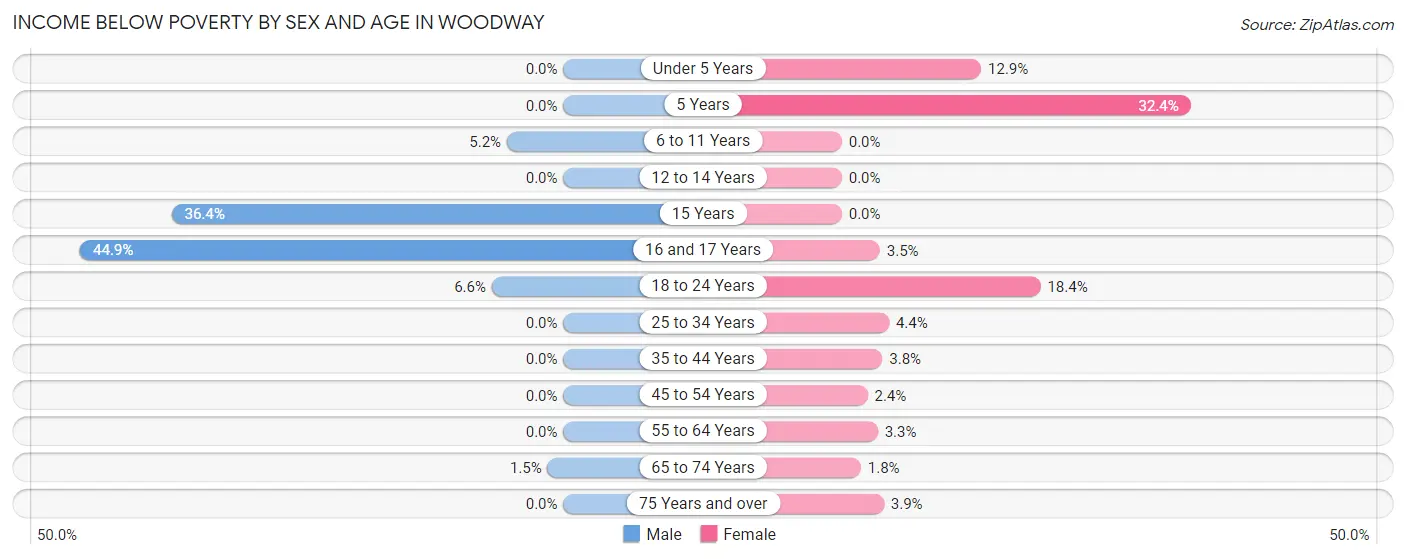
| Age Bracket | Male | Female |
| Under 5 Years | 0 (0.0%) | 34 (12.9%) |
| 5 Years | 0 (0.0%) | 45 (32.4%) |
| 6 to 11 Years | 22 (5.2%) | 0 (0.0%) |
| 12 to 14 Years | 0 (0.0%) | 0 (0.0%) |
| 15 Years | 16 (36.4%) | 0 (0.0%) |
| 16 and 17 Years | 61 (44.9%) | 9 (3.5%) |
| 18 to 24 Years | 18 (6.6%) | 45 (18.4%) |
| 25 to 34 Years | 0 (0.0%) | 25 (4.4%) |
| 35 to 44 Years | 0 (0.0%) | 16 (3.8%) |
| 45 to 54 Years | 0 (0.0%) | 14 (2.4%) |
| 55 to 64 Years | 0 (0.0%) | 24 (3.3%) |
| 65 to 74 Years | 9 (1.5%) | 10 (1.8%) |
| 75 Years and over | 0 (0.0%) | 18 (3.9%) |
| Total | 126 (2.8%) | 240 (5.0%) |
Income Above Poverty by Sex and Age in Woodway
According to the poverty statistics in Woodway, males aged under 5 years and females aged 6 to 11 years are the age groups that are most secure financially, with 100.0% of males and 100.0% of females in these age groups living above the poverty line.
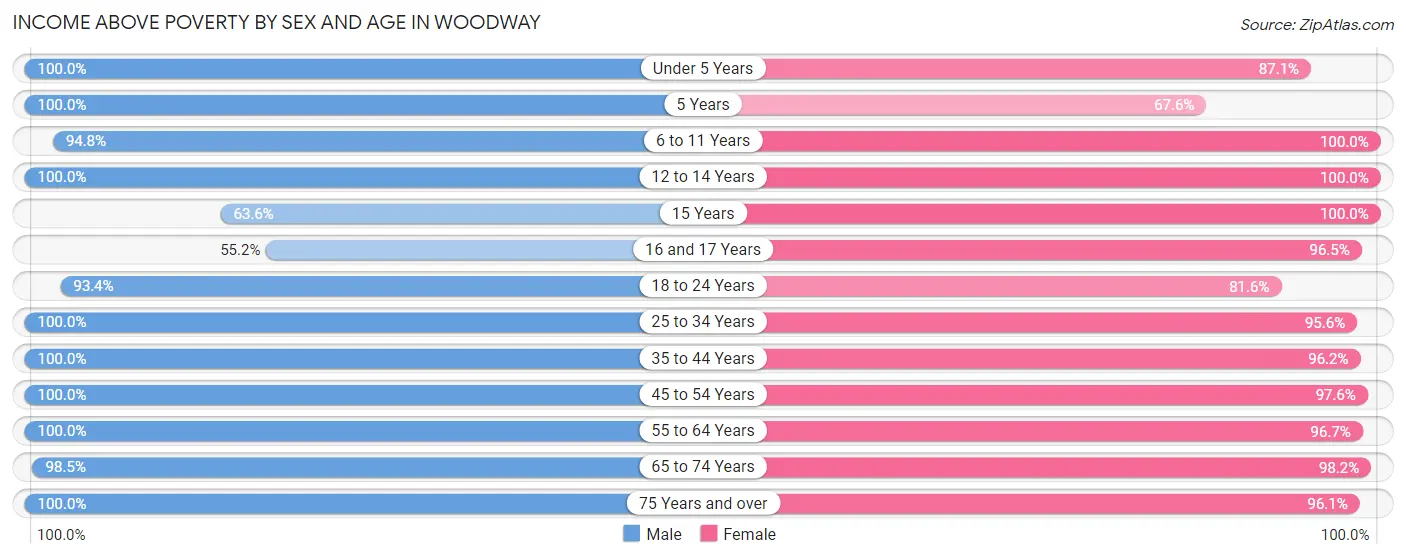
| Age Bracket | Male | Female |
| Under 5 Years | 185 (100.0%) | 229 (87.1%) |
| 5 Years | 76 (100.0%) | 94 (67.6%) |
| 6 to 11 Years | 398 (94.8%) | 305 (100.0%) |
| 12 to 14 Years | 154 (100.0%) | 158 (100.0%) |
| 15 Years | 28 (63.6%) | 104 (100.0%) |
| 16 and 17 Years | 75 (55.1%) | 246 (96.5%) |
| 18 to 24 Years | 253 (93.4%) | 199 (81.6%) |
| 25 to 34 Years | 637 (100.0%) | 546 (95.6%) |
| 35 to 44 Years | 461 (100.0%) | 409 (96.2%) |
| 45 to 54 Years | 386 (100.0%) | 573 (97.6%) |
| 55 to 64 Years | 692 (100.0%) | 696 (96.7%) |
| 65 to 74 Years | 602 (98.5%) | 556 (98.2%) |
| 75 Years and over | 417 (100.0%) | 443 (96.1%) |
| Total | 4,364 (97.2%) | 4,558 (95.0%) |
Income Below Poverty Among Married-Couple Families in Woodway
The poverty statistics for married-couple families in Woodway show that 0.4% or 9 of the total 2,254 families live below the poverty line. Families with no children have the highest poverty rate of 0.6%, comprising of 9 families. On the other hand, families with 1 or 2 children have the lowest poverty rate of 0.0%, which includes 0 families.
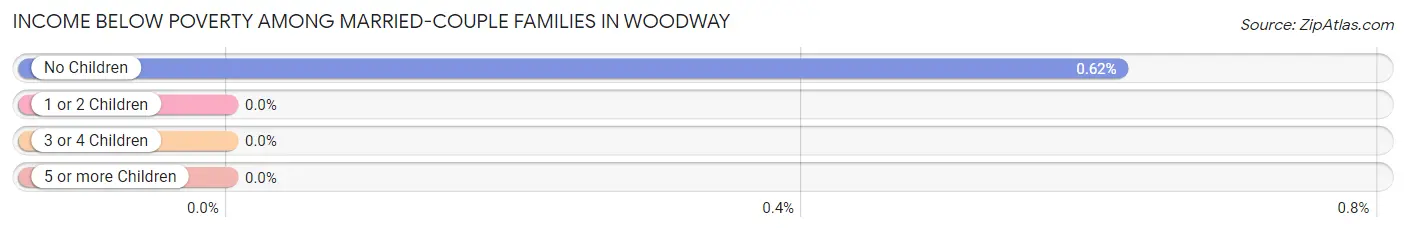
| Children | Above Poverty | Below Poverty |
| No Children | 1,436 (99.4%) | 9 (0.6%) |
| 1 or 2 Children | 529 (100.0%) | 0 (0.0%) |
| 3 or 4 Children | 259 (100.0%) | 0 (0.0%) |
| 5 or more Children | 21 (100.0%) | 0 (0.0%) |
| Total | 2,245 (99.6%) | 9 (0.4%) |
Income Below Poverty Among Single-Parent Households in Woodway
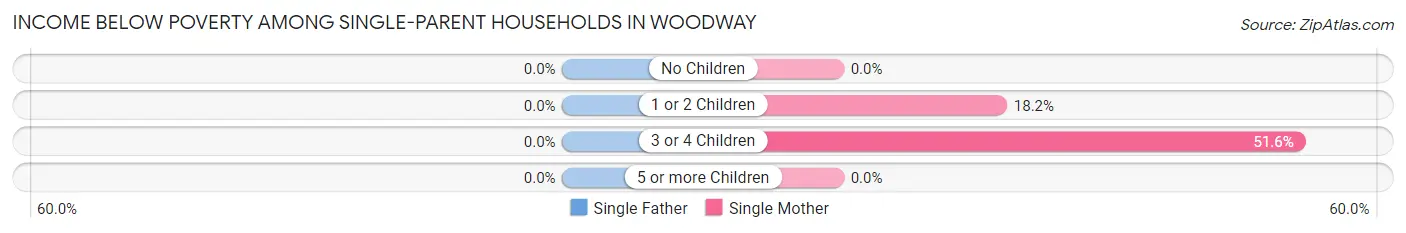
| Children | Single Father | Single Mother |
| No Children | 0 (0.0%) | 0 (0.0%) |
| 1 or 2 Children | 0 (0.0%) | 29 (18.2%) |
| 3 or 4 Children | 0 (0.0%) | 16 (51.6%) |
| 5 or more Children | 0 (0.0%) | 0 (0.0%) |
| Total | 0 (0.0%) | 45 (13.2%) |
Income Below Poverty Among Married-Couple vs Single-Parent Households in Woodway
The poverty data for Woodway shows that 9 of the married-couple family households (0.4%) and 45 of the single-parent households (11.5%) are living below the poverty level. Within the married-couple family households, those with no children have the highest poverty rate, with 9 households (0.6%) falling below the poverty line. Among the single-parent households, those with 3 or 4 children have the highest poverty rate, with 16 household (42.1%) living below poverty.
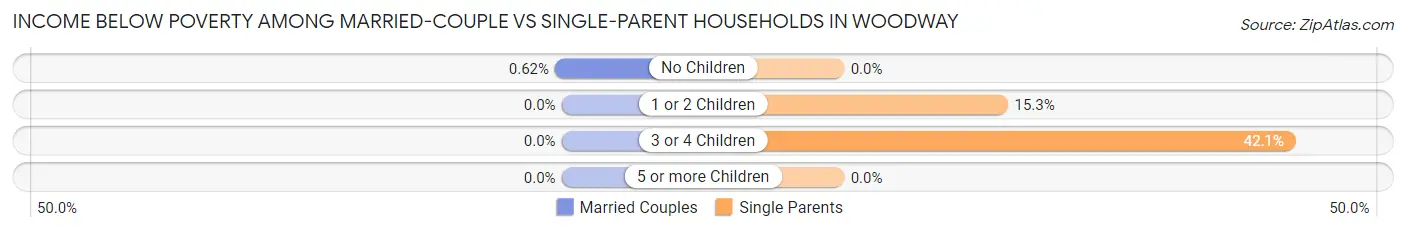
| Children | Married-Couple Families | Single-Parent Households |
| No Children | 9 (0.6%) | 0 (0.0%) |
| 1 or 2 Children | 0 (0.0%) | 29 (15.3%) |
| 3 or 4 Children | 0 (0.0%) | 16 (42.1%) |
| 5 or more Children | 0 (0.0%) | 0 (0.0%) |
| Total | 9 (0.4%) | 45 (11.5%) |
Race in Woodway
The most populous races in Woodway are White / Caucasian (8,257 | 87.8%), Hispanic or Latino (806 | 8.6%), and Black / African American (359 | 3.8%).
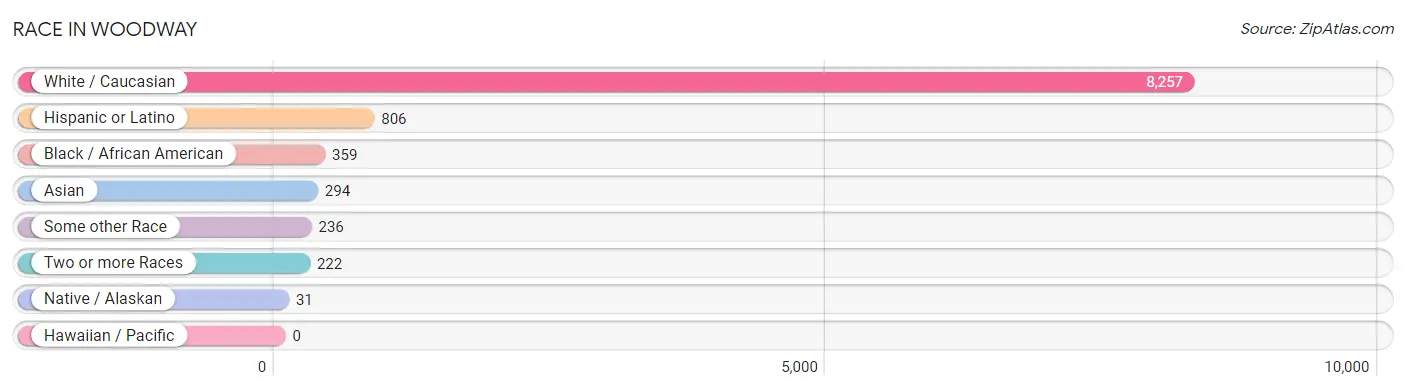
| Race | # Population | % Population |
| Asian | 294 | 3.1% |
| Black / African American | 359 | 3.8% |
| Hawaiian / Pacific | 0 | 0.0% |
| Hispanic or Latino | 806 | 8.6% |
| Native / Alaskan | 31 | 0.3% |
| White / Caucasian | 8,257 | 87.8% |
| Two or more Races | 222 | 2.4% |
| Some other Race | 236 | 2.5% |
| Total | 9,399 | 100.0% |
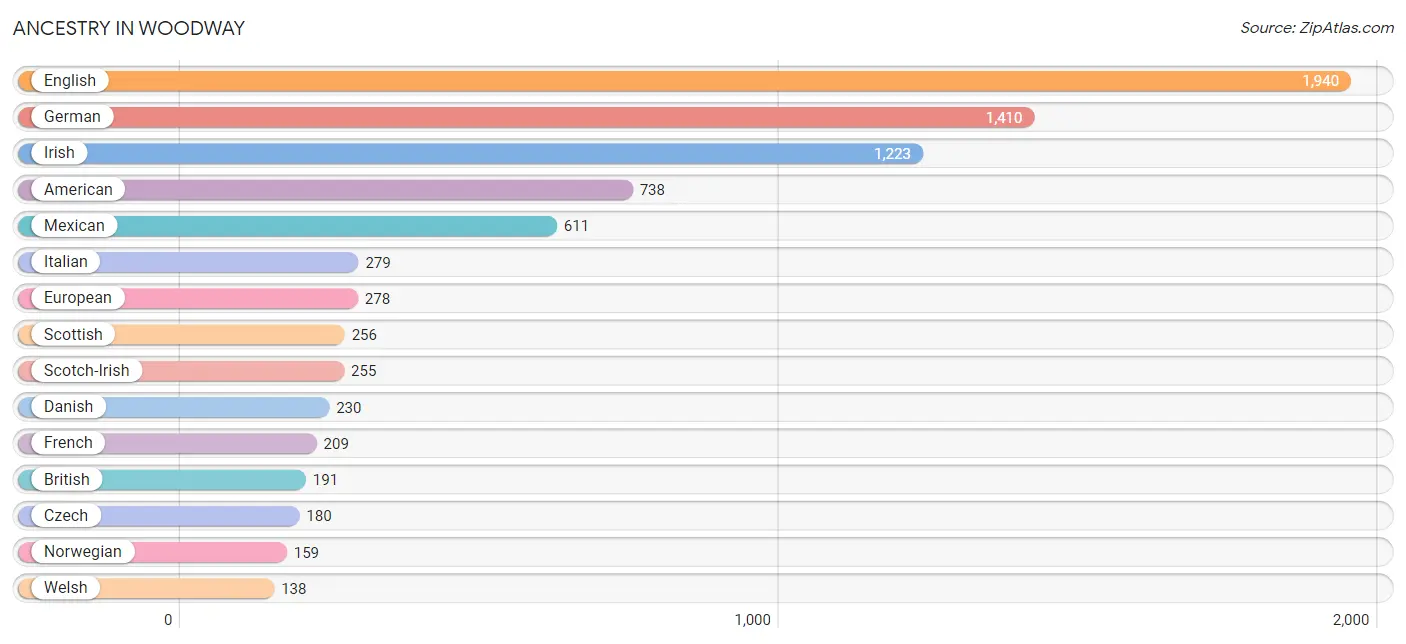
Ancestry in Woodway
The most populous ancestries reported in Woodway are English (1,940 | 20.6%), German (1,410 | 15.0%), Irish (1,223 | 13.0%), American (738 | 7.9%), and Mexican (611 | 6.5%), together accounting for 63.0% of all Woodway residents.
| Ancestry | # Population | % Population |
| African | 5 | 0.1% |
| American | 738 | 7.9% |
| Apache | 31 | 0.3% |
| Arab | 53 | 0.6% |
| Australian | 11 | 0.1% |
| Bhutanese | 56 | 0.6% |
| British | 191 | 2.0% |
| Burmese | 54 | 0.6% |
| Cajun | 43 | 0.5% |
| Canadian | 43 | 0.5% |
| Cherokee | 26 | 0.3% |
| Chickasaw | 3 | 0.0% |
| Choctaw | 5 | 0.1% |
| Colombian | 29 | 0.3% |
| Czech | 180 | 1.9% |
| Danish | 230 | 2.5% |
| Delaware | 13 | 0.1% |
| Dominican | 49 | 0.5% |
| Dutch | 36 | 0.4% |
| Eastern European | 15 | 0.2% |
| Ecuadorian | 28 | 0.3% |
| English | 1,940 | 20.6% |
| European | 278 | 3.0% |
| French | 209 | 2.2% |
| French Canadian | 7 | 0.1% |
| German | 1,410 | 15.0% |
| Hungarian | 24 | 0.3% |
| Indian (Asian) | 45 | 0.5% |
| Irish | 1,223 | 13.0% |
| Italian | 279 | 3.0% |
| Korean | 91 | 1.0% |
| Lebanese | 53 | 0.6% |
| Mexican | 611 | 6.5% |
| Northern European | 82 | 0.9% |
| Norwegian | 159 | 1.7% |
| Pakistani | 7 | 0.1% |
| Polish | 107 | 1.1% |
| Puerto Rican | 60 | 0.6% |
| Russian | 27 | 0.3% |
| Scotch-Irish | 255 | 2.7% |
| Scottish | 256 | 2.7% |
| Slovak | 9 | 0.1% |
| South American | 57 | 0.6% |
| Spanish | 29 | 0.3% |
| Sri Lankan | 8 | 0.1% |
| Subsaharan African | 5 | 0.1% |
| Swedish | 58 | 0.6% |
| Swiss | 47 | 0.5% |
| Thai | 90 | 1.0% |
| Turkish | 13 | 0.1% |
| Ukrainian | 37 | 0.4% |
| Welsh | 138 | 1.5% | View All 52 Rows |
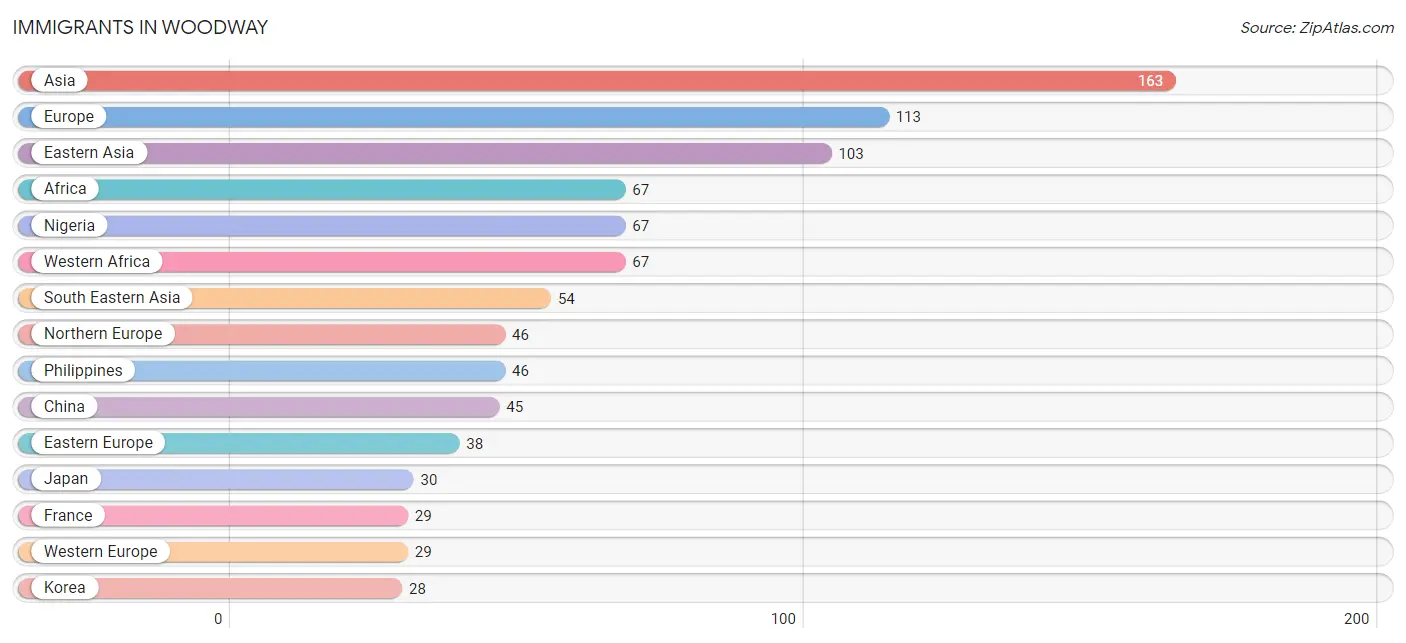
Immigrants in Woodway
The most numerous immigrant groups reported in Woodway came from Asia (163 | 1.7%), Europe (113 | 1.2%), Eastern Asia (103 | 1.1%), Africa (67 | 0.7%), and Nigeria (67 | 0.7%), together accounting for 5.5% of all Woodway residents.
| Immigration Origin | # Population | % Population |
| Africa | 67 | 0.7% |
| Asia | 163 | 1.7% |
| Canada | 18 | 0.2% |
| Central America | 7 | 0.1% |
| China | 45 | 0.5% |
| Denmark | 24 | 0.3% |
| Eastern Asia | 103 | 1.1% |
| Eastern Europe | 38 | 0.4% |
| England | 11 | 0.1% |
| Europe | 113 | 1.2% |
| France | 29 | 0.3% |
| India | 6 | 0.1% |
| Japan | 30 | 0.3% |
| Korea | 28 | 0.3% |
| Latin America | 7 | 0.1% |
| Mexico | 7 | 0.1% |
| Nigeria | 67 | 0.7% |
| Northern Europe | 46 | 0.5% |
| Philippines | 46 | 0.5% |
| Russia | 27 | 0.3% |
| South Central Asia | 6 | 0.1% |
| South Eastern Asia | 54 | 0.6% |
| Taiwan | 25 | 0.3% |
| Ukraine | 11 | 0.1% |
| Vietnam | 8 | 0.1% |
| Western Africa | 67 | 0.7% |
| Western Europe | 29 | 0.3% | View All 27 Rows |
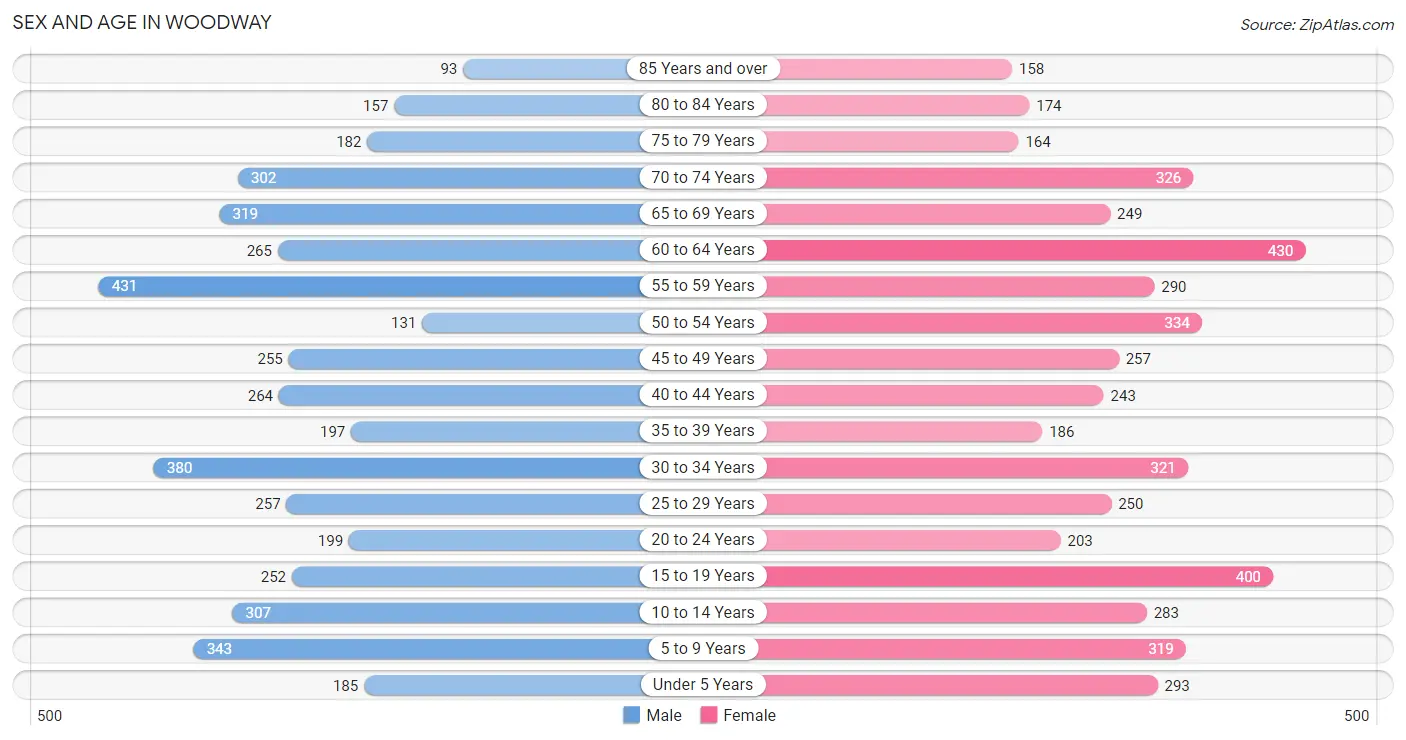
Sex and Age in Woodway
Sex and Age in Woodway
The most populous age groups in Woodway are 55 to 59 Years (431 | 9.5%) for men and 60 to 64 Years (430 | 8.8%) for women.
| Age Bracket | Male | Female |
| Under 5 Years | 185 (4.1%) | 293 (6.0%) |
| 5 to 9 Years | 343 (7.6%) | 319 (6.5%) |
| 10 to 14 Years | 307 (6.8%) | 283 (5.8%) |
| 15 to 19 Years | 252 (5.6%) | 400 (8.2%) |
| 20 to 24 Years | 199 (4.4%) | 203 (4.2%) |
| 25 to 29 Years | 257 (5.7%) | 250 (5.1%) |
| 30 to 34 Years | 380 (8.4%) | 321 (6.6%) |
| 35 to 39 Years | 197 (4.4%) | 186 (3.8%) |
| 40 to 44 Years | 264 (5.8%) | 243 (5.0%) |
| 45 to 49 Years | 255 (5.6%) | 257 (5.3%) |
| 50 to 54 Years | 131 (2.9%) | 334 (6.8%) |
| 55 to 59 Years | 431 (9.5%) | 290 (5.9%) |
| 60 to 64 Years | 265 (5.9%) | 430 (8.8%) |
| 65 to 69 Years | 319 (7.1%) | 249 (5.1%) |
| 70 to 74 Years | 302 (6.7%) | 326 (6.7%) |
| 75 to 79 Years | 182 (4.0%) | 164 (3.4%) |
| 80 to 84 Years | 157 (3.5%) | 174 (3.6%) |
| 85 Years and over | 93 (2.1%) | 158 (3.2%) |
| Total | 4,519 (100.0%) | 4,880 (100.0%) |
Families and Households in Woodway
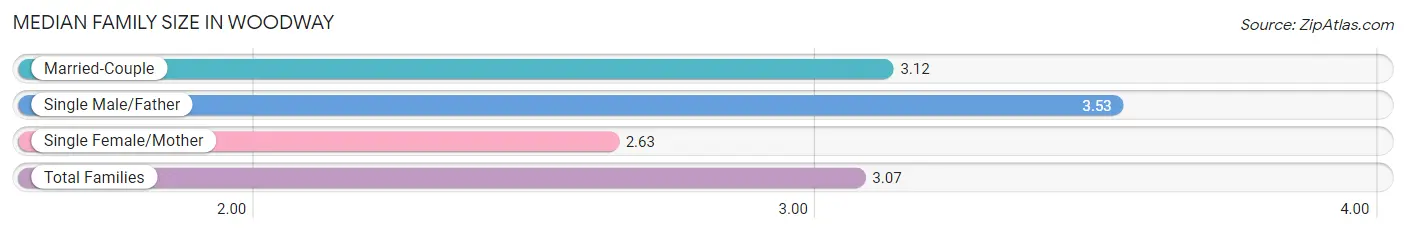
Median Family Size in Woodway
The median family size in Woodway is 3.07 persons per family, with single male/father families (51 | 1.9%) accounting for the largest median family size of 3.53 persons per family. On the other hand, single female/mother families (342 | 12.9%) represent the smallest median family size with 2.63 persons per family.
| Family Type | # Families | Family Size |
| Married-Couple | 2,254 (85.2%) | 3.12 |
| Single Male/Father | 51 (1.9%) | 3.53 |
| Single Female/Mother | 342 (12.9%) | 2.63 |
| Total Families | 2,647 (100.0%) | 3.07 |
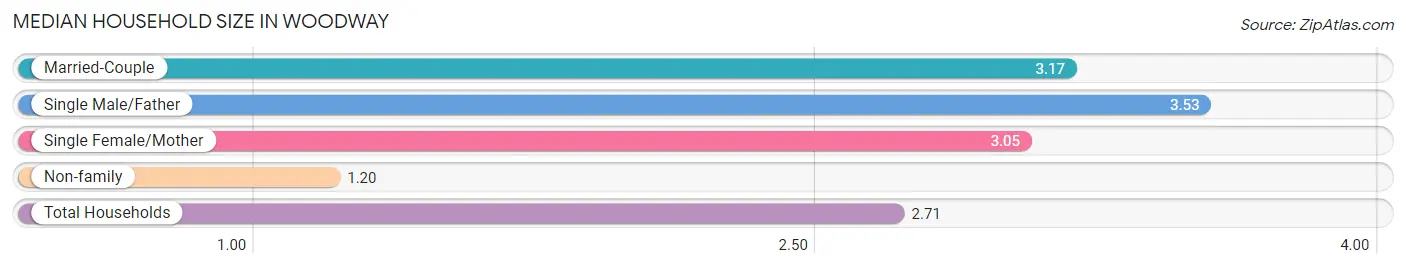
Median Household Size in Woodway
The median household size in Woodway is 2.71 persons per household, with single male/father households (51 | 1.5%) accounting for the largest median household size of 3.53 persons per household. non-family households (797 | 23.1%) represent the smallest median household size with 1.20 persons per household.
| Household Type | # Households | Household Size |
| Married-Couple | 2,254 (65.4%) | 3.17 |
| Single Male/Father | 51 (1.5%) | 3.53 |
| Single Female/Mother | 342 (9.9%) | 3.05 |
| Non-family | 797 (23.1%) | 1.20 |
| Total Households | 3,444 (100.0%) | 2.71 |
Household Size by Marriage Status in Woodway
Out of a total of 3,444 households in Woodway, 2,647 (76.9%) are family households, while 797 (23.1%) are nonfamily households. The most numerous type of family households are 2-person households, comprising 1,292, and the most common type of nonfamily households are 1-person households, comprising 662.
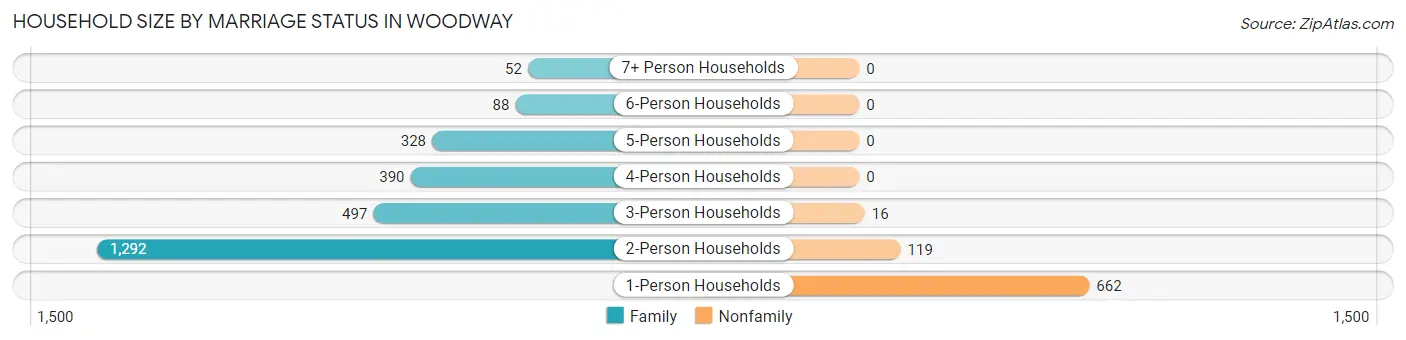
| Household Size | Family Households | Nonfamily Households |
| 1-Person Households | - | 662 (19.2%) |
| 2-Person Households | 1,292 (37.5%) | 119 (3.5%) |
| 3-Person Households | 497 (14.4%) | 16 (0.5%) |
| 4-Person Households | 390 (11.3%) | 0 (0.0%) |
| 5-Person Households | 328 (9.5%) | 0 (0.0%) |
| 6-Person Households | 88 (2.6%) | 0 (0.0%) |
| 7+ Person Households | 52 (1.5%) | 0 (0.0%) |
| Total | 2,647 (76.9%) | 797 (23.1%) |
Female Fertility in Woodway
Fertility by Age in Woodway
Average fertility rate in Woodway is 49.0 births per 1,000 women. Women in the age bracket of 20 to 34 years have the highest fertility rate with 109.0 births per 1,000 women. Women in the age bracket of 20 to 34 years acount for 89.4% of all women with births.
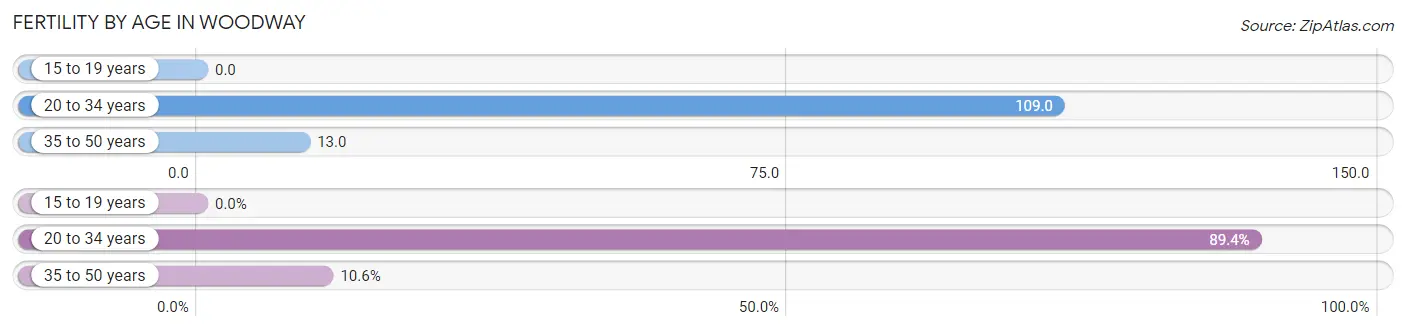
| Age Bracket | Women with Births | Births / 1,000 Women |
| 15 to 19 years | 0 (0.0%) | 0.0 |
| 20 to 34 years | 84 (89.4%) | 109.0 |
| 35 to 50 years | 10 (10.6%) | 13.0 |
| Total | 94 (100.0%) | 49.0 |
Fertility by Age by Marriage Status in Woodway
69.1% of women with births (94) in Woodway are married. The highest percentage of unmarried women with births falls into 20 to 34 years age bracket with 34.5% of them unmarried at the time of birth, while the lowest percentage of unmarried women with births belong to 35 to 50 years age bracket with 0.0% of them unmarried.
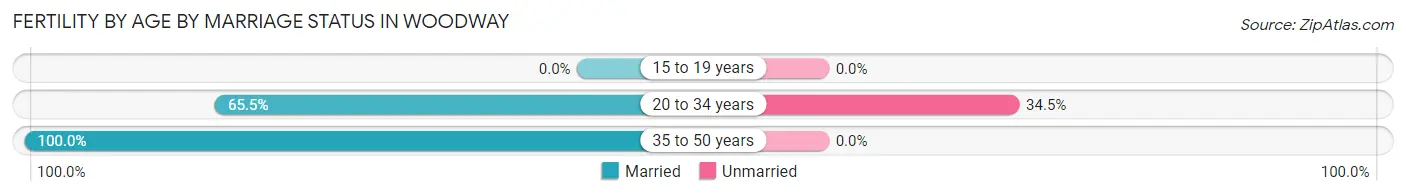
| Age Bracket | Married | Unmarried |
| 15 to 19 years | 0 (0.0%) | 0 (0.0%) |
| 20 to 34 years | 55 (65.5%) | 29 (34.5%) |
| 35 to 50 years | 10 (100.0%) | 0 (0.0%) |
| Total | 65 (69.2%) | 29 (30.8%) |
Fertility by Education in Woodway
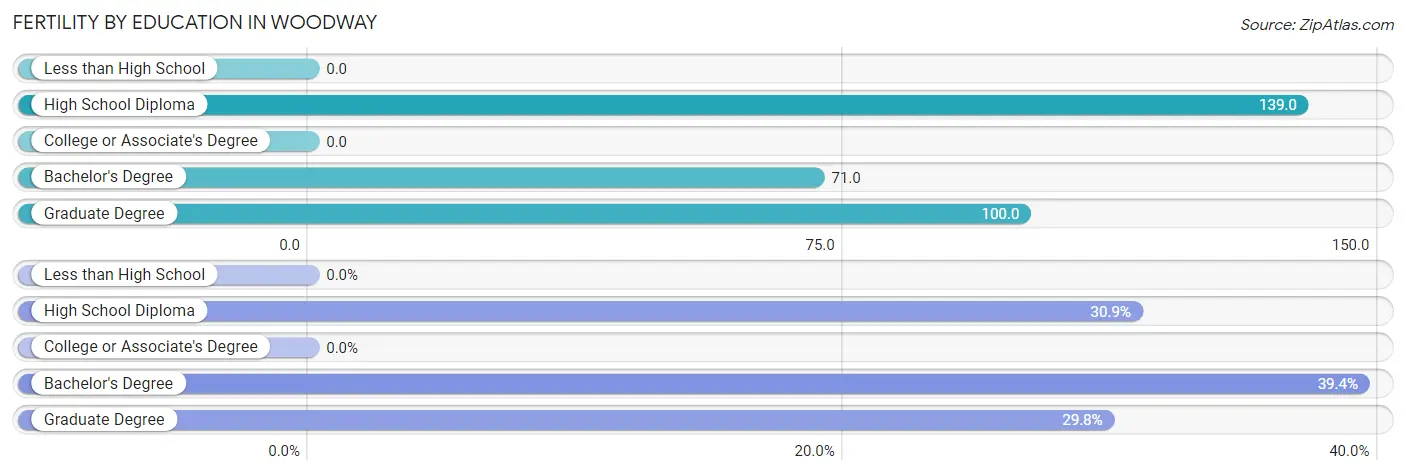
| Educational Attainment | Women with Births | Births / 1,000 Women |
| Less than High School | 0 (0.0%) | 0.0 |
| High School Diploma | 29 (30.8%) | 139.0 |
| College or Associate's Degree | 0 (0.0%) | 0.0 |
| Bachelor's Degree | 37 (39.4%) | 71.0 |
| Graduate Degree | 28 (29.8%) | 100.0 |
| Total | 94 (100.0%) | 49.0 |
Fertility by Education by Marriage Status in Woodway
30.8% of women with births in Woodway are unmarried. Women with the educational attainment of bachelor's degree are most likely to be married with 100.0% of them married at childbirth, while women with the educational attainment of high school diploma are least likely to be married with 100.0% of them unmarried at childbirth.
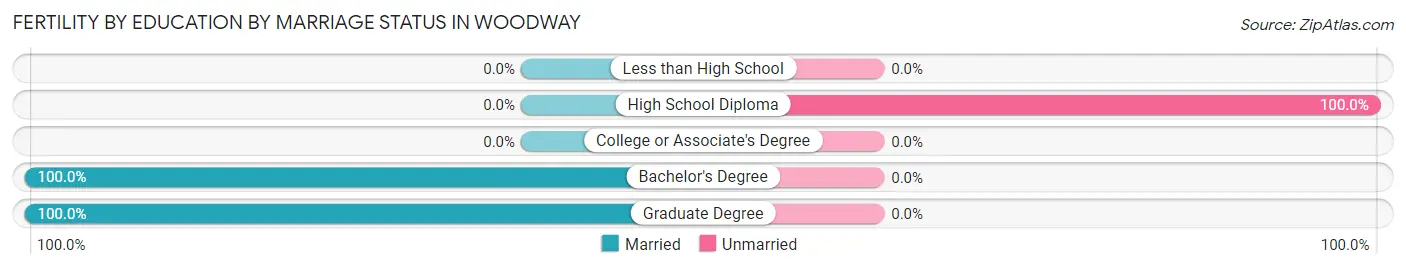
| Educational Attainment | Married | Unmarried |
| Less than High School | 0 (0.0%) | 0 (0.0%) |
| High School Diploma | 0 (0.0%) | 29 (100.0%) |
| College or Associate's Degree | 0 (0.0%) | 0 (0.0%) |
| Bachelor's Degree | 37 (100.0%) | 0 (0.0%) |
| Graduate Degree | 28 (100.0%) | 0 (0.0%) |
| Total | 65 (69.2%) | 29 (30.8%) |
Employment Characteristics in Woodway
Employment by Class of Employer in Woodway
Among the 4,279 employed individuals in Woodway, private company employees (2,058 | 48.1%), not-for-profit organizations (821 | 19.2%), and state government employees (438 | 10.2%) make up the most common classes of employment.

| Employer Class | # Employees | % Employees |
| Private Company Employees | 2,058 | 48.1% |
| Self-Employed (Incorporated) | 168 | 3.9% |
| Self-Employed (Not Incorporated) | 294 | 6.9% |
| Not-for-profit Organizations | 821 | 19.2% |
| Local Government Employees | 413 | 9.7% |
| State Government Employees | 438 | 10.2% |
| Federal Government Employees | 87 | 2.0% |
| Unpaid Family Workers | 0 | 0.0% |
| Total | 4,279 | 100.0% |
Employment Status by Age in Woodway
According to the labor force statistics for Woodway, out of the total population over 16 years of age (7,521), 60.2% or 4,528 individuals are in the labor force, with 4.1% or 186 of them unemployed. The age group with the highest labor force participation rate is 45 to 54 years, with 91.4% or 893 individuals in the labor force. Within the labor force, the 16 to 19 years age range has the highest percentage of unemployed individuals, with 16.9% or 41 of them being unemployed.
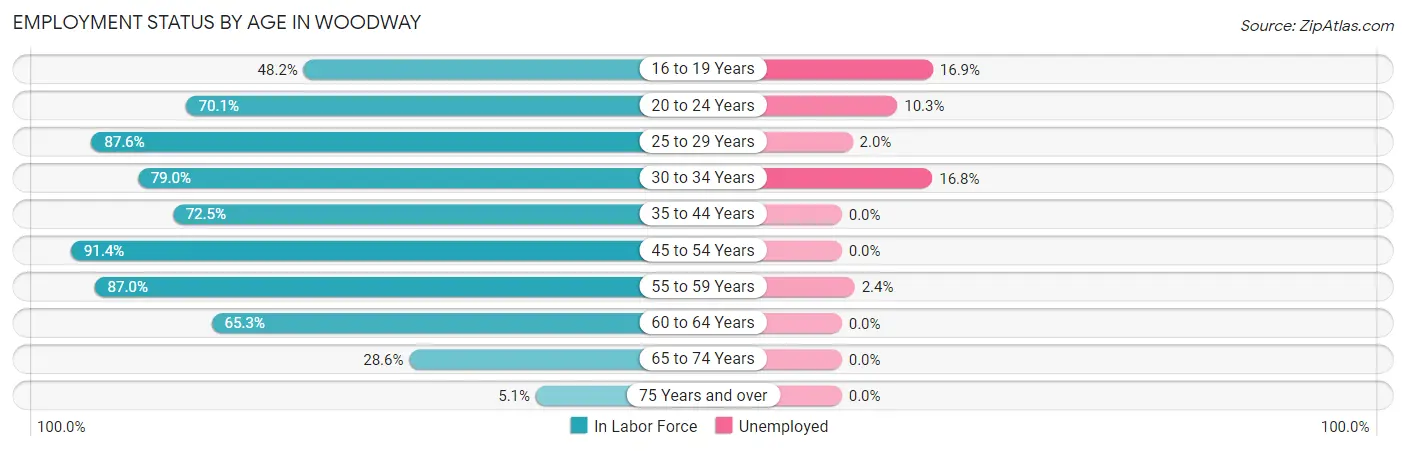
| Age Bracket | In Labor Force | Unemployed |
| 16 to 19 Years | 243 (48.2%) | 41 (16.9%) |
| 20 to 24 Years | 282 (70.1%) | 29 (10.3%) |
| 25 to 29 Years | 444 (87.6%) | 9 (2.0%) |
| 30 to 34 Years | 554 (79.0%) | 93 (16.8%) |
| 35 to 44 Years | 645 (72.5%) | 0 (0.0%) |
| 45 to 54 Years | 893 (91.4%) | 0 (0.0%) |
| 55 to 59 Years | 627 (87.0%) | 15 (2.4%) |
| 60 to 64 Years | 454 (65.3%) | 0 (0.0%) |
| 65 to 74 Years | 342 (28.6%) | 0 (0.0%) |
| 75 Years and over | 47 (5.1%) | 0 (0.0%) |
| Total | 4,528 (60.2%) | 186 (4.1%) |
Employment Status by Educational Attainment in Woodway
According to labor force statistics for Woodway, 80.5% of individuals (3,615) out of the total population between 25 and 64 years of age (4,491) are in the labor force, with 3.2% or 116 of them being unemployed. The group with the highest labor force participation rate are those with the educational attainment of bachelor's degree or higher, with 85.5% or 2,411 individuals in the labor force. Within the labor force, individuals with college / associate degree education have the highest percentage of unemployment, with 7.3% or 68 of them being unemployed.
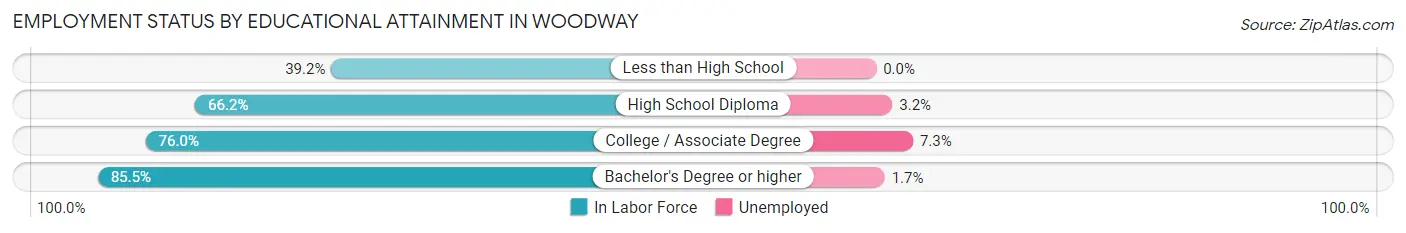
| Educational Attainment | In Labor Force | Unemployed |
| Less than High School | 29 (39.2%) | 0 (0.0%) |
| High School Diploma | 249 (66.2%) | 12 (3.2%) |
| College / Associate Degree | 928 (76.0%) | 89 (7.3%) |
| Bachelor's Degree or higher | 2,411 (85.5%) | 48 (1.7%) |
| Total | 3,615 (80.5%) | 144 (3.2%) |
Employment Occupations by Sex in Woodway
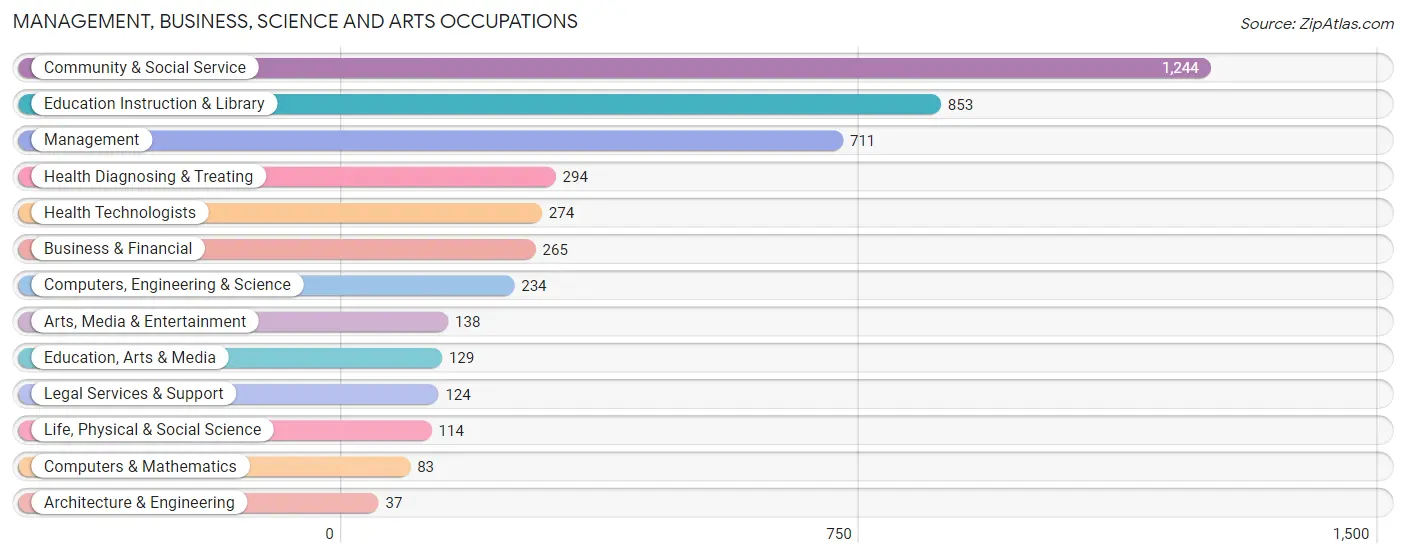
Management, Business, Science and Arts Occupations
The most common Management, Business, Science and Arts occupations in Woodway are Community & Social Service (1,244 | 28.6%), Education Instruction & Library (853 | 19.6%), Management (711 | 16.4%), Health Diagnosing & Treating (294 | 6.8%), and Health Technologists (274 | 6.3%).
Management, Business, Science and Arts Occupations by Sex
Within the Management, Business, Science and Arts occupations in Woodway, the most male-oriented occupations are Architecture & Engineering (100.0%), Legal Services & Support (83.9%), and Arts, Media & Entertainment (80.4%), while the most female-oriented occupations are Education Instruction & Library (78.5%), Life, Physical & Social Science (76.3%), and Community & Social Service (61.4%).
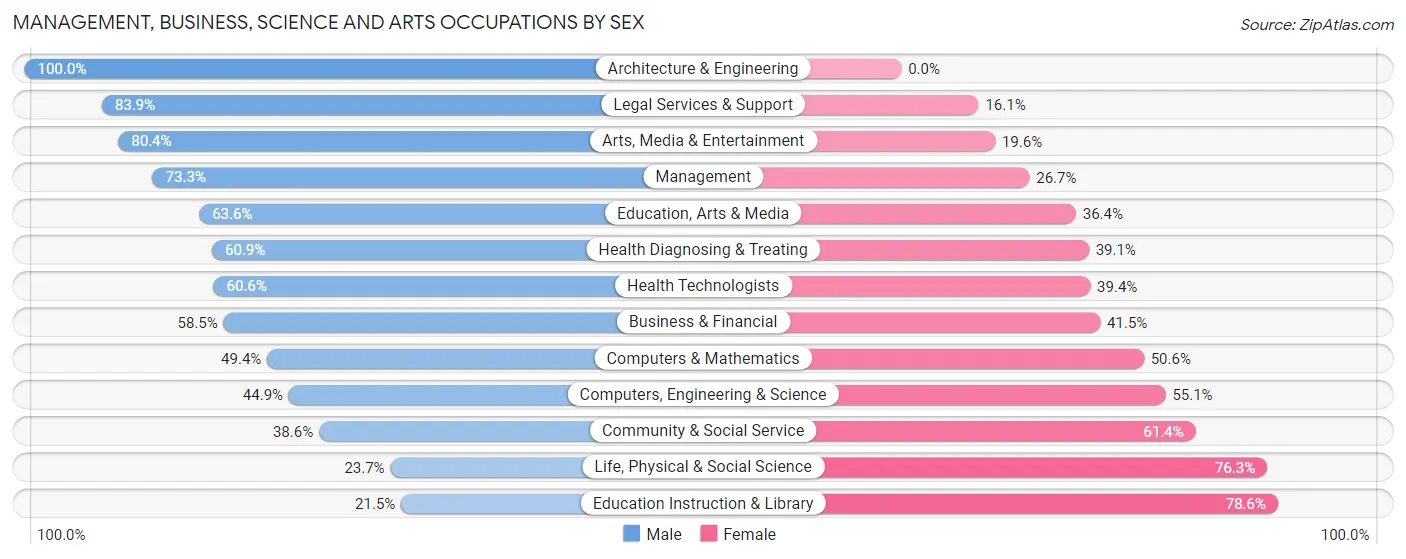
| Occupation | Male | Female |
| Management | 521 (73.3%) | 190 (26.7%) |
| Business & Financial | 155 (58.5%) | 110 (41.5%) |
| Computers, Engineering & Science | 105 (44.9%) | 129 (55.1%) |
| Computers & Mathematics | 41 (49.4%) | 42 (50.6%) |
| Architecture & Engineering | 37 (100.0%) | 0 (0.0%) |
| Life, Physical & Social Science | 27 (23.7%) | 87 (76.3%) |
| Community & Social Service | 480 (38.6%) | 764 (61.4%) |
| Education, Arts & Media | 82 (63.6%) | 47 (36.4%) |
| Legal Services & Support | 104 (83.9%) | 20 (16.1%) |
| Education Instruction & Library | 183 (21.4%) | 670 (78.5%) |
| Arts, Media & Entertainment | 111 (80.4%) | 27 (19.6%) |
| Health Diagnosing & Treating | 179 (60.9%) | 115 (39.1%) |
| Health Technologists | 166 (60.6%) | 108 (39.4%) |
| Total (Category) | 1,440 (52.4%) | 1,308 (47.6%) |
| Total (Overall) | 2,357 (54.3%) | 1,987 (45.7%) |
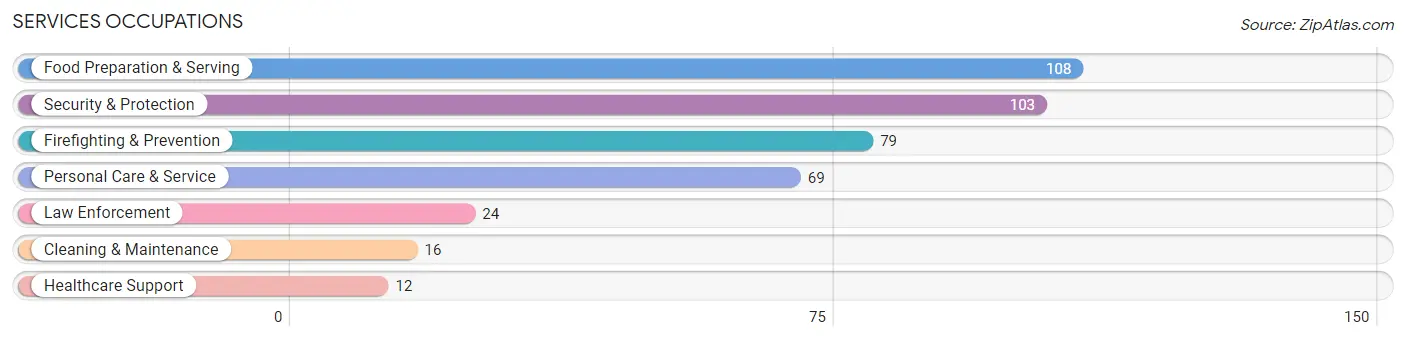
Services Occupations
The most common Services occupations in Woodway are Food Preparation & Serving (108 | 2.5%), Security & Protection (103 | 2.4%), Firefighting & Prevention (79 | 1.8%), Personal Care & Service (69 | 1.6%), and Law Enforcement (24 | 0.5%).
Services Occupations by Sex
Within the Services occupations in Woodway, the most male-oriented occupations are Security & Protection (100.0%), Firefighting & Prevention (100.0%), and Law Enforcement (100.0%), while the most female-oriented occupations are Healthcare Support (100.0%), Personal Care & Service (100.0%), and Food Preparation & Serving (66.7%).
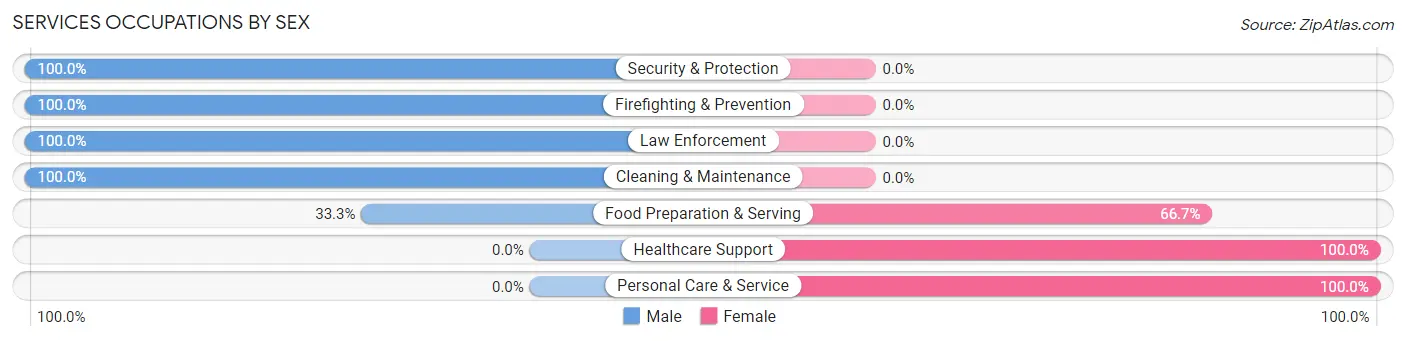
| Occupation | Male | Female |
| Healthcare Support | 0 (0.0%) | 12 (100.0%) |
| Security & Protection | 103 (100.0%) | 0 (0.0%) |
| Firefighting & Prevention | 79 (100.0%) | 0 (0.0%) |
| Law Enforcement | 24 (100.0%) | 0 (0.0%) |
| Food Preparation & Serving | 36 (33.3%) | 72 (66.7%) |
| Cleaning & Maintenance | 16 (100.0%) | 0 (0.0%) |
| Personal Care & Service | 0 (0.0%) | 69 (100.0%) |
| Total (Category) | 155 (50.3%) | 153 (49.7%) |
| Total (Overall) | 2,357 (54.3%) | 1,987 (45.7%) |
Sales and Office Occupations
The most common Sales and Office occupations in Woodway are Office & Administration (329 | 7.6%), and Sales & Related (171 | 3.9%).

Sales and Office Occupations by Sex
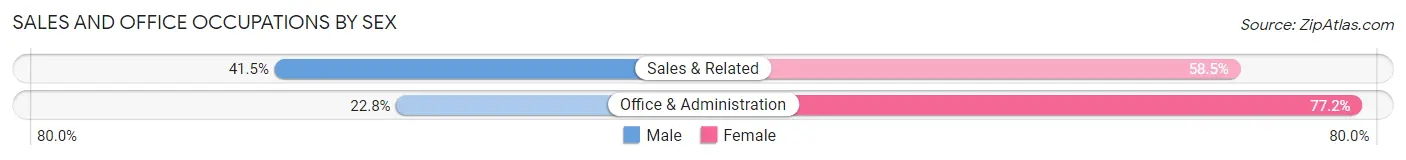
| Occupation | Male | Female |
| Sales & Related | 71 (41.5%) | 100 (58.5%) |
| Office & Administration | 75 (22.8%) | 254 (77.2%) |
| Total (Category) | 146 (29.2%) | 354 (70.8%) |
| Total (Overall) | 2,357 (54.3%) | 1,987 (45.7%) |
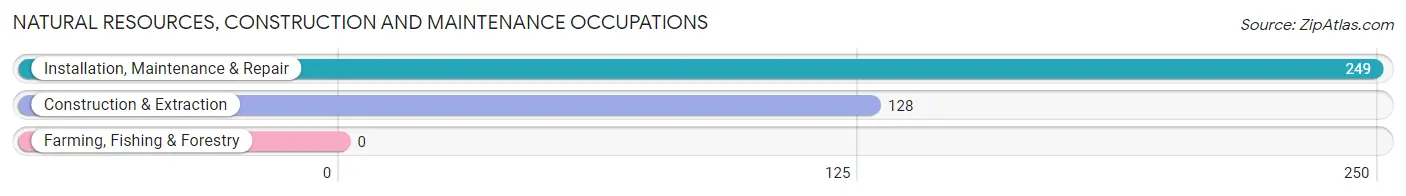
Natural Resources, Construction and Maintenance Occupations
The most common Natural Resources, Construction and Maintenance occupations in Woodway are Installation, Maintenance & Repair (249 | 5.7%), and Construction & Extraction (128 | 2.9%).
Natural Resources, Construction and Maintenance Occupations by Sex
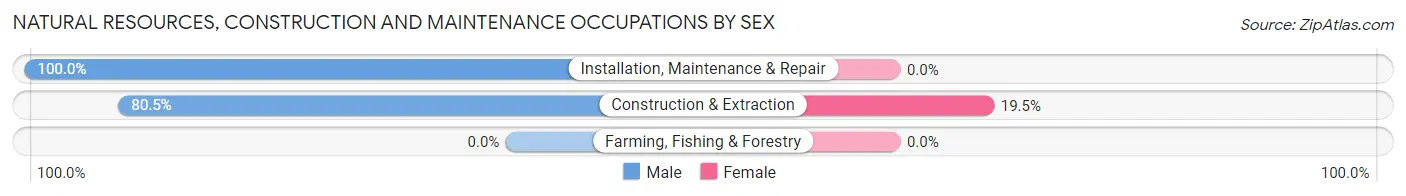
| Occupation | Male | Female |
| Farming, Fishing & Forestry | 0 (0.0%) | 0 (0.0%) |
| Construction & Extraction | 103 (80.5%) | 25 (19.5%) |
| Installation, Maintenance & Repair | 249 (100.0%) | 0 (0.0%) |
| Total (Category) | 352 (93.4%) | 25 (6.6%) |
| Total (Overall) | 2,357 (54.3%) | 1,987 (45.7%) |
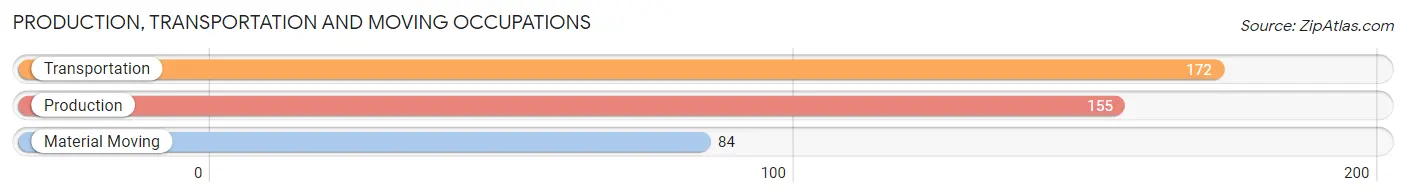
Production, Transportation and Moving Occupations
The most common Production, Transportation and Moving occupations in Woodway are Transportation (172 | 4.0%), Production (155 | 3.6%), and Material Moving (84 | 1.9%).
Production, Transportation and Moving Occupations by Sex
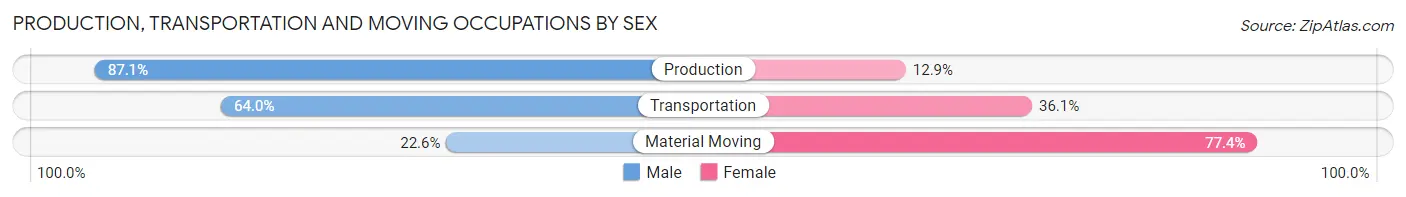
| Occupation | Male | Female |
| Production | 135 (87.1%) | 20 (12.9%) |
| Transportation | 110 (63.9%) | 62 (36.0%) |
| Material Moving | 19 (22.6%) | 65 (77.4%) |
| Total (Category) | 264 (64.2%) | 147 (35.8%) |
| Total (Overall) | 2,357 (54.3%) | 1,987 (45.7%) |
Employment Industries by Sex in Woodway
Employment Industries in Woodway
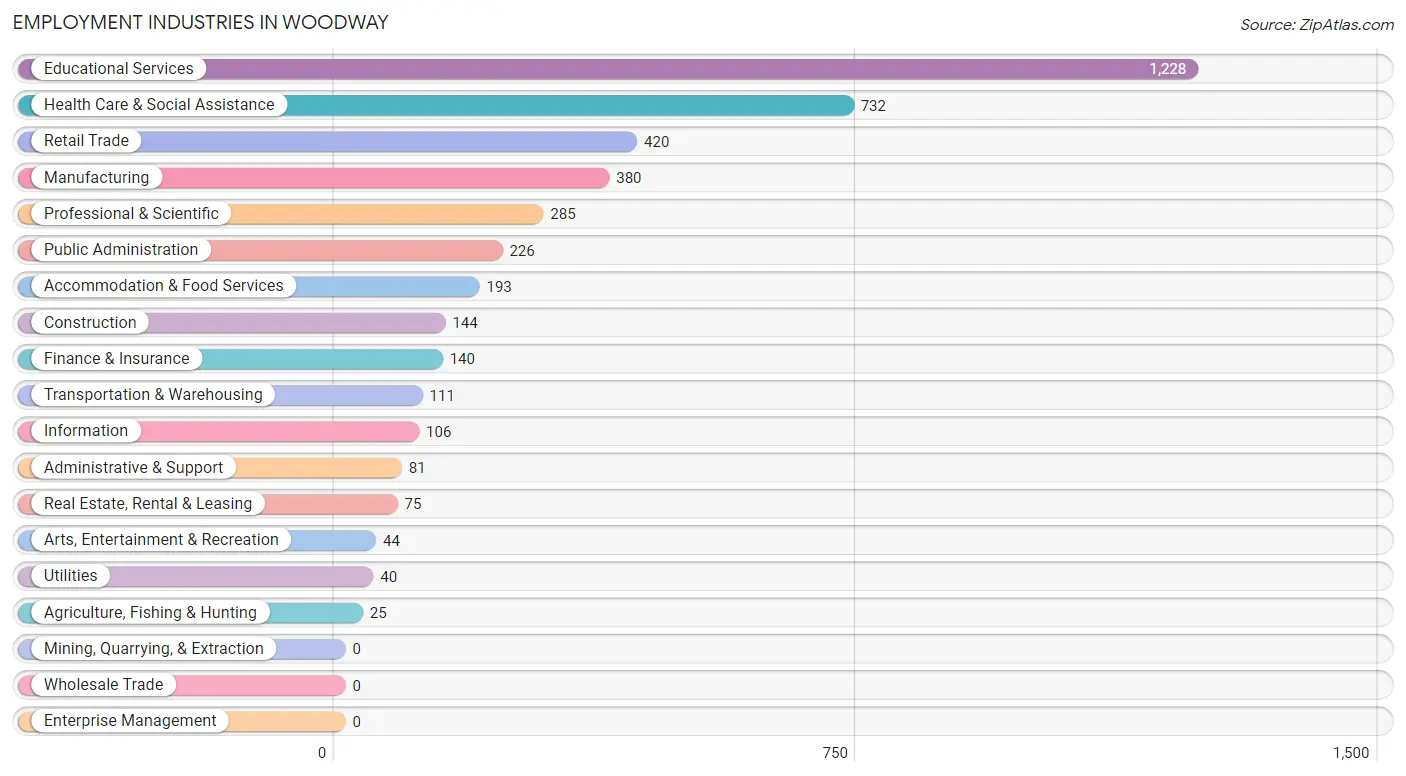
The major employment industries in Woodway include Educational Services (1,228 | 28.3%), Health Care & Social Assistance (732 | 16.9%), Retail Trade (420 | 9.7%), Manufacturing (380 | 8.7%), and Professional & Scientific (285 | 6.6%).
Employment Industries by Sex in Woodway
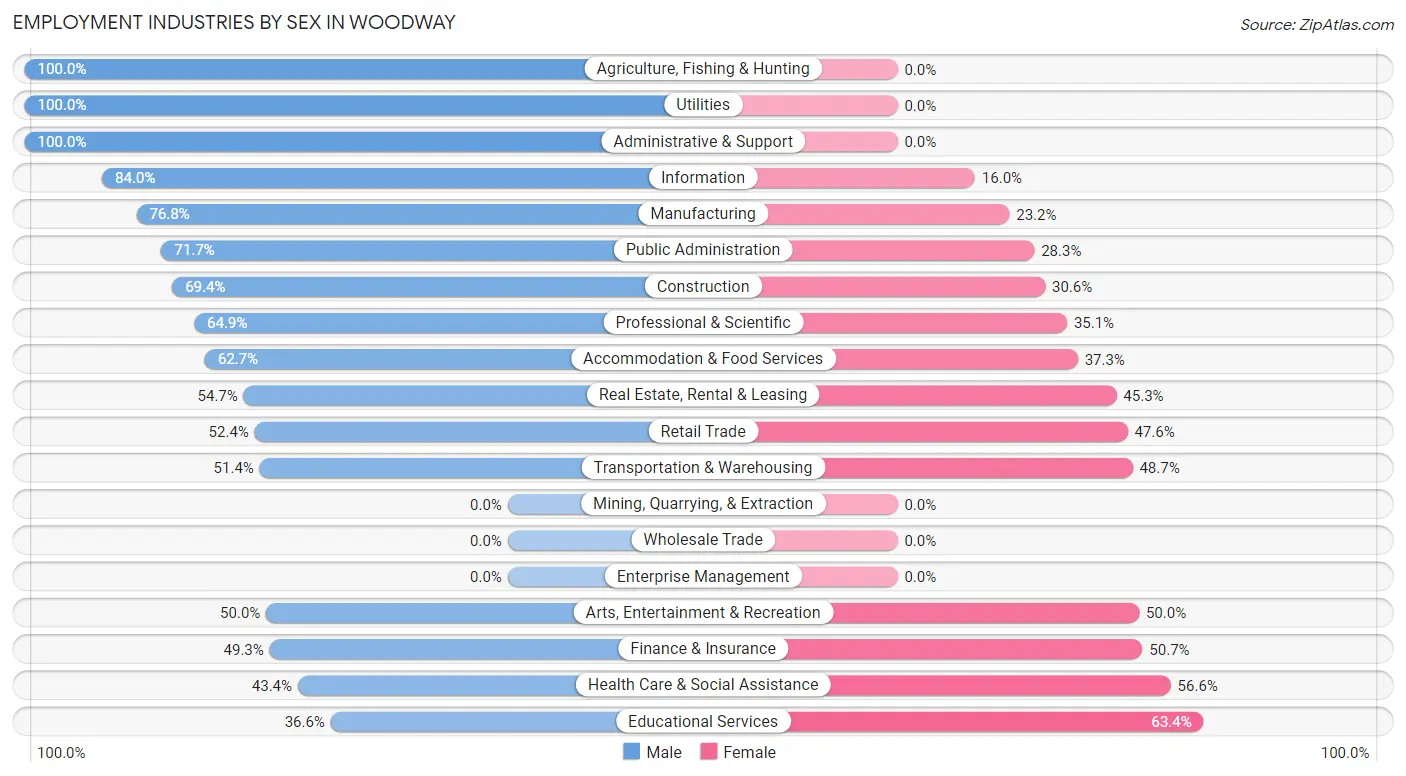
The Woodway industries that see more men than women are Agriculture, Fishing & Hunting (100.0%), Utilities (100.0%), and Administrative & Support (100.0%), whereas the industries that tend to have a higher number of women are Educational Services (63.4%), Health Care & Social Assistance (56.6%), and Finance & Insurance (50.7%).
| Industry | Male | Female |
| Agriculture, Fishing & Hunting | 25 (100.0%) | 0 (0.0%) |
| Mining, Quarrying, & Extraction | 0 (0.0%) | 0 (0.0%) |
| Construction | 100 (69.4%) | 44 (30.6%) |
| Manufacturing | 292 (76.8%) | 88 (23.2%) |
| Wholesale Trade | 0 (0.0%) | 0 (0.0%) |
| Retail Trade | 220 (52.4%) | 200 (47.6%) |
| Transportation & Warehousing | 57 (51.3%) | 54 (48.6%) |
| Utilities | 40 (100.0%) | 0 (0.0%) |
| Information | 89 (84.0%) | 17 (16.0%) |
| Finance & Insurance | 69 (49.3%) | 71 (50.7%) |
| Real Estate, Rental & Leasing | 41 (54.7%) | 34 (45.3%) |
| Professional & Scientific | 185 (64.9%) | 100 (35.1%) |
| Enterprise Management | 0 (0.0%) | 0 (0.0%) |
| Administrative & Support | 81 (100.0%) | 0 (0.0%) |
| Educational Services | 450 (36.6%) | 778 (63.4%) |
| Health Care & Social Assistance | 318 (43.4%) | 414 (56.6%) |
| Arts, Entertainment & Recreation | 22 (50.0%) | 22 (50.0%) |
| Accommodation & Food Services | 121 (62.7%) | 72 (37.3%) |
| Public Administration | 162 (71.7%) | 64 (28.3%) |
| Total | 2,357 (54.3%) | 1,987 (45.7%) |
Education in Woodway
School Enrollment in Woodway
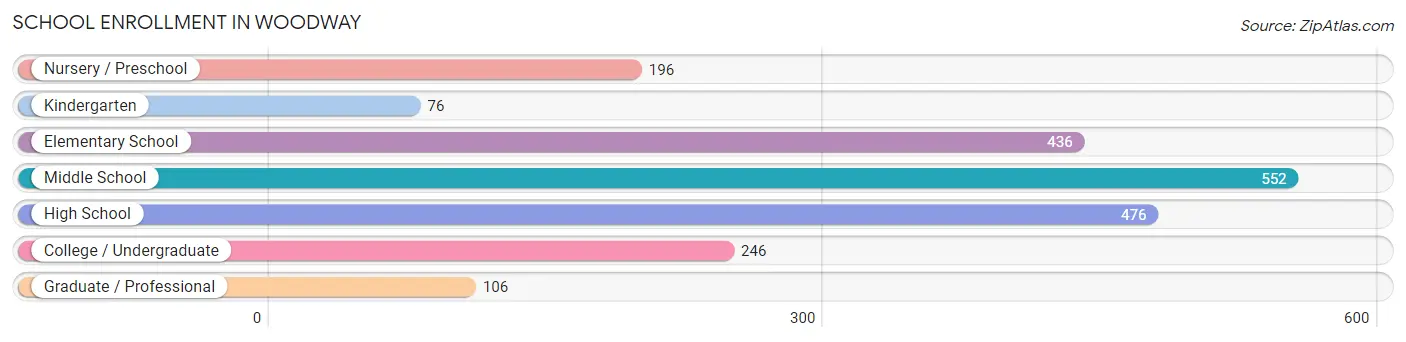
The most common levels of schooling among the 2,088 students in Woodway are middle school (552 | 26.4%), high school (476 | 22.8%), and elementary school (436 | 20.9%).
| School Level | # Students | % Students |
| Nursery / Preschool | 196 | 9.4% |
| Kindergarten | 76 | 3.6% |
| Elementary School | 436 | 20.9% |
| Middle School | 552 | 26.4% |
| High School | 476 | 22.8% |
| College / Undergraduate | 246 | 11.8% |
| Graduate / Professional | 106 | 5.1% |
| Total | 2,088 | 100.0% |
School Enrollment by Age by Funding Source in Woodway
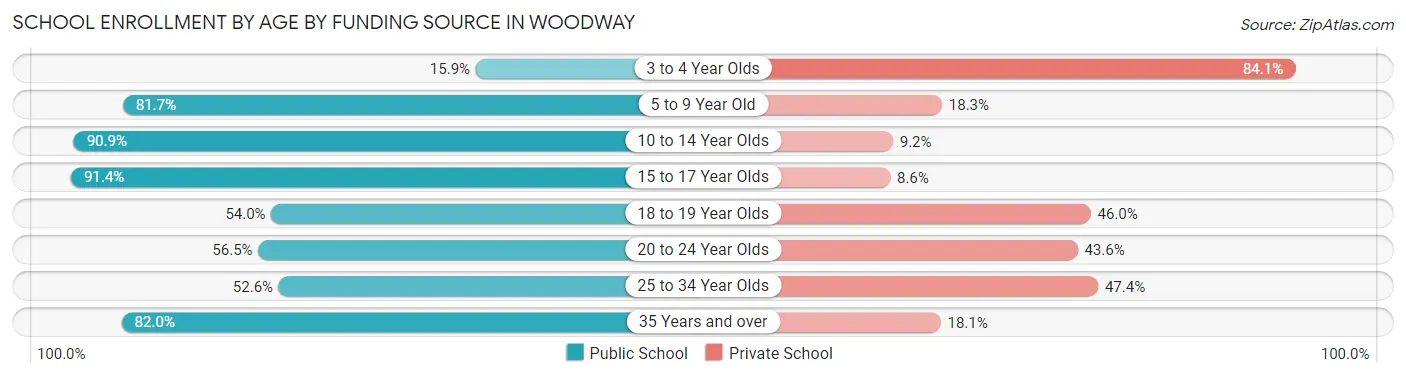
Out of a total of 2,088 students who are enrolled in schools in Woodway, 397 (19.0%) attend a private institution, while the remaining 1,691 (81.0%) are enrolled in public schools. The age group of 3 to 4 year olds has the highest likelihood of being enrolled in private schools, with 58 (84.1% in the age bracket) enrolled. Conversely, the age group of 15 to 17 year olds has the lowest likelihood of being enrolled in a private school, with 402 (91.4% in the age bracket) attending a public institution.
| Age Bracket | Public School | Private School |
| 3 to 4 Year Olds | 11 (15.9%) | 58 (84.1%) |
| 5 to 9 Year Old | 496 (81.7%) | 111 (18.3%) |
| 10 to 14 Year Olds | 536 (90.8%) | 54 (9.1%) |
| 15 to 17 Year Olds | 402 (91.4%) | 38 (8.6%) |
| 18 to 19 Year Olds | 47 (54.0%) | 40 (46.0%) |
| 20 to 24 Year Olds | 70 (56.5%) | 54 (43.5%) |
| 25 to 34 Year Olds | 20 (52.6%) | 18 (47.4%) |
| 35 Years and over | 109 (82.0%) | 24 (18.0%) |
| Total | 1,691 (81.0%) | 397 (19.0%) |
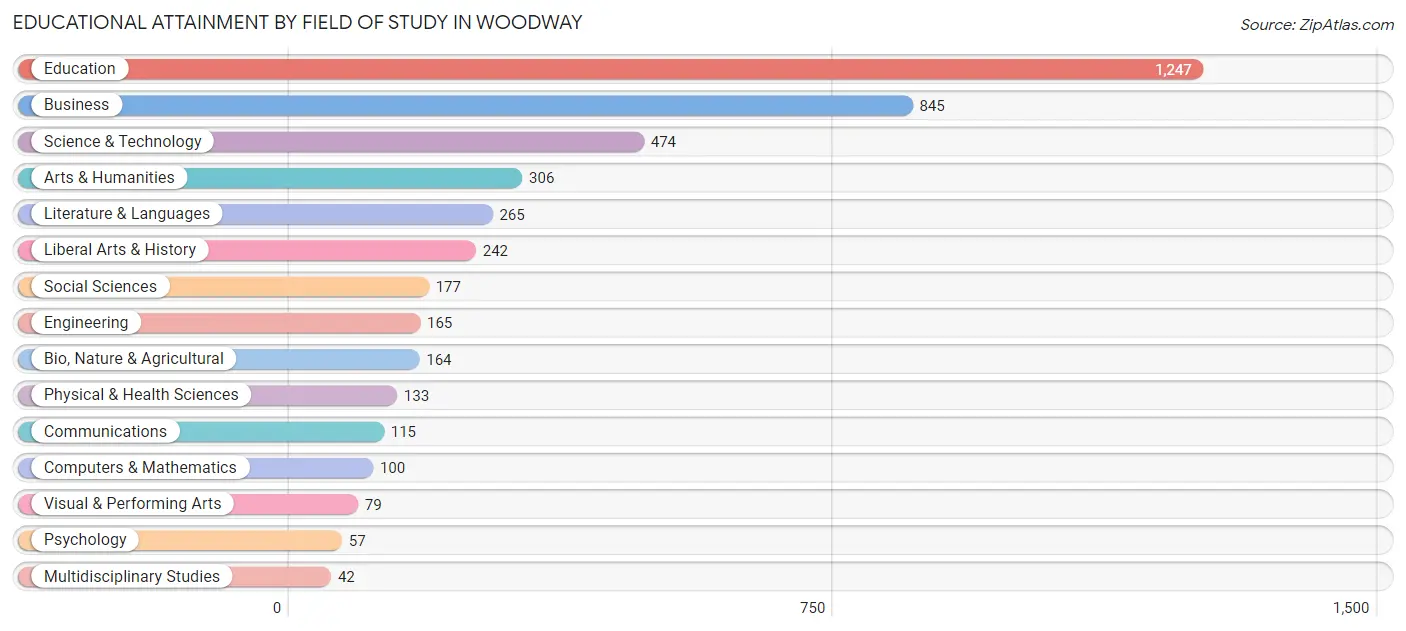
Educational Attainment by Field of Study in Woodway
Education (1,247 | 28.3%), business (845 | 19.2%), science & technology (474 | 10.7%), arts & humanities (306 | 6.9%), and literature & languages (265 | 6.0%) are the most common fields of study among 4,411 individuals in Woodway who have obtained a bachelor's degree or higher.
| Field of Study | # Graduates | % Graduates |
| Computers & Mathematics | 100 | 2.3% |
| Bio, Nature & Agricultural | 164 | 3.7% |
| Physical & Health Sciences | 133 | 3.0% |
| Psychology | 57 | 1.3% |
| Social Sciences | 177 | 4.0% |
| Engineering | 165 | 3.7% |
| Multidisciplinary Studies | 42 | 0.9% |
| Science & Technology | 474 | 10.7% |
| Business | 845 | 19.2% |
| Education | 1,247 | 28.3% |
| Literature & Languages | 265 | 6.0% |
| Liberal Arts & History | 242 | 5.5% |
| Visual & Performing Arts | 79 | 1.8% |
| Communications | 115 | 2.6% |
| Arts & Humanities | 306 | 6.9% |
| Total | 4,411 | 100.0% |
Transportation & Commute in Woodway
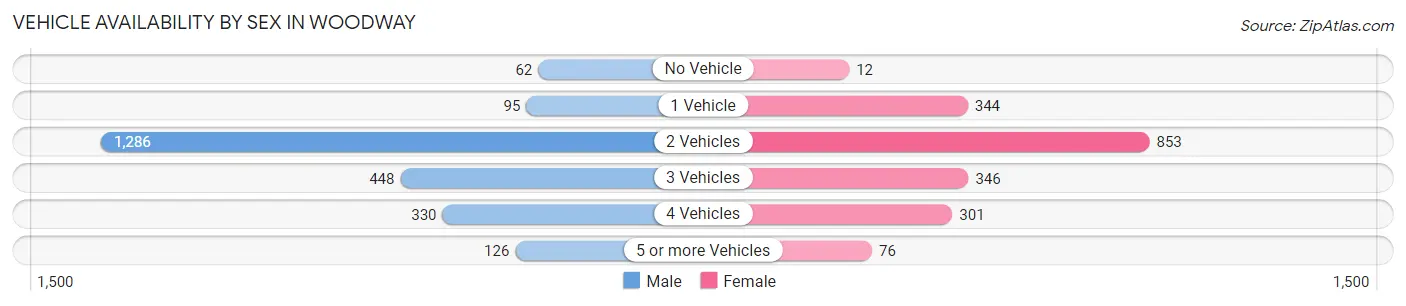
Vehicle Availability by Sex in Woodway
The most prevalent vehicle ownership categories in Woodway are males with 2 vehicles (1,286, accounting for 54.8%) and females with 2 vehicles (853, making up 66.6%).
| Vehicles Available | Male | Female |
| No Vehicle | 62 (2.6%) | 12 (0.6%) |
| 1 Vehicle | 95 (4.1%) | 344 (17.8%) |
| 2 Vehicles | 1,286 (54.8%) | 853 (44.2%) |
| 3 Vehicles | 448 (19.1%) | 346 (17.9%) |
| 4 Vehicles | 330 (14.1%) | 301 (15.6%) |
| 5 or more Vehicles | 126 (5.4%) | 76 (3.9%) |
| Total | 2,347 (100.0%) | 1,932 (100.0%) |
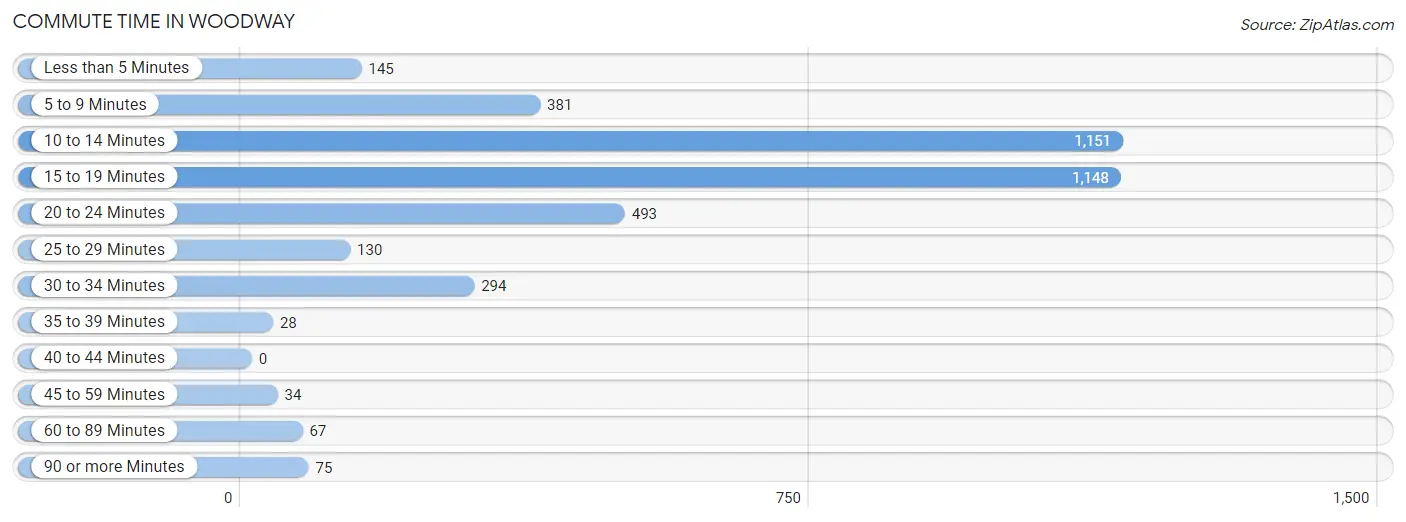
Commute Time in Woodway
The most frequently occuring commute durations in Woodway are 10 to 14 minutes (1,151 commuters, 29.2%), 15 to 19 minutes (1,148 commuters, 29.1%), and 20 to 24 minutes (493 commuters, 12.5%).
| Commute Time | # Commuters | % Commuters |
| Less than 5 Minutes | 145 | 3.7% |
| 5 to 9 Minutes | 381 | 9.7% |
| 10 to 14 Minutes | 1,151 | 29.2% |
| 15 to 19 Minutes | 1,148 | 29.1% |
| 20 to 24 Minutes | 493 | 12.5% |
| 25 to 29 Minutes | 130 | 3.3% |
| 30 to 34 Minutes | 294 | 7.4% |
| 35 to 39 Minutes | 28 | 0.7% |
| 40 to 44 Minutes | 0 | 0.0% |
| 45 to 59 Minutes | 34 | 0.9% |
| 60 to 89 Minutes | 67 | 1.7% |
| 90 or more Minutes | 75 | 1.9% |
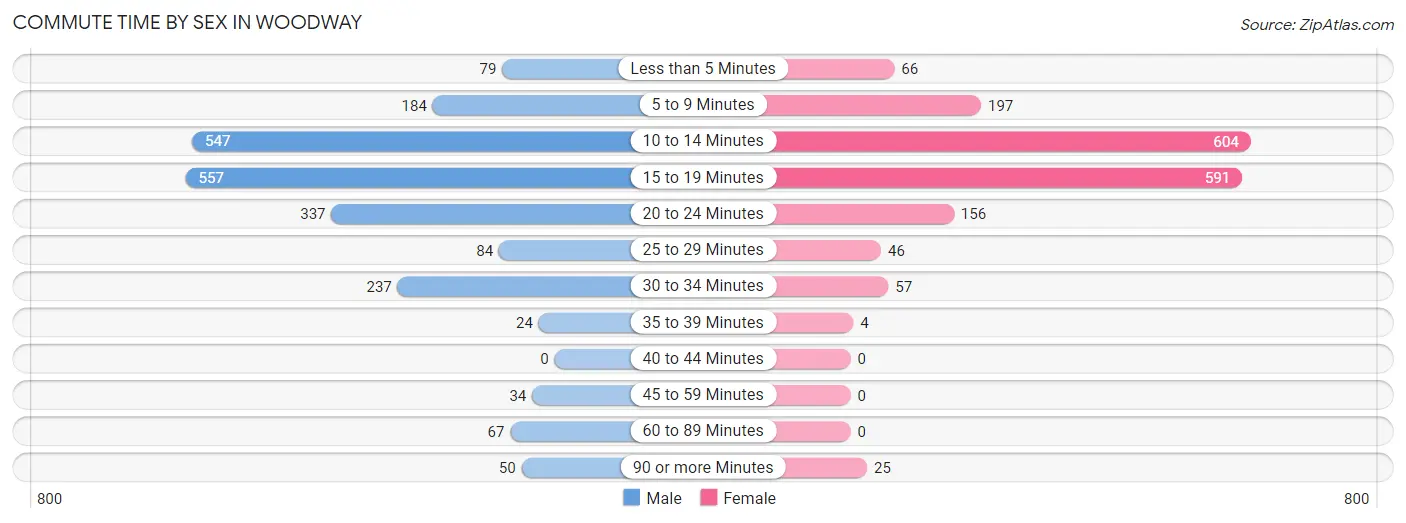
Commute Time by Sex in Woodway
The most common commute times in Woodway are 15 to 19 minutes (557 commuters, 25.3%) for males and 10 to 14 minutes (604 commuters, 34.6%) for females.
| Commute Time | Male | Female |
| Less than 5 Minutes | 79 (3.6%) | 66 (3.8%) |
| 5 to 9 Minutes | 184 (8.4%) | 197 (11.3%) |
| 10 to 14 Minutes | 547 (24.9%) | 604 (34.6%) |
| 15 to 19 Minutes | 557 (25.3%) | 591 (33.9%) |
| 20 to 24 Minutes | 337 (15.3%) | 156 (8.9%) |
| 25 to 29 Minutes | 84 (3.8%) | 46 (2.6%) |
| 30 to 34 Minutes | 237 (10.8%) | 57 (3.3%) |
| 35 to 39 Minutes | 24 (1.1%) | 4 (0.2%) |
| 40 to 44 Minutes | 0 (0.0%) | 0 (0.0%) |
| 45 to 59 Minutes | 34 (1.5%) | 0 (0.0%) |
| 60 to 89 Minutes | 67 (3.0%) | 0 (0.0%) |
| 90 or more Minutes | 50 (2.3%) | 25 (1.4%) |
Time of Departure to Work by Sex in Woodway
The most frequent times of departure to work in Woodway are 7:30 AM to 7:59 AM (677, 30.8%) for males and 7:30 AM to 7:59 AM (663, 38.0%) for females.
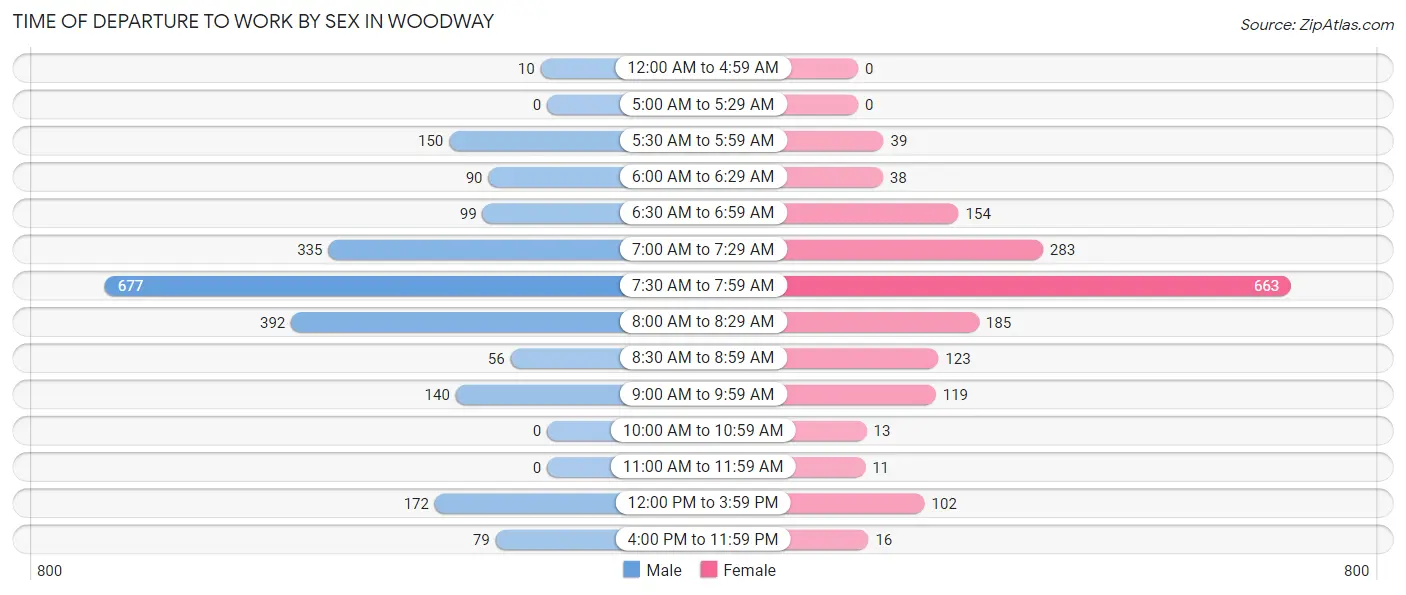
| Time of Departure | Male | Female |
| 12:00 AM to 4:59 AM | 10 (0.4%) | 0 (0.0%) |
| 5:00 AM to 5:29 AM | 0 (0.0%) | 0 (0.0%) |
| 5:30 AM to 5:59 AM | 150 (6.8%) | 39 (2.2%) |
| 6:00 AM to 6:29 AM | 90 (4.1%) | 38 (2.2%) |
| 6:30 AM to 6:59 AM | 99 (4.5%) | 154 (8.8%) |
| 7:00 AM to 7:29 AM | 335 (15.2%) | 283 (16.2%) |
| 7:30 AM to 7:59 AM | 677 (30.8%) | 663 (38.0%) |
| 8:00 AM to 8:29 AM | 392 (17.8%) | 185 (10.6%) |
| 8:30 AM to 8:59 AM | 56 (2.5%) | 123 (7.0%) |
| 9:00 AM to 9:59 AM | 140 (6.4%) | 119 (6.8%) |
| 10:00 AM to 10:59 AM | 0 (0.0%) | 13 (0.7%) |
| 11:00 AM to 11:59 AM | 0 (0.0%) | 11 (0.6%) |
| 12:00 PM to 3:59 PM | 172 (7.8%) | 102 (5.8%) |
| 4:00 PM to 11:59 PM | 79 (3.6%) | 16 (0.9%) |
| Total | 2,200 (100.0%) | 1,746 (100.0%) |
Housing Occupancy in Woodway
Occupancy by Ownership in Woodway
Of the total 3,444 dwellings in Woodway, owner-occupied units account for 3,023 (87.8%), while renter-occupied units make up 421 (12.2%).
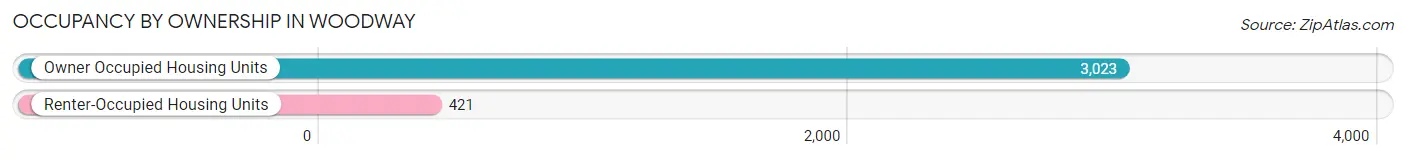
| Occupancy | # Housing Units | % Housing Units |
| Owner Occupied Housing Units | 3,023 | 87.8% |
| Renter-Occupied Housing Units | 421 | 12.2% |
| Total Occupied Housing Units | 3,444 | 100.0% |
Occupancy by Household Size in Woodway
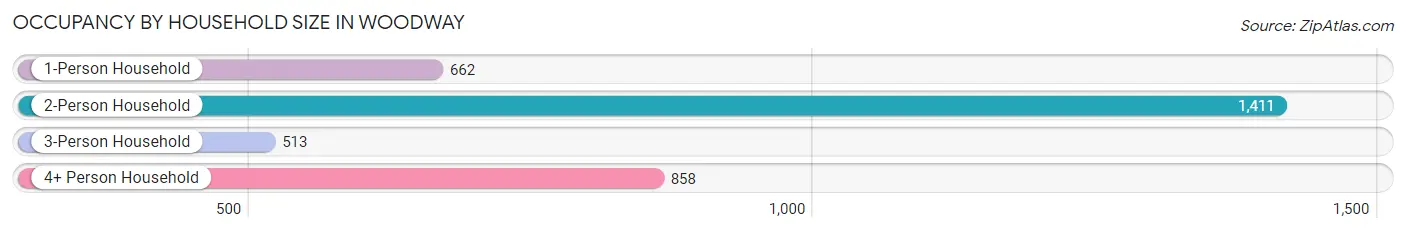
| Household Size | # Housing Units | % Housing Units |
| 1-Person Household | 662 | 19.2% |
| 2-Person Household | 1,411 | 41.0% |
| 3-Person Household | 513 | 14.9% |
| 4+ Person Household | 858 | 24.9% |
| Total Housing Units | 3,444 | 100.0% |
Occupancy by Ownership by Household Size in Woodway
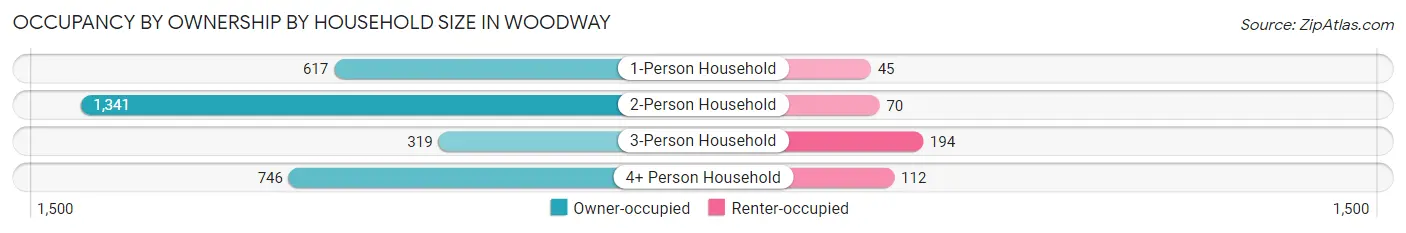
| Household Size | Owner-occupied | Renter-occupied |
| 1-Person Household | 617 (93.2%) | 45 (6.8%) |
| 2-Person Household | 1,341 (95.0%) | 70 (5.0%) |
| 3-Person Household | 319 (62.2%) | 194 (37.8%) |
| 4+ Person Household | 746 (87.0%) | 112 (13.1%) |
| Total Housing Units | 3,023 (87.8%) | 421 (12.2%) |
Occupancy by Educational Attainment in Woodway
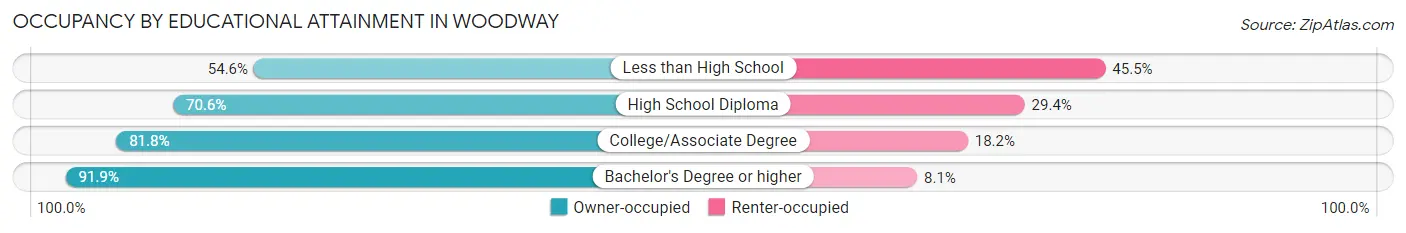
| Household Size | Owner-occupied | Renter-occupied |
| Less than High School | 30 (54.5%) | 25 (45.5%) |
| High School Diploma | 127 (70.6%) | 53 (29.4%) |
| College/Associate Degree | 671 (81.8%) | 149 (18.2%) |
| Bachelor's Degree or higher | 2,195 (91.9%) | 194 (8.1%) |
Occupancy by Age of Householder in Woodway
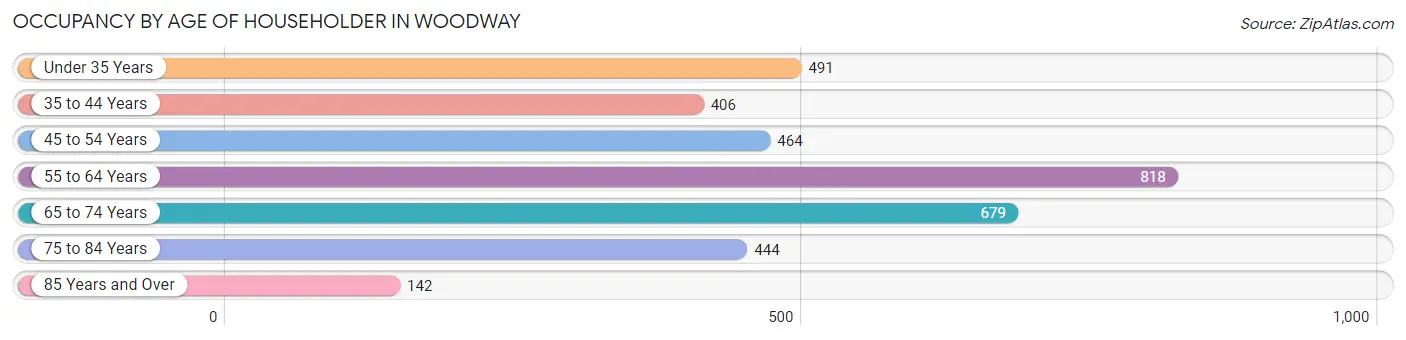
| Age Bracket | # Households | % Households |
| Under 35 Years | 491 | 14.3% |
| 35 to 44 Years | 406 | 11.8% |
| 45 to 54 Years | 464 | 13.5% |
| 55 to 64 Years | 818 | 23.7% |
| 65 to 74 Years | 679 | 19.7% |
| 75 to 84 Years | 444 | 12.9% |
| 85 Years and Over | 142 | 4.1% |
| Total | 3,444 | 100.0% |
Housing Finances in Woodway
Median Income by Occupancy in Woodway
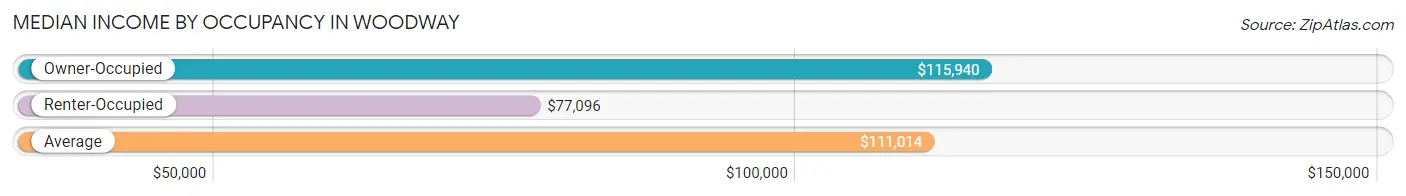
| Occupancy Type | # Households | Median Income |
| Owner-Occupied | 3,023 (87.8%) | $115,940 |
| Renter-Occupied | 421 (12.2%) | $77,096 |
| Average | 3,444 (100.0%) | $111,014 |
Occupancy by Householder Income Bracket in Woodway
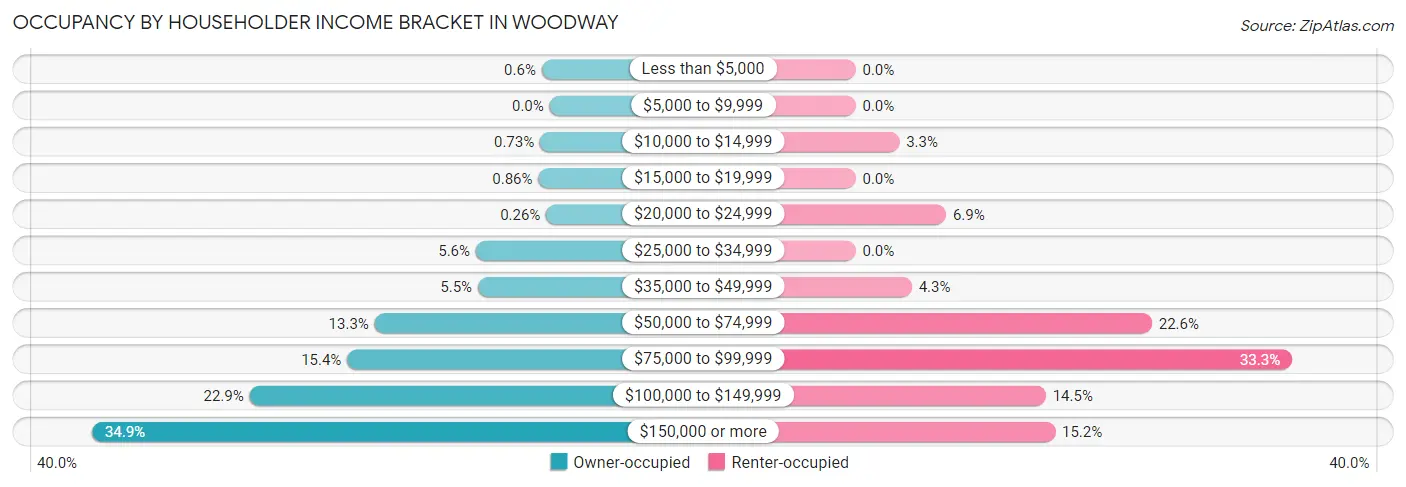
| Income Bracket | Owner-occupied | Renter-occupied |
| Less than $5,000 | 18 (0.6%) | 0 (0.0%) |
| $5,000 to $9,999 | 0 (0.0%) | 0 (0.0%) |
| $10,000 to $14,999 | 22 (0.7%) | 14 (3.3%) |
| $15,000 to $19,999 | 26 (0.9%) | 0 (0.0%) |
| $20,000 to $24,999 | 8 (0.3%) | 29 (6.9%) |
| $25,000 to $34,999 | 170 (5.6%) | 0 (0.0%) |
| $35,000 to $49,999 | 165 (5.5%) | 18 (4.3%) |
| $50,000 to $74,999 | 403 (13.3%) | 95 (22.6%) |
| $75,000 to $99,999 | 466 (15.4%) | 140 (33.3%) |
| $100,000 to $149,999 | 691 (22.9%) | 61 (14.5%) |
| $150,000 or more | 1,054 (34.9%) | 64 (15.2%) |
| Total | 3,023 (100.0%) | 421 (100.0%) |
Monthly Housing Cost Tiers in Woodway
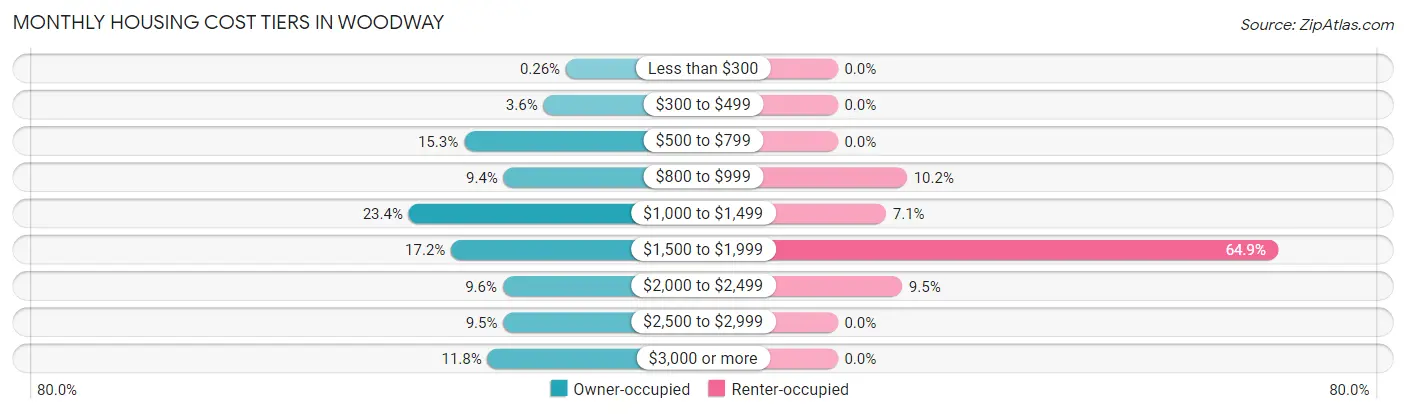
| Monthly Cost | Owner-occupied | Renter-occupied |
| Less than $300 | 8 (0.3%) | 0 (0.0%) |
| $300 to $499 | 108 (3.6%) | 0 (0.0%) |
| $500 to $799 | 462 (15.3%) | 0 (0.0%) |
| $800 to $999 | 285 (9.4%) | 43 (10.2%) |
| $1,000 to $1,499 | 708 (23.4%) | 30 (7.1%) |
| $1,500 to $1,999 | 519 (17.2%) | 273 (64.8%) |
| $2,000 to $2,499 | 289 (9.6%) | 40 (9.5%) |
| $2,500 to $2,999 | 287 (9.5%) | 0 (0.0%) |
| $3,000 or more | 357 (11.8%) | 0 (0.0%) |
| Total | 3,023 (100.0%) | 421 (100.0%) |
Physical Housing Characteristics in Woodway
Housing Structures in Woodway
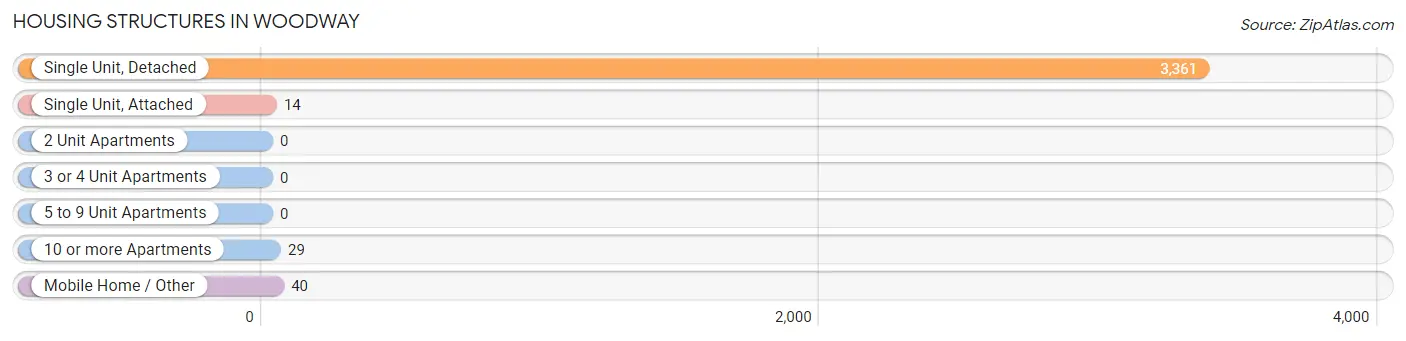
| Structure Type | # Housing Units | % Housing Units |
| Single Unit, Detached | 3,361 | 97.6% |
| Single Unit, Attached | 14 | 0.4% |
| 2 Unit Apartments | 0 | 0.0% |
| 3 or 4 Unit Apartments | 0 | 0.0% |
| 5 to 9 Unit Apartments | 0 | 0.0% |
| 10 or more Apartments | 29 | 0.8% |
| Mobile Home / Other | 40 | 1.2% |
| Total | 3,444 | 100.0% |
Housing Structures by Occupancy in Woodway
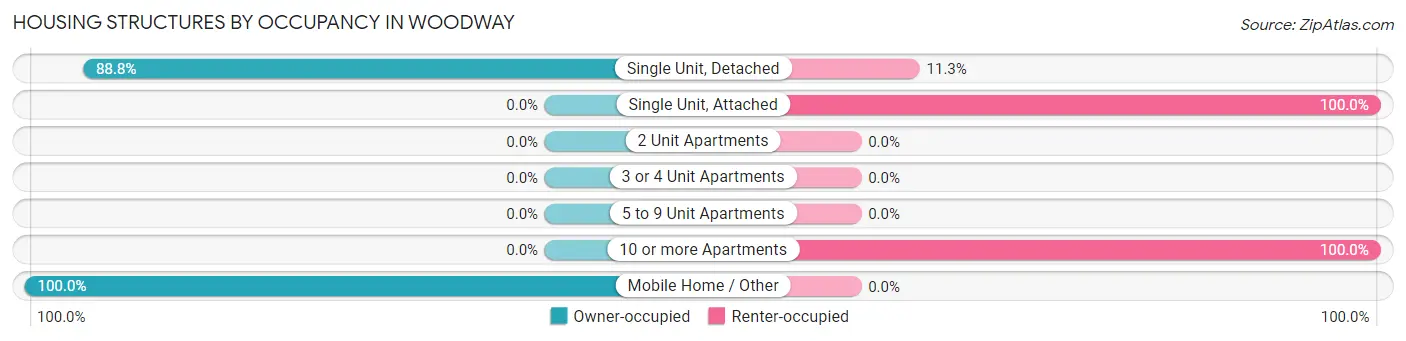
| Structure Type | Owner-occupied | Renter-occupied |
| Single Unit, Detached | 2,983 (88.7%) | 378 (11.3%) |
| Single Unit, Attached | 0 (0.0%) | 14 (100.0%) |
| 2 Unit Apartments | 0 (0.0%) | 0 (0.0%) |
| 3 or 4 Unit Apartments | 0 (0.0%) | 0 (0.0%) |
| 5 to 9 Unit Apartments | 0 (0.0%) | 0 (0.0%) |
| 10 or more Apartments | 0 (0.0%) | 29 (100.0%) |
| Mobile Home / Other | 40 (100.0%) | 0 (0.0%) |
| Total | 3,023 (87.8%) | 421 (12.2%) |
Housing Structures by Number of Rooms in Woodway
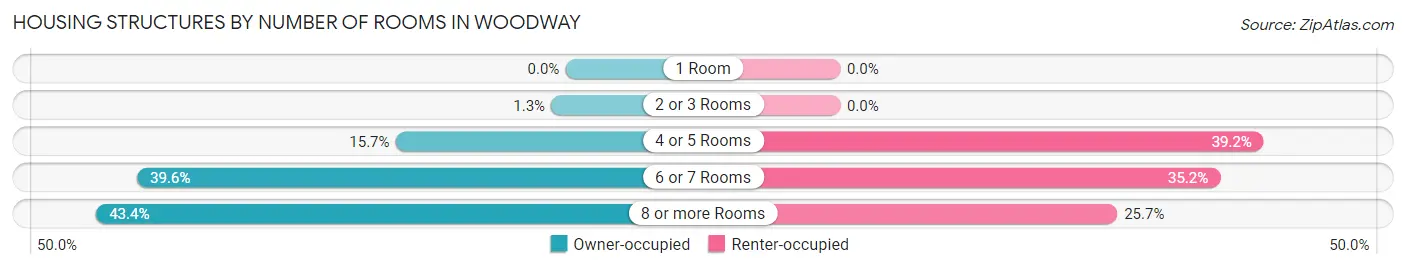
| Number of Rooms | Owner-occupied | Renter-occupied |
| 1 Room | 0 (0.0%) | 0 (0.0%) |
| 2 or 3 Rooms | 40 (1.3%) | 0 (0.0%) |
| 4 or 5 Rooms | 475 (15.7%) | 165 (39.2%) |
| 6 or 7 Rooms | 1,197 (39.6%) | 148 (35.1%) |
| 8 or more Rooms | 1,311 (43.4%) | 108 (25.7%) |
| Total | 3,023 (100.0%) | 421 (100.0%) |
Housing Structure by Heating Type in Woodway
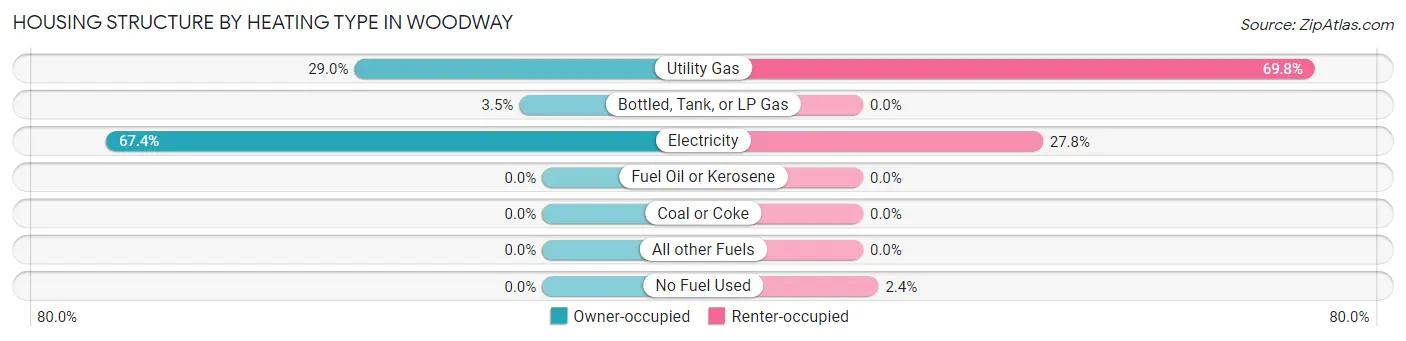
| Heating Type | Owner-occupied | Renter-occupied |
| Utility Gas | 878 (29.0%) | 294 (69.8%) |
| Bottled, Tank, or LP Gas | 107 (3.5%) | 0 (0.0%) |
| Electricity | 2,038 (67.4%) | 117 (27.8%) |
| Fuel Oil or Kerosene | 0 (0.0%) | 0 (0.0%) |
| Coal or Coke | 0 (0.0%) | 0 (0.0%) |
| All other Fuels | 0 (0.0%) | 0 (0.0%) |
| No Fuel Used | 0 (0.0%) | 10 (2.4%) |
| Total | 3,023 (100.0%) | 421 (100.0%) |
Household Vehicle Usage in Woodway
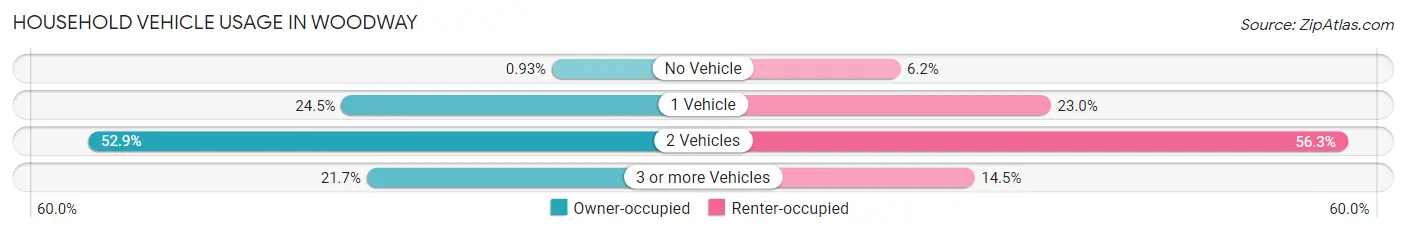
| Vehicles per Household | Owner-occupied | Renter-occupied |
| No Vehicle | 28 (0.9%) | 26 (6.2%) |
| 1 Vehicle | 741 (24.5%) | 97 (23.0%) |
| 2 Vehicles | 1,599 (52.9%) | 237 (56.3%) |
| 3 or more Vehicles | 655 (21.7%) | 61 (14.5%) |
| Total | 3,023 (100.0%) | 421 (100.0%) |
Real Estate & Mortgages in Woodway
Real Estate and Mortgage Overview in Woodway
| Characteristic | Without Mortgage | With Mortgage |
| Housing Units | 1,316 | 1,707 |
| Median Property Value | $296,000 | $311,700 |
| Median Household Income | $97,500 | $667 |
| Monthly Housing Costs | $853 | $357 |
| Real Estate Taxes | $4,637 | $31 |
Property Value by Mortgage Status in Woodway
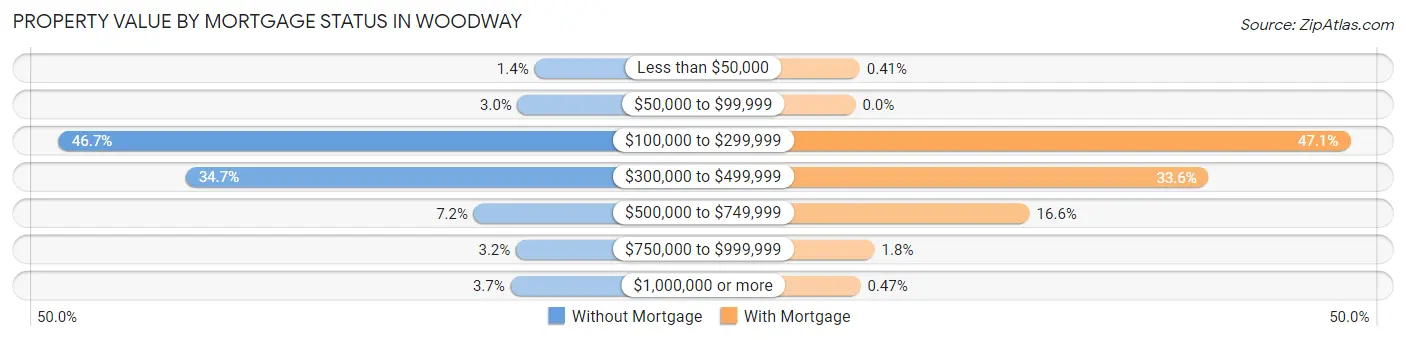
| Property Value | Without Mortgage | With Mortgage |
| Less than $50,000 | 19 (1.4%) | 7 (0.4%) |
| $50,000 to $99,999 | 40 (3.0%) | 0 (0.0%) |
| $100,000 to $299,999 | 615 (46.7%) | 804 (47.1%) |
| $300,000 to $499,999 | 456 (34.6%) | 574 (33.6%) |
| $500,000 to $749,999 | 95 (7.2%) | 283 (16.6%) |
| $750,000 to $999,999 | 42 (3.2%) | 31 (1.8%) |
| $1,000,000 or more | 49 (3.7%) | 8 (0.5%) |
| Total | 1,316 (100.0%) | 1,707 (100.0%) |
Household Income by Mortgage Status in Woodway
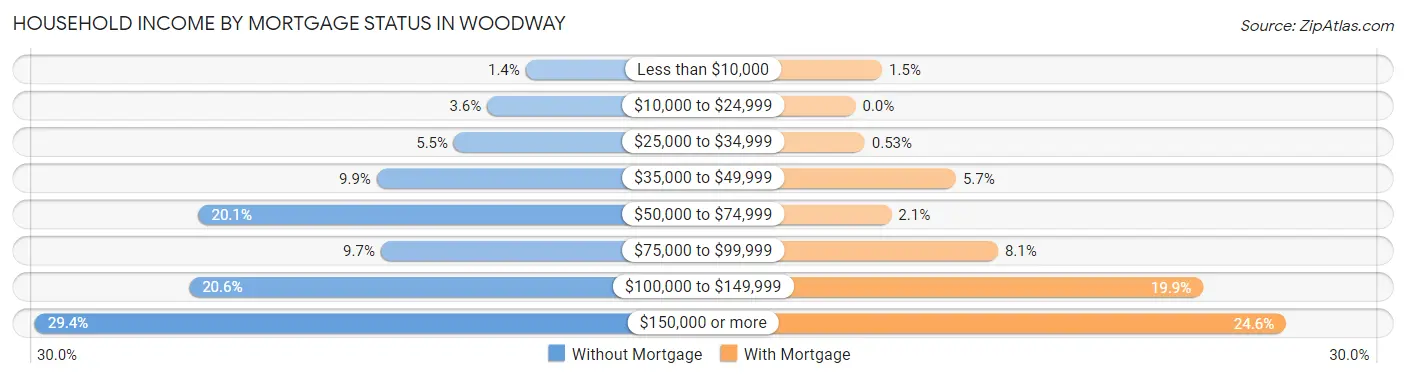
| Household Income | Without Mortgage | With Mortgage |
| Less than $10,000 | 18 (1.4%) | 26 (1.5%) |
| $10,000 to $24,999 | 47 (3.6%) | 0 (0.0%) |
| $25,000 to $34,999 | 72 (5.5%) | 9 (0.5%) |
| $35,000 to $49,999 | 130 (9.9%) | 98 (5.7%) |
| $50,000 to $74,999 | 264 (20.1%) | 35 (2.1%) |
| $75,000 to $99,999 | 127 (9.7%) | 139 (8.1%) |
| $100,000 to $149,999 | 271 (20.6%) | 339 (19.9%) |
| $150,000 or more | 387 (29.4%) | 420 (24.6%) |
| Total | 1,316 (100.0%) | 1,707 (100.0%) |
Property Value to Household Income Ratio in Woodway
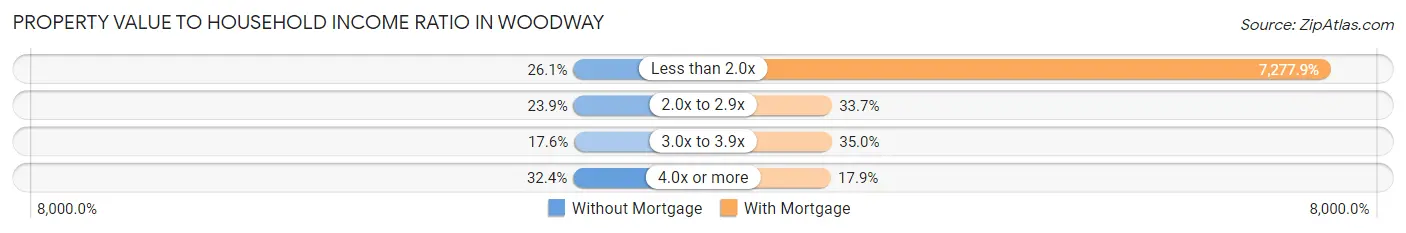
| Value-to-Income Ratio | Without Mortgage | With Mortgage |
| Less than 2.0x | 343 (26.1%) | 124,234 (7,277.9%) |
| 2.0x to 2.9x | 315 (23.9%) | 576 (33.7%) |
| 3.0x to 3.9x | 232 (17.6%) | 597 (35.0%) |
| 4.0x or more | 426 (32.4%) | 306 (17.9%) |
| Total | 1,316 (100.0%) | 1,707 (100.0%) |
Real Estate Taxes by Mortgage Status in Woodway
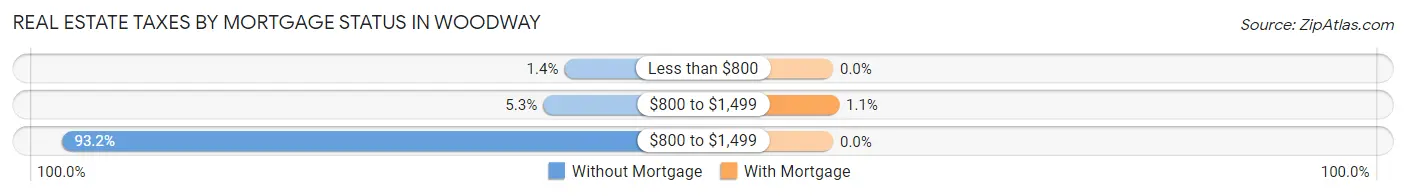
| Property Taxes | Without Mortgage | With Mortgage |
| Less than $800 | 19 (1.4%) | 0 (0.0%) |
| $800 to $1,499 | 70 (5.3%) | 19 (1.1%) |
| $800 to $1,499 | 1,227 (93.2%) | 0 (0.0%) |
| Total | 1,316 (100.0%) | 1,707 (100.0%) |
Health & Disability in Woodway
Health Insurance Coverage by Age in Woodway
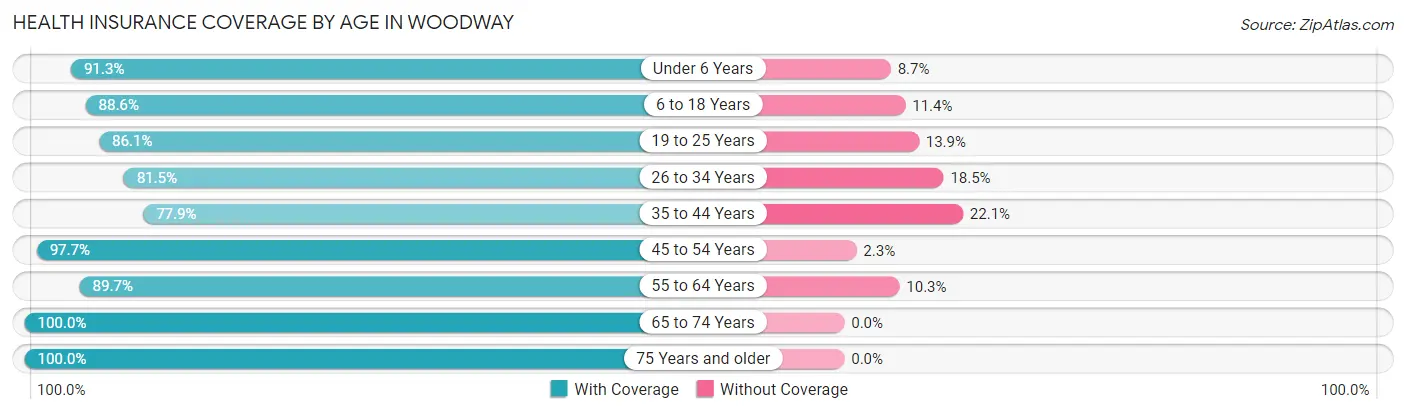
| Age Bracket | With Coverage | Without Coverage |
| Under 6 Years | 633 (91.3%) | 60 (8.7%) |
| 6 to 18 Years | 1,464 (88.6%) | 188 (11.4%) |
| 19 to 25 Years | 403 (86.1%) | 65 (13.9%) |
| 26 to 34 Years | 961 (81.5%) | 218 (18.5%) |
| 35 to 44 Years | 690 (77.9%) | 196 (22.1%) |
| 45 to 54 Years | 951 (97.7%) | 22 (2.3%) |
| 55 to 64 Years | 1,267 (89.7%) | 145 (10.3%) |
| 65 to 74 Years | 1,177 (100.0%) | 0 (0.0%) |
| 75 Years and older | 878 (100.0%) | 0 (0.0%) |
| Total | 8,424 (90.4%) | 894 (9.6%) |
Health Insurance Coverage by Citizenship Status in Woodway
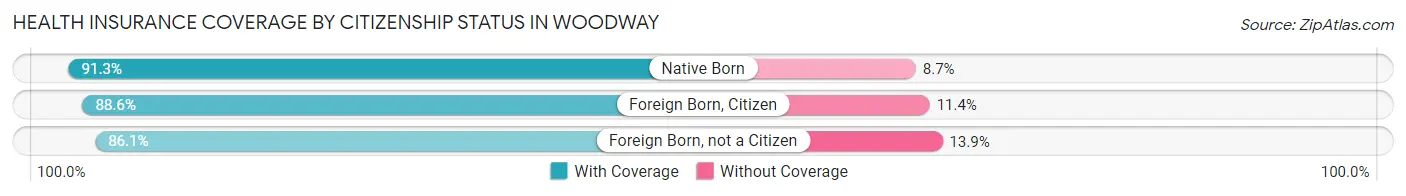
| Citizenship Status | With Coverage | Without Coverage |
| Native Born | 633 (91.3%) | 60 (8.7%) |
| Foreign Born, Citizen | 1,464 (88.6%) | 188 (11.4%) |
| Foreign Born, not a Citizen | 403 (86.1%) | 65 (13.9%) |
Health Insurance Coverage by Household Income in Woodway
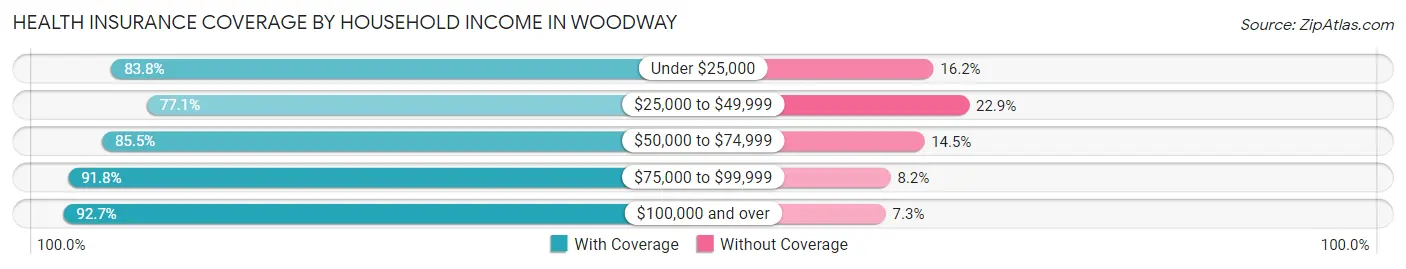
| Household Income | With Coverage | Without Coverage |
| Under $25,000 | 160 (83.8%) | 31 (16.2%) |
| $25,000 to $49,999 | 515 (77.1%) | 153 (22.9%) |
| $50,000 to $74,999 | 949 (85.5%) | 161 (14.5%) |
| $75,000 to $99,999 | 1,425 (91.8%) | 127 (8.2%) |
| $100,000 and over | 5,375 (92.7%) | 422 (7.3%) |
Public vs Private Health Insurance Coverage by Age in Woodway
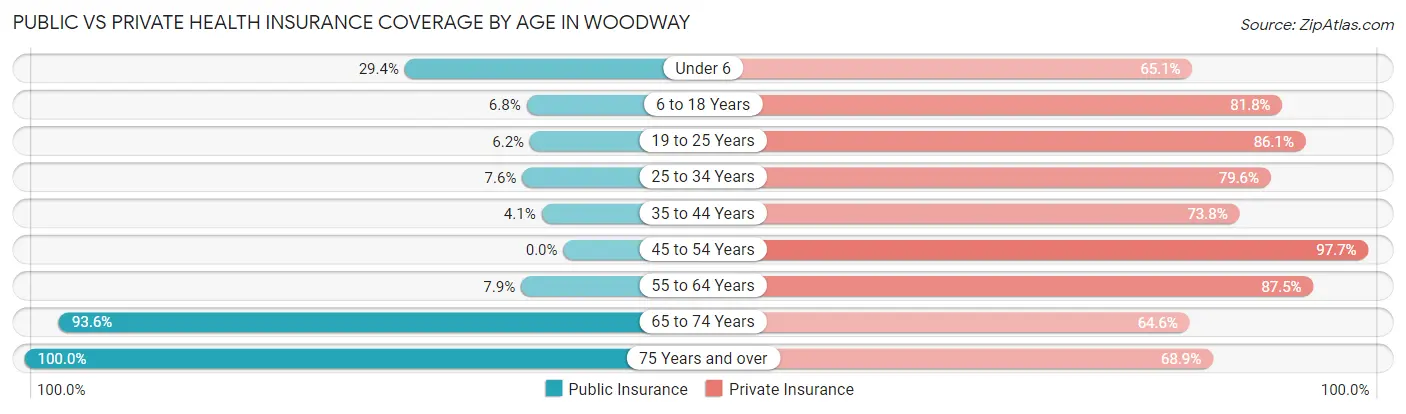
| Age Bracket | Public Insurance | Private Insurance |
| Under 6 | 204 (29.4%) | 451 (65.1%) |
| 6 to 18 Years | 113 (6.8%) | 1,351 (81.8%) |
| 19 to 25 Years | 29 (6.2%) | 403 (86.1%) |
| 25 to 34 Years | 90 (7.6%) | 939 (79.6%) |
| 35 to 44 Years | 36 (4.1%) | 654 (73.8%) |
| 45 to 54 Years | 0 (0.0%) | 951 (97.7%) |
| 55 to 64 Years | 111 (7.9%) | 1,236 (87.5%) |
| 65 to 74 Years | 1,102 (93.6%) | 760 (64.6%) |
| 75 Years and over | 878 (100.0%) | 605 (68.9%) |
| Total | 2,563 (27.5%) | 7,350 (78.9%) |
Disability Status by Sex by Age in Woodway
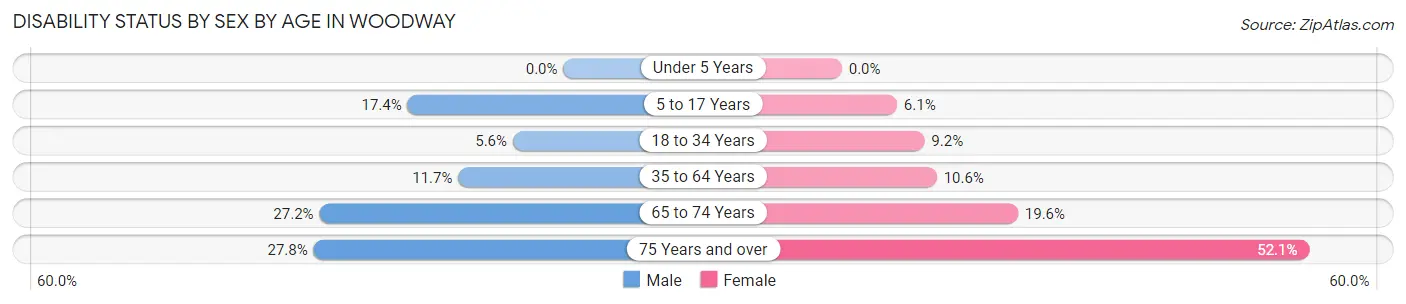
| Age Bracket | Male | Female |
| Under 5 Years | 0 (0.0%) | 0 (0.0%) |
| 5 to 17 Years | 144 (17.3%) | 59 (6.1%) |
| 18 to 34 Years | 51 (5.6%) | 75 (9.2%) |
| 35 to 64 Years | 180 (11.7%) | 183 (10.6%) |
| 65 to 74 Years | 166 (27.2%) | 111 (19.6%) |
| 75 Years and over | 116 (27.8%) | 240 (52.1%) |
Disability Class by Sex by Age in Woodway
Disability Class: Hearing Difficulty
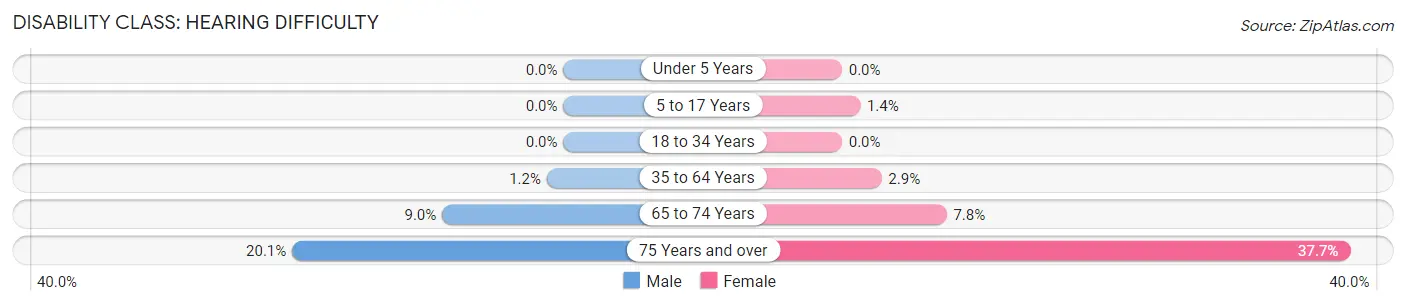
| Age Bracket | Male | Female |
| Under 5 Years | 0 (0.0%) | 0 (0.0%) |
| 5 to 17 Years | 0 (0.0%) | 13 (1.3%) |
| 18 to 34 Years | 0 (0.0%) | 0 (0.0%) |
| 35 to 64 Years | 19 (1.2%) | 51 (2.9%) |
| 65 to 74 Years | 55 (9.0%) | 44 (7.8%) |
| 75 Years and over | 84 (20.1%) | 174 (37.7%) |
Disability Class: Vision Difficulty
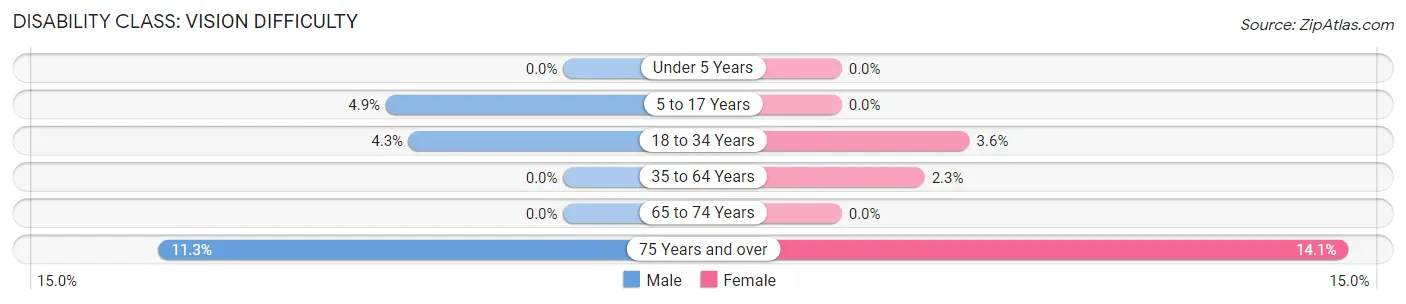
| Age Bracket | Male | Female |
| Under 5 Years | 0 (0.0%) | 0 (0.0%) |
| 5 to 17 Years | 41 (4.9%) | 0 (0.0%) |
| 18 to 34 Years | 39 (4.3%) | 29 (3.6%) |
| 35 to 64 Years | 0 (0.0%) | 40 (2.3%) |
| 65 to 74 Years | 0 (0.0%) | 0 (0.0%) |
| 75 Years and over | 47 (11.3%) | 65 (14.1%) |
Disability Class: Cognitive Difficulty
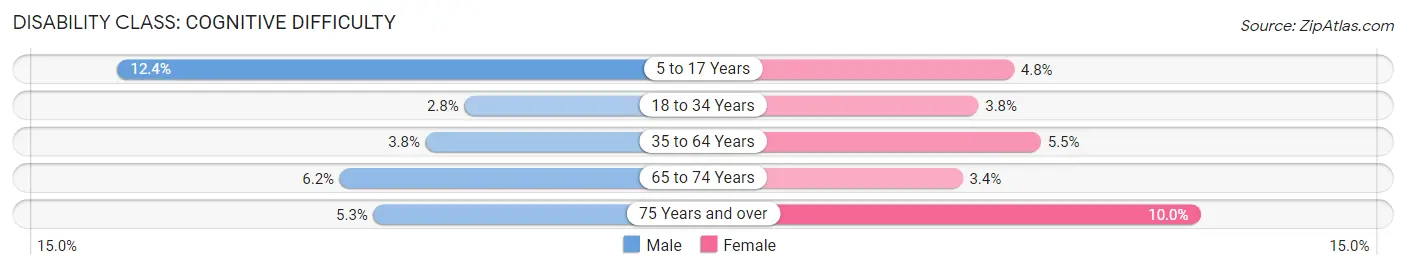
| Age Bracket | Male | Female |
| 5 to 17 Years | 103 (12.4%) | 46 (4.8%) |
| 18 to 34 Years | 25 (2.8%) | 31 (3.8%) |
| 35 to 64 Years | 59 (3.8%) | 96 (5.5%) |
| 65 to 74 Years | 38 (6.2%) | 19 (3.4%) |
| 75 Years and over | 22 (5.3%) | 46 (10.0%) |
Disability Class: Ambulatory Difficulty
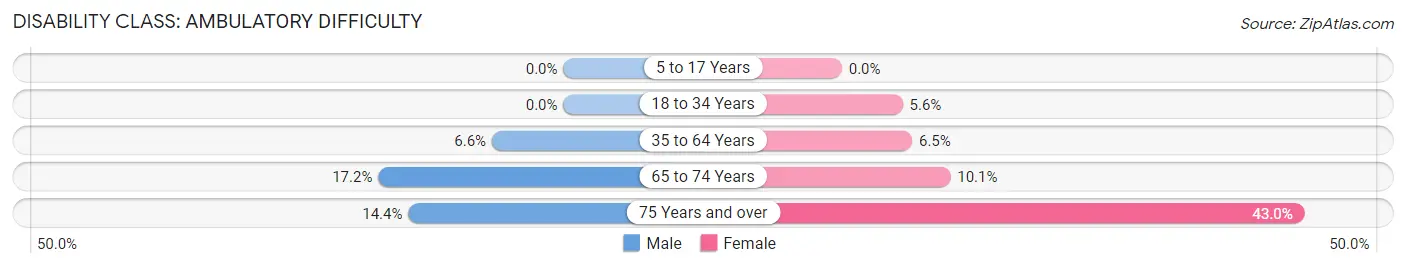
| Age Bracket | Male | Female |
| 5 to 17 Years | 0 (0.0%) | 0 (0.0%) |
| 18 to 34 Years | 0 (0.0%) | 46 (5.6%) |
| 35 to 64 Years | 102 (6.6%) | 113 (6.5%) |
| 65 to 74 Years | 105 (17.2%) | 57 (10.1%) |
| 75 Years and over | 60 (14.4%) | 198 (42.9%) |
Disability Class: Self-Care Difficulty
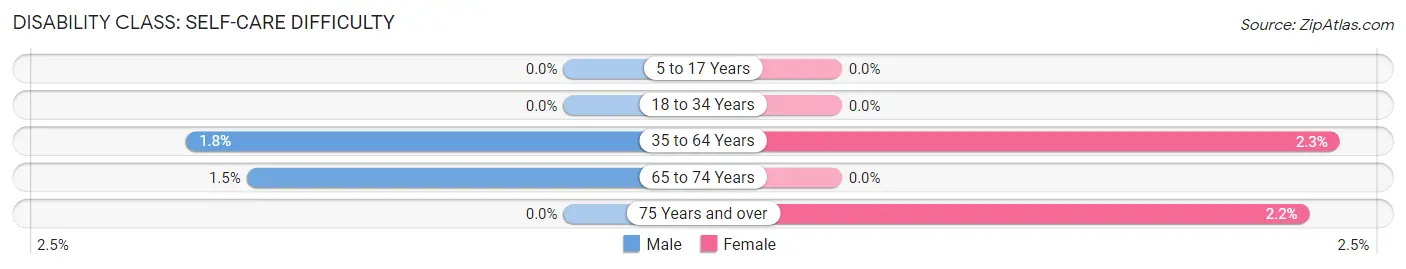
| Age Bracket | Male | Female |
| 5 to 17 Years | 0 (0.0%) | 0 (0.0%) |
| 18 to 34 Years | 0 (0.0%) | 0 (0.0%) |
| 35 to 64 Years | 27 (1.8%) | 40 (2.3%) |
| 65 to 74 Years | 9 (1.5%) | 0 (0.0%) |
| 75 Years and over | 0 (0.0%) | 10 (2.2%) |
Technology Access in Woodway
Computing Device Access in Woodway
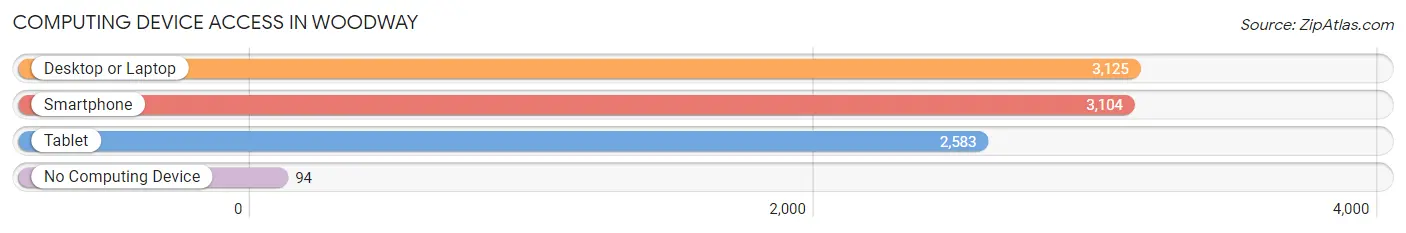
| Device Type | # Households | % Households |
| Desktop or Laptop | 3,125 | 90.7% |
| Smartphone | 3,104 | 90.1% |
| Tablet | 2,583 | 75.0% |
| No Computing Device | 94 | 2.7% |
| Total | 3,444 | 100.0% |
Internet Access in Woodway
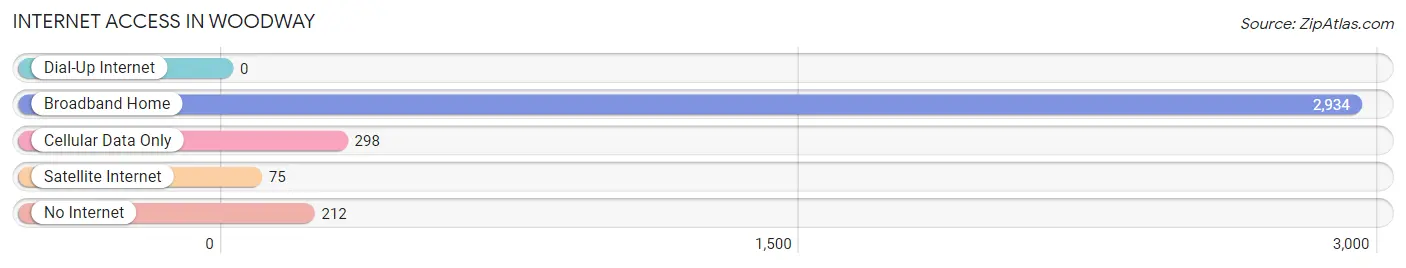
| Internet Type | # Households | % Households |
| Dial-Up Internet | 0 | 0.0% |
| Broadband Home | 2,934 | 85.2% |
| Cellular Data Only | 298 | 8.6% |
| Satellite Internet | 75 | 2.2% |
| No Internet | 212 | 6.2% |
| Total | 3,444 | 100.0% |
Woodway Summary
Woodway, Texas is a small town located in McLennan County, Texas. It is situated about 10 miles south of Waco and is part of the Waco Metropolitan Statistical Area. The town was founded in 1881 and has a population of approximately 7,000 people.
History
Woodway was founded in 1881 by a group of settlers from the nearby town of Waco. The town was named after the local creek, which was named after the wooded area that surrounded it. The town was originally a farming community, but it soon developed into a small industrial center. The first industry in the town was a cotton gin, which was built in 1883. The town also had a sawmill, a gristmill, and a blacksmith shop.
In the early 1900s, the town began to grow and develop. The first school was built in 1906 and the first bank opened in 1907. The town also had a post office, a hotel, and a general store. In the 1920s, the town began to experience a population boom, as many people moved to the area to work in the local industries.
Geography
Woodway is located in McLennan County, Texas. It is situated about 10 miles south of Waco and is part of the Waco Metropolitan Statistical Area. The town is located on the banks of the Brazos River and is surrounded by rolling hills and wooded areas. The town has a total area of 4.2 square miles, all of which is land.
Economy
The economy of Woodway is largely based on agriculture and manufacturing. The town is home to several large agricultural businesses, including a cotton gin, a feed mill, and a dairy. The town also has several manufacturing businesses, including a furniture factory, a plastics factory, and a metal fabrication plant.
The town also has a thriving retail sector, with several stores and restaurants located in the downtown area. The town also has a number of small businesses, including a hardware store, a pharmacy, and a grocery store.
Demographics
As of the 2010 census, the population of Woodway was 7,073. The racial makeup of the town was 79.3% White, 15.2% Hispanic or Latino, 2.2% African American, 0.7% Native American, 0.4% Asian, and 2.2% from other races. The median household income was $45,945 and the median family income was $54,945.
Conclusion
Woodway, Texas is a small town located in McLennan County, Texas. It was founded in 1881 and has a population of approximately 7,000 people. The town is largely based on agriculture and manufacturing, with several large agricultural businesses and manufacturing businesses located in the town. The town also has a thriving retail sector, with several stores and restaurants located in the downtown area. The population of Woodway is largely White, with a significant Hispanic or Latino population. The median household income is $45,945 and the median family income is $54,945.
Common Questions
What is Per Capita Income in Woodway?
Per Capita income in Woodway is $55,902.
What is the Median Family Income in Woodway?
Median Family Income in Woodway is $130,489.
What is the Median Household income in Woodway?
Median Household Income in Woodway is $111,014.
What is Income or Wage Gap in Woodway?
Income or Wage Gap in Woodway is 48.0%.
Women in Woodway earn 52.0 cents for every dollar earned by a man.
What is Inequality or Gini Index in Woodway?
Inequality or Gini Index in Woodway is 0.43.
What is the Total Population of Woodway?
Total Population of Woodway is 9,399.
What is the Total Male Population of Woodway?
Total Male Population of Woodway is 4,519.
What is the Total Female Population of Woodway?
Total Female Population of Woodway is 4,880.
What is the Ratio of Males per 100 Females in Woodway?
There are 92.60 Males per 100 Females in Woodway.
What is the Ratio of Females per 100 Males in Woodway?
There are 107.99 Females per 100 Males in Woodway.
What is the Median Population Age in Woodway?
Median Population Age in Woodway is 42.7 Years.
What is the Average Family Size in Woodway
Average Family Size in Woodway is 3.1 People.
What is the Average Household Size in Woodway
Average Household Size in Woodway is 2.7 People.
How Large is the Labor Force in Woodway?
There are 4,528 People in the Labor Forcein in Woodway.
What is the Percentage of People in the Labor Force in Woodway?
60.2% of People are in the Labor Force in Woodway.
What is the Unemployment Rate in Woodway?
Unemployment Rate in Woodway is 4.1%.