Wills Point, TX Map & Demographics
Wills Point Map
Wills Point Overview
$23,175
PER CAPITA INCOME
$57,000
AVG FAMILY INCOME
$55,100
AVG HOUSEHOLD INCOME
35.2%
WAGE / INCOME GAP [ % ]
64.8¢/ $1
WAGE / INCOME GAP [ $ ]
0.41
INEQUALITY / GINI INDEX
3,786
TOTAL POPULATION
1,845
MALE POPULATION
1,941
FEMALE POPULATION
95.05
MALES / 100 FEMALES
105.20
FEMALES / 100 MALES
33.8
MEDIAN AGE
3.2
AVG FAMILY SIZE
2.7
AVG HOUSEHOLD SIZE
1,720
LABOR FORCE [ PEOPLE ]
60.6%
PERCENT IN LABOR FORCE
1.9%
UNEMPLOYMENT RATE
Wills Point Zip Codes
Wills Point Area Codes
Income in Wills Point
Income Overview in Wills Point
Per Capita Income in Wills Point is $23,175, while median incomes of families and households are $57,000 and $55,100 respectively.
| Characteristic | Number | Measure |
| Per Capita Income | 3,786 | $23,175 |
| Median Family Income | 962 | $57,000 |
| Mean Family Income | 962 | $68,138 |
| Median Household Income | 1,382 | $55,100 |
| Mean Household Income | 1,382 | $61,990 |
| Income Deficit | 962 | $0 |
| Wage / Income Gap (%) | 3,786 | 35.22% |
| Wage / Income Gap ($) | 3,786 | 64.78¢ per $1 |
| Gini / Inequality Index | 3,786 | 0.41 |
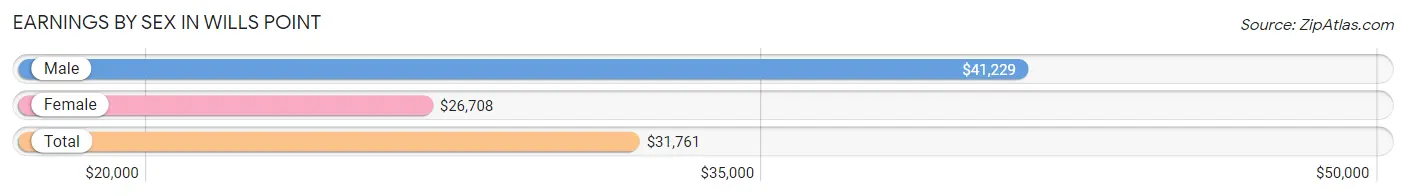
Earnings by Sex in Wills Point
Average Earnings in Wills Point are $31,761, $41,229 for men and $26,708 for women, a difference of 35.2%.
| Sex | Number | Average Earnings |
| Male | 894 (51.1%) | $41,229 |
| Female | 856 (48.9%) | $26,708 |
| Total | 1,750 (100.0%) | $31,761 |
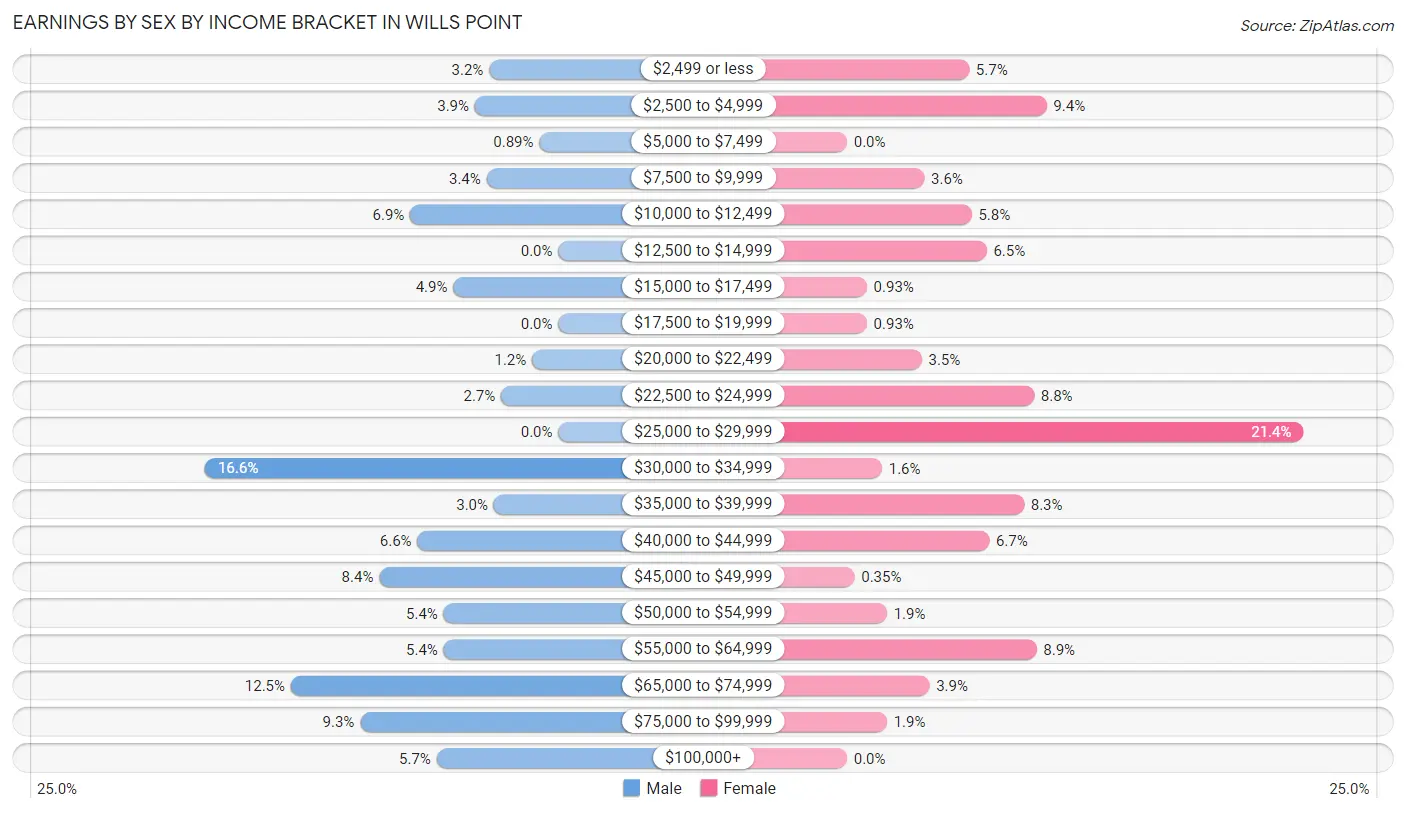
Earnings by Sex by Income Bracket in Wills Point
The most common earnings brackets in Wills Point are $30,000 to $34,999 for men (148 | 16.6%) and $25,000 to $29,999 for women (183 | 21.4%).
| Income | Male | Female |
| $2,499 or less | 29 (3.2%) | 49 (5.7%) |
| $2,500 to $4,999 | 35 (3.9%) | 80 (9.3%) |
| $5,000 to $7,499 | 8 (0.9%) | 0 (0.0%) |
| $7,500 to $9,999 | 30 (3.4%) | 31 (3.6%) |
| $10,000 to $12,499 | 62 (6.9%) | 50 (5.8%) |
| $12,500 to $14,999 | 0 (0.0%) | 56 (6.5%) |
| $15,000 to $17,499 | 44 (4.9%) | 8 (0.9%) |
| $17,500 to $19,999 | 0 (0.0%) | 8 (0.9%) |
| $20,000 to $22,499 | 11 (1.2%) | 30 (3.5%) |
| $22,500 to $24,999 | 24 (2.7%) | 75 (8.8%) |
| $25,000 to $29,999 | 0 (0.0%) | 183 (21.4%) |
| $30,000 to $34,999 | 148 (16.6%) | 14 (1.6%) |
| $35,000 to $39,999 | 27 (3.0%) | 71 (8.3%) |
| $40,000 to $44,999 | 59 (6.6%) | 57 (6.7%) |
| $45,000 to $49,999 | 75 (8.4%) | 3 (0.4%) |
| $50,000 to $54,999 | 48 (5.4%) | 16 (1.9%) |
| $55,000 to $64,999 | 48 (5.4%) | 76 (8.9%) |
| $65,000 to $74,999 | 112 (12.5%) | 33 (3.9%) |
| $75,000 to $99,999 | 83 (9.3%) | 16 (1.9%) |
| $100,000+ | 51 (5.7%) | 0 (0.0%) |
| Total | 894 (100.0%) | 856 (100.0%) |
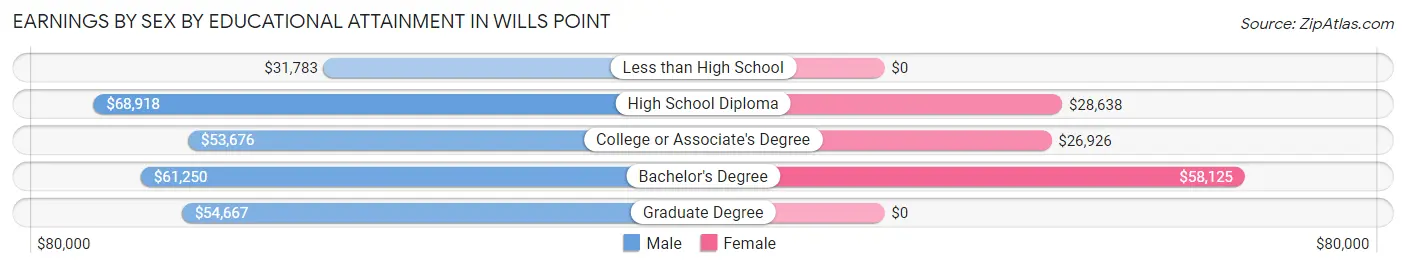
Earnings by Sex by Educational Attainment in Wills Point
Average earnings in Wills Point are $50,625 for men and $28,587 for women, a difference of 43.5%. Men with an educational attainment of high school diploma enjoy the highest average annual earnings of $68,918, while those with less than high school education earn the least with $31,783. Women with an educational attainment of bachelor's degree earn the most with the average annual earnings of $58,125, while those with college or associate's degree education have the smallest earnings of $26,926.
| Educational Attainment | Male Income | Female Income |
| Less than High School | $31,783 | $0 |
| High School Diploma | $68,918 | $28,638 |
| College or Associate's Degree | $53,676 | $26,926 |
| Bachelor's Degree | $61,250 | $58,125 |
| Graduate Degree | $54,667 | $0 |
| Total | $50,625 | $28,587 |
Family Income in Wills Point
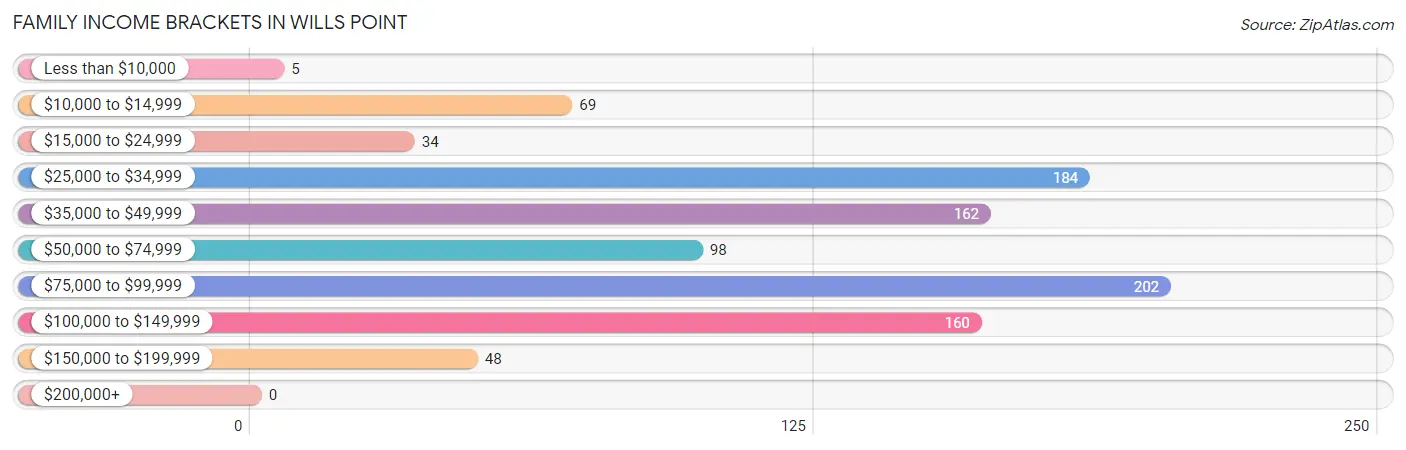
Family Income Brackets in Wills Point
According to the Wills Point family income data, there are 202 families falling into the $75,000 to $99,999 income range, which is the most common income bracket and makes up 21.0% of all families.
| Income Bracket | # Families | % Families |
| Less than $10,000 | 5 | 0.5% |
| $10,000 to $14,999 | 69 | 7.2% |
| $15,000 to $24,999 | 34 | 3.5% |
| $25,000 to $34,999 | 184 | 19.1% |
| $35,000 to $49,999 | 162 | 16.8% |
| $50,000 to $74,999 | 98 | 10.2% |
| $75,000 to $99,999 | 202 | 21.0% |
| $100,000 to $149,999 | 160 | 16.6% |
| $150,000 to $199,999 | 48 | 5.0% |
| $200,000+ | 0 | 0.0% |
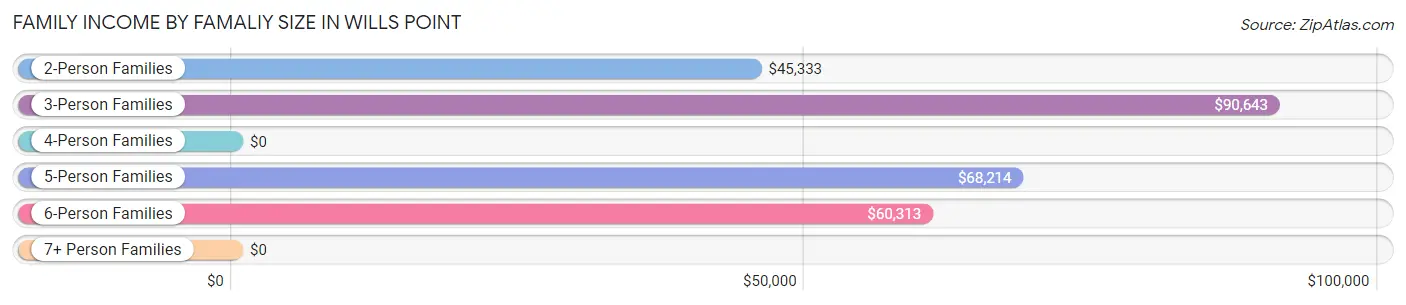
Family Income by Famaliy Size in Wills Point
3-person families (198 | 20.6%) account for the highest median family income in Wills Point with $90,643 per family, while 3-person families (198 | 20.6%) have the highest median income of $30,214 per family member.
| Income Bracket | # Families | Median Income |
| 2-Person Families | 504 (52.4%) | $45,333 |
| 3-Person Families | 198 (20.6%) | $90,643 |
| 4-Person Families | 116 (12.1%) | $0 |
| 5-Person Families | 98 (10.2%) | $68,214 |
| 6-Person Families | 46 (4.8%) | $60,313 |
| 7+ Person Families | 0 (0.0%) | $0 |
| Total | 962 (100.0%) | $57,000 |
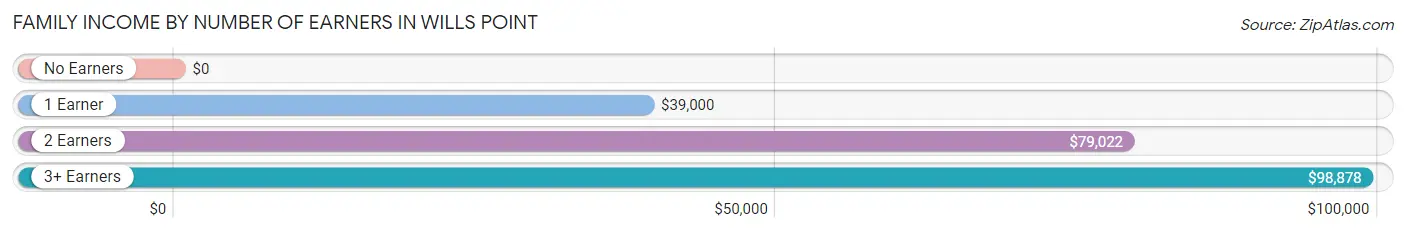
Family Income by Number of Earners in Wills Point
| Number of Earners | # Families | Median Income |
| No Earners | 161 (16.7%) | $0 |
| 1 Earner | 376 (39.1%) | $39,000 |
| 2 Earners | 294 (30.6%) | $79,022 |
| 3+ Earners | 131 (13.6%) | $98,878 |
| Total | 962 (100.0%) | $57,000 |
Household Income in Wills Point
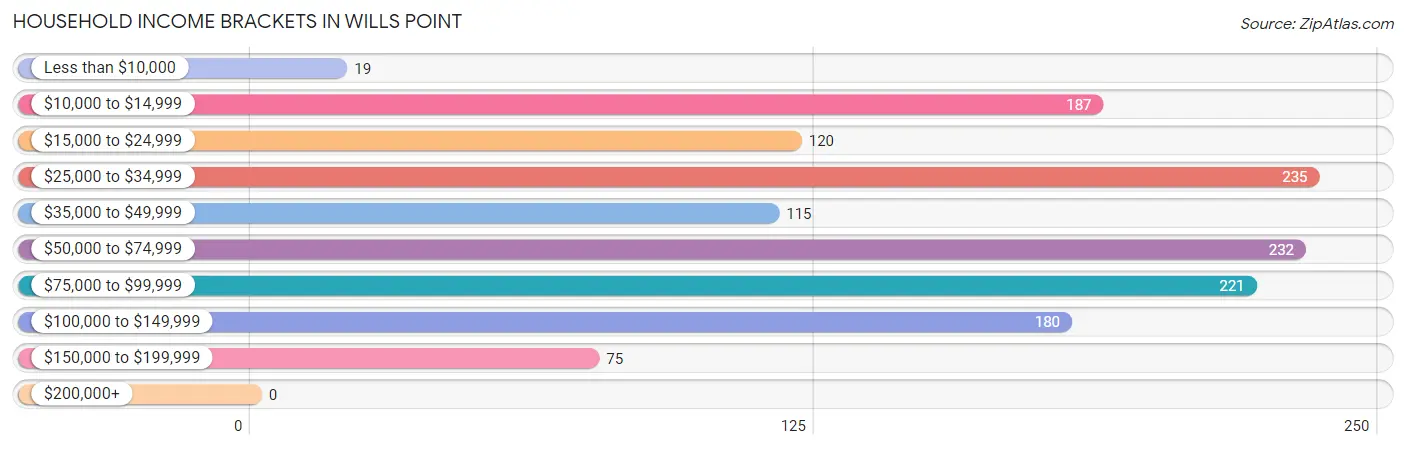
Household Income Brackets in Wills Point
With 235 households falling in the category, the $25,000 to $34,999 income range is the most frequent in Wills Point, accounting for 17.0% of all households.
| Income Bracket | # Households | % Households |
| Less than $10,000 | 19 | 1.4% |
| $10,000 to $14,999 | 187 | 13.5% |
| $15,000 to $24,999 | 120 | 8.7% |
| $25,000 to $34,999 | 235 | 17.0% |
| $35,000 to $49,999 | 115 | 8.3% |
| $50,000 to $74,999 | 232 | 16.8% |
| $75,000 to $99,999 | 221 | 16.0% |
| $100,000 to $149,999 | 180 | 13.0% |
| $150,000 to $199,999 | 75 | 5.4% |
| $200,000+ | 0 | 0.0% |
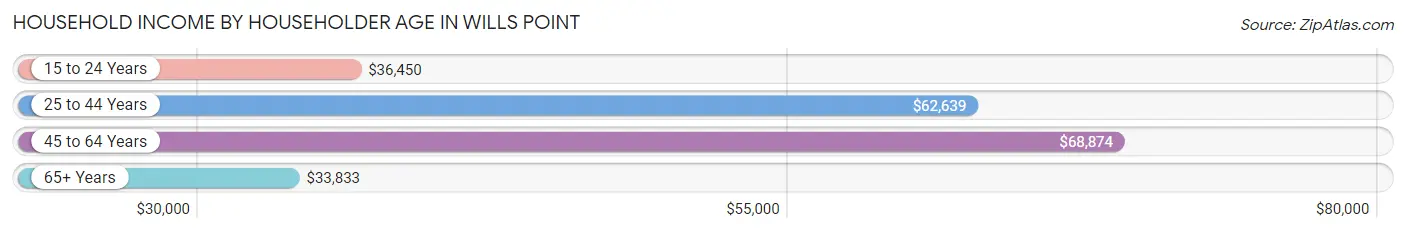
Household Income by Householder Age in Wills Point
The median household income in Wills Point is $55,100, with the highest median household income of $68,874 found in the 45 to 64 years age bracket for the primary householder. A total of 544 households (39.4%) fall into this category. Meanwhile, the 65+ years age bracket for the primary householder has the lowest median household income of $33,833, with 324 households (23.4%) in this group.
| Income Bracket | # Households | Median Income |
| 15 to 24 Years | 43 (3.1%) | $36,450 |
| 25 to 44 Years | 471 (34.1%) | $62,639 |
| 45 to 64 Years | 544 (39.4%) | $68,874 |
| 65+ Years | 324 (23.4%) | $33,833 |
| Total | 1,382 (100.0%) | $55,100 |
Poverty in Wills Point
Income Below Poverty by Sex and Age in Wills Point
With 22.3% poverty level for males and 28.9% for females among the residents of Wills Point, 12 to 14 year old males and 15 year old females are the most vulnerable to poverty, with 67 males (80.7%) and 63 females (100.0%) in their respective age groups living below the poverty level.
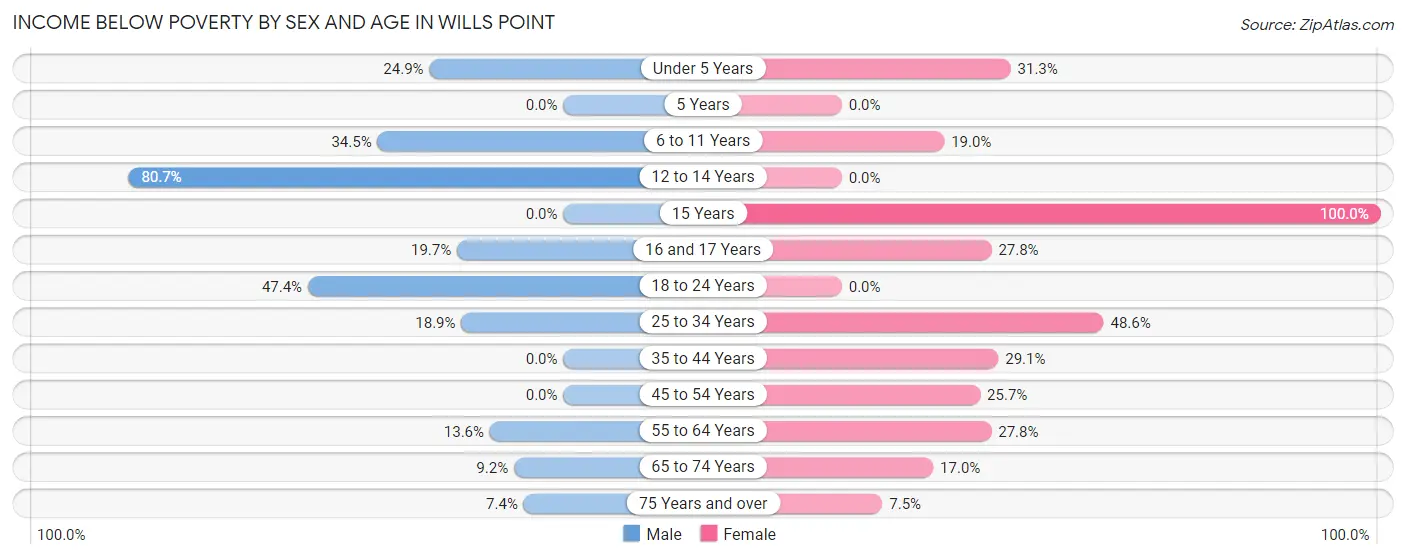
| Age Bracket | Male | Female |
| Under 5 Years | 45 (24.9%) | 73 (31.3%) |
| 5 Years | 0 (0.0%) | 0 (0.0%) |
| 6 to 11 Years | 59 (34.5%) | 23 (19.0%) |
| 12 to 14 Years | 67 (80.7%) | 0 (0.0%) |
| 15 Years | 0 (0.0%) | 63 (100.0%) |
| 16 and 17 Years | 29 (19.7%) | 15 (27.8%) |
| 18 to 24 Years | 110 (47.4%) | 0 (0.0%) |
| 25 to 34 Years | 32 (18.9%) | 154 (48.6%) |
| 35 to 44 Years | 0 (0.0%) | 52 (29.0%) |
| 45 to 54 Years | 0 (0.0%) | 66 (25.7%) |
| 55 to 64 Years | 42 (13.6%) | 58 (27.8%) |
| 65 to 74 Years | 12 (9.2%) | 29 (17.0%) |
| 75 Years and over | 5 (7.3%) | 10 (7.5%) |
| Total | 401 (22.3%) | 543 (28.9%) |
Income Above Poverty by Sex and Age in Wills Point
According to the poverty statistics in Wills Point, males aged 5 years and females aged 5 years are the age groups that are most secure financially, with 100.0% of males and 100.0% of females in these age groups living above the poverty line.
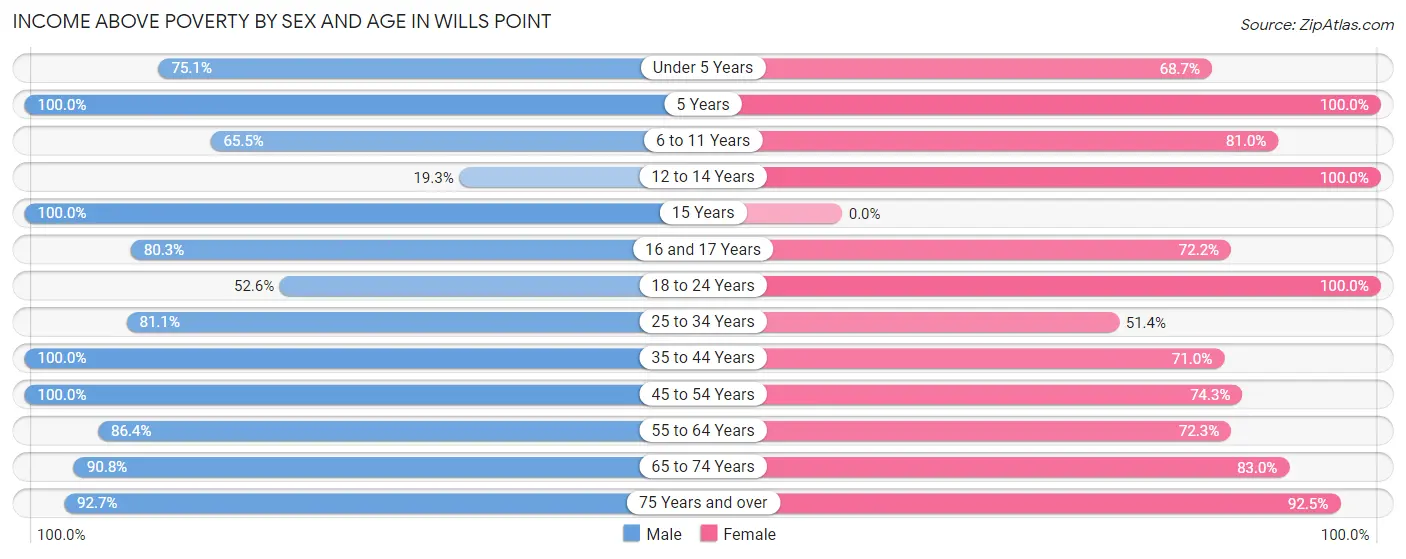
| Age Bracket | Male | Female |
| Under 5 Years | 136 (75.1%) | 160 (68.7%) |
| 5 Years | 19 (100.0%) | 14 (100.0%) |
| 6 to 11 Years | 112 (65.5%) | 98 (81.0%) |
| 12 to 14 Years | 16 (19.3%) | 26 (100.0%) |
| 15 Years | 6 (100.0%) | 0 (0.0%) |
| 16 and 17 Years | 118 (80.3%) | 39 (72.2%) |
| 18 to 24 Years | 122 (52.6%) | 101 (100.0%) |
| 25 to 34 Years | 137 (81.1%) | 163 (51.4%) |
| 35 to 44 Years | 92 (100.0%) | 127 (71.0%) |
| 45 to 54 Years | 194 (100.0%) | 191 (74.3%) |
| 55 to 64 Years | 266 (86.4%) | 151 (72.3%) |
| 65 to 74 Years | 119 (90.8%) | 142 (83.0%) |
| 75 Years and over | 63 (92.6%) | 123 (92.5%) |
| Total | 1,400 (77.7%) | 1,335 (71.1%) |
Income Below Poverty Among Married-Couple Families in Wills Point
The poverty statistics for married-couple families in Wills Point show that 2.8% or 15 of the total 537 families live below the poverty line. Families with 3 or 4 children have the highest poverty rate of 20.3%, comprising of 15 families. On the other hand, families with no children have the lowest poverty rate of 0.0%, which includes 0 families.
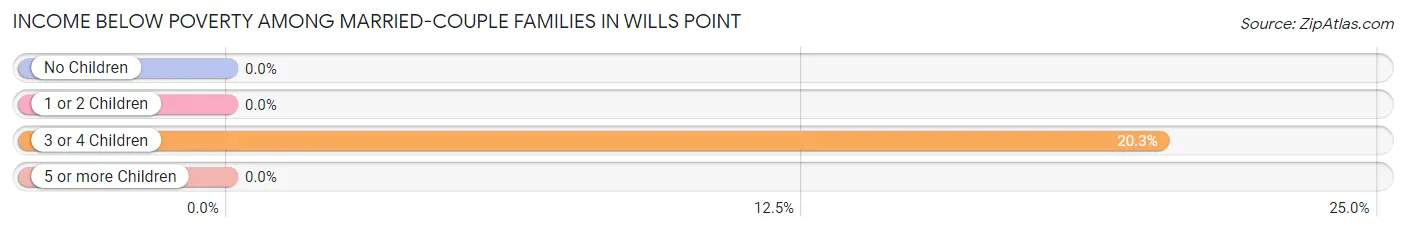
| Children | Above Poverty | Below Poverty |
| No Children | 264 (100.0%) | 0 (0.0%) |
| 1 or 2 Children | 199 (100.0%) | 0 (0.0%) |
| 3 or 4 Children | 59 (79.7%) | 15 (20.3%) |
| 5 or more Children | 0 (0.0%) | 0 (0.0%) |
| Total | 522 (97.2%) | 15 (2.8%) |
Income Below Poverty Among Single-Parent Households in Wills Point
According to the poverty data in Wills Point, 12.5% or 5 single-father households and 44.4% or 171 single-mother households are living below the poverty line. Among single-father households, those with 1 or 2 children have the highest poverty rate, with 5 households (100.0%) experiencing poverty. Likewise, among single-mother households, those with 3 or 4 children have the highest poverty rate, with 68 households (100.0%) falling below the poverty line.
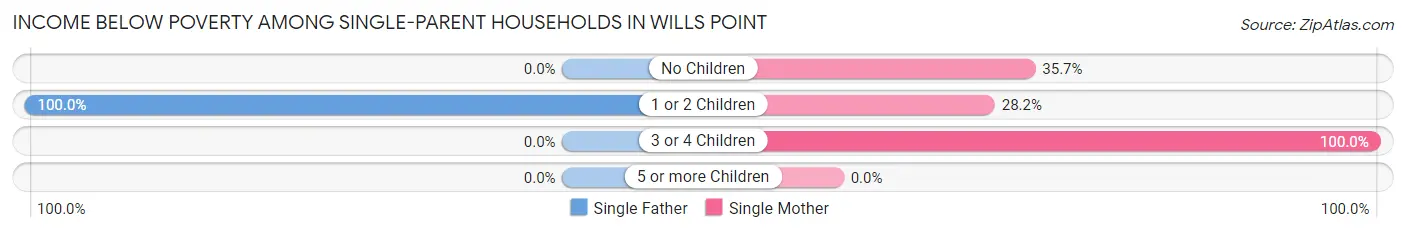
| Children | Single Father | Single Mother |
| No Children | 0 (0.0%) | 65 (35.7%) |
| 1 or 2 Children | 5 (100.0%) | 38 (28.1%) |
| 3 or 4 Children | 0 (0.0%) | 68 (100.0%) |
| 5 or more Children | 0 (0.0%) | 0 (0.0%) |
| Total | 5 (12.5%) | 171 (44.4%) |
Income Below Poverty Among Married-Couple vs Single-Parent Households in Wills Point
The poverty data for Wills Point shows that 15 of the married-couple family households (2.8%) and 176 of the single-parent households (41.4%) are living below the poverty level. Within the married-couple family households, those with 3 or 4 children have the highest poverty rate, with 15 households (20.3%) falling below the poverty line. Among the single-parent households, those with 3 or 4 children have the highest poverty rate, with 68 household (100.0%) living below poverty.
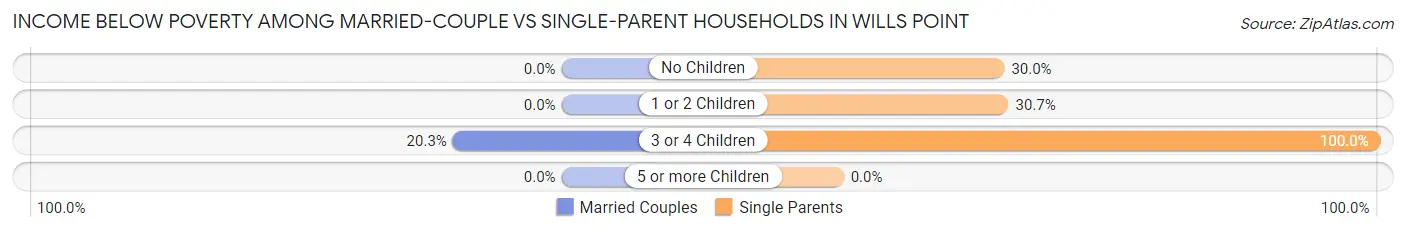
| Children | Married-Couple Families | Single-Parent Households |
| No Children | 0 (0.0%) | 65 (29.9%) |
| 1 or 2 Children | 0 (0.0%) | 43 (30.7%) |
| 3 or 4 Children | 15 (20.3%) | 68 (100.0%) |
| 5 or more Children | 0 (0.0%) | 0 (0.0%) |
| Total | 15 (2.8%) | 176 (41.4%) |
Race in Wills Point
The most populous races in Wills Point are White / Caucasian (2,708 | 71.5%), Hispanic or Latino (741 | 19.6%), and Black / African American (561 | 14.8%).
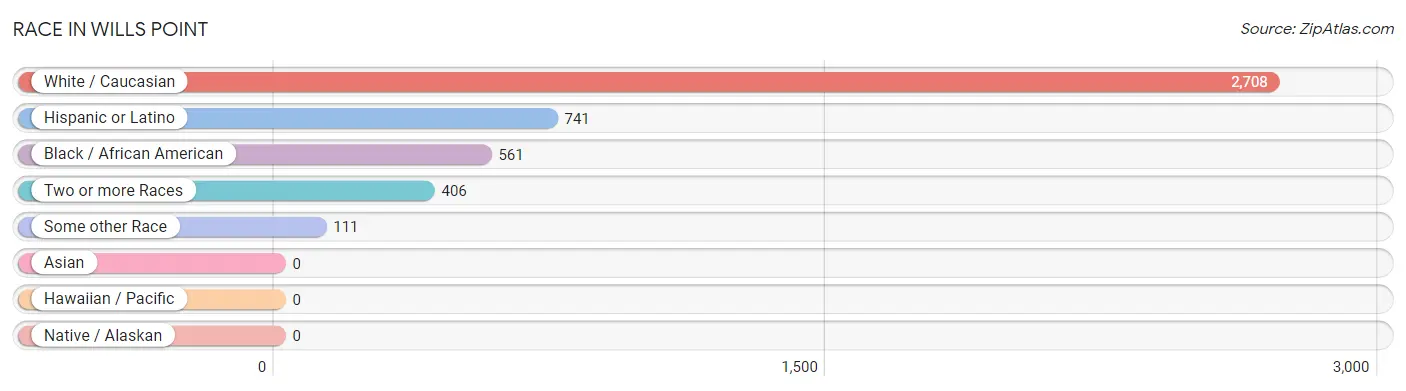
| Race | # Population | % Population |
| Asian | 0 | 0.0% |
| Black / African American | 561 | 14.8% |
| Hawaiian / Pacific | 0 | 0.0% |
| Hispanic or Latino | 741 | 19.6% |
| Native / Alaskan | 0 | 0.0% |
| White / Caucasian | 2,708 | 71.5% |
| Two or more Races | 406 | 10.7% |
| Some other Race | 111 | 2.9% |
| Total | 3,786 | 100.0% |
Ancestry in Wills Point
The most populous ancestries reported in Wills Point are American (723 | 19.1%), Mexican (702 | 18.5%), Irish (308 | 8.1%), English (254 | 6.7%), and German (187 | 4.9%), together accounting for 57.4% of all Wills Point residents.
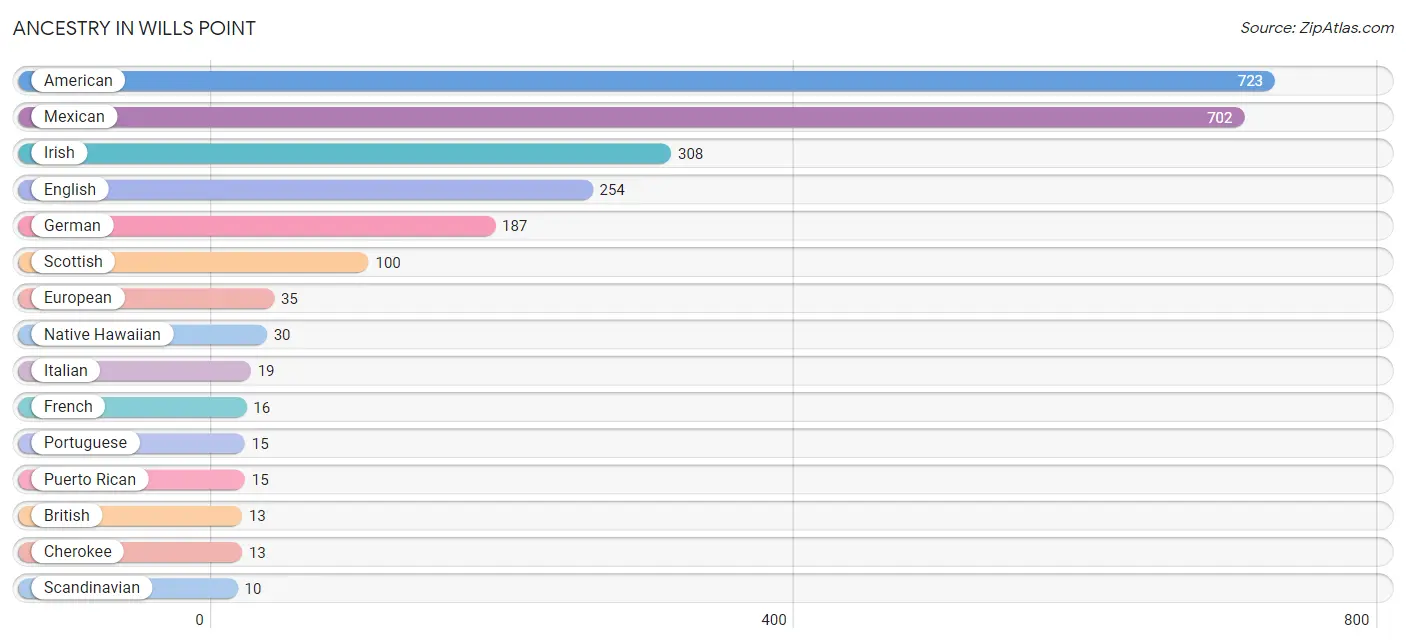
| Ancestry | # Population | % Population |
| American | 723 | 19.1% |
| British | 13 | 0.3% |
| Cherokee | 13 | 0.3% |
| Czech | 9 | 0.2% |
| Dutch | 8 | 0.2% |
| English | 254 | 6.7% |
| European | 35 | 0.9% |
| French | 16 | 0.4% |
| German | 187 | 4.9% |
| Irish | 308 | 8.1% |
| Italian | 19 | 0.5% |
| Mexican | 702 | 18.5% |
| Native Hawaiian | 30 | 0.8% |
| Norwegian | 5 | 0.1% |
| Portuguese | 15 | 0.4% |
| Puerto Rican | 15 | 0.4% |
| Scandinavian | 10 | 0.3% |
| Scotch-Irish | 5 | 0.1% |
| Scottish | 100 | 2.6% |
| Thai | 8 | 0.2% | View All 20 Rows |
Immigrants in Wills Point
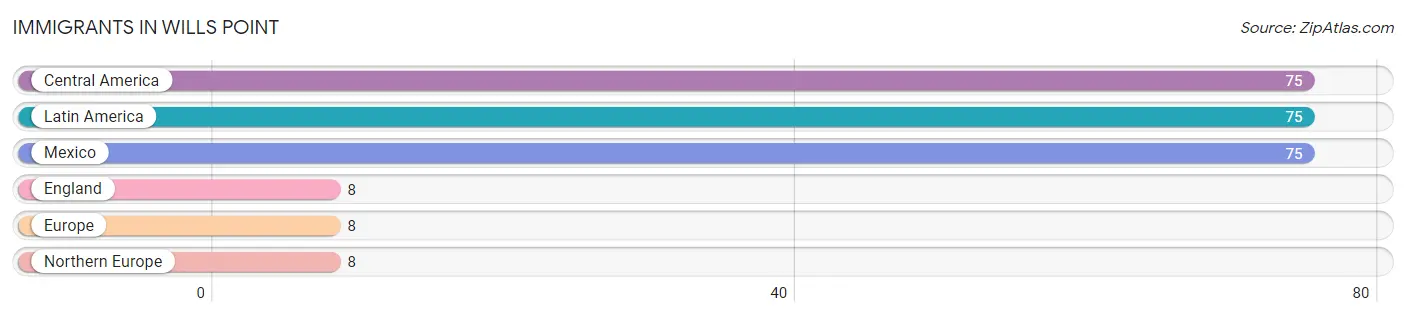
The most numerous immigrant groups reported in Wills Point came from Central America (75 | 2.0%), Latin America (75 | 2.0%), Mexico (75 | 2.0%), England (8 | 0.2%), and Europe (8 | 0.2%), together accounting for 6.4% of all Wills Point residents.
| Immigration Origin | # Population | % Population |
| Central America | 75 | 2.0% |
| England | 8 | 0.2% |
| Europe | 8 | 0.2% |
| Latin America | 75 | 2.0% |
| Mexico | 75 | 2.0% |
| Northern Europe | 8 | 0.2% | View All 6 Rows |
Sex and Age in Wills Point
Sex and Age in Wills Point
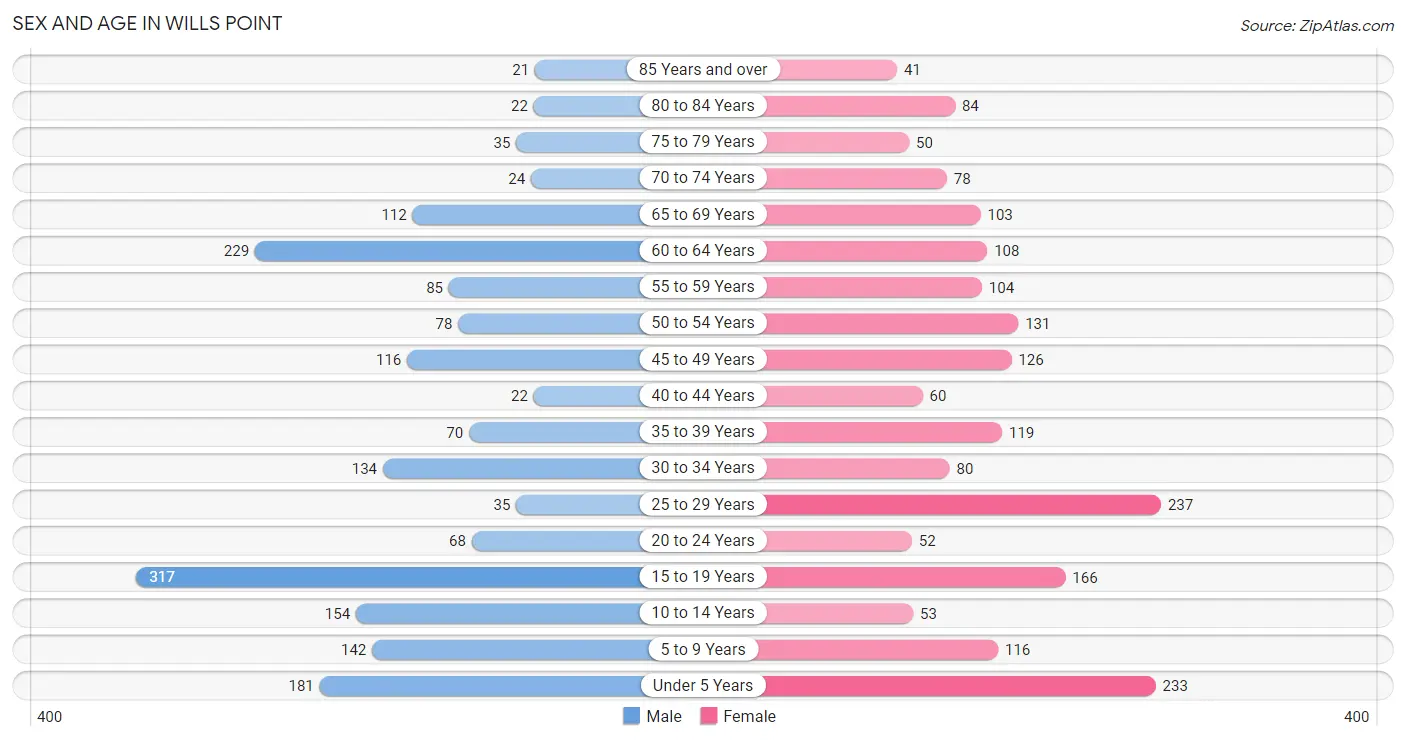
The most populous age groups in Wills Point are 15 to 19 Years (317 | 17.2%) for men and 25 to 29 Years (237 | 12.2%) for women.
| Age Bracket | Male | Female |
| Under 5 Years | 181 (9.8%) | 233 (12.0%) |
| 5 to 9 Years | 142 (7.7%) | 116 (6.0%) |
| 10 to 14 Years | 154 (8.4%) | 53 (2.7%) |
| 15 to 19 Years | 317 (17.2%) | 166 (8.6%) |
| 20 to 24 Years | 68 (3.7%) | 52 (2.7%) |
| 25 to 29 Years | 35 (1.9%) | 237 (12.2%) |
| 30 to 34 Years | 134 (7.3%) | 80 (4.1%) |
| 35 to 39 Years | 70 (3.8%) | 119 (6.1%) |
| 40 to 44 Years | 22 (1.2%) | 60 (3.1%) |
| 45 to 49 Years | 116 (6.3%) | 126 (6.5%) |
| 50 to 54 Years | 78 (4.2%) | 131 (6.8%) |
| 55 to 59 Years | 85 (4.6%) | 104 (5.4%) |
| 60 to 64 Years | 229 (12.4%) | 108 (5.6%) |
| 65 to 69 Years | 112 (6.1%) | 103 (5.3%) |
| 70 to 74 Years | 24 (1.3%) | 78 (4.0%) |
| 75 to 79 Years | 35 (1.9%) | 50 (2.6%) |
| 80 to 84 Years | 22 (1.2%) | 84 (4.3%) |
| 85 Years and over | 21 (1.1%) | 41 (2.1%) |
| Total | 1,845 (100.0%) | 1,941 (100.0%) |
Families and Households in Wills Point
Median Family Size in Wills Point
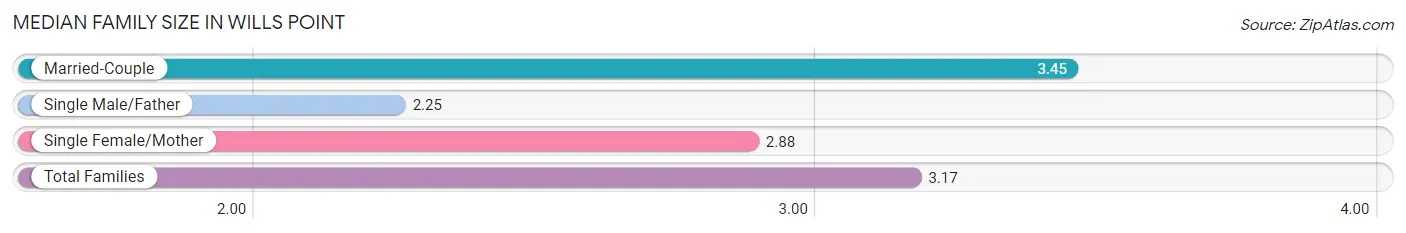
The median family size in Wills Point is 3.17 persons per family, with married-couple families (537 | 55.8%) accounting for the largest median family size of 3.45 persons per family. On the other hand, single male/father families (40 | 4.2%) represent the smallest median family size with 2.25 persons per family.
| Family Type | # Families | Family Size |
| Married-Couple | 537 (55.8%) | 3.45 |
| Single Male/Father | 40 (4.2%) | 2.25 |
| Single Female/Mother | 385 (40.0%) | 2.88 |
| Total Families | 962 (100.0%) | 3.17 |
Median Household Size in Wills Point
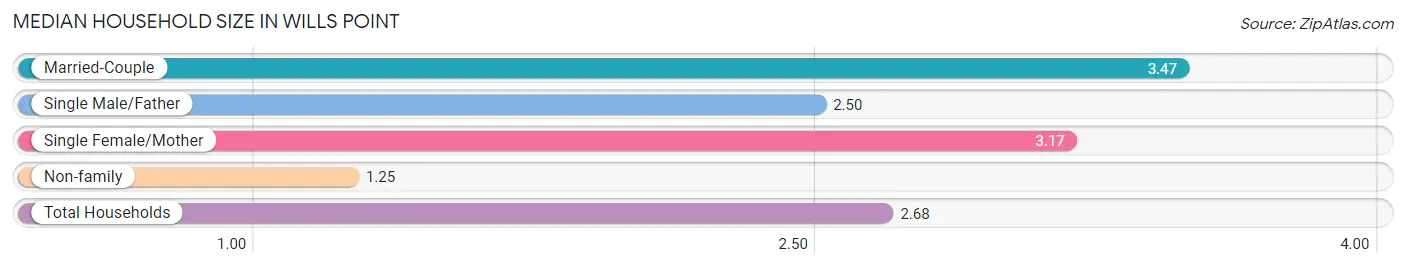
The median household size in Wills Point is 2.68 persons per household, with married-couple households (537 | 38.9%) accounting for the largest median household size of 3.47 persons per household. non-family households (420 | 30.4%) represent the smallest median household size with 1.25 persons per household.
| Household Type | # Households | Household Size |
| Married-Couple | 537 (38.9%) | 3.47 |
| Single Male/Father | 40 (2.9%) | 2.50 |
| Single Female/Mother | 385 (27.9%) | 3.17 |
| Non-family | 420 (30.4%) | 1.25 |
| Total Households | 1,382 (100.0%) | 2.68 |
Household Size by Marriage Status in Wills Point
Out of a total of 1,382 households in Wills Point, 962 (69.6%) are family households, while 420 (30.4%) are nonfamily households. The most numerous type of family households are 2-person households, comprising 397, and the most common type of nonfamily households are 1-person households, comprising 357.
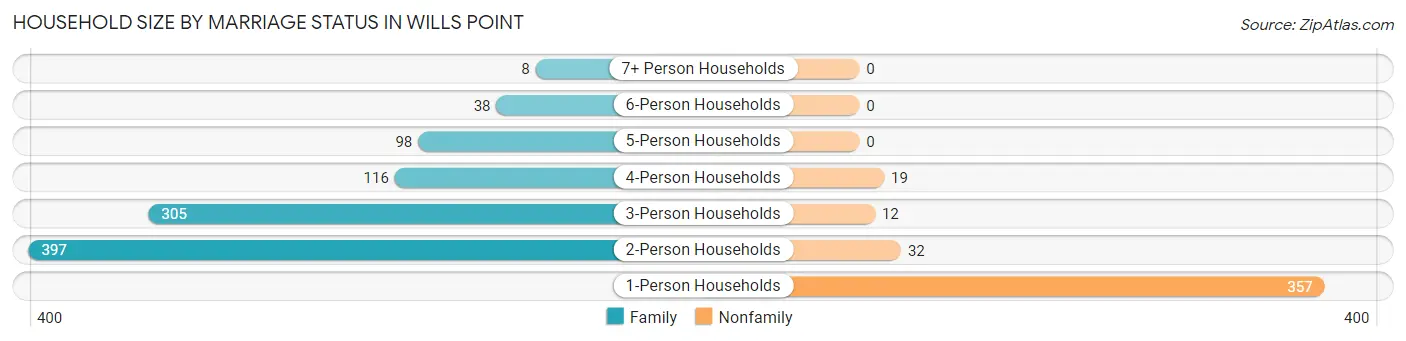
| Household Size | Family Households | Nonfamily Households |
| 1-Person Households | - | 357 (25.8%) |
| 2-Person Households | 397 (28.7%) | 32 (2.3%) |
| 3-Person Households | 305 (22.1%) | 12 (0.9%) |
| 4-Person Households | 116 (8.4%) | 19 (1.4%) |
| 5-Person Households | 98 (7.1%) | 0 (0.0%) |
| 6-Person Households | 38 (2.8%) | 0 (0.0%) |
| 7+ Person Households | 8 (0.6%) | 0 (0.0%) |
| Total | 962 (69.6%) | 420 (30.4%) |
Female Fertility in Wills Point
Fertility by Age in Wills Point
Average fertility rate in Wills Point is 70.0 births per 1,000 women. Women in the age bracket of 20 to 34 years have the highest fertility rate with 165.0 births per 1,000 women. Women in the age bracket of 20 to 34 years acount for 100.0% of all women with births.
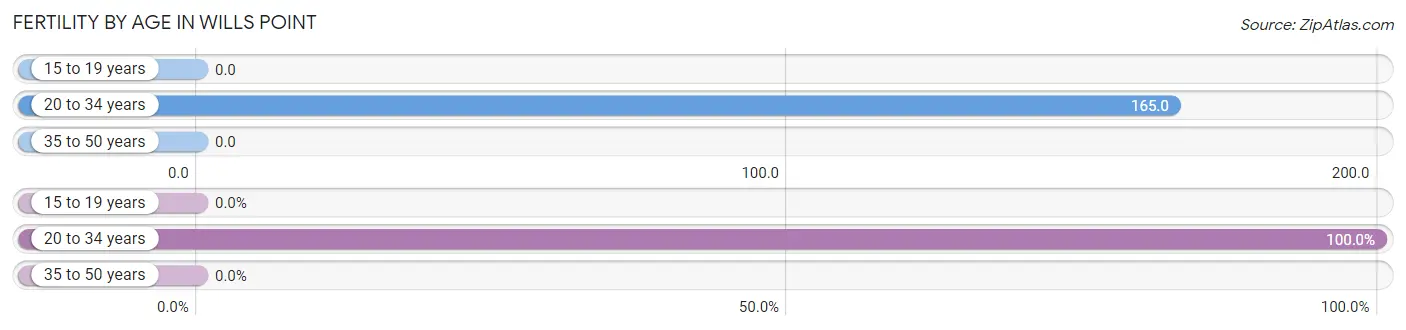
| Age Bracket | Women with Births | Births / 1,000 Women |
| 15 to 19 years | 0 (0.0%) | 0.0 |
| 20 to 34 years | 61 (100.0%) | 165.0 |
| 35 to 50 years | 0 (0.0%) | 0.0 |
| Total | 61 (100.0%) | 70.0 |
Fertility by Age by Marriage Status in Wills Point
88.5% of women with births (61) in Wills Point are married. The highest percentage of unmarried women with births falls into 20 to 34 years age bracket with 11.5% of them unmarried at the time of birth, while the lowest percentage of unmarried women with births belong to 20 to 34 years age bracket with 11.5% of them unmarried.
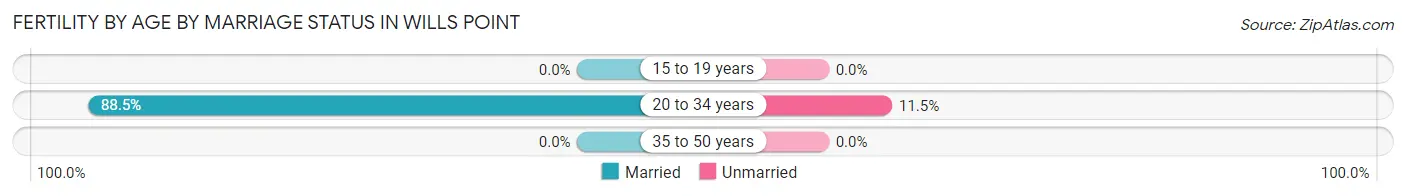
| Age Bracket | Married | Unmarried |
| 15 to 19 years | 0 (0.0%) | 0 (0.0%) |
| 20 to 34 years | 54 (88.5%) | 7 (11.5%) |
| 35 to 50 years | 0 (0.0%) | 0 (0.0%) |
| Total | 54 (88.5%) | 7 (11.5%) |
Fertility by Education in Wills Point
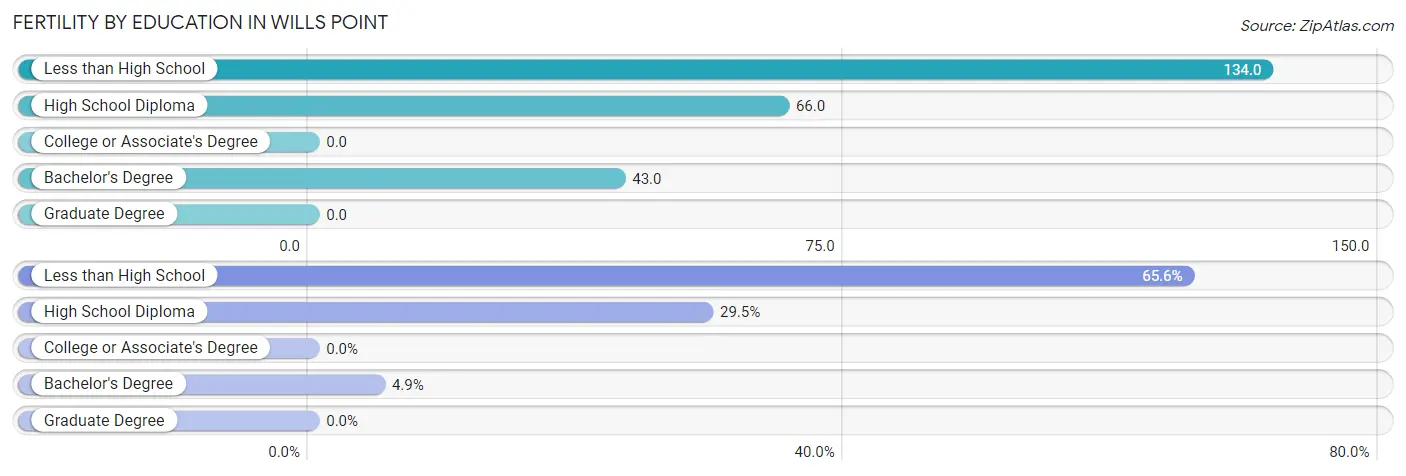
| Educational Attainment | Women with Births | Births / 1,000 Women |
| Less than High School | 40 (65.6%) | 134.0 |
| High School Diploma | 18 (29.5%) | 66.0 |
| College or Associate's Degree | 0 (0.0%) | 0.0 |
| Bachelor's Degree | 3 (4.9%) | 43.0 |
| Graduate Degree | 0 (0.0%) | 0.0 |
| Total | 61 (100.0%) | 70.0 |
Fertility by Education by Marriage Status in Wills Point
11.5% of women with births in Wills Point are unmarried. Women with the educational attainment of less than high school are most likely to be married with 100.0% of them married at childbirth, while women with the educational attainment of high school diploma are least likely to be married with 38.9% of them unmarried at childbirth.

| Educational Attainment | Married | Unmarried |
| Less than High School | 40 (100.0%) | 0 (0.0%) |
| High School Diploma | 11 (61.1%) | 7 (38.9%) |
| College or Associate's Degree | 0 (0.0%) | 0 (0.0%) |
| Bachelor's Degree | 3 (100.0%) | 0 (0.0%) |
| Graduate Degree | 0 (0.0%) | 0 (0.0%) |
| Total | 54 (88.5%) | 7 (11.5%) |
Employment Characteristics in Wills Point
Employment by Class of Employer in Wills Point
Among the 1,687 employed individuals in Wills Point, private company employees (1,206 | 71.5%), state government employees (173 | 10.2%), and local government employees (137 | 8.1%) make up the most common classes of employment.
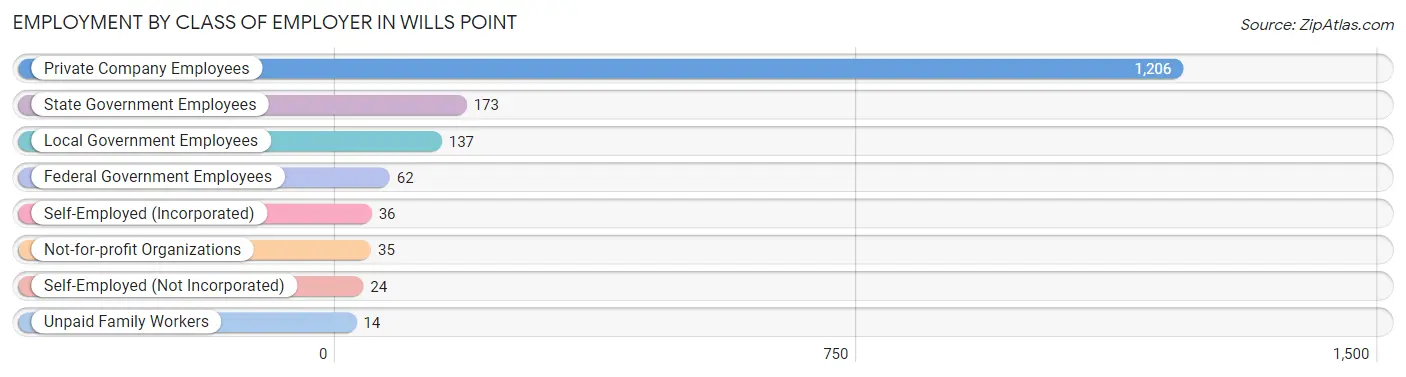
| Employer Class | # Employees | % Employees |
| Private Company Employees | 1,206 | 71.5% |
| Self-Employed (Incorporated) | 36 | 2.1% |
| Self-Employed (Not Incorporated) | 24 | 1.4% |
| Not-for-profit Organizations | 35 | 2.1% |
| Local Government Employees | 137 | 8.1% |
| State Government Employees | 173 | 10.2% |
| Federal Government Employees | 62 | 3.7% |
| Unpaid Family Workers | 14 | 0.8% |
| Total | 1,687 | 100.0% |
Employment Status by Age in Wills Point
According to the labor force statistics for Wills Point, out of the total population over 16 years of age (2,838), 60.6% or 1,720 individuals are in the labor force, with 1.9% or 33 of them unemployed. The age group with the highest labor force participation rate is 30 to 34 years, with 96.7% or 207 individuals in the labor force. Within the labor force, the 30 to 34 years age range has the highest percentage of unemployed individuals, with 5.3% or 11 of them being unemployed.
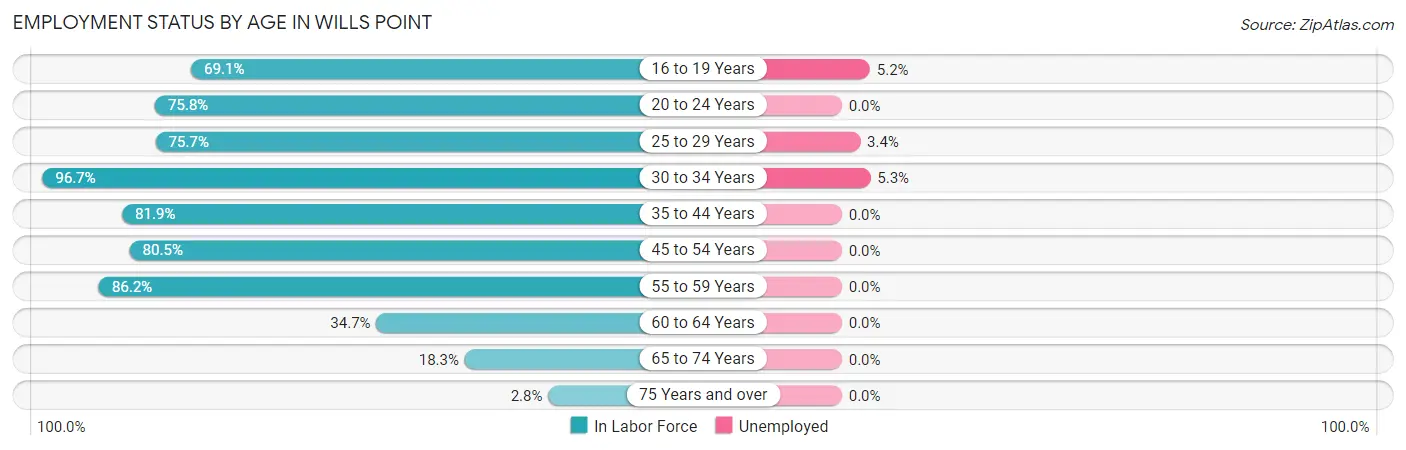
| Age Bracket | In Labor Force | Unemployed |
| 16 to 19 Years | 286 (69.1%) | 15 (5.2%) |
| 20 to 24 Years | 91 (75.8%) | 0 (0.0%) |
| 25 to 29 Years | 206 (75.7%) | 7 (3.4%) |
| 30 to 34 Years | 207 (96.7%) | 11 (5.3%) |
| 35 to 44 Years | 222 (81.9%) | 0 (0.0%) |
| 45 to 54 Years | 363 (80.5%) | 0 (0.0%) |
| 55 to 59 Years | 163 (86.2%) | 0 (0.0%) |
| 60 to 64 Years | 117 (34.7%) | 0 (0.0%) |
| 65 to 74 Years | 58 (18.3%) | 0 (0.0%) |
| 75 Years and over | 7 (2.8%) | 0 (0.0%) |
| Total | 1,720 (60.6%) | 33 (1.9%) |
Employment Status by Educational Attainment in Wills Point
According to labor force statistics for Wills Point, 73.7% of individuals (1,278) out of the total population between 25 and 64 years of age (1,734) are in the labor force, with 1.4% or 18 of them being unemployed. The group with the highest labor force participation rate are those with the educational attainment of high school diploma, with 86.0% or 516 individuals in the labor force. Within the labor force, individuals with less than high school education have the highest percentage of unemployment, with 2.9% or 7 of them being unemployed.
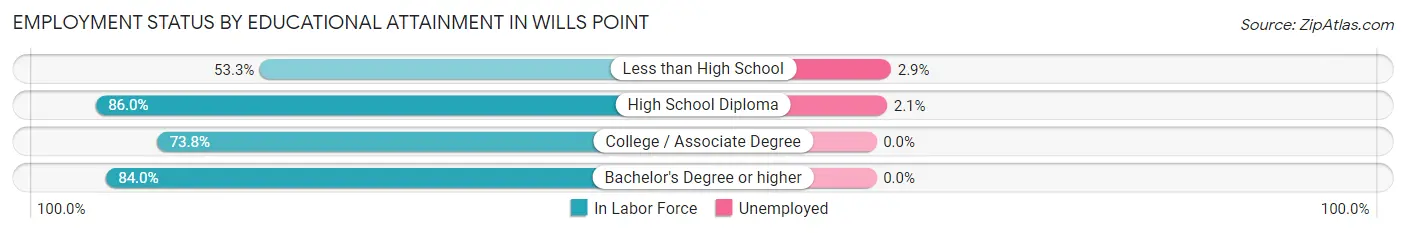
| Educational Attainment | In Labor Force | Unemployed |
| Less than High School | 241 (53.3%) | 13 (2.9%) |
| High School Diploma | 516 (86.0%) | 13 (2.1%) |
| College / Associate Degree | 374 (73.8%) | 0 (0.0%) |
| Bachelor's Degree or higher | 147 (84.0%) | 0 (0.0%) |
| Total | 1,278 (73.7%) | 24 (1.4%) |
Employment Occupations by Sex in Wills Point
Management, Business, Science and Arts Occupations
The most common Management, Business, Science and Arts occupations in Wills Point are Community & Social Service (144 | 8.5%), Education Instruction & Library (144 | 8.5%), Management (68 | 4.0%), Health Diagnosing & Treating (52 | 3.1%), and Business & Financial (32 | 1.9%).
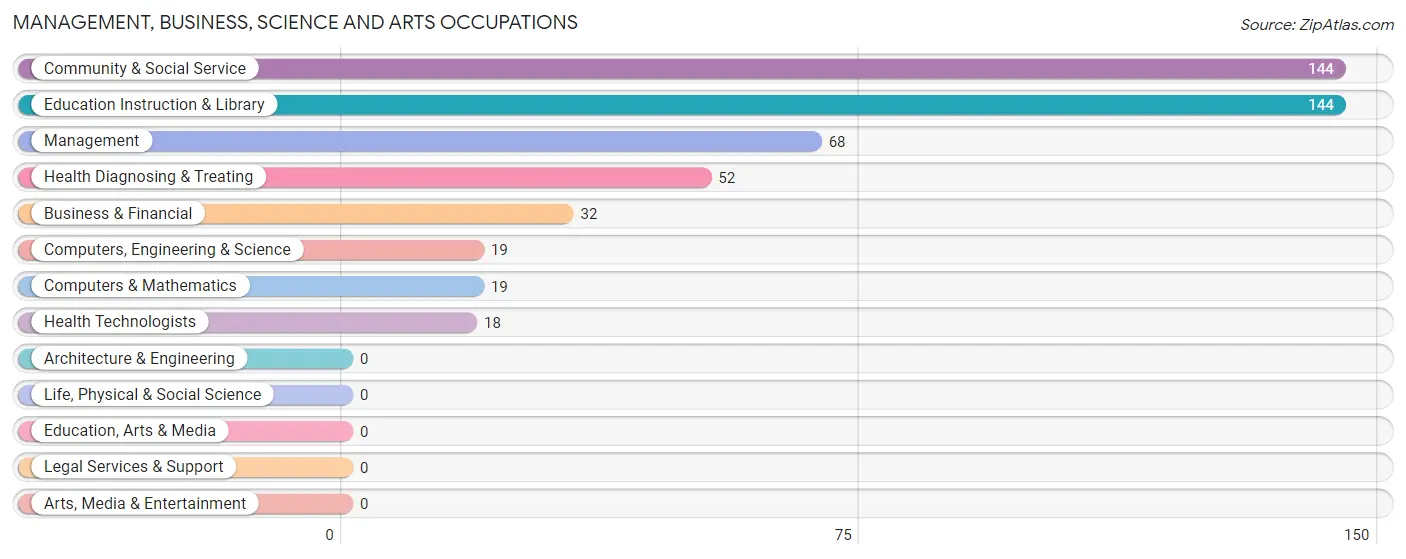
Management, Business, Science and Arts Occupations by Sex
Within the Management, Business, Science and Arts occupations in Wills Point, the most male-oriented occupations are Business & Financial (78.1%), Management (55.9%), and Computers, Engineering & Science (47.4%), while the most female-oriented occupations are Health Diagnosing & Treating (100.0%), Health Technologists (100.0%), and Community & Social Service (80.6%).
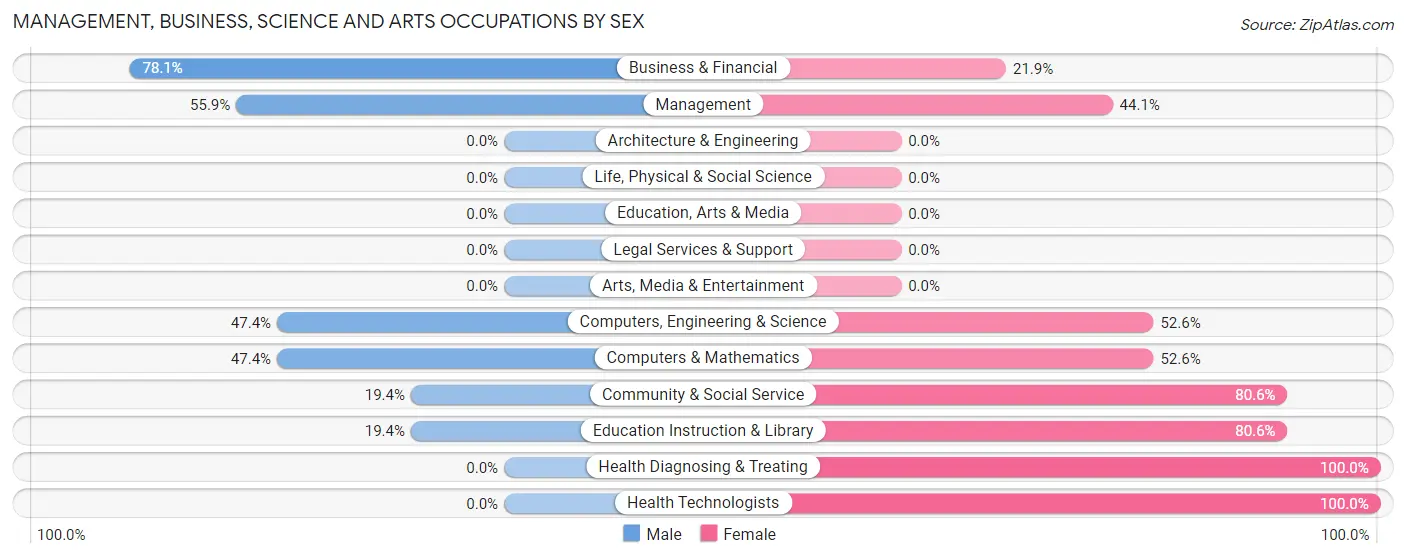
| Occupation | Male | Female |
| Management | 38 (55.9%) | 30 (44.1%) |
| Business & Financial | 25 (78.1%) | 7 (21.9%) |
| Computers, Engineering & Science | 9 (47.4%) | 10 (52.6%) |
| Computers & Mathematics | 9 (47.4%) | 10 (52.6%) |
| Architecture & Engineering | 0 (0.0%) | 0 (0.0%) |
| Life, Physical & Social Science | 0 (0.0%) | 0 (0.0%) |
| Community & Social Service | 28 (19.4%) | 116 (80.6%) |
| Education, Arts & Media | 0 (0.0%) | 0 (0.0%) |
| Legal Services & Support | 0 (0.0%) | 0 (0.0%) |
| Education Instruction & Library | 28 (19.4%) | 116 (80.6%) |
| Arts, Media & Entertainment | 0 (0.0%) | 0 (0.0%) |
| Health Diagnosing & Treating | 0 (0.0%) | 52 (100.0%) |
| Health Technologists | 0 (0.0%) | 18 (100.0%) |
| Total (Category) | 100 (31.8%) | 215 (68.2%) |
| Total (Overall) | 851 (50.4%) | 836 (49.6%) |
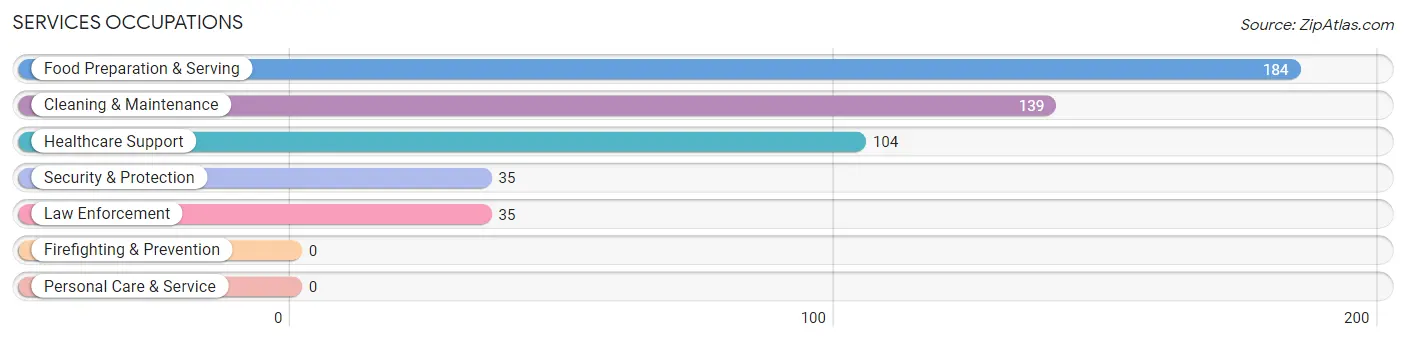
Services Occupations
The most common Services occupations in Wills Point are Food Preparation & Serving (184 | 10.9%), Cleaning & Maintenance (139 | 8.2%), Healthcare Support (104 | 6.2%), Security & Protection (35 | 2.1%), and Law Enforcement (35 | 2.1%).
Services Occupations by Sex
Within the Services occupations in Wills Point, the most male-oriented occupations are Security & Protection (100.0%), Law Enforcement (100.0%), and Cleaning & Maintenance (40.3%), while the most female-oriented occupations are Healthcare Support (100.0%), Food Preparation & Serving (67.9%), and Cleaning & Maintenance (59.7%).
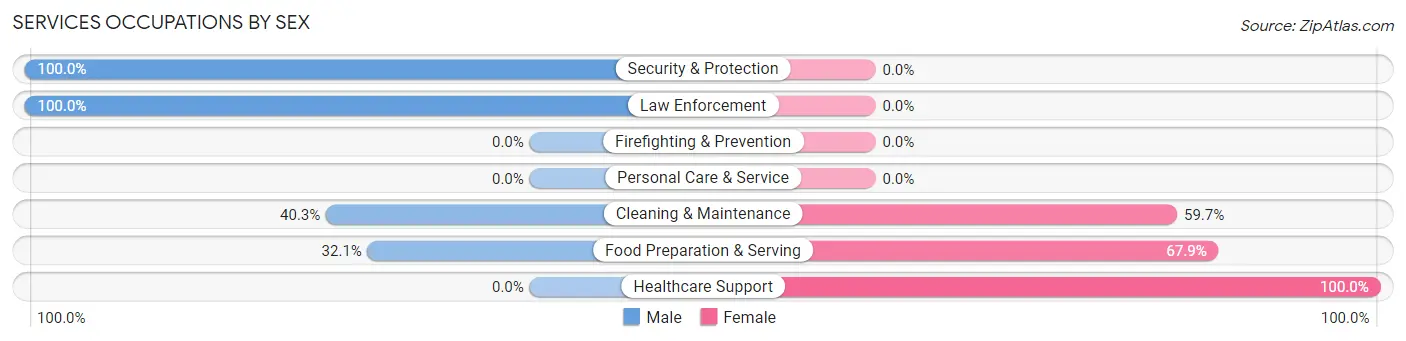
| Occupation | Male | Female |
| Healthcare Support | 0 (0.0%) | 104 (100.0%) |
| Security & Protection | 35 (100.0%) | 0 (0.0%) |
| Firefighting & Prevention | 0 (0.0%) | 0 (0.0%) |
| Law Enforcement | 35 (100.0%) | 0 (0.0%) |
| Food Preparation & Serving | 59 (32.1%) | 125 (67.9%) |
| Cleaning & Maintenance | 56 (40.3%) | 83 (59.7%) |
| Personal Care & Service | 0 (0.0%) | 0 (0.0%) |
| Total (Category) | 150 (32.5%) | 312 (67.5%) |
| Total (Overall) | 851 (50.4%) | 836 (49.6%) |
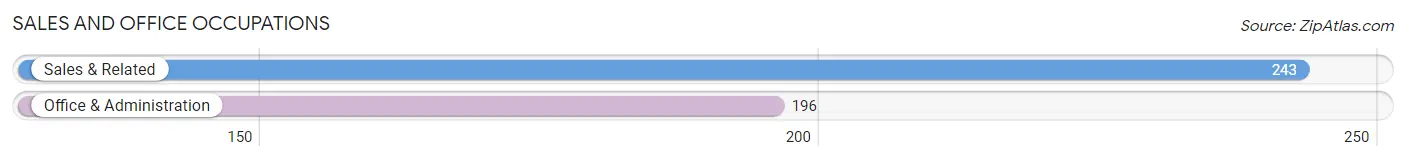
Sales and Office Occupations
The most common Sales and Office occupations in Wills Point are Sales & Related (243 | 14.4%), and Office & Administration (196 | 11.6%).
Sales and Office Occupations by Sex
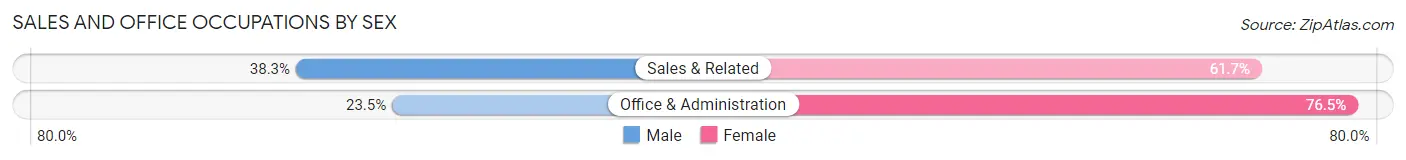
| Occupation | Male | Female |
| Sales & Related | 93 (38.3%) | 150 (61.7%) |
| Office & Administration | 46 (23.5%) | 150 (76.5%) |
| Total (Category) | 139 (31.7%) | 300 (68.3%) |
| Total (Overall) | 851 (50.4%) | 836 (49.6%) |
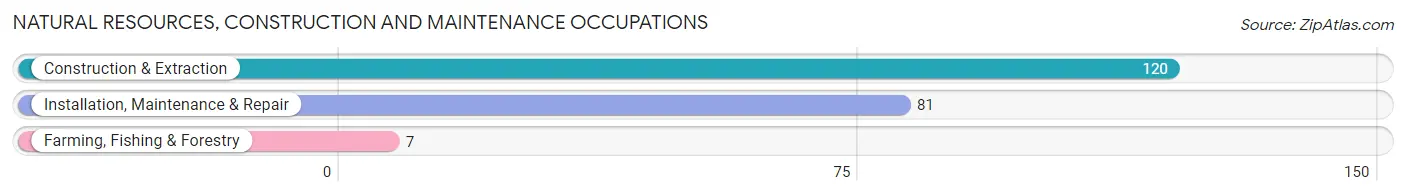
Natural Resources, Construction and Maintenance Occupations
The most common Natural Resources, Construction and Maintenance occupations in Wills Point are Construction & Extraction (120 | 7.1%), Installation, Maintenance & Repair (81 | 4.8%), and Farming, Fishing & Forestry (7 | 0.4%).
Natural Resources, Construction and Maintenance Occupations by Sex
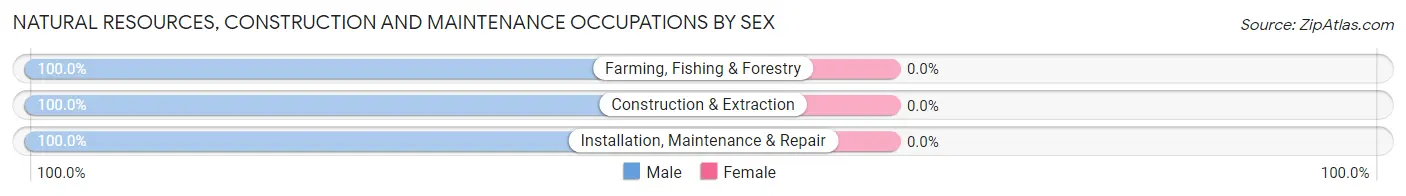
| Occupation | Male | Female |
| Farming, Fishing & Forestry | 7 (100.0%) | 0 (0.0%) |
| Construction & Extraction | 120 (100.0%) | 0 (0.0%) |
| Installation, Maintenance & Repair | 81 (100.0%) | 0 (0.0%) |
| Total (Category) | 208 (100.0%) | 0 (0.0%) |
| Total (Overall) | 851 (50.4%) | 836 (49.6%) |
Production, Transportation and Moving Occupations
The most common Production, Transportation and Moving occupations in Wills Point are Material Moving (127 | 7.5%), Production (69 | 4.1%), and Transportation (67 | 4.0%).
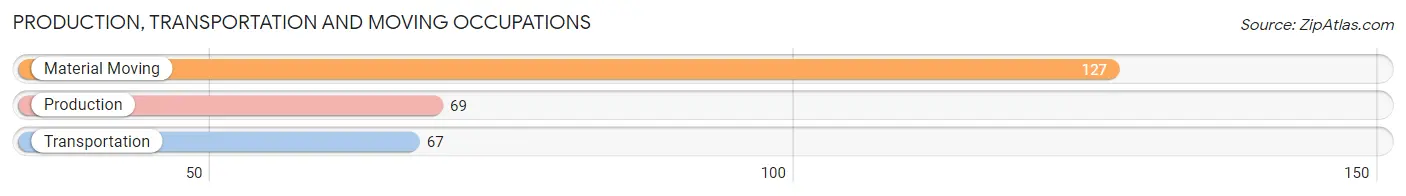
Production, Transportation and Moving Occupations by Sex
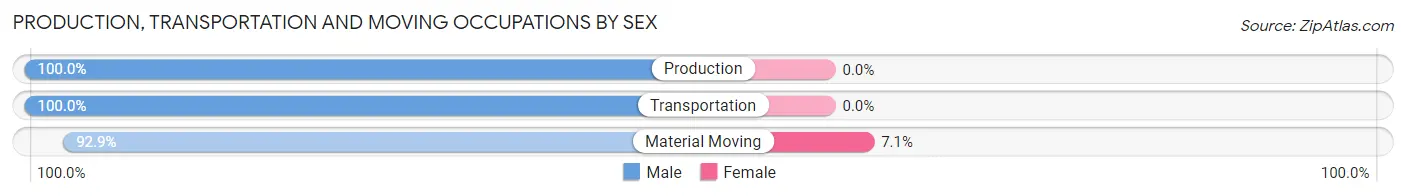
| Occupation | Male | Female |
| Production | 69 (100.0%) | 0 (0.0%) |
| Transportation | 67 (100.0%) | 0 (0.0%) |
| Material Moving | 118 (92.9%) | 9 (7.1%) |
| Total (Category) | 254 (96.6%) | 9 (3.4%) |
| Total (Overall) | 851 (50.4%) | 836 (49.6%) |
Employment Industries by Sex in Wills Point
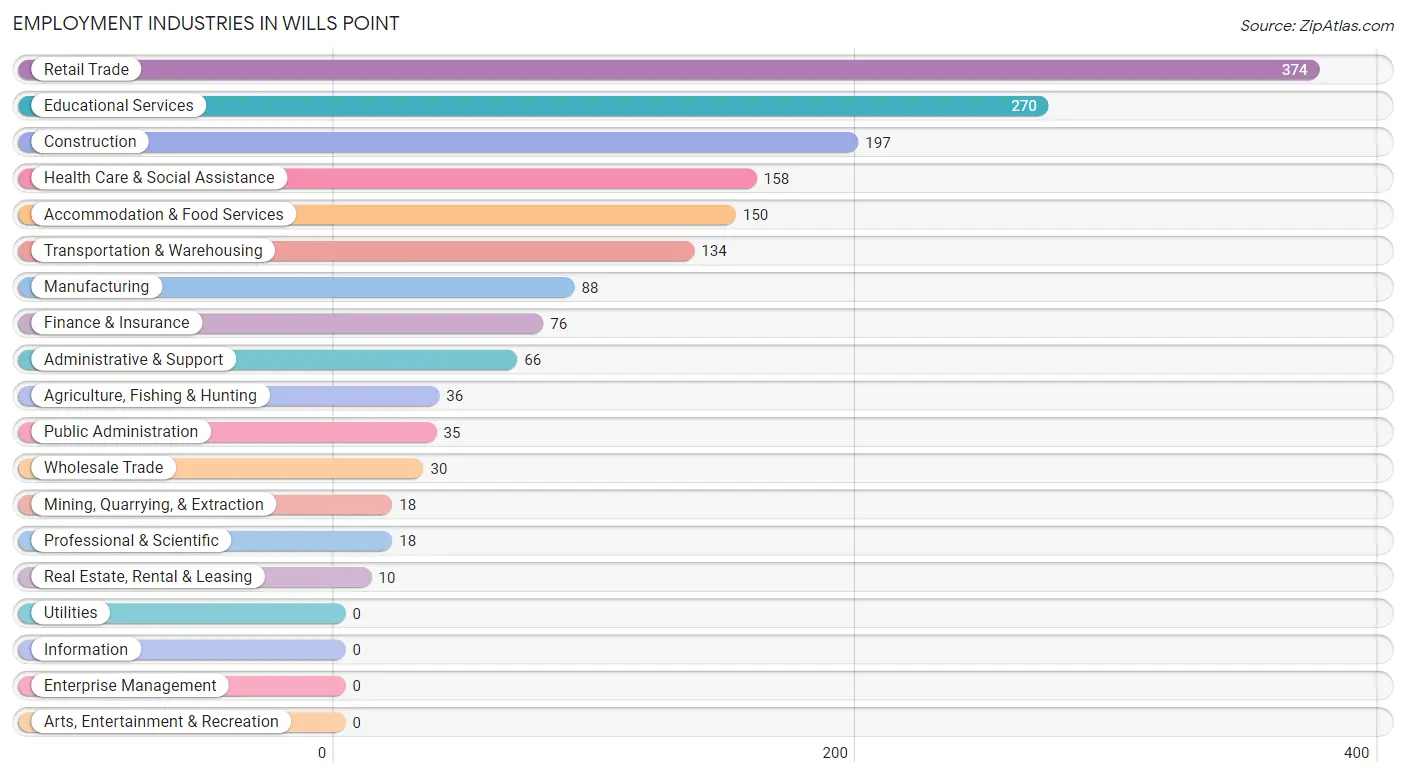
Employment Industries in Wills Point
The major employment industries in Wills Point include Retail Trade (374 | 22.2%), Educational Services (270 | 16.0%), Construction (197 | 11.7%), Health Care & Social Assistance (158 | 9.4%), and Accommodation & Food Services (150 | 8.9%).
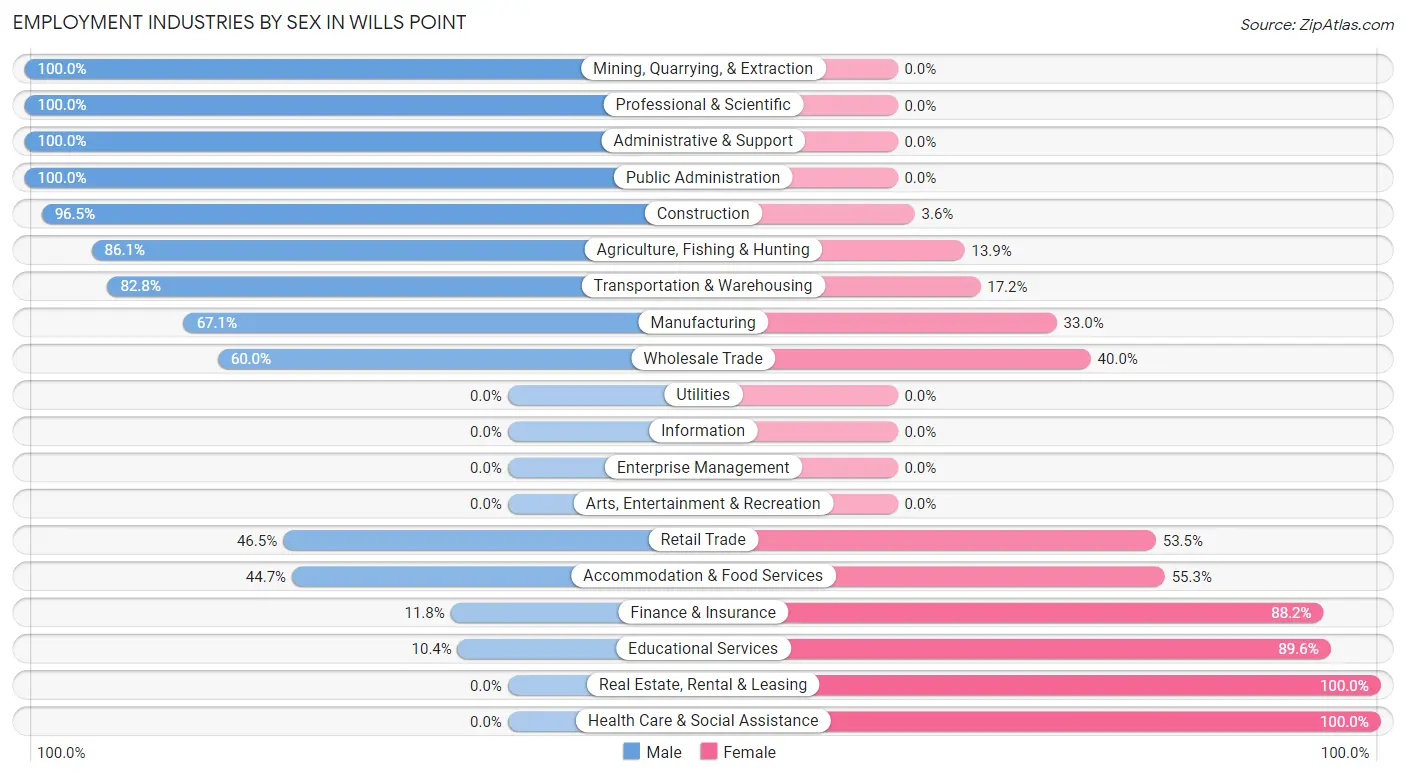
Employment Industries by Sex in Wills Point
The Wills Point industries that see more men than women are Mining, Quarrying, & Extraction (100.0%), Professional & Scientific (100.0%), and Administrative & Support (100.0%), whereas the industries that tend to have a higher number of women are Real Estate, Rental & Leasing (100.0%), Health Care & Social Assistance (100.0%), and Educational Services (89.6%).
| Industry | Male | Female |
| Agriculture, Fishing & Hunting | 31 (86.1%) | 5 (13.9%) |
| Mining, Quarrying, & Extraction | 18 (100.0%) | 0 (0.0%) |
| Construction | 190 (96.5%) | 7 (3.5%) |
| Manufacturing | 59 (67.0%) | 29 (33.0%) |
| Wholesale Trade | 18 (60.0%) | 12 (40.0%) |
| Retail Trade | 174 (46.5%) | 200 (53.5%) |
| Transportation & Warehousing | 111 (82.8%) | 23 (17.2%) |
| Utilities | 0 (0.0%) | 0 (0.0%) |
| Information | 0 (0.0%) | 0 (0.0%) |
| Finance & Insurance | 9 (11.8%) | 67 (88.2%) |
| Real Estate, Rental & Leasing | 0 (0.0%) | 10 (100.0%) |
| Professional & Scientific | 18 (100.0%) | 0 (0.0%) |
| Enterprise Management | 0 (0.0%) | 0 (0.0%) |
| Administrative & Support | 66 (100.0%) | 0 (0.0%) |
| Educational Services | 28 (10.4%) | 242 (89.6%) |
| Health Care & Social Assistance | 0 (0.0%) | 158 (100.0%) |
| Arts, Entertainment & Recreation | 0 (0.0%) | 0 (0.0%) |
| Accommodation & Food Services | 67 (44.7%) | 83 (55.3%) |
| Public Administration | 35 (100.0%) | 0 (0.0%) |
| Total | 851 (50.4%) | 836 (49.6%) |
Education in Wills Point
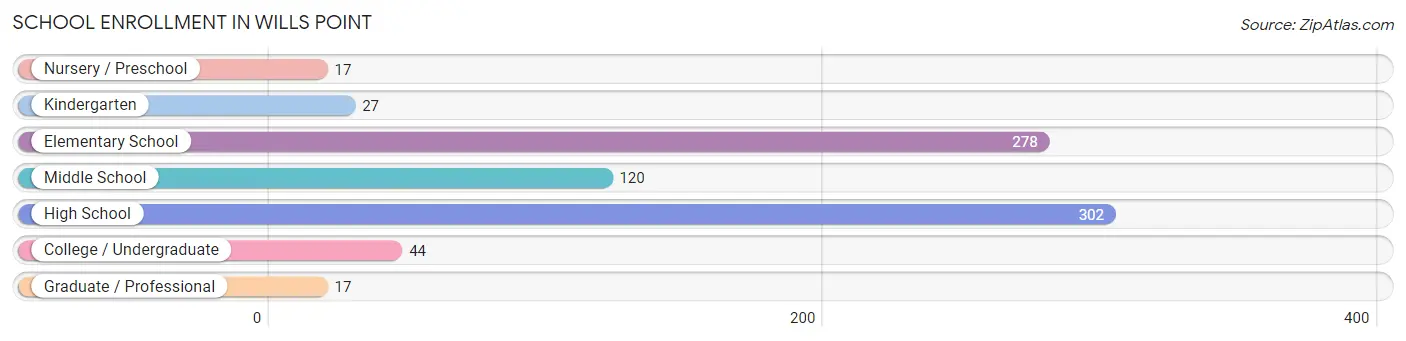
School Enrollment in Wills Point
The most common levels of schooling among the 805 students in Wills Point are high school (302 | 37.5%), elementary school (278 | 34.5%), and middle school (120 | 14.9%).
| School Level | # Students | % Students |
| Nursery / Preschool | 17 | 2.1% |
| Kindergarten | 27 | 3.4% |
| Elementary School | 278 | 34.5% |
| Middle School | 120 | 14.9% |
| High School | 302 | 37.5% |
| College / Undergraduate | 44 | 5.5% |
| Graduate / Professional | 17 | 2.1% |
| Total | 805 | 100.0% |
School Enrollment by Age by Funding Source in Wills Point
Out of a total of 805 students who are enrolled in schools in Wills Point, 101 (12.5%) attend a private institution, while the remaining 704 (87.5%) are enrolled in public schools. The age group of 18 to 19 year olds has the highest likelihood of being enrolled in private schools, with 18 (85.7% in the age bracket) enrolled. Conversely, the age group of 20 to 24 year olds has the lowest likelihood of being enrolled in a private school, with 25 (100.0% in the age bracket) attending a public institution.
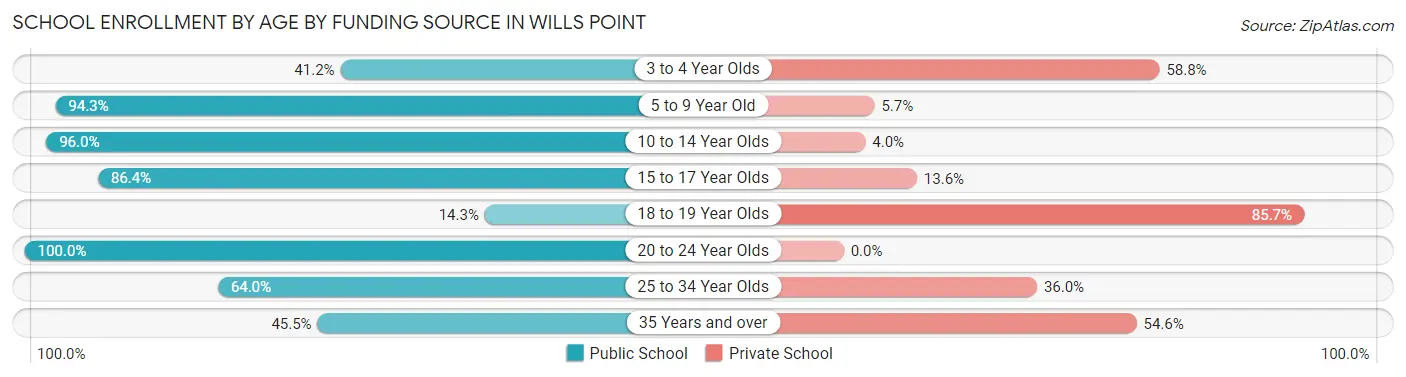
| Age Bracket | Public School | Private School |
| 3 to 4 Year Olds | 7 (41.2%) | 10 (58.8%) |
| 5 to 9 Year Old | 230 (94.3%) | 14 (5.7%) |
| 10 to 14 Year Olds | 190 (96.0%) | 8 (4.0%) |
| 15 to 17 Year Olds | 228 (86.4%) | 36 (13.6%) |
| 18 to 19 Year Olds | 3 (14.3%) | 18 (85.7%) |
| 20 to 24 Year Olds | 25 (100.0%) | 0 (0.0%) |
| 25 to 34 Year Olds | 16 (64.0%) | 9 (36.0%) |
| 35 Years and over | 5 (45.5%) | 6 (54.5%) |
| Total | 704 (87.5%) | 101 (12.5%) |
Educational Attainment by Field of Study in Wills Point
Education (87 | 33.7%), business (55 | 21.3%), psychology (22 | 8.5%), science & technology (21 | 8.1%), and arts & humanities (17 | 6.6%) are the most common fields of study among 258 individuals in Wills Point who have obtained a bachelor's degree or higher.
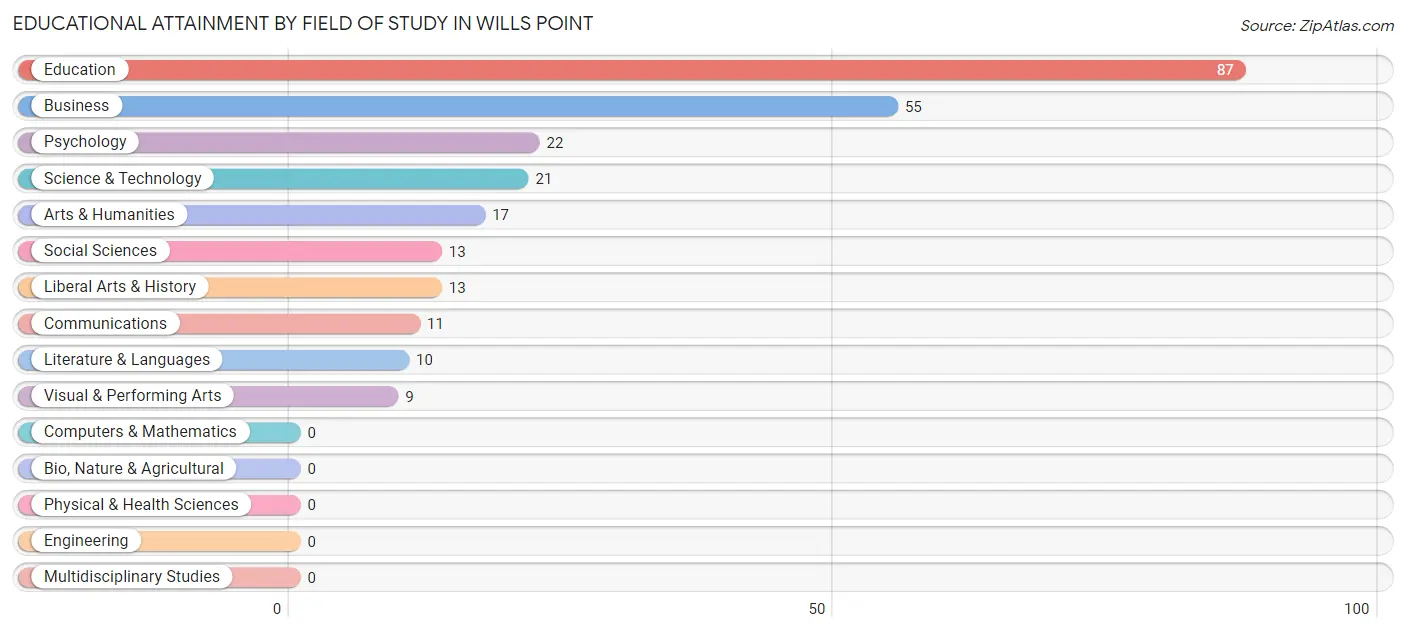
| Field of Study | # Graduates | % Graduates |
| Computers & Mathematics | 0 | 0.0% |
| Bio, Nature & Agricultural | 0 | 0.0% |
| Physical & Health Sciences | 0 | 0.0% |
| Psychology | 22 | 8.5% |
| Social Sciences | 13 | 5.0% |
| Engineering | 0 | 0.0% |
| Multidisciplinary Studies | 0 | 0.0% |
| Science & Technology | 21 | 8.1% |
| Business | 55 | 21.3% |
| Education | 87 | 33.7% |
| Literature & Languages | 10 | 3.9% |
| Liberal Arts & History | 13 | 5.0% |
| Visual & Performing Arts | 9 | 3.5% |
| Communications | 11 | 4.3% |
| Arts & Humanities | 17 | 6.6% |
| Total | 258 | 100.0% |
Transportation & Commute in Wills Point
Vehicle Availability by Sex in Wills Point
The most prevalent vehicle ownership categories in Wills Point are males with 2 vehicles (287, accounting for 33.7%) and females with 2 vehicles (315, making up 34.3%).
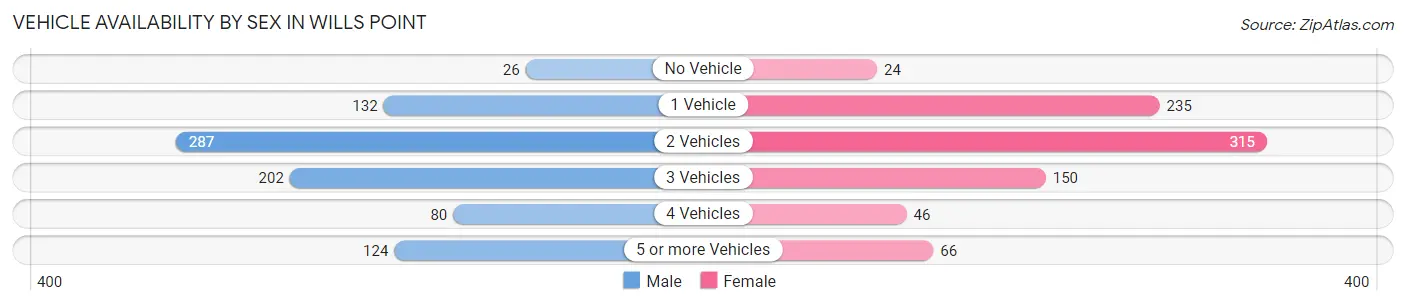
| Vehicles Available | Male | Female |
| No Vehicle | 26 (3.1%) | 24 (2.9%) |
| 1 Vehicle | 132 (15.5%) | 235 (28.1%) |
| 2 Vehicles | 287 (33.7%) | 315 (37.7%) |
| 3 Vehicles | 202 (23.7%) | 150 (17.9%) |
| 4 Vehicles | 80 (9.4%) | 46 (5.5%) |
| 5 or more Vehicles | 124 (14.6%) | 66 (7.9%) |
| Total | 851 (100.0%) | 836 (100.0%) |
Commute Time in Wills Point
The most frequently occuring commute durations in Wills Point are 5 to 9 minutes (275 commuters, 17.4%), 30 to 34 minutes (223 commuters, 14.1%), and 20 to 24 minutes (211 commuters, 13.3%).
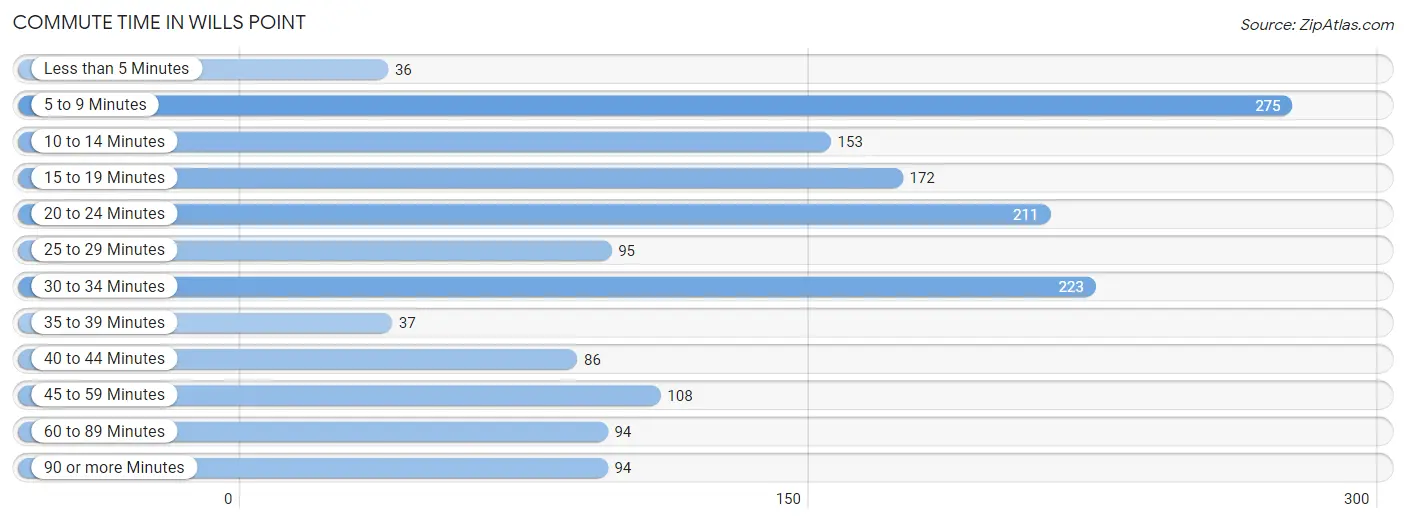
| Commute Time | # Commuters | % Commuters |
| Less than 5 Minutes | 36 | 2.3% |
| 5 to 9 Minutes | 275 | 17.4% |
| 10 to 14 Minutes | 153 | 9.7% |
| 15 to 19 Minutes | 172 | 10.9% |
| 20 to 24 Minutes | 211 | 13.3% |
| 25 to 29 Minutes | 95 | 6.0% |
| 30 to 34 Minutes | 223 | 14.1% |
| 35 to 39 Minutes | 37 | 2.3% |
| 40 to 44 Minutes | 86 | 5.4% |
| 45 to 59 Minutes | 108 | 6.8% |
| 60 to 89 Minutes | 94 | 5.9% |
| 90 or more Minutes | 94 | 5.9% |
Commute Time by Sex in Wills Point
The most common commute times in Wills Point are 30 to 34 minutes (175 commuters, 21.0%) for males and 5 to 9 minutes (251 commuters, 33.5%) for females.
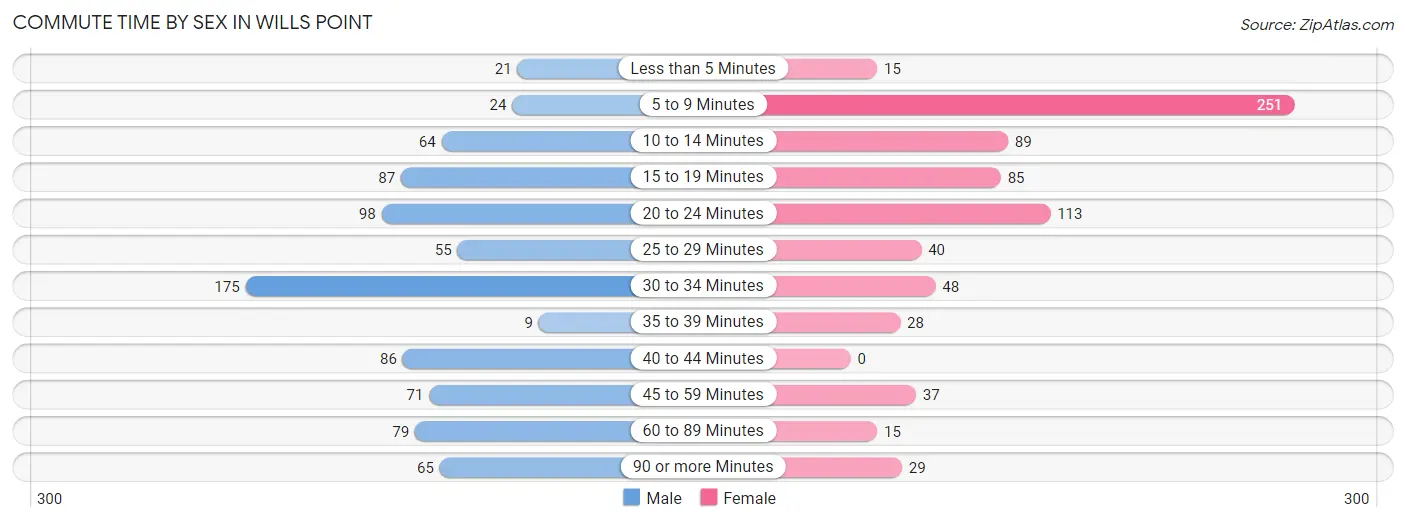
| Commute Time | Male | Female |
| Less than 5 Minutes | 21 (2.5%) | 15 (2.0%) |
| 5 to 9 Minutes | 24 (2.9%) | 251 (33.5%) |
| 10 to 14 Minutes | 64 (7.7%) | 89 (11.9%) |
| 15 to 19 Minutes | 87 (10.4%) | 85 (11.3%) |
| 20 to 24 Minutes | 98 (11.7%) | 113 (15.1%) |
| 25 to 29 Minutes | 55 (6.6%) | 40 (5.3%) |
| 30 to 34 Minutes | 175 (21.0%) | 48 (6.4%) |
| 35 to 39 Minutes | 9 (1.1%) | 28 (3.7%) |
| 40 to 44 Minutes | 86 (10.3%) | 0 (0.0%) |
| 45 to 59 Minutes | 71 (8.5%) | 37 (4.9%) |
| 60 to 89 Minutes | 79 (9.5%) | 15 (2.0%) |
| 90 or more Minutes | 65 (7.8%) | 29 (3.9%) |
Time of Departure to Work by Sex in Wills Point
The most frequent times of departure to work in Wills Point are 6:00 AM to 6:29 AM (198, 23.7%) for males and 8:00 AM to 8:29 AM (138, 18.4%) for females.
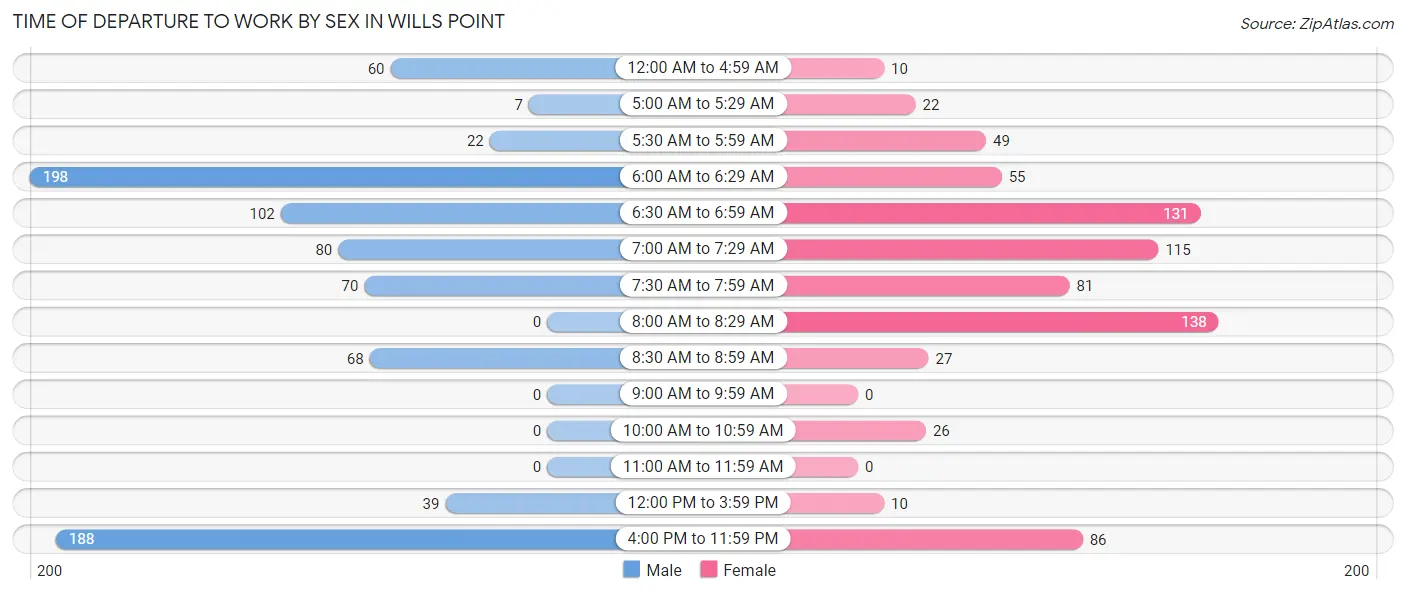
| Time of Departure | Male | Female |
| 12:00 AM to 4:59 AM | 60 (7.2%) | 10 (1.3%) |
| 5:00 AM to 5:29 AM | 7 (0.8%) | 22 (2.9%) |
| 5:30 AM to 5:59 AM | 22 (2.6%) | 49 (6.5%) |
| 6:00 AM to 6:29 AM | 198 (23.7%) | 55 (7.3%) |
| 6:30 AM to 6:59 AM | 102 (12.2%) | 131 (17.5%) |
| 7:00 AM to 7:29 AM | 80 (9.6%) | 115 (15.3%) |
| 7:30 AM to 7:59 AM | 70 (8.4%) | 81 (10.8%) |
| 8:00 AM to 8:29 AM | 0 (0.0%) | 138 (18.4%) |
| 8:30 AM to 8:59 AM | 68 (8.2%) | 27 (3.6%) |
| 9:00 AM to 9:59 AM | 0 (0.0%) | 0 (0.0%) |
| 10:00 AM to 10:59 AM | 0 (0.0%) | 26 (3.5%) |
| 11:00 AM to 11:59 AM | 0 (0.0%) | 0 (0.0%) |
| 12:00 PM to 3:59 PM | 39 (4.7%) | 10 (1.3%) |
| 4:00 PM to 11:59 PM | 188 (22.5%) | 86 (11.5%) |
| Total | 834 (100.0%) | 750 (100.0%) |
Housing Occupancy in Wills Point
Occupancy by Ownership in Wills Point
Of the total 1,382 dwellings in Wills Point, owner-occupied units account for 713 (51.6%), while renter-occupied units make up 669 (48.4%).
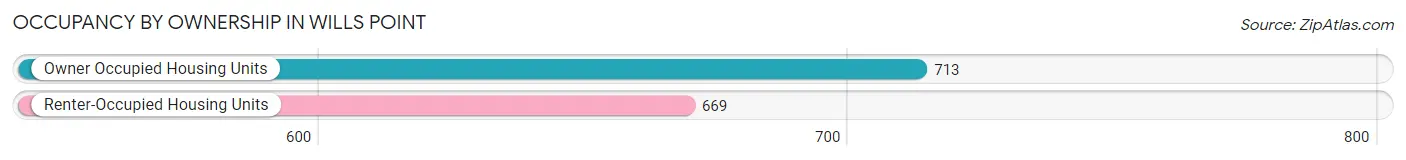
| Occupancy | # Housing Units | % Housing Units |
| Owner Occupied Housing Units | 713 | 51.6% |
| Renter-Occupied Housing Units | 669 | 48.4% |
| Total Occupied Housing Units | 1,382 | 100.0% |
Occupancy by Household Size in Wills Point
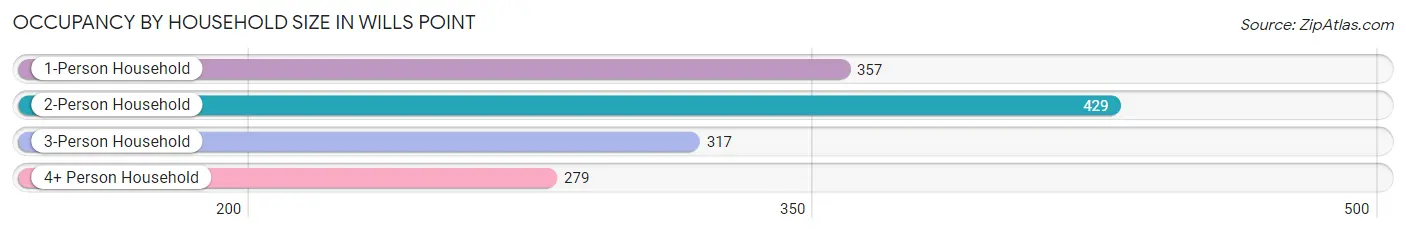
| Household Size | # Housing Units | % Housing Units |
| 1-Person Household | 357 | 25.8% |
| 2-Person Household | 429 | 31.0% |
| 3-Person Household | 317 | 22.9% |
| 4+ Person Household | 279 | 20.2% |
| Total Housing Units | 1,382 | 100.0% |
Occupancy by Ownership by Household Size in Wills Point
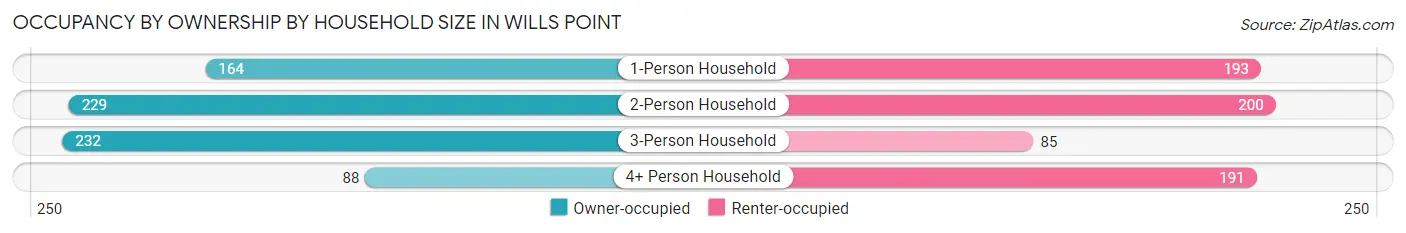
| Household Size | Owner-occupied | Renter-occupied |
| 1-Person Household | 164 (45.9%) | 193 (54.1%) |
| 2-Person Household | 229 (53.4%) | 200 (46.6%) |
| 3-Person Household | 232 (73.2%) | 85 (26.8%) |
| 4+ Person Household | 88 (31.5%) | 191 (68.5%) |
| Total Housing Units | 713 (51.6%) | 669 (48.4%) |
Occupancy by Educational Attainment in Wills Point
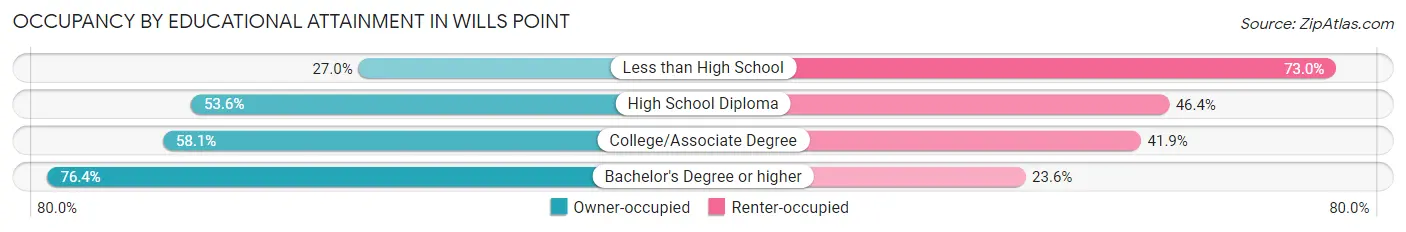
| Household Size | Owner-occupied | Renter-occupied |
| Less than High School | 86 (27.0%) | 232 (73.0%) |
| High School Diploma | 290 (53.6%) | 251 (46.4%) |
| College/Associate Degree | 198 (58.1%) | 143 (41.9%) |
| Bachelor's Degree or higher | 139 (76.4%) | 43 (23.6%) |
Occupancy by Age of Householder in Wills Point
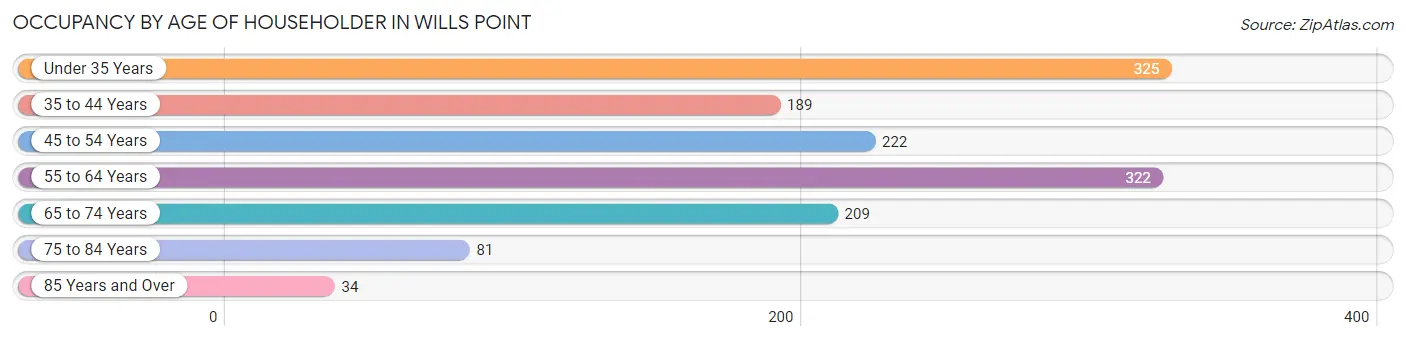
| Age Bracket | # Households | % Households |
| Under 35 Years | 325 | 23.5% |
| 35 to 44 Years | 189 | 13.7% |
| 45 to 54 Years | 222 | 16.1% |
| 55 to 64 Years | 322 | 23.3% |
| 65 to 74 Years | 209 | 15.1% |
| 75 to 84 Years | 81 | 5.9% |
| 85 Years and Over | 34 | 2.5% |
| Total | 1,382 | 100.0% |
Housing Finances in Wills Point
Median Income by Occupancy in Wills Point
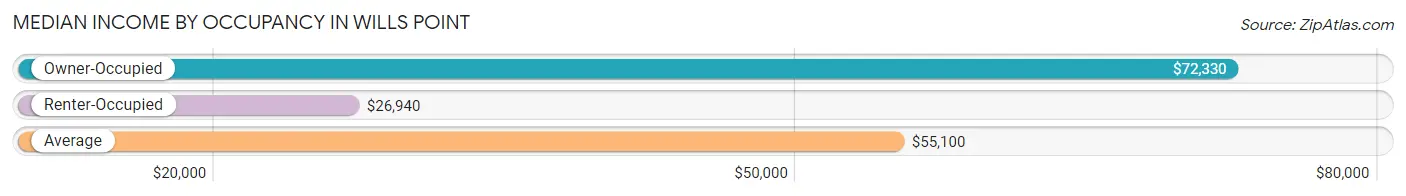
| Occupancy Type | # Households | Median Income |
| Owner-Occupied | 713 (51.6%) | $72,330 |
| Renter-Occupied | 669 (48.4%) | $26,940 |
| Average | 1,382 (100.0%) | $55,100 |
Occupancy by Householder Income Bracket in Wills Point
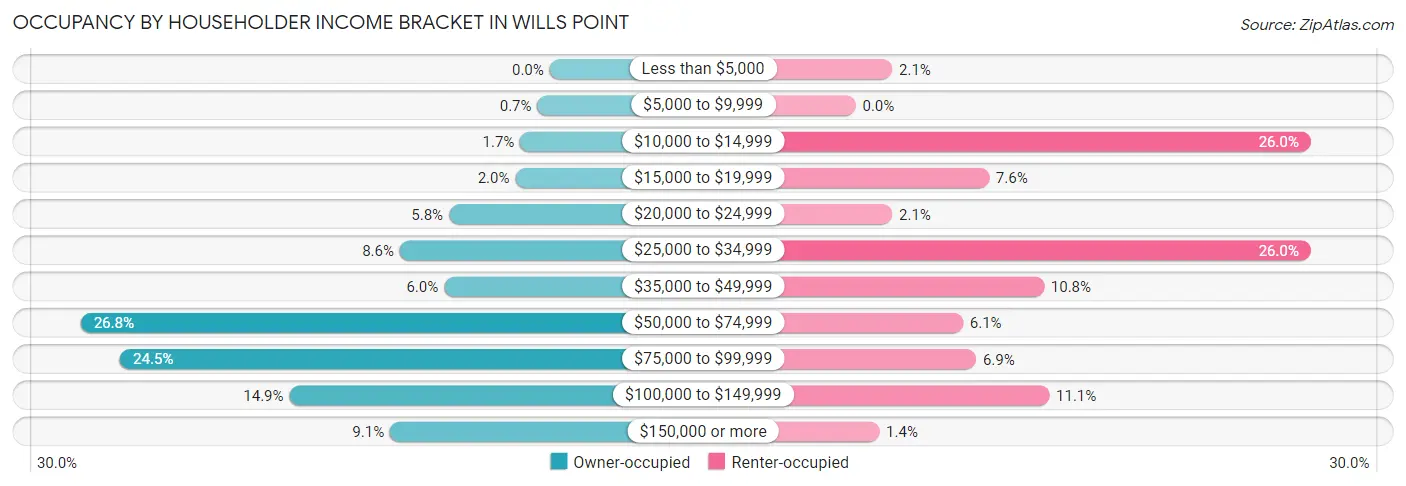
| Income Bracket | Owner-occupied | Renter-occupied |
| Less than $5,000 | 0 (0.0%) | 14 (2.1%) |
| $5,000 to $9,999 | 5 (0.7%) | 0 (0.0%) |
| $10,000 to $14,999 | 12 (1.7%) | 174 (26.0%) |
| $15,000 to $19,999 | 14 (2.0%) | 51 (7.6%) |
| $20,000 to $24,999 | 41 (5.8%) | 14 (2.1%) |
| $25,000 to $34,999 | 61 (8.6%) | 174 (26.0%) |
| $35,000 to $49,999 | 43 (6.0%) | 72 (10.8%) |
| $50,000 to $74,999 | 191 (26.8%) | 41 (6.1%) |
| $75,000 to $99,999 | 175 (24.5%) | 46 (6.9%) |
| $100,000 to $149,999 | 106 (14.9%) | 74 (11.1%) |
| $150,000 or more | 65 (9.1%) | 9 (1.3%) |
| Total | 713 (100.0%) | 669 (100.0%) |
Monthly Housing Cost Tiers in Wills Point
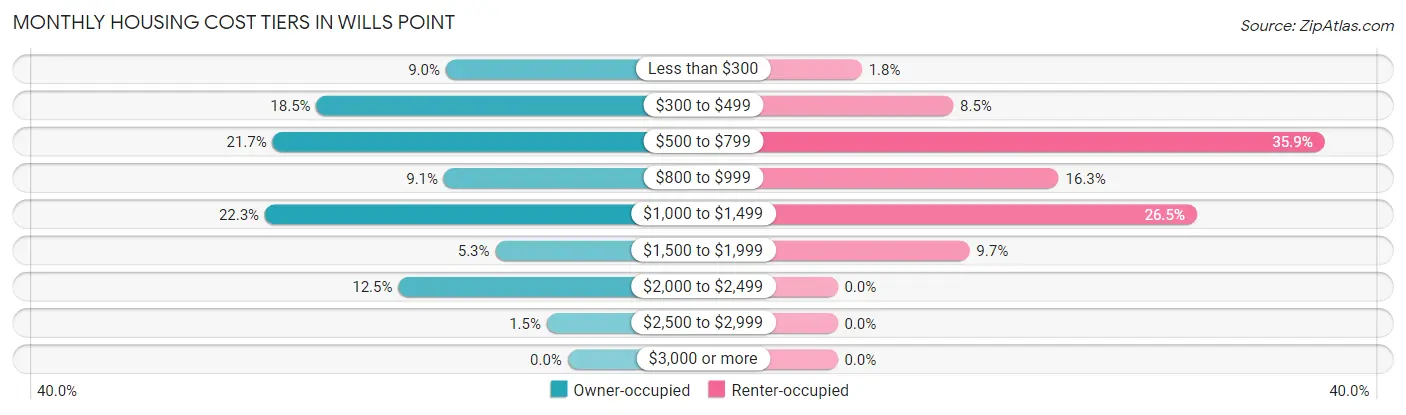
| Monthly Cost | Owner-occupied | Renter-occupied |
| Less than $300 | 64 (9.0%) | 12 (1.8%) |
| $300 to $499 | 132 (18.5%) | 57 (8.5%) |
| $500 to $799 | 155 (21.7%) | 240 (35.9%) |
| $800 to $999 | 65 (9.1%) | 109 (16.3%) |
| $1,000 to $1,499 | 159 (22.3%) | 177 (26.5%) |
| $1,500 to $1,999 | 38 (5.3%) | 65 (9.7%) |
| $2,000 to $2,499 | 89 (12.5%) | 0 (0.0%) |
| $2,500 to $2,999 | 11 (1.5%) | 0 (0.0%) |
| $3,000 or more | 0 (0.0%) | 0 (0.0%) |
| Total | 713 (100.0%) | 669 (100.0%) |
Physical Housing Characteristics in Wills Point
Housing Structures in Wills Point
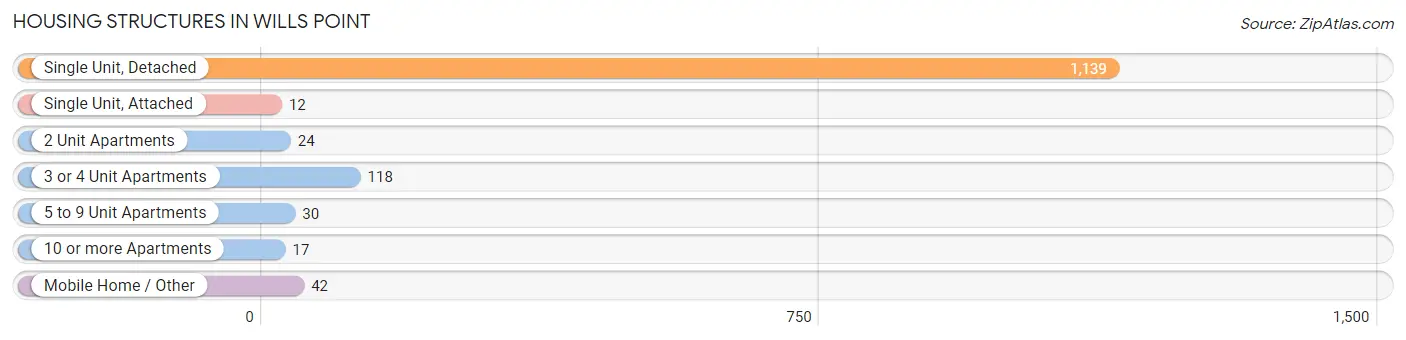
| Structure Type | # Housing Units | % Housing Units |
| Single Unit, Detached | 1,139 | 82.4% |
| Single Unit, Attached | 12 | 0.9% |
| 2 Unit Apartments | 24 | 1.7% |
| 3 or 4 Unit Apartments | 118 | 8.5% |
| 5 to 9 Unit Apartments | 30 | 2.2% |
| 10 or more Apartments | 17 | 1.2% |
| Mobile Home / Other | 42 | 3.0% |
| Total | 1,382 | 100.0% |
Housing Structures by Occupancy in Wills Point
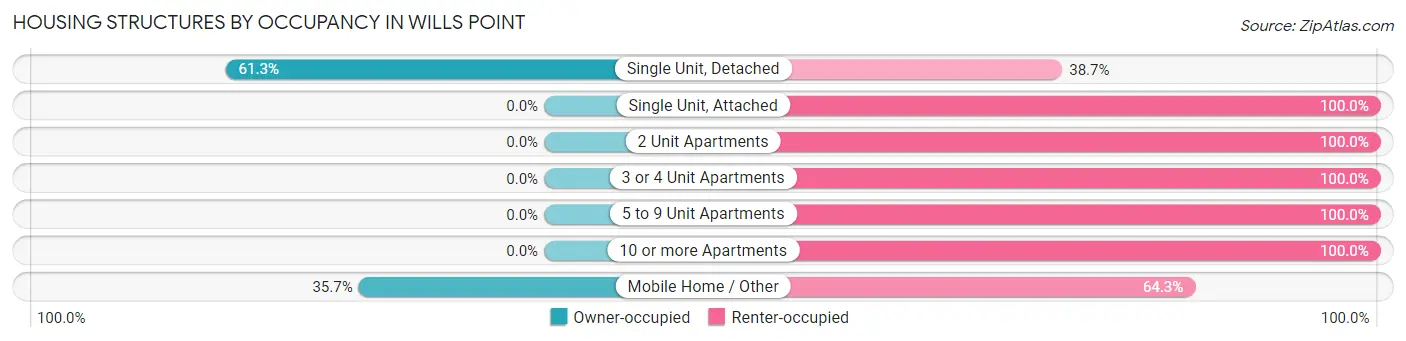
| Structure Type | Owner-occupied | Renter-occupied |
| Single Unit, Detached | 698 (61.3%) | 441 (38.7%) |
| Single Unit, Attached | 0 (0.0%) | 12 (100.0%) |
| 2 Unit Apartments | 0 (0.0%) | 24 (100.0%) |
| 3 or 4 Unit Apartments | 0 (0.0%) | 118 (100.0%) |
| 5 to 9 Unit Apartments | 0 (0.0%) | 30 (100.0%) |
| 10 or more Apartments | 0 (0.0%) | 17 (100.0%) |
| Mobile Home / Other | 15 (35.7%) | 27 (64.3%) |
| Total | 713 (51.6%) | 669 (48.4%) |
Housing Structures by Number of Rooms in Wills Point
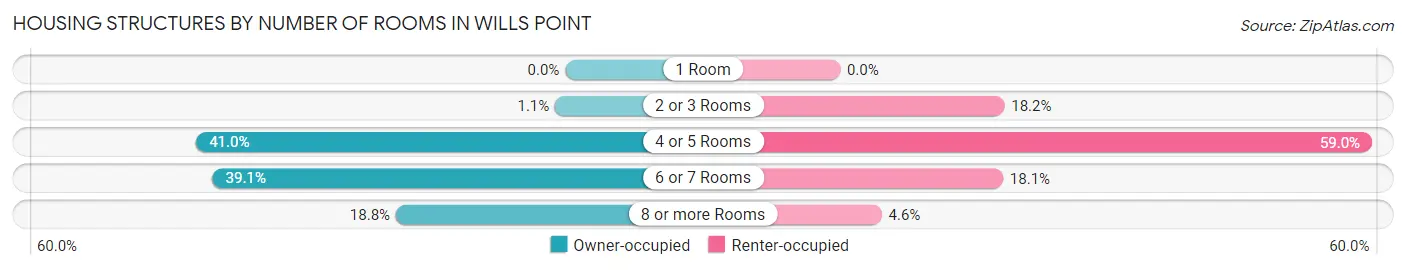
| Number of Rooms | Owner-occupied | Renter-occupied |
| 1 Room | 0 (0.0%) | 0 (0.0%) |
| 2 or 3 Rooms | 8 (1.1%) | 122 (18.2%) |
| 4 or 5 Rooms | 292 (40.9%) | 395 (59.0%) |
| 6 or 7 Rooms | 279 (39.1%) | 121 (18.1%) |
| 8 or more Rooms | 134 (18.8%) | 31 (4.6%) |
| Total | 713 (100.0%) | 669 (100.0%) |
Housing Structure by Heating Type in Wills Point
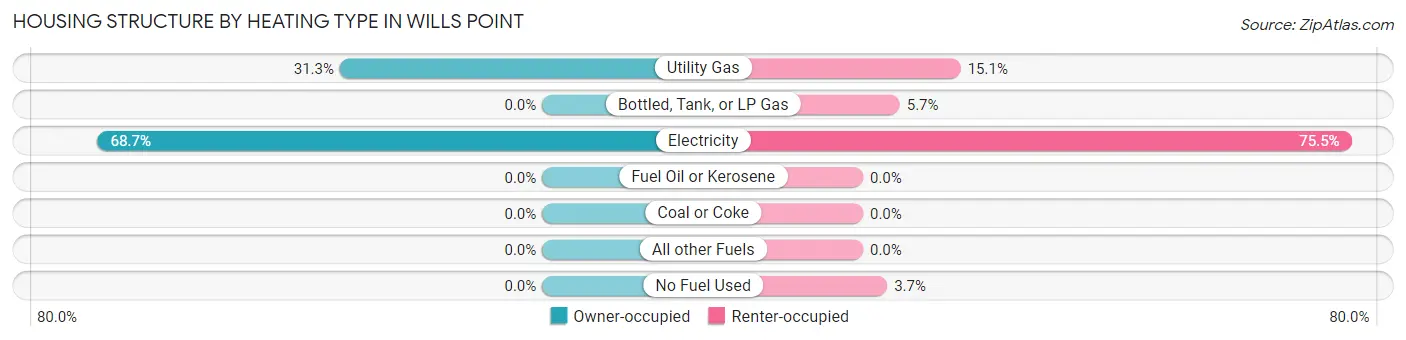
| Heating Type | Owner-occupied | Renter-occupied |
| Utility Gas | 223 (31.3%) | 101 (15.1%) |
| Bottled, Tank, or LP Gas | 0 (0.0%) | 38 (5.7%) |
| Electricity | 490 (68.7%) | 505 (75.5%) |
| Fuel Oil or Kerosene | 0 (0.0%) | 0 (0.0%) |
| Coal or Coke | 0 (0.0%) | 0 (0.0%) |
| All other Fuels | 0 (0.0%) | 0 (0.0%) |
| No Fuel Used | 0 (0.0%) | 25 (3.7%) |
| Total | 713 (100.0%) | 669 (100.0%) |
Household Vehicle Usage in Wills Point
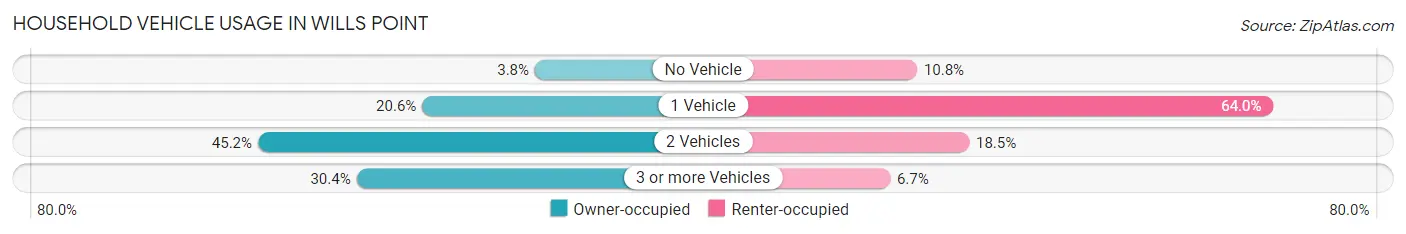
| Vehicles per Household | Owner-occupied | Renter-occupied |
| No Vehicle | 27 (3.8%) | 72 (10.8%) |
| 1 Vehicle | 147 (20.6%) | 428 (64.0%) |
| 2 Vehicles | 322 (45.2%) | 124 (18.5%) |
| 3 or more Vehicles | 217 (30.4%) | 45 (6.7%) |
| Total | 713 (100.0%) | 669 (100.0%) |
Real Estate & Mortgages in Wills Point
Real Estate and Mortgage Overview in Wills Point
| Characteristic | Without Mortgage | With Mortgage |
| Housing Units | 401 | 312 |
| Median Property Value | $99,100 | $165,400 |
| Median Household Income | $71,375 | $34 |
| Monthly Housing Costs | $511 | $0 |
| Real Estate Taxes | $1,694 | $0 |
Property Value by Mortgage Status in Wills Point
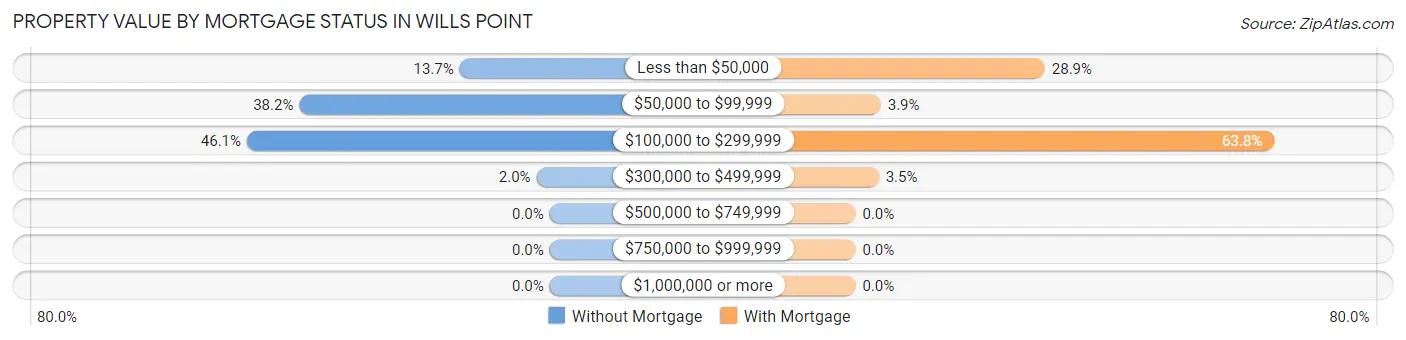
| Property Value | Without Mortgage | With Mortgage |
| Less than $50,000 | 55 (13.7%) | 90 (28.8%) |
| $50,000 to $99,999 | 153 (38.2%) | 12 (3.8%) |
| $100,000 to $299,999 | 185 (46.1%) | 199 (63.8%) |
| $300,000 to $499,999 | 8 (2.0%) | 11 (3.5%) |
| $500,000 to $749,999 | 0 (0.0%) | 0 (0.0%) |
| $750,000 to $999,999 | 0 (0.0%) | 0 (0.0%) |
| $1,000,000 or more | 0 (0.0%) | 0 (0.0%) |
| Total | 401 (100.0%) | 312 (100.0%) |
Household Income by Mortgage Status in Wills Point
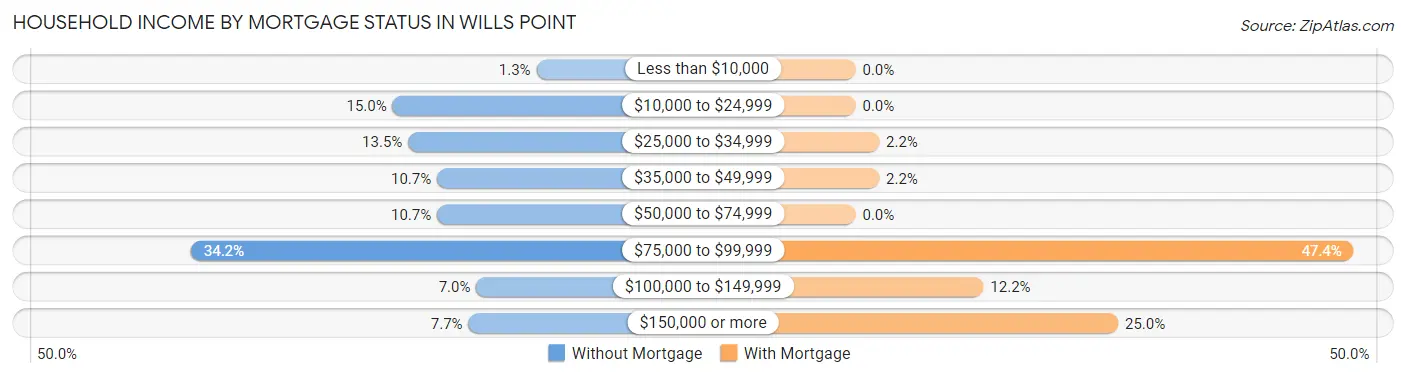
| Household Income | Without Mortgage | With Mortgage |
| Less than $10,000 | 5 (1.3%) | 0 (0.0%) |
| $10,000 to $24,999 | 60 (15.0%) | 0 (0.0%) |
| $25,000 to $34,999 | 54 (13.5%) | 7 (2.2%) |
| $35,000 to $49,999 | 43 (10.7%) | 7 (2.2%) |
| $50,000 to $74,999 | 43 (10.7%) | 0 (0.0%) |
| $75,000 to $99,999 | 137 (34.2%) | 148 (47.4%) |
| $100,000 to $149,999 | 28 (7.0%) | 38 (12.2%) |
| $150,000 or more | 31 (7.7%) | 78 (25.0%) |
| Total | 401 (100.0%) | 312 (100.0%) |
Property Value to Household Income Ratio in Wills Point
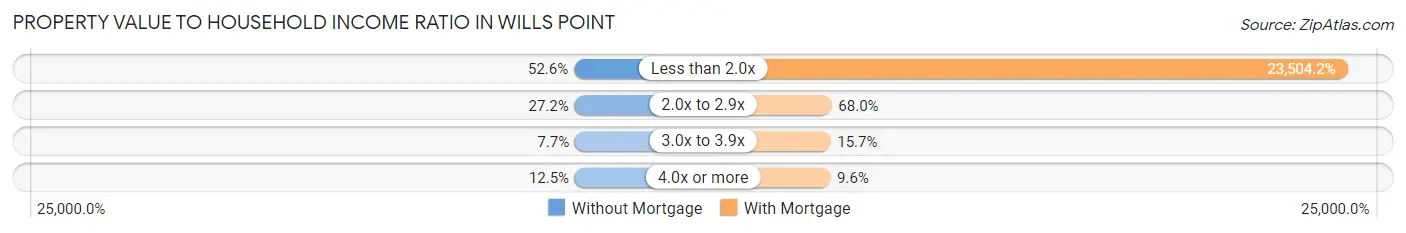
| Value-to-Income Ratio | Without Mortgage | With Mortgage |
| Less than 2.0x | 211 (52.6%) | 73,333 (23,504.2%) |
| 2.0x to 2.9x | 109 (27.2%) | 212 (67.9%) |
| 3.0x to 3.9x | 31 (7.7%) | 49 (15.7%) |
| 4.0x or more | 50 (12.5%) | 30 (9.6%) |
| Total | 401 (100.0%) | 312 (100.0%) |
Real Estate Taxes by Mortgage Status in Wills Point
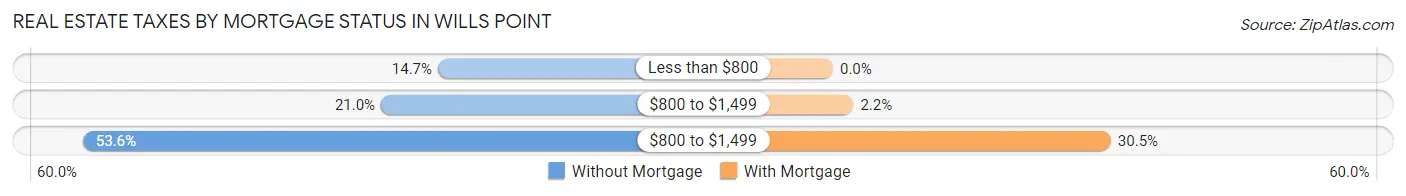
| Property Taxes | Without Mortgage | With Mortgage |
| Less than $800 | 59 (14.7%) | 0 (0.0%) |
| $800 to $1,499 | 84 (20.9%) | 7 (2.2%) |
| $800 to $1,499 | 215 (53.6%) | 95 (30.4%) |
| Total | 401 (100.0%) | 312 (100.0%) |
Health & Disability in Wills Point
Health Insurance Coverage by Age in Wills Point
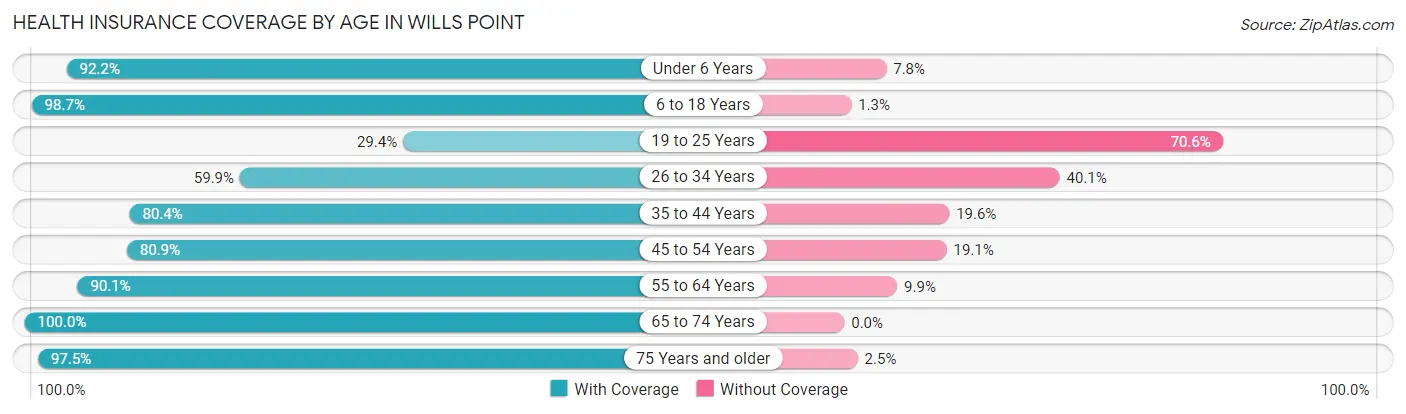
| Age Bracket | With Coverage | Without Coverage |
| Under 6 Years | 412 (92.2%) | 35 (7.8%) |
| 6 to 18 Years | 843 (98.7%) | 11 (1.3%) |
| 19 to 25 Years | 68 (29.4%) | 163 (70.6%) |
| 26 to 34 Years | 261 (59.9%) | 175 (40.1%) |
| 35 to 44 Years | 218 (80.4%) | 53 (19.6%) |
| 45 to 54 Years | 365 (80.9%) | 86 (19.1%) |
| 55 to 64 Years | 466 (90.1%) | 51 (9.9%) |
| 65 to 74 Years | 302 (100.0%) | 0 (0.0%) |
| 75 Years and older | 196 (97.5%) | 5 (2.5%) |
| Total | 3,131 (84.4%) | 579 (15.6%) |
Health Insurance Coverage by Citizenship Status in Wills Point
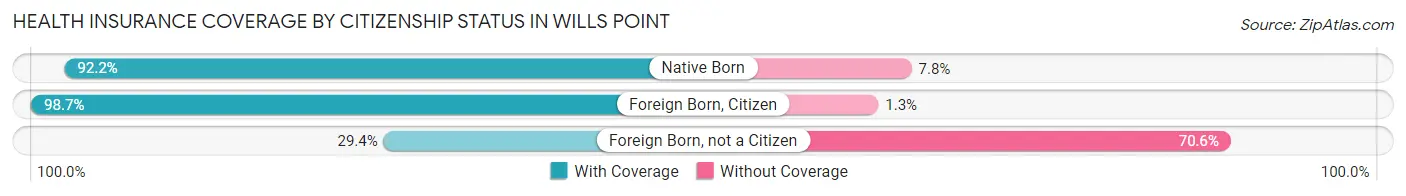
| Citizenship Status | With Coverage | Without Coverage |
| Native Born | 412 (92.2%) | 35 (7.8%) |
| Foreign Born, Citizen | 843 (98.7%) | 11 (1.3%) |
| Foreign Born, not a Citizen | 68 (29.4%) | 163 (70.6%) |
Health Insurance Coverage by Household Income in Wills Point
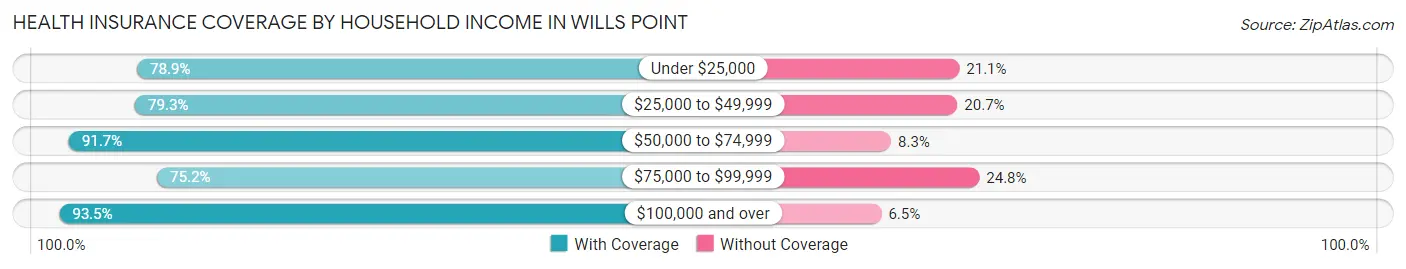
| Household Income | With Coverage | Without Coverage |
| Under $25,000 | 464 (78.9%) | 124 (21.1%) |
| $25,000 to $49,999 | 708 (79.3%) | 185 (20.7%) |
| $50,000 to $74,999 | 619 (91.7%) | 56 (8.3%) |
| $75,000 to $99,999 | 463 (75.2%) | 153 (24.8%) |
| $100,000 and over | 877 (93.5%) | 61 (6.5%) |
Public vs Private Health Insurance Coverage by Age in Wills Point
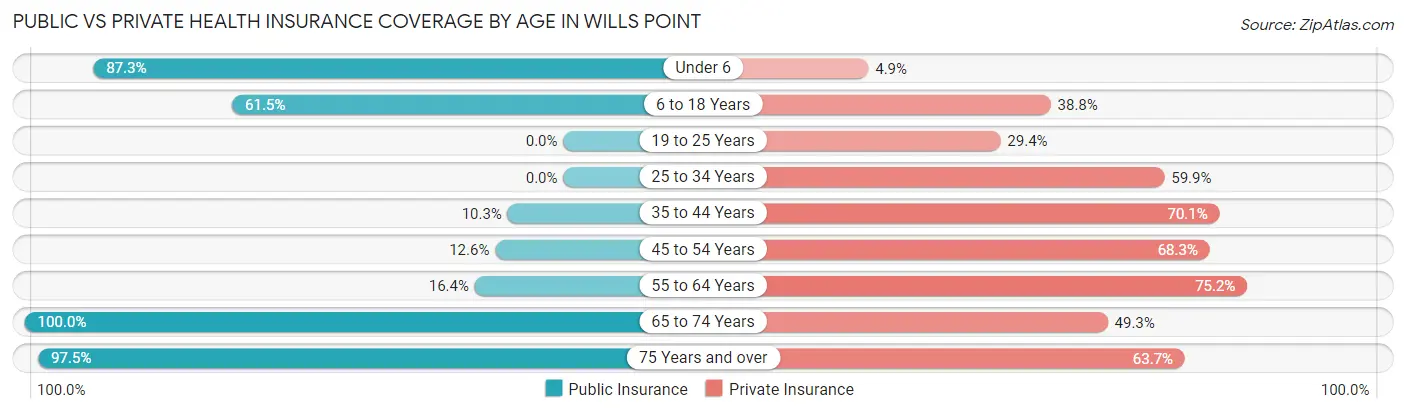
| Age Bracket | Public Insurance | Private Insurance |
| Under 6 | 390 (87.3%) | 22 (4.9%) |
| 6 to 18 Years | 525 (61.5%) | 331 (38.8%) |
| 19 to 25 Years | 0 (0.0%) | 68 (29.4%) |
| 25 to 34 Years | 0 (0.0%) | 261 (59.9%) |
| 35 to 44 Years | 28 (10.3%) | 190 (70.1%) |
| 45 to 54 Years | 57 (12.6%) | 308 (68.3%) |
| 55 to 64 Years | 85 (16.4%) | 389 (75.2%) |
| 65 to 74 Years | 302 (100.0%) | 149 (49.3%) |
| 75 Years and over | 196 (97.5%) | 128 (63.7%) |
| Total | 1,583 (42.7%) | 1,846 (49.8%) |
Disability Status by Sex by Age in Wills Point
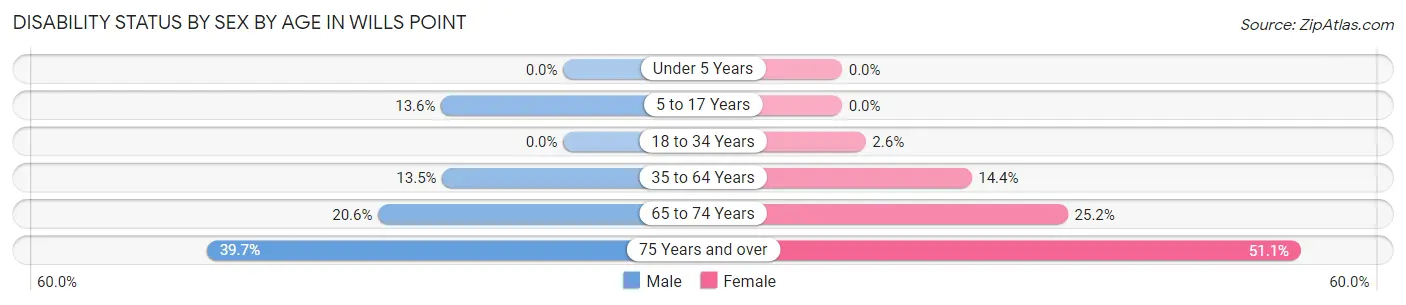
| Age Bracket | Male | Female |
| Under 5 Years | 0 (0.0%) | 0 (0.0%) |
| 5 to 17 Years | 61 (13.6%) | 0 (0.0%) |
| 18 to 34 Years | 0 (0.0%) | 11 (2.6%) |
| 35 to 64 Years | 80 (13.5%) | 93 (14.4%) |
| 65 to 74 Years | 27 (20.6%) | 43 (25.2%) |
| 75 Years and over | 27 (39.7%) | 68 (51.1%) |
Disability Class by Sex by Age in Wills Point
Disability Class: Hearing Difficulty
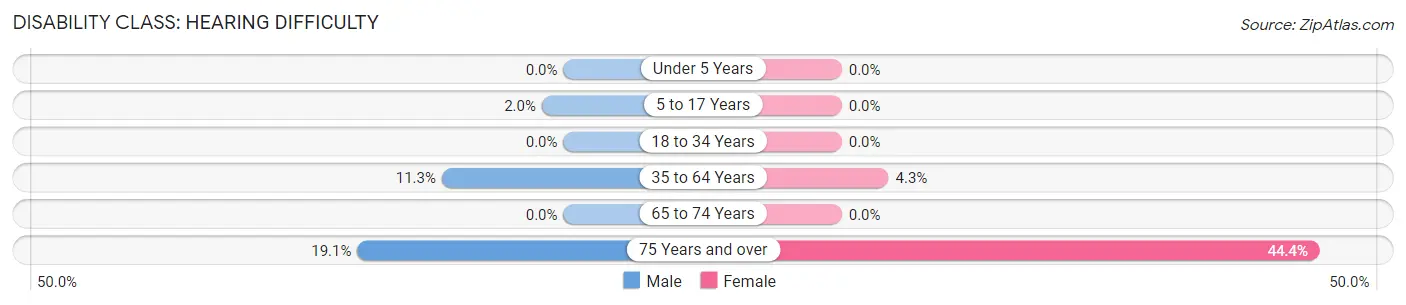
| Age Bracket | Male | Female |
| Under 5 Years | 0 (0.0%) | 0 (0.0%) |
| 5 to 17 Years | 9 (2.0%) | 0 (0.0%) |
| 18 to 34 Years | 0 (0.0%) | 0 (0.0%) |
| 35 to 64 Years | 67 (11.3%) | 28 (4.3%) |
| 65 to 74 Years | 0 (0.0%) | 0 (0.0%) |
| 75 Years and over | 13 (19.1%) | 59 (44.4%) |
Disability Class: Vision Difficulty
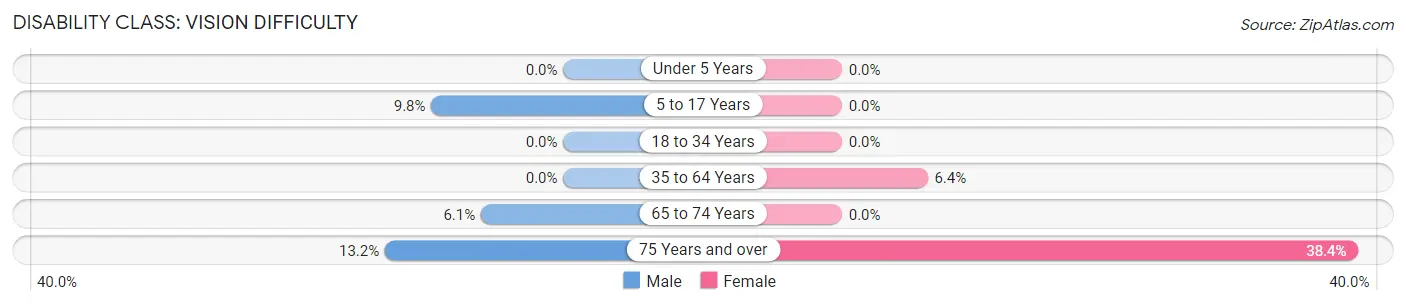
| Age Bracket | Male | Female |
| Under 5 Years | 0 (0.0%) | 0 (0.0%) |
| 5 to 17 Years | 44 (9.8%) | 0 (0.0%) |
| 18 to 34 Years | 0 (0.0%) | 0 (0.0%) |
| 35 to 64 Years | 0 (0.0%) | 41 (6.4%) |
| 65 to 74 Years | 8 (6.1%) | 0 (0.0%) |
| 75 Years and over | 9 (13.2%) | 51 (38.4%) |
Disability Class: Cognitive Difficulty
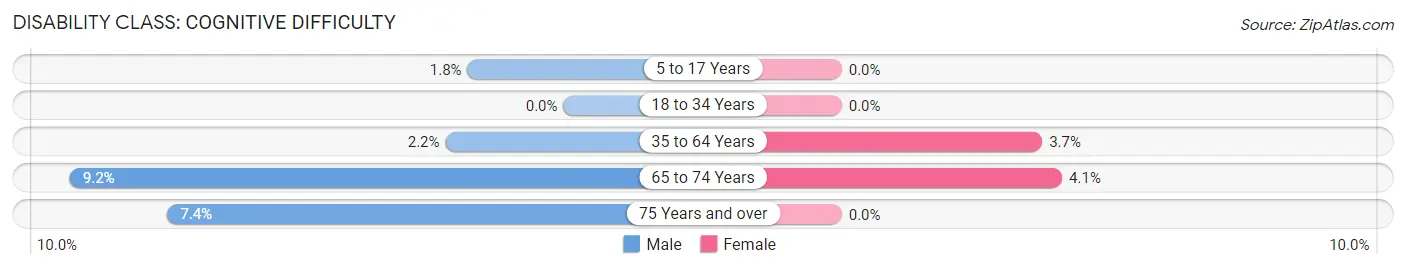
| Age Bracket | Male | Female |
| 5 to 17 Years | 8 (1.8%) | 0 (0.0%) |
| 18 to 34 Years | 0 (0.0%) | 0 (0.0%) |
| 35 to 64 Years | 13 (2.2%) | 24 (3.7%) |
| 65 to 74 Years | 12 (9.2%) | 7 (4.1%) |
| 75 Years and over | 5 (7.3%) | 0 (0.0%) |
Disability Class: Ambulatory Difficulty
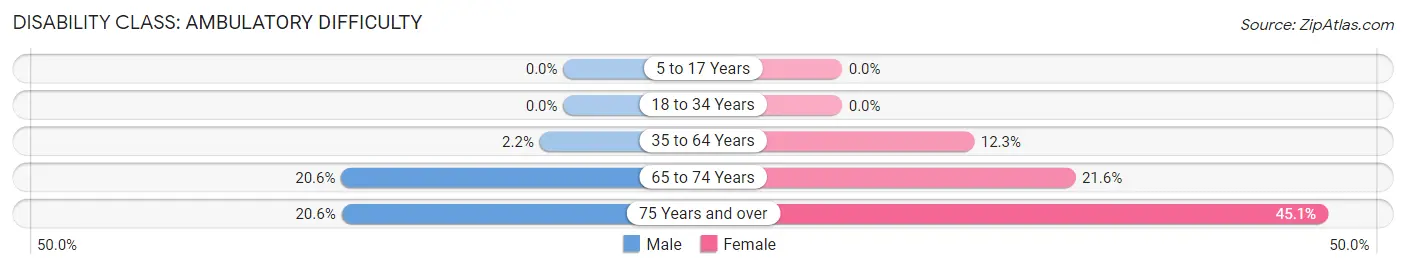
| Age Bracket | Male | Female |
| 5 to 17 Years | 0 (0.0%) | 0 (0.0%) |
| 18 to 34 Years | 0 (0.0%) | 0 (0.0%) |
| 35 to 64 Years | 13 (2.2%) | 79 (12.2%) |
| 65 to 74 Years | 27 (20.6%) | 37 (21.6%) |
| 75 Years and over | 14 (20.6%) | 60 (45.1%) |
Disability Class: Self-Care Difficulty
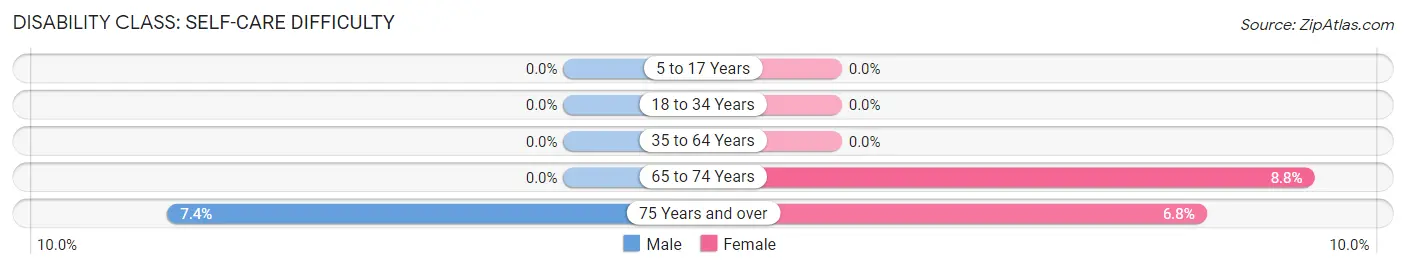
| Age Bracket | Male | Female |
| 5 to 17 Years | 0 (0.0%) | 0 (0.0%) |
| 18 to 34 Years | 0 (0.0%) | 0 (0.0%) |
| 35 to 64 Years | 0 (0.0%) | 0 (0.0%) |
| 65 to 74 Years | 0 (0.0%) | 15 (8.8%) |
| 75 Years and over | 5 (7.3%) | 9 (6.8%) |
Technology Access in Wills Point
Computing Device Access in Wills Point
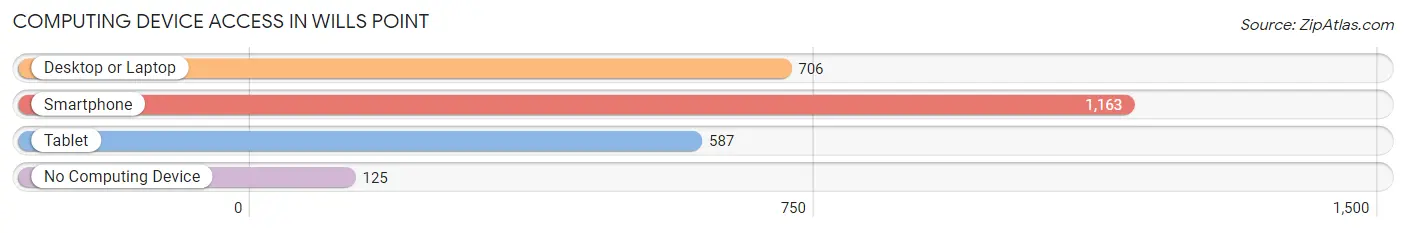
| Device Type | # Households | % Households |
| Desktop or Laptop | 706 | 51.1% |
| Smartphone | 1,163 | 84.2% |
| Tablet | 587 | 42.5% |
| No Computing Device | 125 | 9.0% |
| Total | 1,382 | 100.0% |
Internet Access in Wills Point
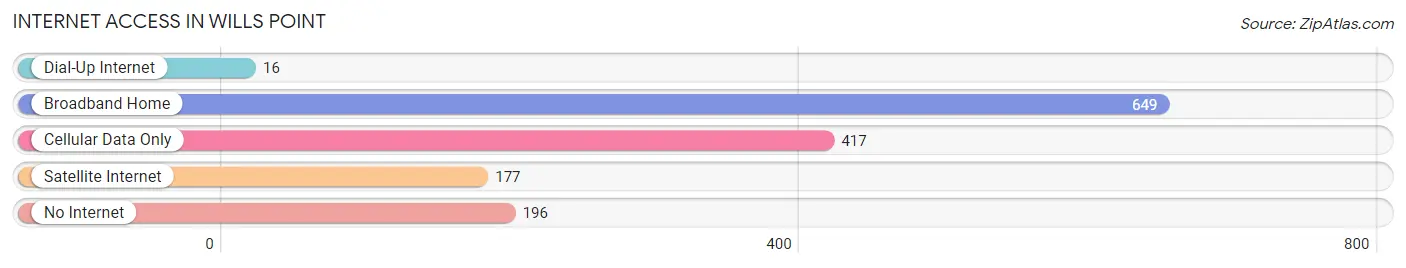
| Internet Type | # Households | % Households |
| Dial-Up Internet | 16 | 1.2% |
| Broadband Home | 649 | 47.0% |
| Cellular Data Only | 417 | 30.2% |
| Satellite Internet | 177 | 12.8% |
| No Internet | 196 | 14.2% |
| Total | 1,382 | 100.0% |
Wills Point Summary
Wills Point is a city located in Van Zandt County, Texas, United States. The population was 3,496 at the 2010 census. It is located approximately 50 miles east of Dallas and is part of the Dallas–Fort Worth metroplex.
History
The area that is now Wills Point was first settled in the 1840s by the Wills family, who were among the earliest settlers in the area. The town was named after William Wills, who established a trading post in the area in 1873. The town was officially incorporated in 1874.
In the late 19th century, Wills Point was a major stop on the Texas and Pacific Railway. The railroad brought new settlers to the area, and the town grew rapidly. By the early 20th century, Wills Point had become a major center for cotton production and was home to several cotton gins.
Geography
Wills Point is located at 32°56'25" North, 96°14'45" West (32.940278, -96.245833). According to the United States Census Bureau, the city has a total area of 4.2 square miles, all of it land.
Economy
Wills Point is a small rural community with a diverse economy. The city is home to several small businesses, including a variety of retail stores, restaurants, and service providers. The city is also home to several manufacturing and industrial businesses, including a large poultry processing plant.
The city is also home to several agricultural businesses, including several large farms and ranches. The city is also home to several wineries and vineyards, as well as a large number of nurseries and greenhouses.
Demographics
As of the census of 2000, there were 3,496 people, 1,323 households, and 945 families residing in the city. The population density was 837.2 people per square mile (323.7/km2). There were 1,521 housing units at an average density of 363.3 per square mile (140.5/km2). The racial makeup of the city was 79.17% White, 15.90% African American, 0.60% Native American, 0.17% Asian, 0.03% Pacific Islander, 2.83% from other races, and 1.31% from two or more races. Hispanic or Latino of any race were 5.90% of the population.
There were 1,323 households, out of which 33.2% had children under the age of 18 living with them, 53.2% were married couples living together, 13.2% had a female householder with no husband present, and 29.2% were non-families. 25.2% of all households were made up of individuals, and 13.2% had someone living alone who was 65 years of age or older. The average household size was 2.60 and the average family size was 3.12.
In the city, the population was spread out, with 27.2% under the age of 18, 8.2% from 18 to 24, 26.2% from 25 to 44, 22.2% from 45 to 64, and 16.2% who were 65 years of age or older. The median age was 37 years. For every 100 females, there were 91.2 males. For every 100 females age 18 and over, there were 86.2 males.
The median income for a household in the city was $30,938, and the median income for a family was $36,964. Males had a median income of $30,000 versus $20,938 for females. The per capita income for the city was $15,845. About 11.2% of families and 14.2% of the population were below the poverty line, including 17.2% of those under age 18 and 14.2% of those age 65 or over.
Common Questions
What is Per Capita Income in Wills Point?
Per Capita income in Wills Point is $23,175.
What is the Median Family Income in Wills Point?
Median Family Income in Wills Point is $57,000.
What is the Median Household income in Wills Point?
Median Household Income in Wills Point is $55,100.
What is Income or Wage Gap in Wills Point?
Income or Wage Gap in Wills Point is 35.2%.
Women in Wills Point earn 64.8 cents for every dollar earned by a man.
What is Inequality or Gini Index in Wills Point?
Inequality or Gini Index in Wills Point is 0.41.
What is the Total Population of Wills Point?
Total Population of Wills Point is 3,786.
What is the Total Male Population of Wills Point?
Total Male Population of Wills Point is 1,845.
What is the Total Female Population of Wills Point?
Total Female Population of Wills Point is 1,941.
What is the Ratio of Males per 100 Females in Wills Point?
There are 95.05 Males per 100 Females in Wills Point.
What is the Ratio of Females per 100 Males in Wills Point?
There are 105.20 Females per 100 Males in Wills Point.
What is the Median Population Age in Wills Point?
Median Population Age in Wills Point is 33.8 Years.
What is the Average Family Size in Wills Point
Average Family Size in Wills Point is 3.2 People.
What is the Average Household Size in Wills Point
Average Household Size in Wills Point is 2.7 People.
How Large is the Labor Force in Wills Point?
There are 1,720 People in the Labor Forcein in Wills Point.
What is the Percentage of People in the Labor Force in Wills Point?
60.6% of People are in the Labor Force in Wills Point.
What is the Unemployment Rate in Wills Point?
Unemployment Rate in Wills Point is 1.9%.