Willis, TX Map & Demographics
Willis Map
Willis Overview
$22,060
PER CAPITA INCOME
$65,565
AVG FAMILY INCOME
$55,876
AVG HOUSEHOLD INCOME
31.5%
WAGE / INCOME GAP [ % ]
68.5¢/ $1
WAGE / INCOME GAP [ $ ]
0.35
INEQUALITY / GINI INDEX
6,561
TOTAL POPULATION
3,645
MALE POPULATION
2,916
FEMALE POPULATION
125.00
MALES / 100 FEMALES
80.00
FEMALES / 100 MALES
39.5
MEDIAN AGE
3.4
AVG FAMILY SIZE
2.8
AVG HOUSEHOLD SIZE
3,389
LABOR FORCE [ PEOPLE ]
63.7%
PERCENT IN LABOR FORCE
8.5%
UNEMPLOYMENT RATE
Willis Area Codes
Income in Willis
Income Overview in Willis
Per Capita Income in Willis is $22,060, while median incomes of families and households are $65,565 and $55,876 respectively.
| Characteristic | Number | Measure |
| Per Capita Income | 6,561 | $22,060 |
| Median Family Income | 1,672 | $65,565 |
| Mean Family Income | 1,672 | $65,725 |
| Median Household Income | 2,351 | $55,876 |
| Mean Household Income | 2,351 | $59,111 |
| Income Deficit | 1,672 | $0 |
| Wage / Income Gap (%) | 6,561 | 31.48% |
| Wage / Income Gap ($) | 6,561 | 68.52¢ per $1 |
| Gini / Inequality Index | 6,561 | 0.35 |
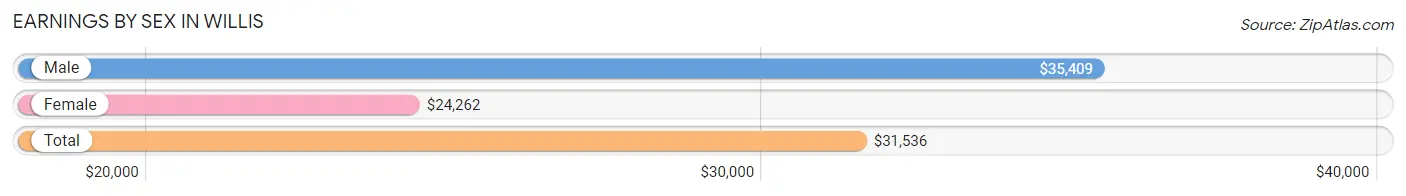
Earnings by Sex in Willis
Average Earnings in Willis are $31,536, $35,409 for men and $24,262 for women, a difference of 31.5%.
| Sex | Number | Average Earnings |
| Male | 2,160 (67.1%) | $35,409 |
| Female | 1,057 (32.9%) | $24,262 |
| Total | 3,217 (100.0%) | $31,536 |
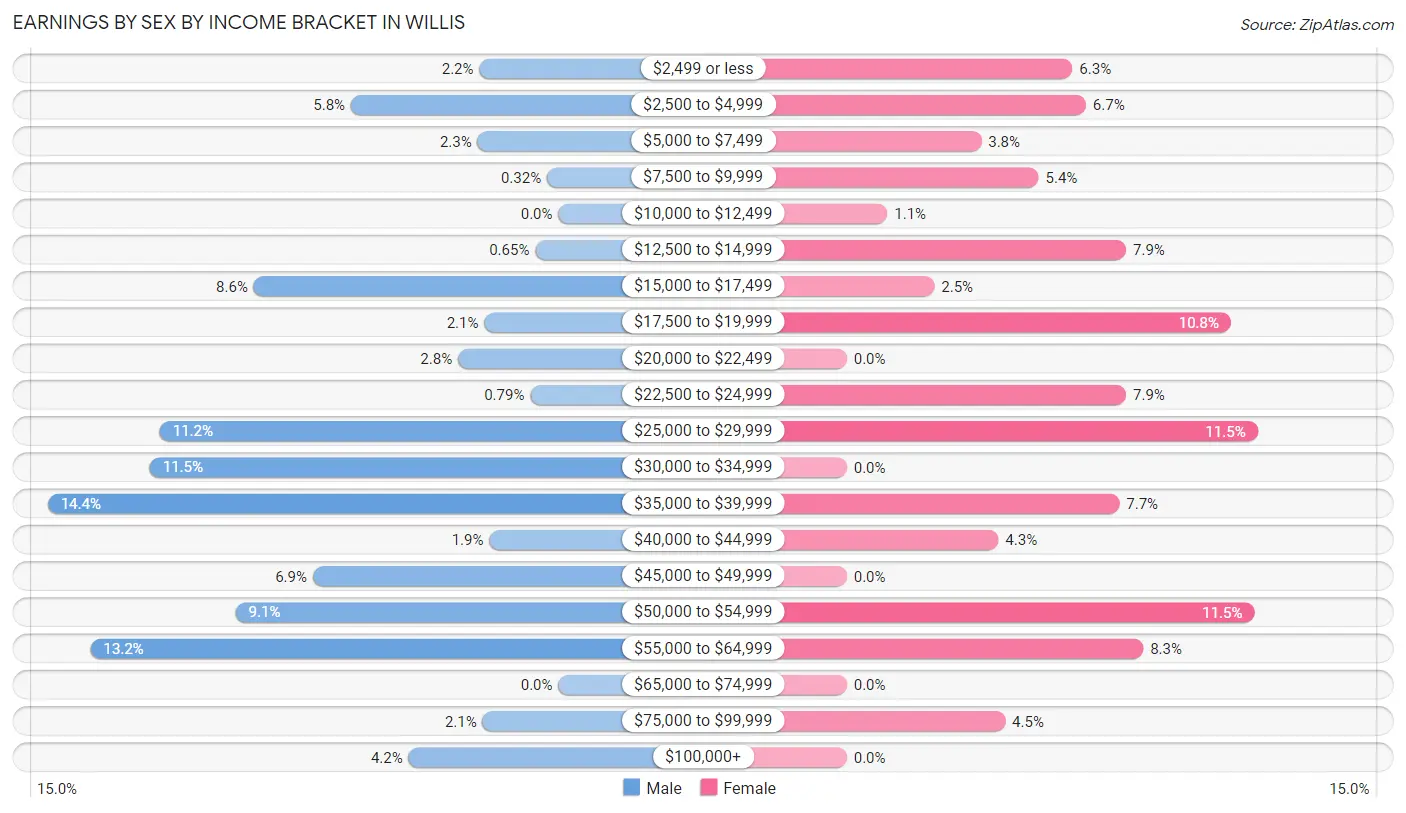
Earnings by Sex by Income Bracket in Willis
The most common earnings brackets in Willis are $35,000 to $39,999 for men (310 | 14.3%) and $25,000 to $29,999 for women (122 | 11.5%).
| Income | Male | Female |
| $2,499 or less | 48 (2.2%) | 67 (6.3%) |
| $2,500 to $4,999 | 126 (5.8%) | 71 (6.7%) |
| $5,000 to $7,499 | 49 (2.3%) | 40 (3.8%) |
| $7,500 to $9,999 | 7 (0.3%) | 57 (5.4%) |
| $10,000 to $12,499 | 0 (0.0%) | 12 (1.1%) |
| $12,500 to $14,999 | 14 (0.6%) | 83 (7.9%) |
| $15,000 to $17,499 | 185 (8.6%) | 26 (2.5%) |
| $17,500 to $19,999 | 45 (2.1%) | 114 (10.8%) |
| $20,000 to $22,499 | 61 (2.8%) | 0 (0.0%) |
| $22,500 to $24,999 | 17 (0.8%) | 83 (7.9%) |
| $25,000 to $29,999 | 242 (11.2%) | 122 (11.5%) |
| $30,000 to $34,999 | 248 (11.5%) | 0 (0.0%) |
| $35,000 to $39,999 | 310 (14.3%) | 81 (7.7%) |
| $40,000 to $44,999 | 42 (1.9%) | 45 (4.3%) |
| $45,000 to $49,999 | 149 (6.9%) | 0 (0.0%) |
| $50,000 to $54,999 | 196 (9.1%) | 121 (11.5%) |
| $55,000 to $64,999 | 284 (13.2%) | 88 (8.3%) |
| $65,000 to $74,999 | 0 (0.0%) | 0 (0.0%) |
| $75,000 to $99,999 | 46 (2.1%) | 47 (4.4%) |
| $100,000+ | 91 (4.2%) | 0 (0.0%) |
| Total | 2,160 (100.0%) | 1,057 (100.0%) |
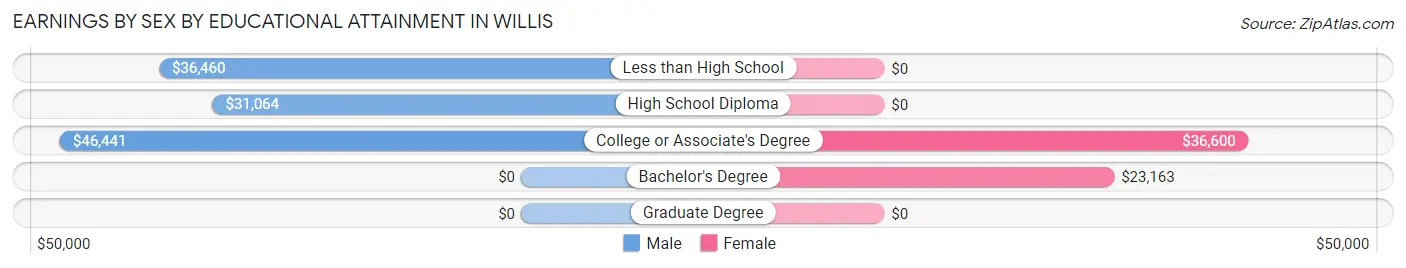
Earnings by Sex by Educational Attainment in Willis
Average earnings in Willis are $37,392 for men and $28,403 for women, a difference of 24.0%. Men with an educational attainment of college or associate's degree enjoy the highest average annual earnings of $46,441, while those with high school diploma education earn the least with $31,064. Women with an educational attainment of college or associate's degree earn the most with the average annual earnings of $36,600, while those with bachelor's degree education have the smallest earnings of $23,163.
| Educational Attainment | Male Income | Female Income |
| Less than High School | $36,460 | $0 |
| High School Diploma | $31,064 | $0 |
| College or Associate's Degree | $46,441 | $36,600 |
| Bachelor's Degree | - | - |
| Graduate Degree | - | - |
| Total | $37,392 | $28,403 |
Family Income in Willis
Family Income Brackets in Willis
According to the Willis family income data, there are 563 families falling into the $50,000 to $74,999 income range, which is the most common income bracket and makes up 33.7% of all families.
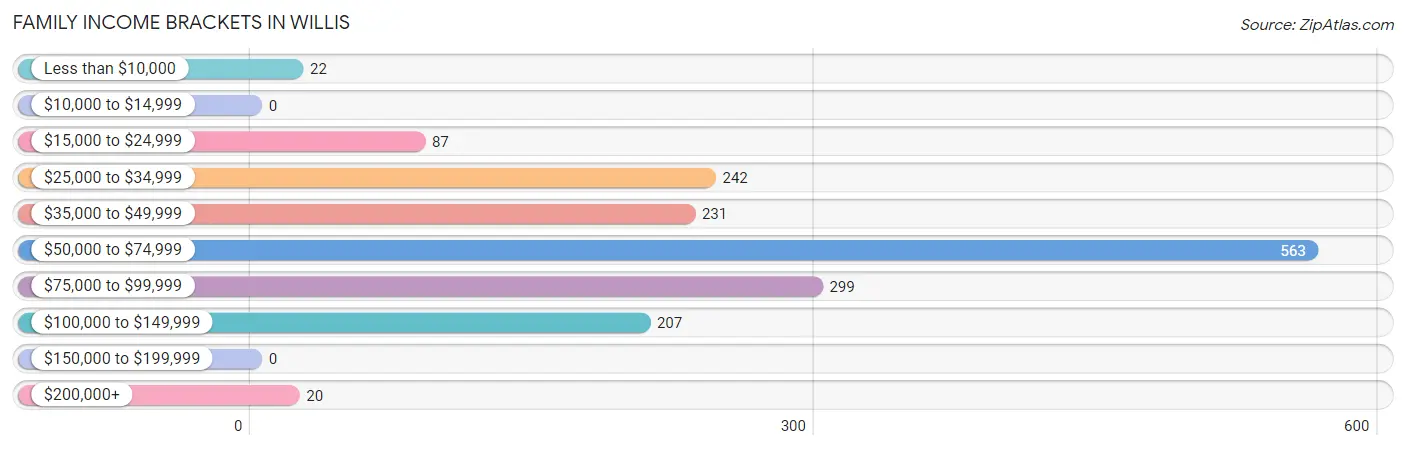
| Income Bracket | # Families | % Families |
| Less than $10,000 | 22 | 1.3% |
| $10,000 to $14,999 | 0 | 0.0% |
| $15,000 to $24,999 | 87 | 5.2% |
| $25,000 to $34,999 | 242 | 14.5% |
| $35,000 to $49,999 | 231 | 13.8% |
| $50,000 to $74,999 | 563 | 33.7% |
| $75,000 to $99,999 | 299 | 17.9% |
| $100,000 to $149,999 | 207 | 12.4% |
| $150,000 to $199,999 | 0 | 0.0% |
| $200,000+ | 20 | 1.2% |
Family Income by Famaliy Size in Willis
3-person families (235 | 14.1%) account for the highest median family income in Willis with $78,264 per family, while 2-person families (848 | 50.7%) have the highest median income of $32,631 per family member.
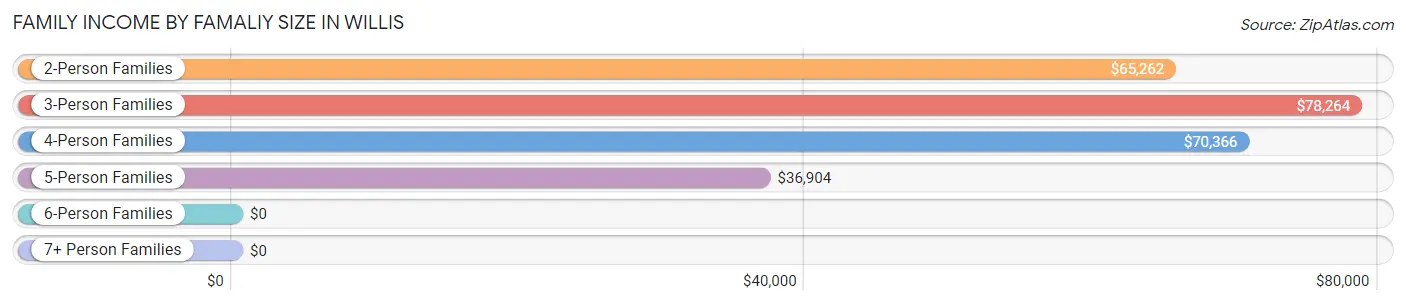
| Income Bracket | # Families | Median Income |
| 2-Person Families | 848 (50.7%) | $65,262 |
| 3-Person Families | 235 (14.1%) | $78,264 |
| 4-Person Families | 245 (14.6%) | $70,366 |
| 5-Person Families | 230 (13.8%) | $36,904 |
| 6-Person Families | 55 (3.3%) | $0 |
| 7+ Person Families | 59 (3.5%) | $0 |
| Total | 1,672 (100.0%) | $65,565 |
Family Income by Number of Earners in Willis
The median family income in Willis is $65,565, with families comprising 3+ earners (185) having the highest median family income of $127,568, while families with no earners (192) have the lowest median family income of $33,588, accounting for 11.1% and 11.5% of families, respectively.
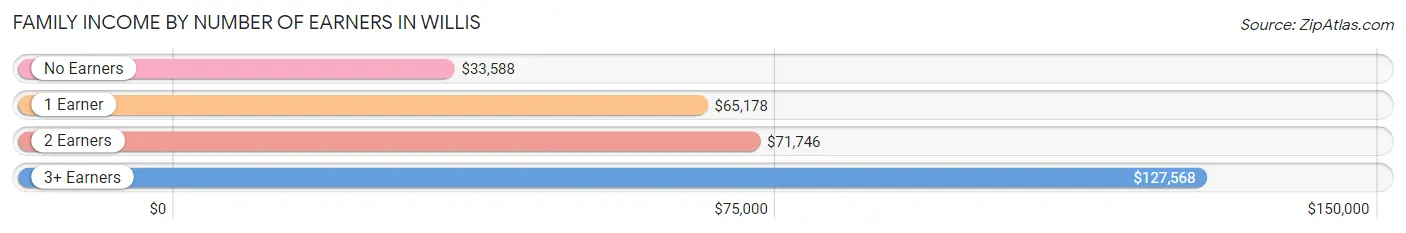
| Number of Earners | # Families | Median Income |
| No Earners | 192 (11.5%) | $33,588 |
| 1 Earner | 820 (49.0%) | $65,178 |
| 2 Earners | 475 (28.4%) | $71,746 |
| 3+ Earners | 185 (11.1%) | $127,568 |
| Total | 1,672 (100.0%) | $65,565 |
Household Income in Willis
Household Income Brackets in Willis
With 637 households falling in the category, the $50,000 to $74,999 income range is the most frequent in Willis, accounting for 27.1% of all households. In contrast, only 21 households (0.9%) fall into the $200,000+ income bracket, making it the least populous group.
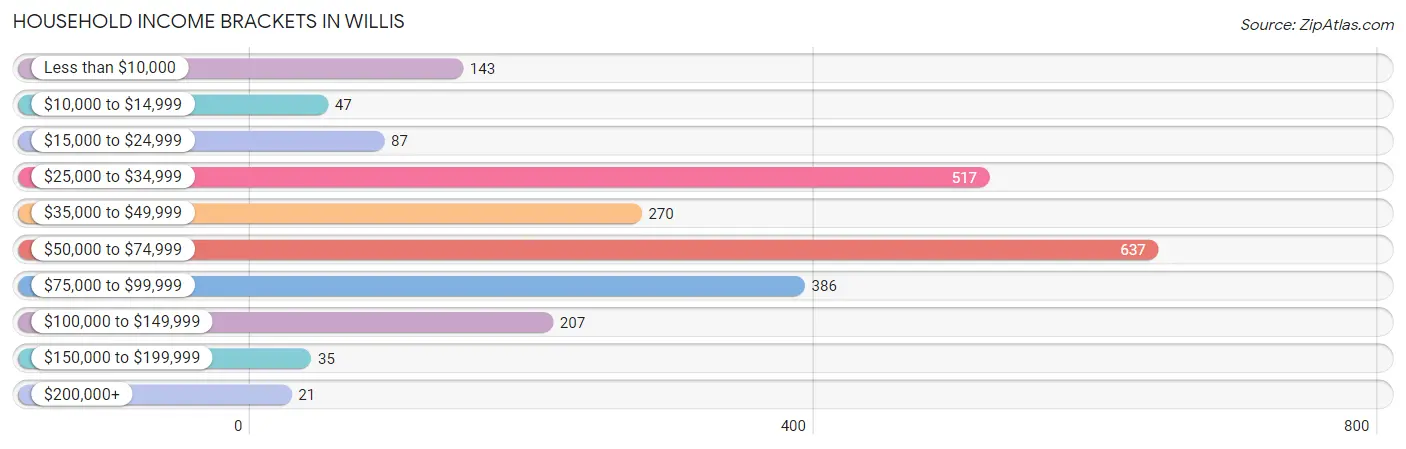
| Income Bracket | # Households | % Households |
| Less than $10,000 | 143 | 6.1% |
| $10,000 to $14,999 | 47 | 2.0% |
| $15,000 to $24,999 | 87 | 3.7% |
| $25,000 to $34,999 | 517 | 22.0% |
| $35,000 to $49,999 | 270 | 11.5% |
| $50,000 to $74,999 | 637 | 27.1% |
| $75,000 to $99,999 | 386 | 16.4% |
| $100,000 to $149,999 | 207 | 8.8% |
| $150,000 to $199,999 | 35 | 1.5% |
| $200,000+ | 21 | 0.9% |
Household Income by Householder Age in Willis
The median household income in Willis is $55,876, with the highest median household income of $65,664 found in the 65+ years age bracket for the primary householder. A total of 801 households (34.1%) fall into this category. Meanwhile, the 15 to 24 years age bracket for the primary householder has the lowest median household income of $0, with 65 households (2.8%) in this group.
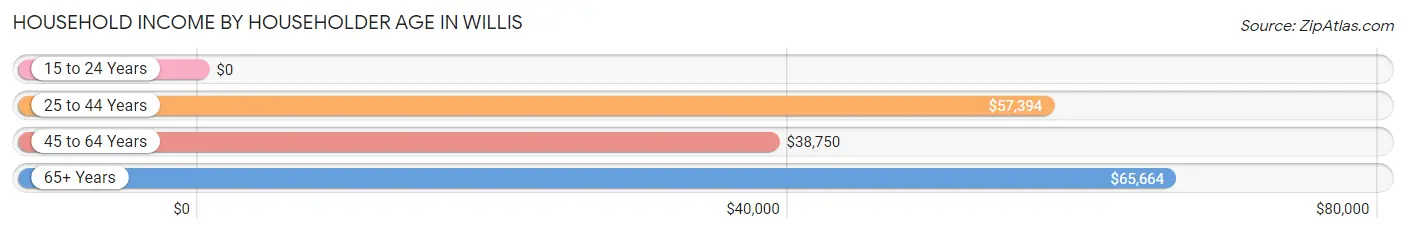
| Income Bracket | # Households | Median Income |
| 15 to 24 Years | 65 (2.8%) | $0 |
| 25 to 44 Years | 716 (30.5%) | $57,394 |
| 45 to 64 Years | 769 (32.7%) | $38,750 |
| 65+ Years | 801 (34.1%) | $65,664 |
| Total | 2,351 (100.0%) | $55,876 |
Poverty in Willis
Income Below Poverty by Sex and Age in Willis
With 5.9% poverty level for males and 9.5% for females among the residents of Willis, 12 to 14 year old males and 45 to 54 year old females are the most vulnerable to poverty, with 29 males (100.0%) and 74 females (27.9%) in their respective age groups living below the poverty level.
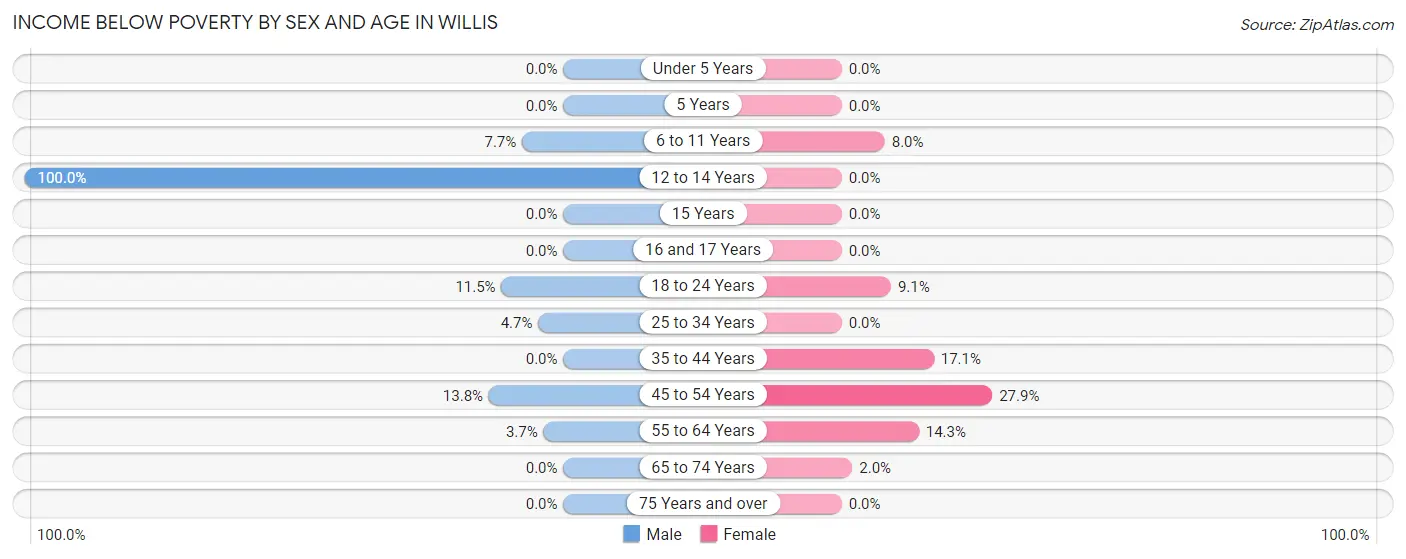
| Age Bracket | Male | Female |
| Under 5 Years | 0 (0.0%) | 0 (0.0%) |
| 5 Years | 0 (0.0%) | 0 (0.0%) |
| 6 to 11 Years | 20 (7.7%) | 21 (8.0%) |
| 12 to 14 Years | 29 (100.0%) | 0 (0.0%) |
| 15 Years | 0 (0.0%) | 0 (0.0%) |
| 16 and 17 Years | 0 (0.0%) | 0 (0.0%) |
| 18 to 24 Years | 57 (11.5%) | 22 (9.1%) |
| 25 to 34 Years | 24 (4.6%) | 0 (0.0%) |
| 35 to 44 Years | 0 (0.0%) | 90 (17.1%) |
| 45 to 54 Years | 60 (13.8%) | 74 (27.9%) |
| 55 to 64 Years | 22 (3.7%) | 58 (14.3%) |
| 65 to 74 Years | 0 (0.0%) | 10 (2.0%) |
| 75 Years and over | 0 (0.0%) | 0 (0.0%) |
| Total | 212 (5.9%) | 275 (9.5%) |
Income Above Poverty by Sex and Age in Willis
According to the poverty statistics in Willis, males aged under 5 years and females aged under 5 years are the age groups that are most secure financially, with 100.0% of males and 100.0% of females in these age groups living above the poverty line.
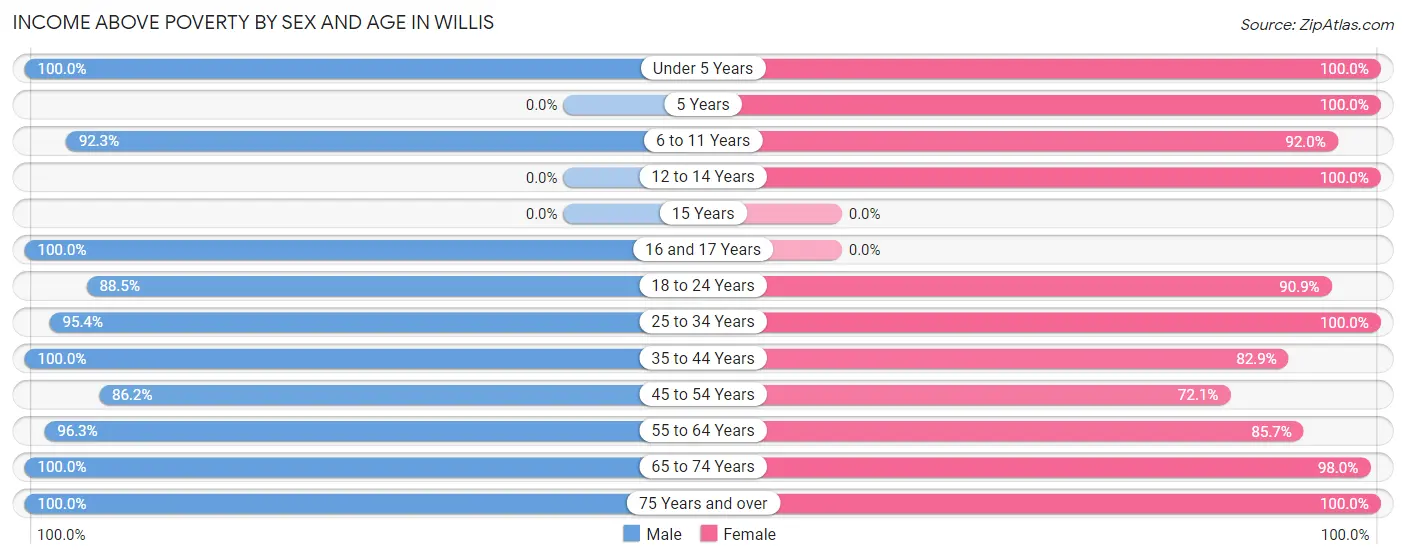
| Age Bracket | Male | Female |
| Under 5 Years | 303 (100.0%) | 79 (100.0%) |
| 5 Years | 0 (0.0%) | 34 (100.0%) |
| 6 to 11 Years | 241 (92.3%) | 242 (92.0%) |
| 12 to 14 Years | 0 (0.0%) | 272 (100.0%) |
| 15 Years | 0 (0.0%) | 0 (0.0%) |
| 16 and 17 Years | 62 (100.0%) | 0 (0.0%) |
| 18 to 24 Years | 439 (88.5%) | 219 (90.9%) |
| 25 to 34 Years | 492 (95.4%) | 246 (100.0%) |
| 35 to 44 Years | 542 (100.0%) | 437 (82.9%) |
| 45 to 54 Years | 374 (86.2%) | 191 (72.1%) |
| 55 to 64 Years | 577 (96.3%) | 348 (85.7%) |
| 65 to 74 Years | 223 (100.0%) | 500 (98.0%) |
| 75 Years and over | 127 (100.0%) | 48 (100.0%) |
| Total | 3,380 (94.1%) | 2,616 (90.5%) |
Income Below Poverty Among Married-Couple Families in Willis
The poverty statistics for married-couple families in Willis show that 1.7% or 22 of the total 1,313 families live below the poverty line. Families with no children have the highest poverty rate of 2.6%, comprising of 22 families. On the other hand, families with 1 or 2 children have the lowest poverty rate of 0.0%, which includes 0 families.
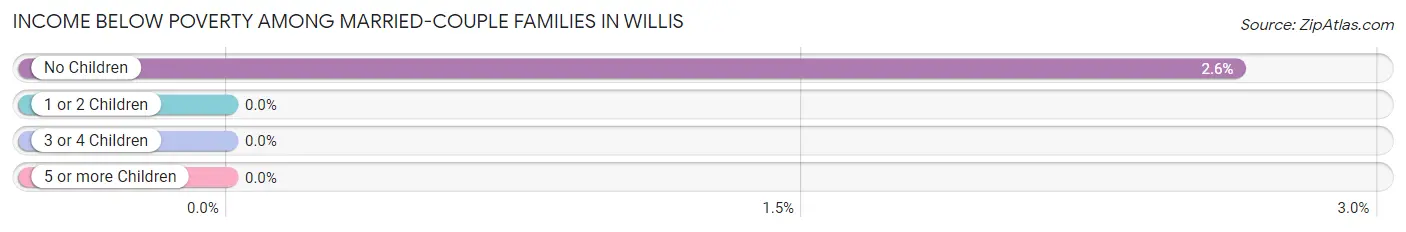
| Children | Above Poverty | Below Poverty |
| No Children | 813 (97.4%) | 22 (2.6%) |
| 1 or 2 Children | 241 (100.0%) | 0 (0.0%) |
| 3 or 4 Children | 237 (100.0%) | 0 (0.0%) |
| 5 or more Children | 0 (0.0%) | 0 (0.0%) |
| Total | 1,291 (98.3%) | 22 (1.7%) |
Income Below Poverty Among Single-Parent Households in Willis
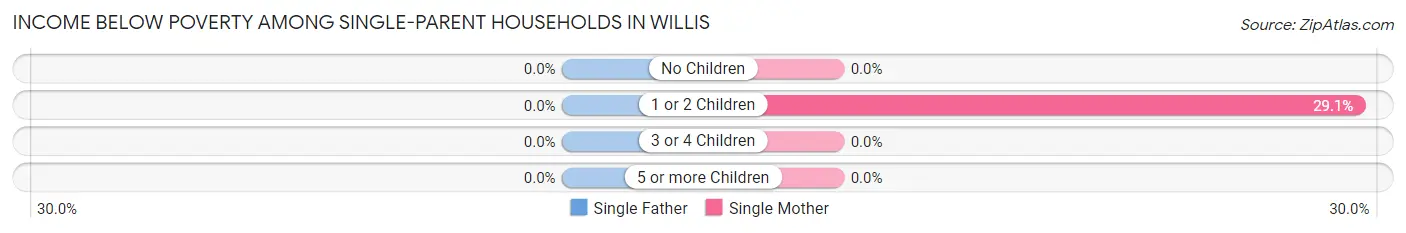
| Children | Single Father | Single Mother |
| No Children | 0 (0.0%) | 0 (0.0%) |
| 1 or 2 Children | 0 (0.0%) | 44 (29.1%) |
| 3 or 4 Children | 0 (0.0%) | 0 (0.0%) |
| 5 or more Children | 0 (0.0%) | 0 (0.0%) |
| Total | 0 (0.0%) | 44 (18.6%) |
Income Below Poverty Among Married-Couple vs Single-Parent Households in Willis
The poverty data for Willis shows that 22 of the married-couple family households (1.7%) and 44 of the single-parent households (12.3%) are living below the poverty level. Within the married-couple family households, those with no children have the highest poverty rate, with 22 households (2.6%) falling below the poverty line. Among the single-parent households, those with 1 or 2 children have the highest poverty rate, with 44 household (29.1%) living below poverty.
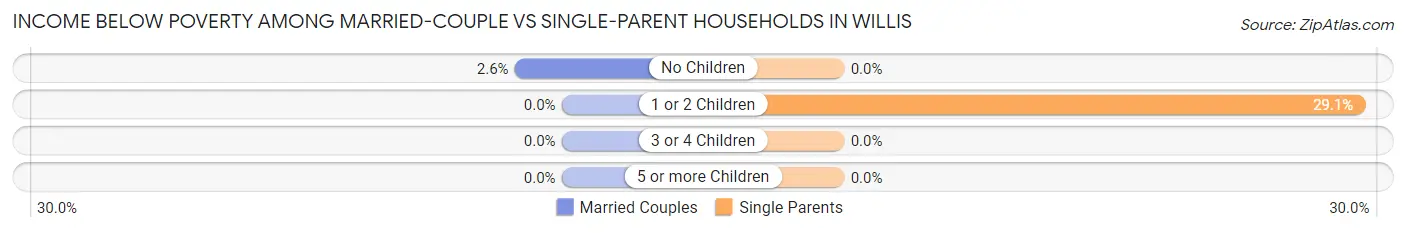
| Children | Married-Couple Families | Single-Parent Households |
| No Children | 22 (2.6%) | 0 (0.0%) |
| 1 or 2 Children | 0 (0.0%) | 44 (29.1%) |
| 3 or 4 Children | 0 (0.0%) | 0 (0.0%) |
| 5 or more Children | 0 (0.0%) | 0 (0.0%) |
| Total | 22 (1.7%) | 44 (12.3%) |
Race in Willis
The most populous races in Willis are White / Caucasian (4,456 | 67.9%), Hispanic or Latino (3,119 | 47.5%), and Two or more Races (1,374 | 20.9%).
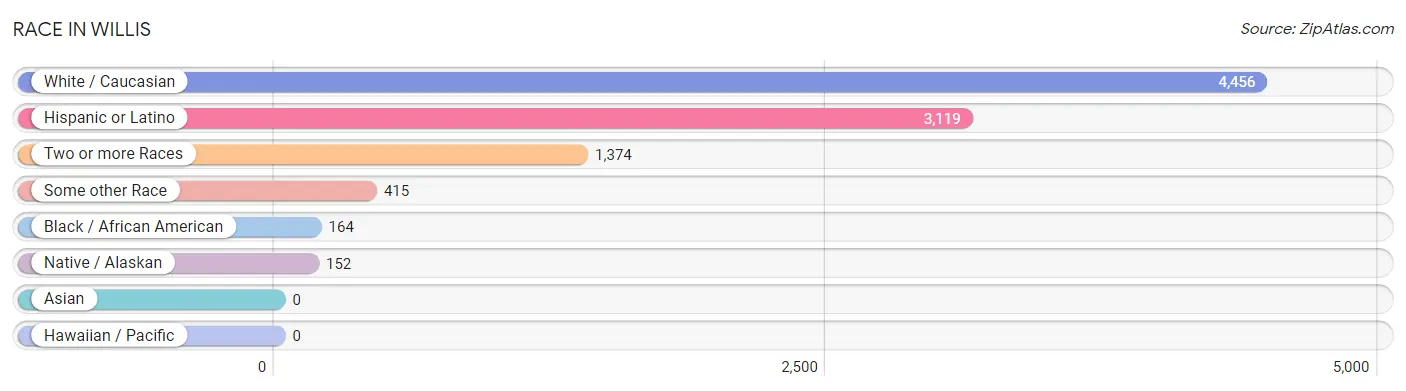
| Race | # Population | % Population |
| Asian | 0 | 0.0% |
| Black / African American | 164 | 2.5% |
| Hawaiian / Pacific | 0 | 0.0% |
| Hispanic or Latino | 3,119 | 47.5% |
| Native / Alaskan | 152 | 2.3% |
| White / Caucasian | 4,456 | 67.9% |
| Two or more Races | 1,374 | 20.9% |
| Some other Race | 415 | 6.3% |
| Total | 6,561 | 100.0% |
Ancestry in Willis
The most populous ancestries reported in Willis are Mexican (2,328 | 35.5%), English (745 | 11.4%), German (728 | 11.1%), Irish (480 | 7.3%), and Polish (407 | 6.2%), together accounting for 71.5% of all Willis residents.
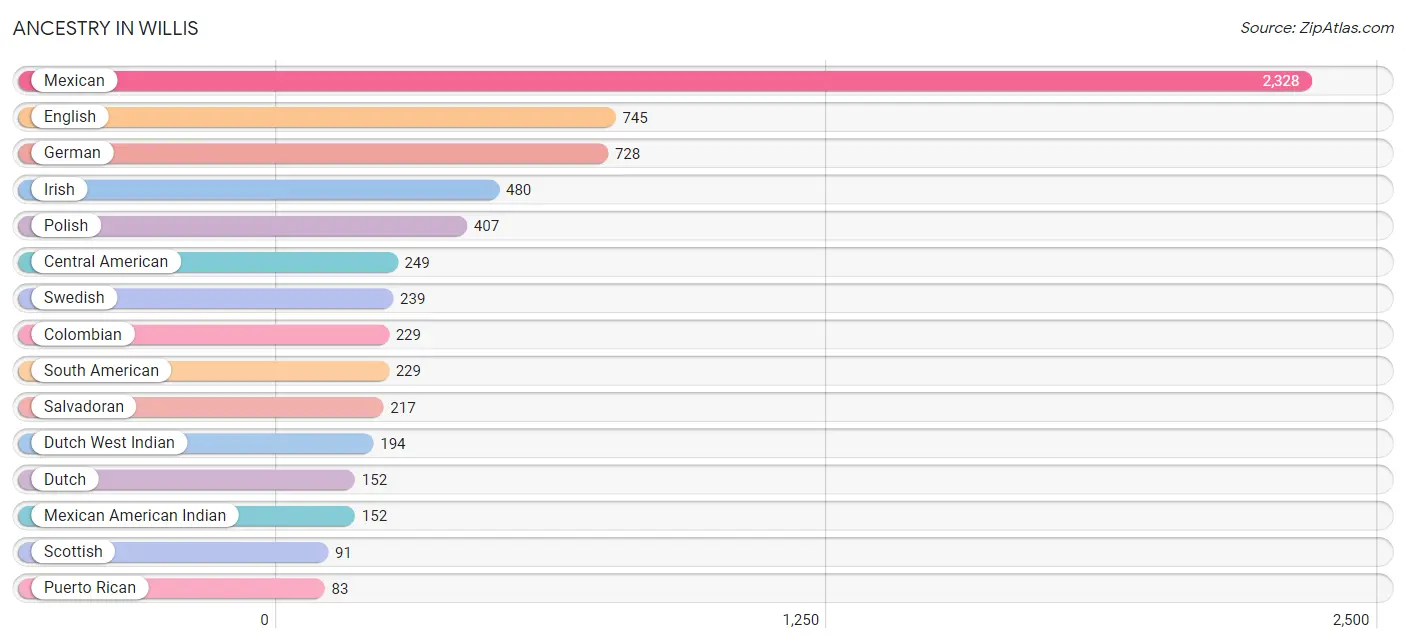
| Ancestry | # Population | % Population |
| American | 73 | 1.1% |
| Celtic | 36 | 0.5% |
| Central American | 249 | 3.8% |
| Cherokee | 10 | 0.2% |
| Colombian | 229 | 3.5% |
| Czech | 15 | 0.2% |
| Dutch | 152 | 2.3% |
| Dutch West Indian | 194 | 3.0% |
| English | 745 | 11.4% |
| European | 17 | 0.3% |
| French | 42 | 0.6% |
| German | 728 | 11.1% |
| Honduran | 32 | 0.5% |
| Irish | 480 | 7.3% |
| Italian | 49 | 0.7% |
| Mexican | 2,328 | 35.5% |
| Mexican American Indian | 152 | 2.3% |
| Norwegian | 64 | 1.0% |
| Polish | 407 | 6.2% |
| Puerto Rican | 83 | 1.3% |
| Salvadoran | 217 | 3.3% |
| Scottish | 91 | 1.4% |
| South American | 229 | 3.5% |
| Spanish | 20 | 0.3% |
| Swedish | 239 | 3.6% |
| Swiss | 21 | 0.3% | View All 26 Rows |
Immigrants in Willis
The most numerous immigrant groups reported in Willis came from Latin America (1,181 | 18.0%), Central America (1,142 | 17.4%), Mexico (893 | 13.6%), El Salvador (217 | 3.3%), and Colombia (39 | 0.6%), together accounting for 52.9% of all Willis residents.
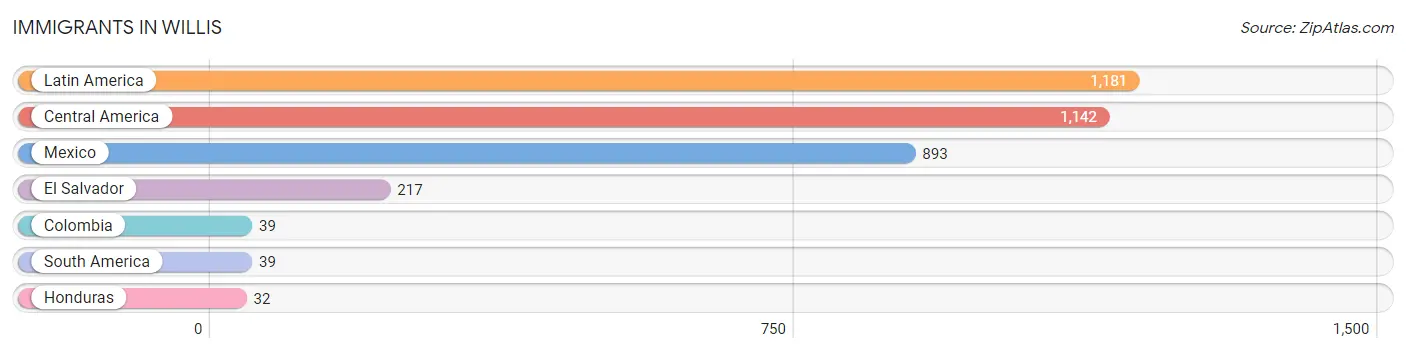
| Immigration Origin | # Population | % Population |
| Central America | 1,142 | 17.4% |
| Colombia | 39 | 0.6% |
| El Salvador | 217 | 3.3% |
| Honduras | 32 | 0.5% |
| Latin America | 1,181 | 18.0% |
| Mexico | 893 | 13.6% |
| South America | 39 | 0.6% | View All 7 Rows |
Sex and Age in Willis
Sex and Age in Willis
The most populous age groups in Willis are 60 to 64 Years (498 | 13.7%) for men and 65 to 69 Years (432 | 14.8%) for women.
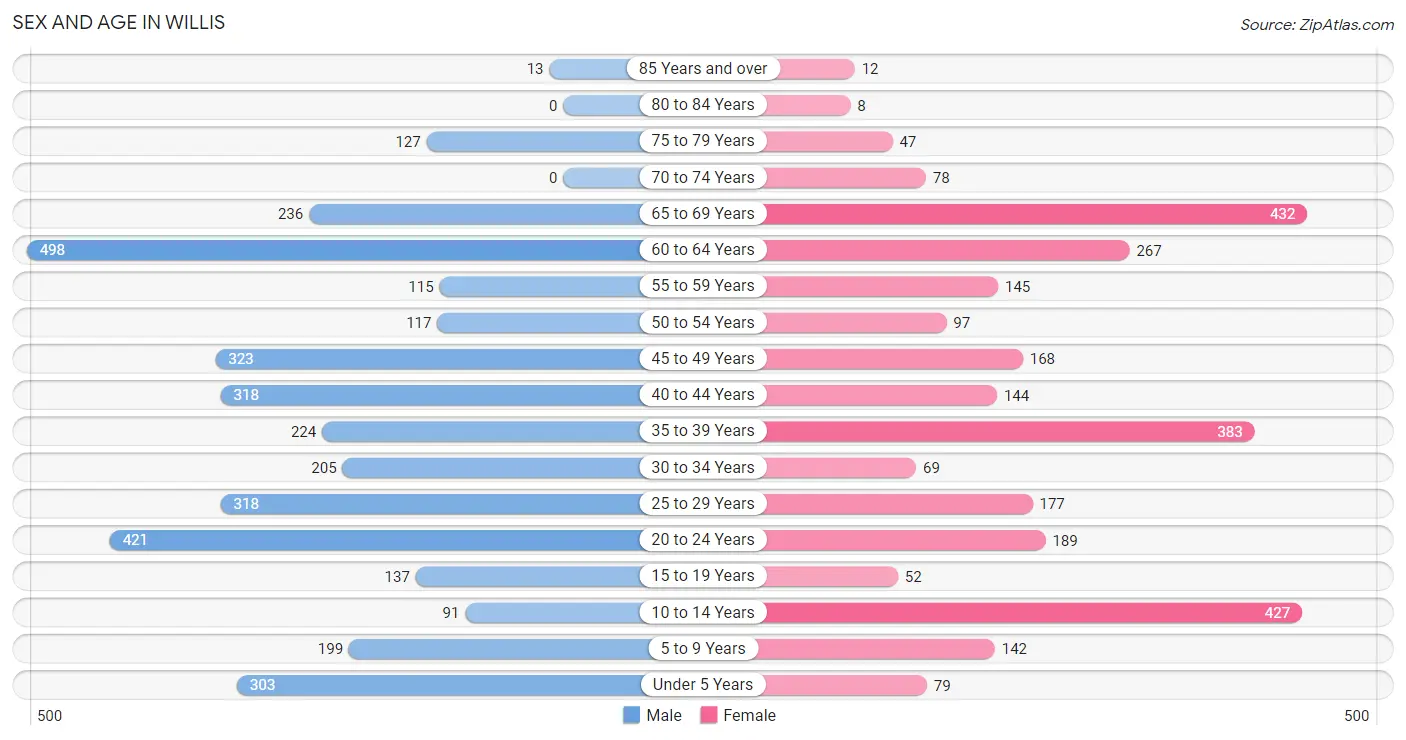
| Age Bracket | Male | Female |
| Under 5 Years | 303 (8.3%) | 79 (2.7%) |
| 5 to 9 Years | 199 (5.5%) | 142 (4.9%) |
| 10 to 14 Years | 91 (2.5%) | 427 (14.6%) |
| 15 to 19 Years | 137 (3.8%) | 52 (1.8%) |
| 20 to 24 Years | 421 (11.6%) | 189 (6.5%) |
| 25 to 29 Years | 318 (8.7%) | 177 (6.1%) |
| 30 to 34 Years | 205 (5.6%) | 69 (2.4%) |
| 35 to 39 Years | 224 (6.1%) | 383 (13.1%) |
| 40 to 44 Years | 318 (8.7%) | 144 (4.9%) |
| 45 to 49 Years | 323 (8.9%) | 168 (5.8%) |
| 50 to 54 Years | 117 (3.2%) | 97 (3.3%) |
| 55 to 59 Years | 115 (3.2%) | 145 (5.0%) |
| 60 to 64 Years | 498 (13.7%) | 267 (9.2%) |
| 65 to 69 Years | 236 (6.5%) | 432 (14.8%) |
| 70 to 74 Years | 0 (0.0%) | 78 (2.7%) |
| 75 to 79 Years | 127 (3.5%) | 47 (1.6%) |
| 80 to 84 Years | 0 (0.0%) | 8 (0.3%) |
| 85 Years and over | 13 (0.4%) | 12 (0.4%) |
| Total | 3,645 (100.0%) | 2,916 (100.0%) |
Families and Households in Willis
Median Family Size in Willis
The median family size in Willis is 3.38 persons per family, with married-couple families (1,313 | 78.5%) accounting for the largest median family size of 3.54 persons per family. On the other hand, single male/father families (123 | 7.4%) represent the smallest median family size with 2.38 persons per family.
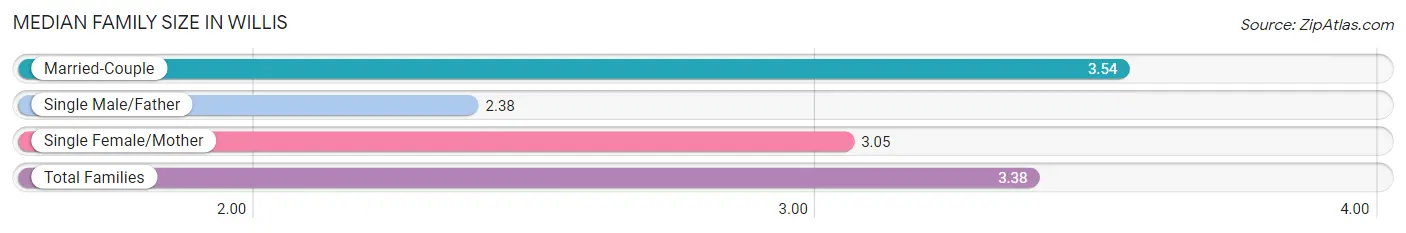
| Family Type | # Families | Family Size |
| Married-Couple | 1,313 (78.5%) | 3.54 |
| Single Male/Father | 123 (7.4%) | 2.38 |
| Single Female/Mother | 236 (14.1%) | 3.05 |
| Total Families | 1,672 (100.0%) | 3.38 |
Median Household Size in Willis
The median household size in Willis is 2.76 persons per household, with married-couple households (1,313 | 55.8%) accounting for the largest median household size of 3.54 persons per household. non-family households (679 | 28.9%) represent the smallest median household size with 1.19 persons per household.
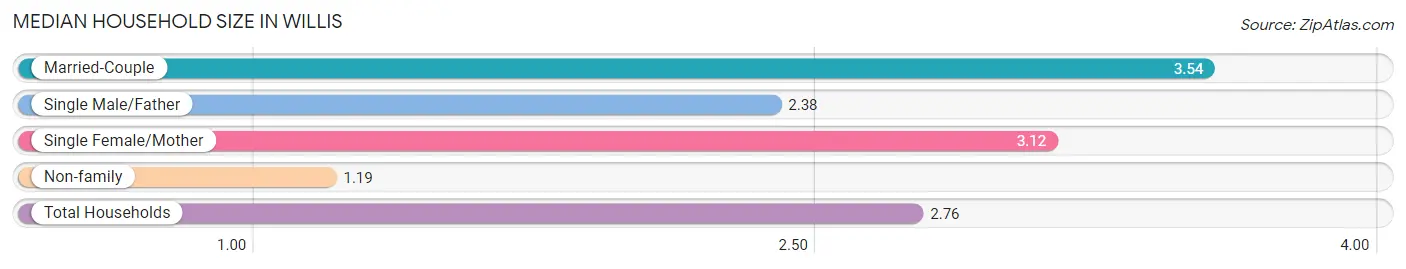
| Household Type | # Households | Household Size |
| Married-Couple | 1,313 (55.8%) | 3.54 |
| Single Male/Father | 123 (5.2%) | 2.38 |
| Single Female/Mother | 236 (10.0%) | 3.12 |
| Non-family | 679 (28.9%) | 1.19 |
| Total Households | 2,351 (100.0%) | 2.76 |
Household Size by Marriage Status in Willis
Out of a total of 2,351 households in Willis, 1,672 (71.1%) are family households, while 679 (28.9%) are nonfamily households. The most numerous type of family households are 2-person households, comprising 848, and the most common type of nonfamily households are 1-person households, comprising 600.
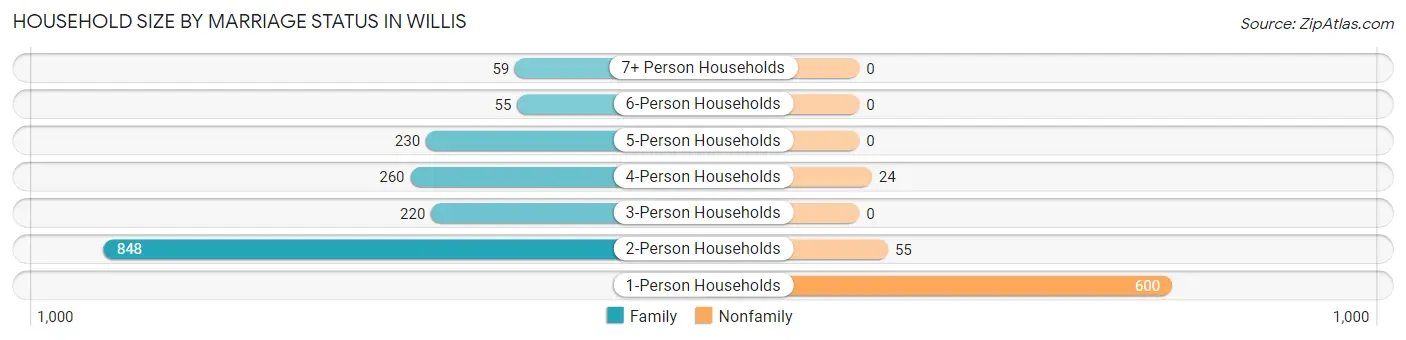
| Household Size | Family Households | Nonfamily Households |
| 1-Person Households | - | 600 (25.5%) |
| 2-Person Households | 848 (36.1%) | 55 (2.3%) |
| 3-Person Households | 220 (9.4%) | 0 (0.0%) |
| 4-Person Households | 260 (11.1%) | 24 (1.0%) |
| 5-Person Households | 230 (9.8%) | 0 (0.0%) |
| 6-Person Households | 55 (2.3%) | 0 (0.0%) |
| 7+ Person Households | 59 (2.5%) | 0 (0.0%) |
| Total | 1,672 (71.1%) | 679 (28.9%) |
Female Fertility in Willis
Fertility by Age in Willis
Average fertility rate in Willis is 122.0 births per 1,000 women. Women in the age bracket of 35 to 50 years have the highest fertility rate with 201.0 births per 1,000 women. Women in the age bracket of 35 to 50 years acount for 100.0% of all women with births.
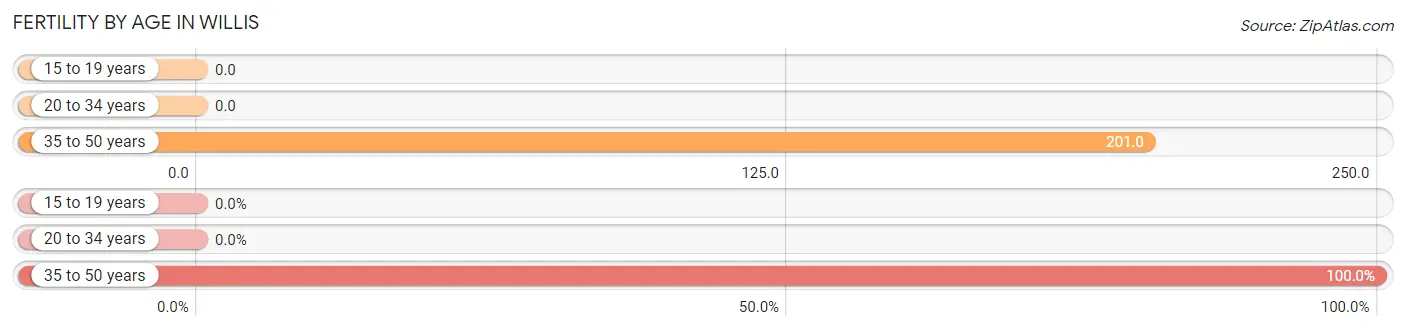
| Age Bracket | Women with Births | Births / 1,000 Women |
| 15 to 19 years | 0 (0.0%) | 0.0 |
| 20 to 34 years | 0 (0.0%) | 0.0 |
| 35 to 50 years | 151 (100.0%) | 201.0 |
| Total | 151 (100.0%) | 122.0 |
Fertility by Age by Marriage Status in Willis
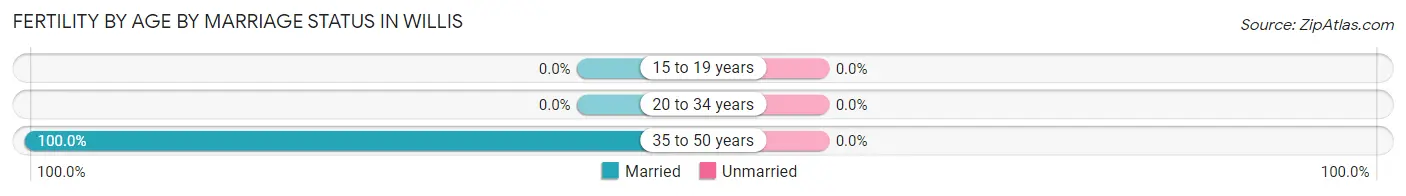
| Age Bracket | Married | Unmarried |
| 15 to 19 years | 0 (0.0%) | 0 (0.0%) |
| 20 to 34 years | 0 (0.0%) | 0 (0.0%) |
| 35 to 50 years | 151 (100.0%) | 0 (0.0%) |
| Total | 151 (100.0%) | 0 (0.0%) |
Fertility by Education in Willis
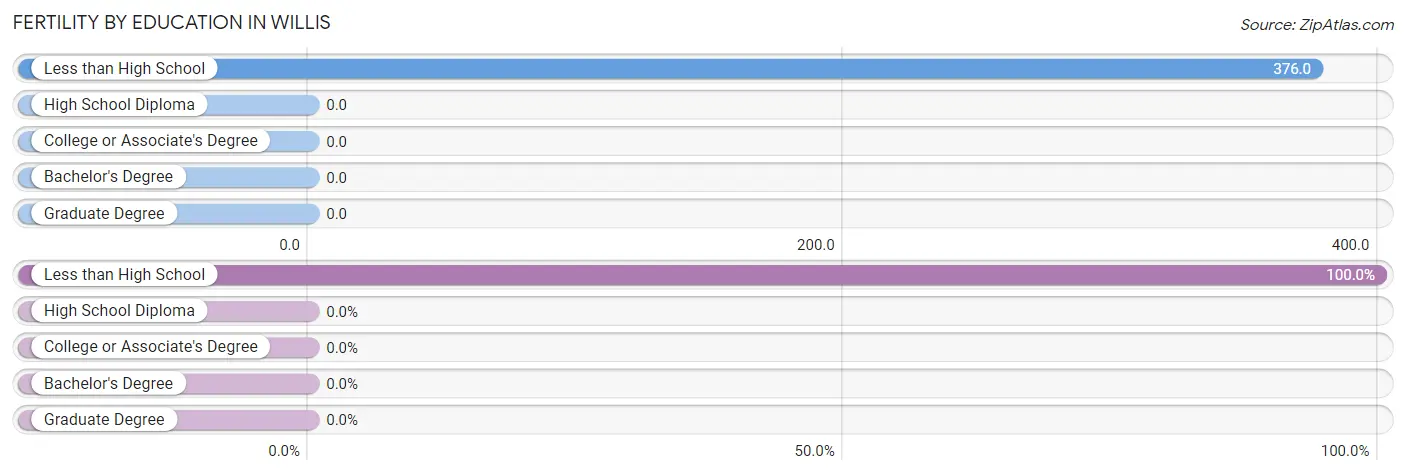
| Educational Attainment | Women with Births | Births / 1,000 Women |
| Less than High School | 151 (100.0%) | 376.0 |
| High School Diploma | 0 (0.0%) | 0.0 |
| College or Associate's Degree | 0 (0.0%) | 0.0 |
| Bachelor's Degree | 0 (0.0%) | 0.0 |
| Graduate Degree | 0 (0.0%) | 0.0 |
| Total | 151 (100.0%) | 122.0 |
Fertility by Education by Marriage Status in Willis
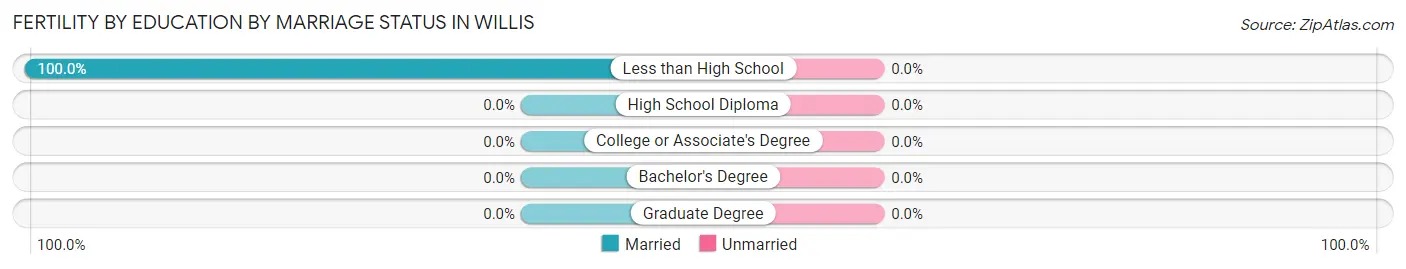
| Educational Attainment | Married | Unmarried |
| Less than High School | 151 (100.0%) | 0 (0.0%) |
| High School Diploma | 0 (0.0%) | 0 (0.0%) |
| College or Associate's Degree | 0 (0.0%) | 0 (0.0%) |
| Bachelor's Degree | 0 (0.0%) | 0 (0.0%) |
| Graduate Degree | 0 (0.0%) | 0 (0.0%) |
| Total | 151 (100.0%) | 0 (0.0%) |
Employment Characteristics in Willis
Employment by Class of Employer in Willis
Among the 3,039 employed individuals in Willis, private company employees (2,102 | 69.2%), local government employees (308 | 10.1%), and not-for-profit organizations (217 | 7.1%) make up the most common classes of employment.
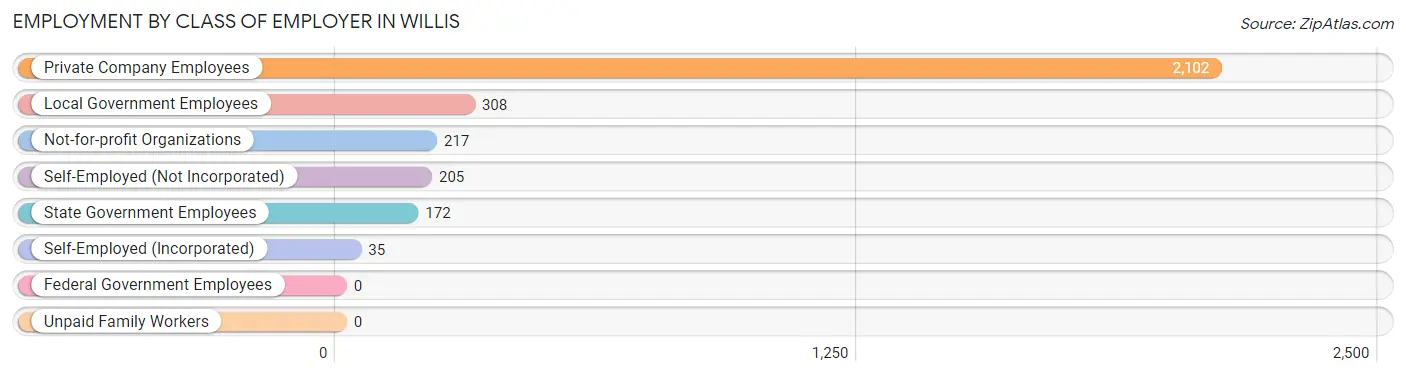
| Employer Class | # Employees | % Employees |
| Private Company Employees | 2,102 | 69.2% |
| Self-Employed (Incorporated) | 35 | 1.1% |
| Self-Employed (Not Incorporated) | 205 | 6.8% |
| Not-for-profit Organizations | 217 | 7.1% |
| Local Government Employees | 308 | 10.1% |
| State Government Employees | 172 | 5.7% |
| Federal Government Employees | 0 | 0.0% |
| Unpaid Family Workers | 0 | 0.0% |
| Total | 3,039 | 100.0% |
Employment Status by Age in Willis
According to the labor force statistics for Willis, out of the total population over 16 years of age (5,320), 63.7% or 3,389 individuals are in the labor force, with 8.5% or 288 of them unemployed. The age group with the highest labor force participation rate is 25 to 29 years, with 95.2% or 471 individuals in the labor force. Within the labor force, the 30 to 34 years age range has the highest percentage of unemployed individuals, with 39.5% or 90 of them being unemployed.
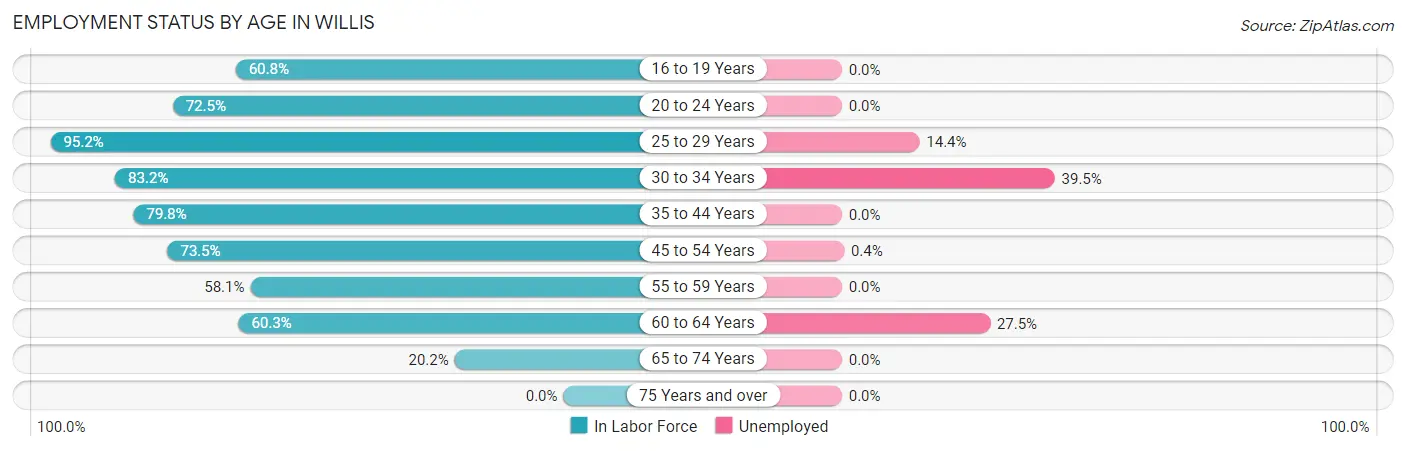
| Age Bracket | In Labor Force | Unemployed |
| 16 to 19 Years | 115 (60.8%) | 0 (0.0%) |
| 20 to 24 Years | 442 (72.5%) | 0 (0.0%) |
| 25 to 29 Years | 471 (95.2%) | 68 (14.4%) |
| 30 to 34 Years | 228 (83.2%) | 90 (39.5%) |
| 35 to 44 Years | 853 (79.8%) | 0 (0.0%) |
| 45 to 54 Years | 518 (73.5%) | 2 (0.4%) |
| 55 to 59 Years | 151 (58.1%) | 0 (0.0%) |
| 60 to 64 Years | 461 (60.3%) | 127 (27.5%) |
| 65 to 74 Years | 151 (20.2%) | 0 (0.0%) |
| 75 Years and over | 0 (0.0%) | 0 (0.0%) |
| Total | 3,389 (63.7%) | 288 (8.5%) |
Employment Status by Educational Attainment in Willis
According to labor force statistics for Willis, 75.2% of individuals (2,683) out of the total population between 25 and 64 years of age (3,568) are in the labor force, with 10.7% or 287 of them being unemployed. The group with the highest labor force participation rate are those with the educational attainment of college / associate degree, with 89.0% or 862 individuals in the labor force. Within the labor force, individuals with bachelor's degree or higher education have the highest percentage of unemployment, with 31.3% or 127 of them being unemployed.
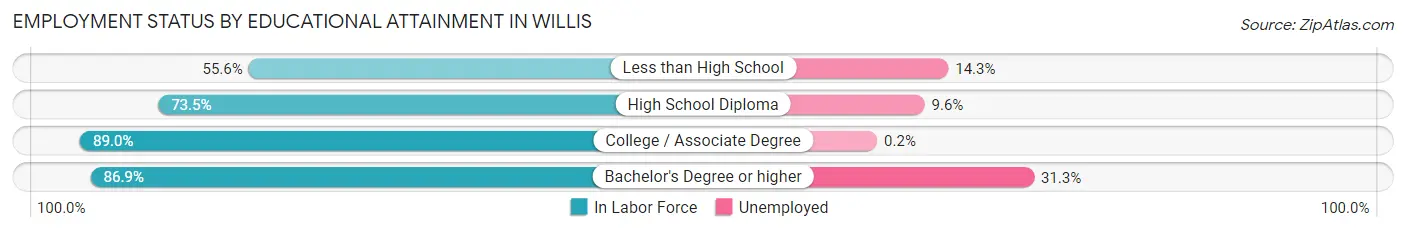
| Educational Attainment | In Labor Force | Unemployed |
| Less than High School | 477 (55.6%) | 123 (14.3%) |
| High School Diploma | 936 (73.5%) | 122 (9.6%) |
| College / Associate Degree | 862 (89.0%) | 2 (0.2%) |
| Bachelor's Degree or higher | 406 (86.9%) | 146 (31.3%) |
| Total | 2,683 (75.2%) | 382 (10.7%) |
Employment Occupations by Sex in Willis
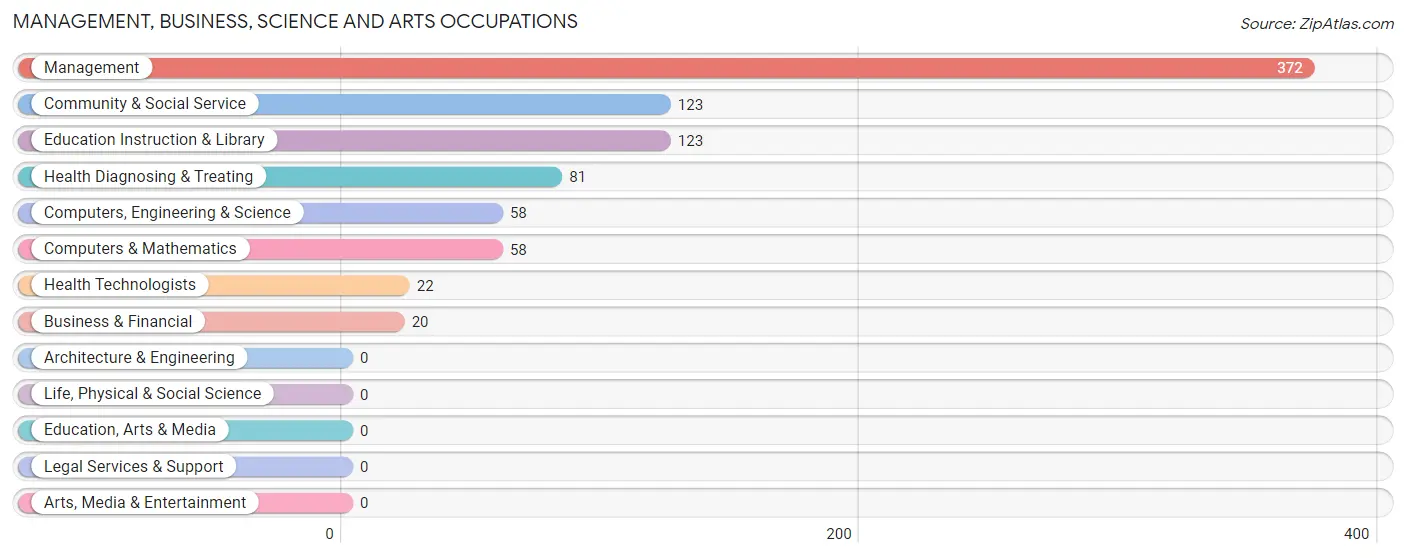
Management, Business, Science and Arts Occupations
The most common Management, Business, Science and Arts occupations in Willis are Management (372 | 12.0%), Community & Social Service (123 | 4.0%), Education Instruction & Library (123 | 4.0%), Health Diagnosing & Treating (81 | 2.6%), and Computers, Engineering & Science (58 | 1.9%).
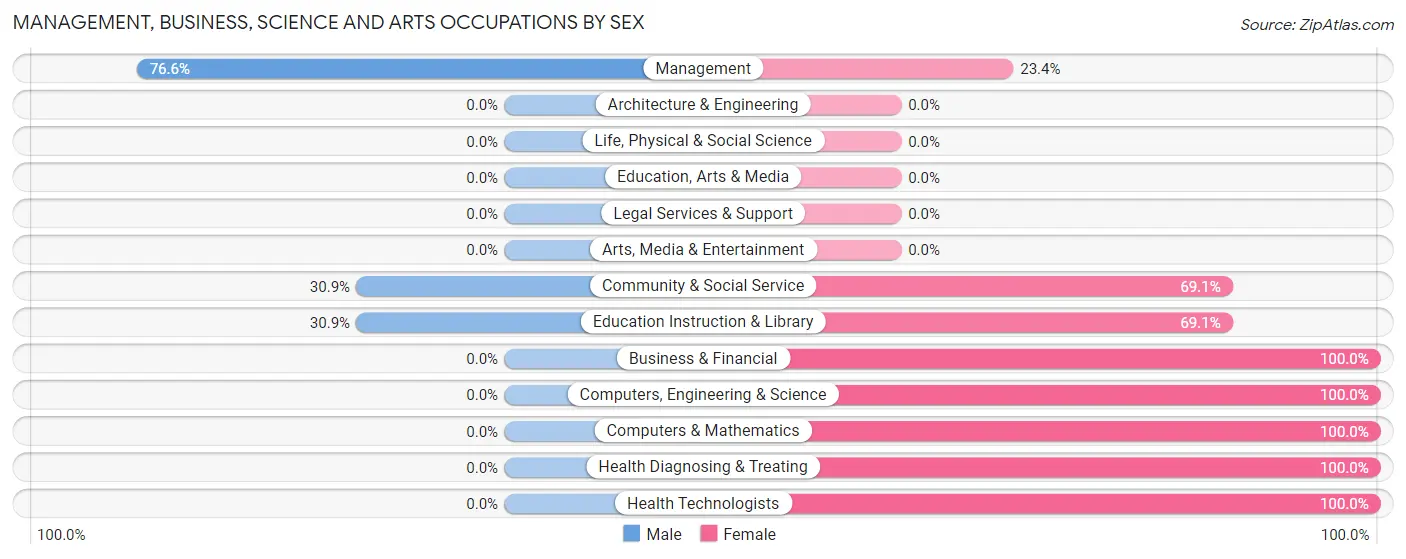
Management, Business, Science and Arts Occupations by Sex
Within the Management, Business, Science and Arts occupations in Willis, the most male-oriented occupations are Management (76.6%), Community & Social Service (30.9%), and Education Instruction & Library (30.9%), while the most female-oriented occupations are Business & Financial (100.0%), Computers, Engineering & Science (100.0%), and Computers & Mathematics (100.0%).
| Occupation | Male | Female |
| Management | 285 (76.6%) | 87 (23.4%) |
| Business & Financial | 0 (0.0%) | 20 (100.0%) |
| Computers, Engineering & Science | 0 (0.0%) | 58 (100.0%) |
| Computers & Mathematics | 0 (0.0%) | 58 (100.0%) |
| Architecture & Engineering | 0 (0.0%) | 0 (0.0%) |
| Life, Physical & Social Science | 0 (0.0%) | 0 (0.0%) |
| Community & Social Service | 38 (30.9%) | 85 (69.1%) |
| Education, Arts & Media | 0 (0.0%) | 0 (0.0%) |
| Legal Services & Support | 0 (0.0%) | 0 (0.0%) |
| Education Instruction & Library | 38 (30.9%) | 85 (69.1%) |
| Arts, Media & Entertainment | 0 (0.0%) | 0 (0.0%) |
| Health Diagnosing & Treating | 0 (0.0%) | 81 (100.0%) |
| Health Technologists | 0 (0.0%) | 22 (100.0%) |
| Total (Category) | 323 (49.4%) | 331 (50.6%) |
| Total (Overall) | 2,058 (66.3%) | 1,045 (33.7%) |
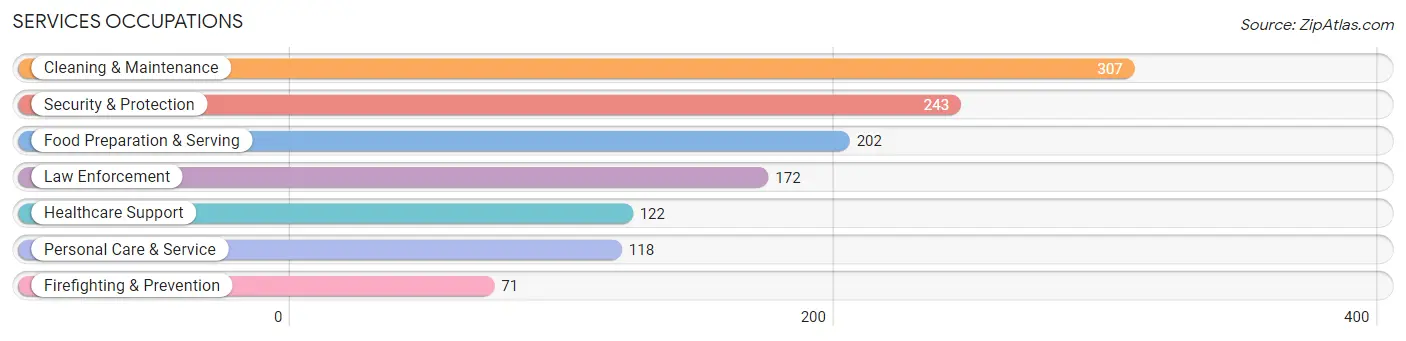
Services Occupations
The most common Services occupations in Willis are Cleaning & Maintenance (307 | 9.9%), Security & Protection (243 | 7.8%), Food Preparation & Serving (202 | 6.5%), Law Enforcement (172 | 5.5%), and Healthcare Support (122 | 3.9%).
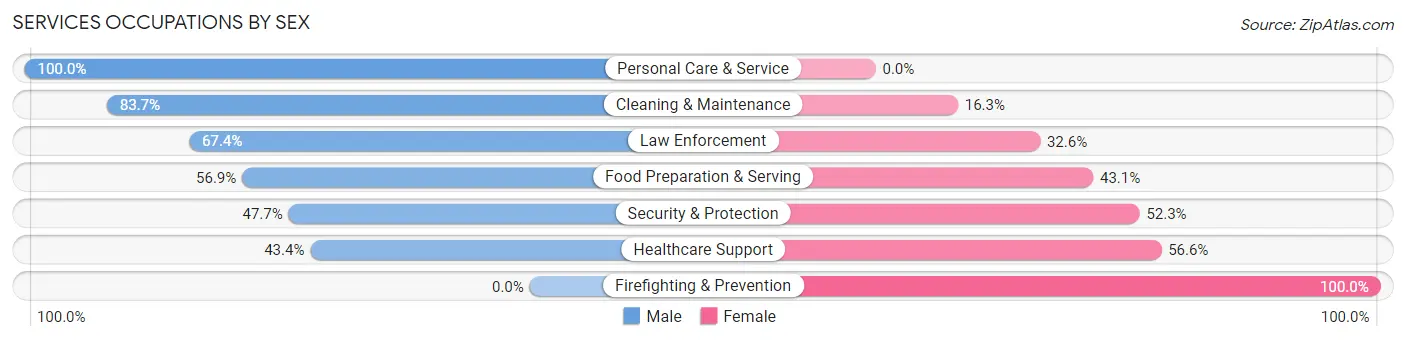
Services Occupations by Sex
Within the Services occupations in Willis, the most male-oriented occupations are Personal Care & Service (100.0%), Cleaning & Maintenance (83.7%), and Law Enforcement (67.4%), while the most female-oriented occupations are Firefighting & Prevention (100.0%), Healthcare Support (56.6%), and Security & Protection (52.3%).
| Occupation | Male | Female |
| Healthcare Support | 53 (43.4%) | 69 (56.6%) |
| Security & Protection | 116 (47.7%) | 127 (52.3%) |
| Firefighting & Prevention | 0 (0.0%) | 71 (100.0%) |
| Law Enforcement | 116 (67.4%) | 56 (32.6%) |
| Food Preparation & Serving | 115 (56.9%) | 87 (43.1%) |
| Cleaning & Maintenance | 257 (83.7%) | 50 (16.3%) |
| Personal Care & Service | 118 (100.0%) | 0 (0.0%) |
| Total (Category) | 659 (66.4%) | 333 (33.6%) |
| Total (Overall) | 2,058 (66.3%) | 1,045 (33.7%) |
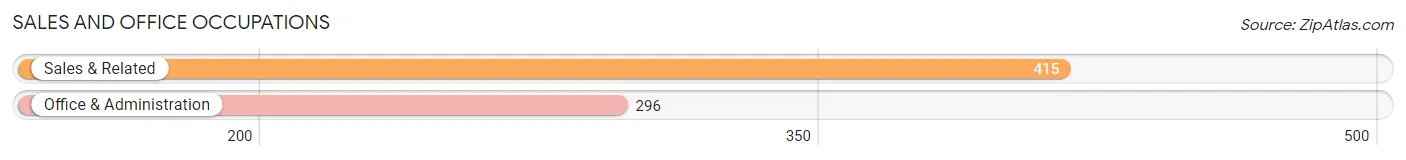
Sales and Office Occupations
The most common Sales and Office occupations in Willis are Sales & Related (415 | 13.4%), and Office & Administration (296 | 9.5%).
Sales and Office Occupations by Sex
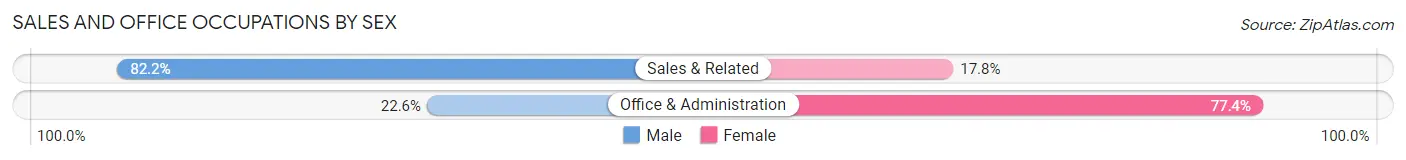
| Occupation | Male | Female |
| Sales & Related | 341 (82.2%) | 74 (17.8%) |
| Office & Administration | 67 (22.6%) | 229 (77.4%) |
| Total (Category) | 408 (57.4%) | 303 (42.6%) |
| Total (Overall) | 2,058 (66.3%) | 1,045 (33.7%) |
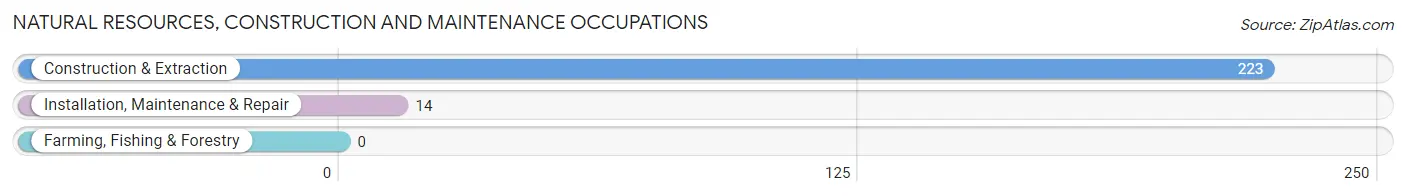
Natural Resources, Construction and Maintenance Occupations
The most common Natural Resources, Construction and Maintenance occupations in Willis are Construction & Extraction (223 | 7.2%), and Installation, Maintenance & Repair (14 | 0.4%).
Natural Resources, Construction and Maintenance Occupations by Sex
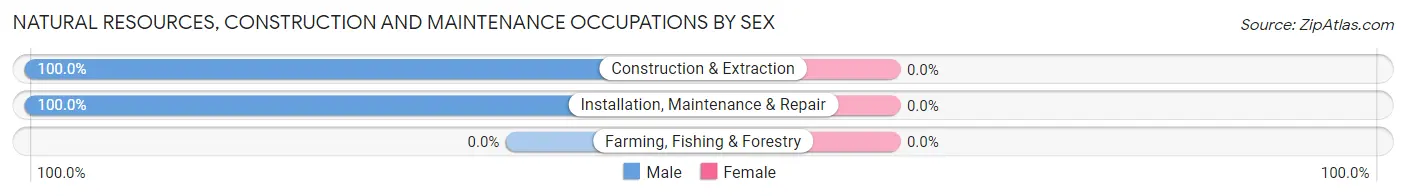
| Occupation | Male | Female |
| Farming, Fishing & Forestry | 0 (0.0%) | 0 (0.0%) |
| Construction & Extraction | 223 (100.0%) | 0 (0.0%) |
| Installation, Maintenance & Repair | 14 (100.0%) | 0 (0.0%) |
| Total (Category) | 237 (100.0%) | 0 (0.0%) |
| Total (Overall) | 2,058 (66.3%) | 1,045 (33.7%) |
Production, Transportation and Moving Occupations
The most common Production, Transportation and Moving occupations in Willis are Production (223 | 7.2%), Material Moving (198 | 6.4%), and Transportation (88 | 2.8%).
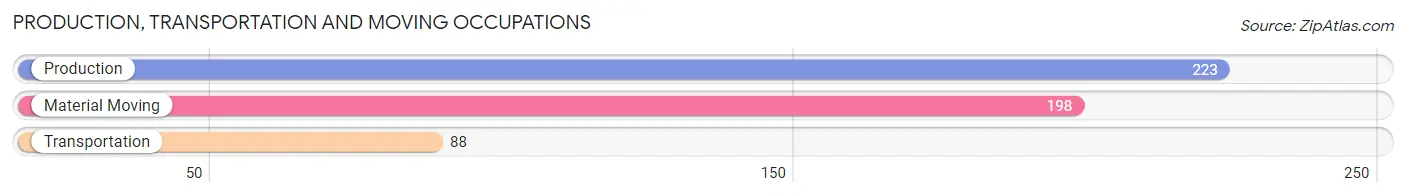
Production, Transportation and Moving Occupations by Sex
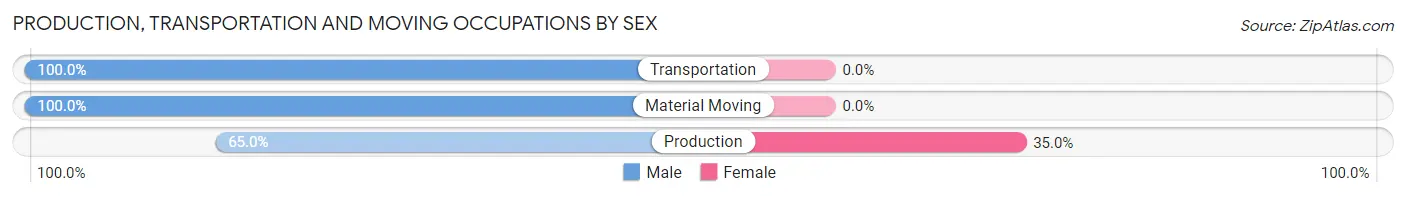
| Occupation | Male | Female |
| Production | 145 (65.0%) | 78 (35.0%) |
| Transportation | 88 (100.0%) | 0 (0.0%) |
| Material Moving | 198 (100.0%) | 0 (0.0%) |
| Total (Category) | 431 (84.7%) | 78 (15.3%) |
| Total (Overall) | 2,058 (66.3%) | 1,045 (33.7%) |
Employment Industries by Sex in Willis
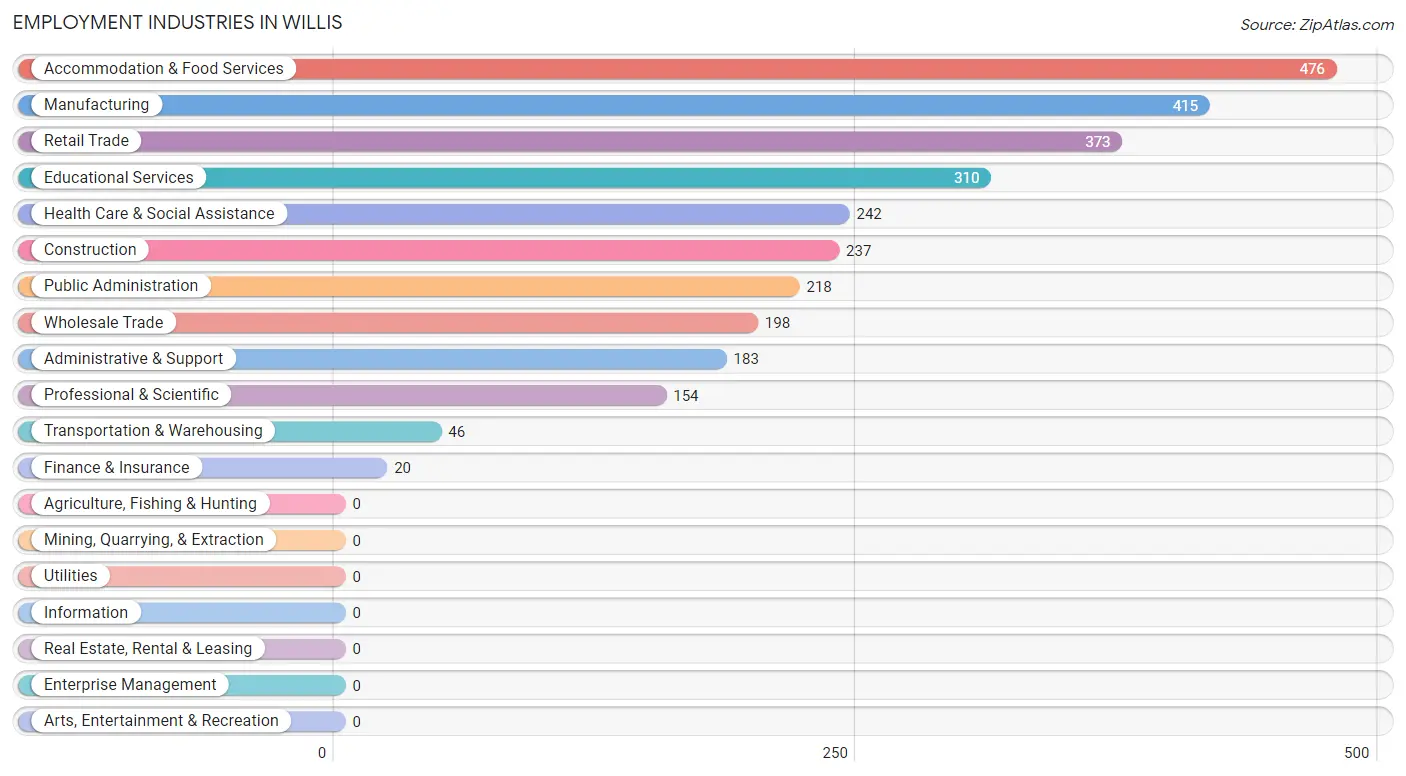
Employment Industries in Willis
The major employment industries in Willis include Accommodation & Food Services (476 | 15.3%), Manufacturing (415 | 13.4%), Retail Trade (373 | 12.0%), Educational Services (310 | 10.0%), and Health Care & Social Assistance (242 | 7.8%).
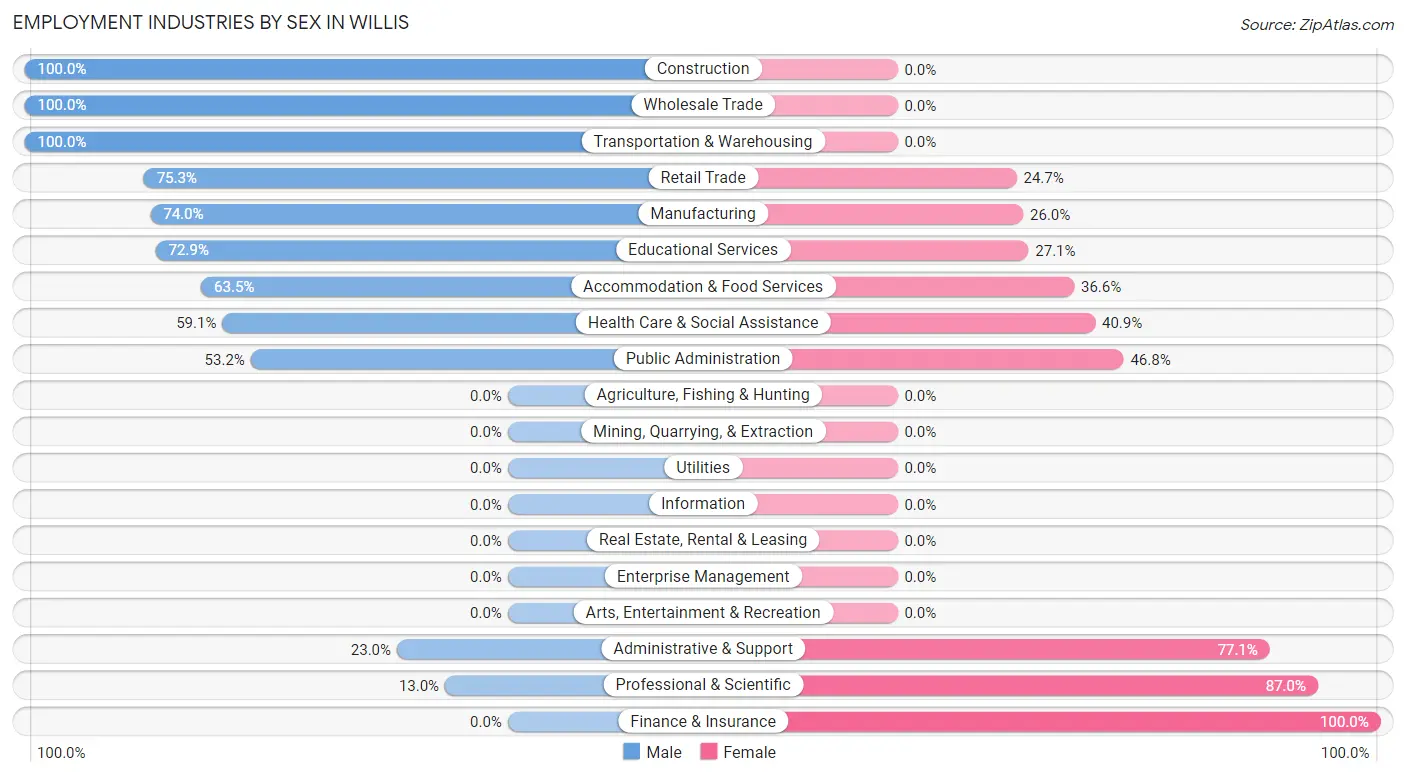
Employment Industries by Sex in Willis
The Willis industries that see more men than women are Construction (100.0%), Wholesale Trade (100.0%), and Transportation & Warehousing (100.0%), whereas the industries that tend to have a higher number of women are Finance & Insurance (100.0%), Professional & Scientific (87.0%), and Administrative & Support (77.0%).
| Industry | Male | Female |
| Agriculture, Fishing & Hunting | 0 (0.0%) | 0 (0.0%) |
| Mining, Quarrying, & Extraction | 0 (0.0%) | 0 (0.0%) |
| Construction | 237 (100.0%) | 0 (0.0%) |
| Manufacturing | 307 (74.0%) | 108 (26.0%) |
| Wholesale Trade | 198 (100.0%) | 0 (0.0%) |
| Retail Trade | 281 (75.3%) | 92 (24.7%) |
| Transportation & Warehousing | 46 (100.0%) | 0 (0.0%) |
| Utilities | 0 (0.0%) | 0 (0.0%) |
| Information | 0 (0.0%) | 0 (0.0%) |
| Finance & Insurance | 0 (0.0%) | 20 (100.0%) |
| Real Estate, Rental & Leasing | 0 (0.0%) | 0 (0.0%) |
| Professional & Scientific | 20 (13.0%) | 134 (87.0%) |
| Enterprise Management | 0 (0.0%) | 0 (0.0%) |
| Administrative & Support | 42 (23.0%) | 141 (77.0%) |
| Educational Services | 226 (72.9%) | 84 (27.1%) |
| Health Care & Social Assistance | 143 (59.1%) | 99 (40.9%) |
| Arts, Entertainment & Recreation | 0 (0.0%) | 0 (0.0%) |
| Accommodation & Food Services | 302 (63.4%) | 174 (36.5%) |
| Public Administration | 116 (53.2%) | 102 (46.8%) |
| Total | 2,058 (66.3%) | 1,045 (33.7%) |
Education in Willis
School Enrollment in Willis
The most common levels of schooling among the 1,142 students in Willis are middle school (456 | 39.9%), elementary school (260 | 22.8%), and college / undergraduate (259 | 22.7%).
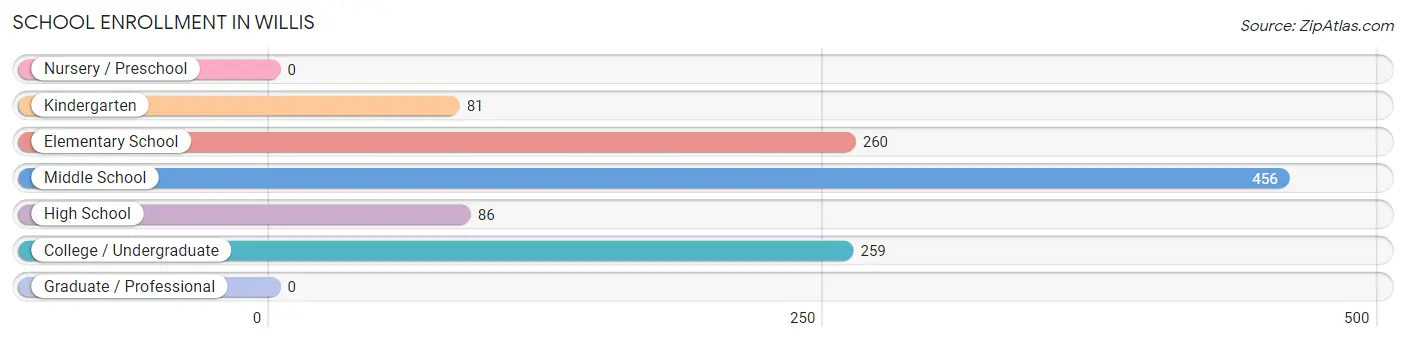
| School Level | # Students | % Students |
| Nursery / Preschool | 0 | 0.0% |
| Kindergarten | 81 | 7.1% |
| Elementary School | 260 | 22.8% |
| Middle School | 456 | 39.9% |
| High School | 86 | 7.5% |
| College / Undergraduate | 259 | 22.7% |
| Graduate / Professional | 0 | 0.0% |
| Total | 1,142 | 100.0% |
School Enrollment by Age by Funding Source in Willis
Out of a total of 1,142 students who are enrolled in schools in Willis, 61 (5.3%) attend a private institution, while the remaining 1,081 (94.7%) are enrolled in public schools. The age group of 20 to 24 year olds has the highest likelihood of being enrolled in private schools, with 40 (33.1% in the age bracket) enrolled. Conversely, the age group of 10 to 14 year olds has the lowest likelihood of being enrolled in a private school, with 456 (100.0% in the age bracket) attending a public institution.
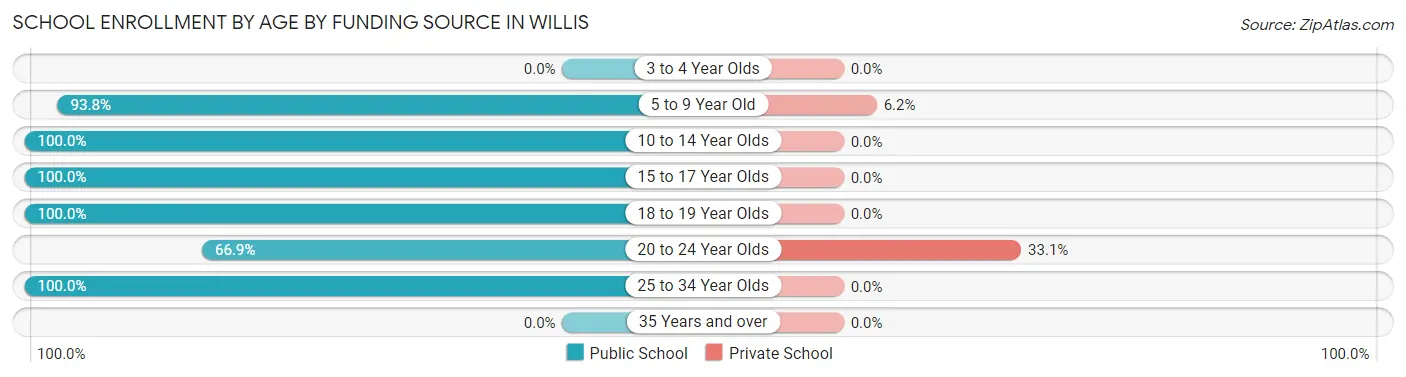
| Age Bracket | Public School | Private School |
| 3 to 4 Year Olds | 0 (0.0%) | 0 (0.0%) |
| 5 to 9 Year Old | 320 (93.8%) | 21 (6.2%) |
| 10 to 14 Year Olds | 456 (100.0%) | 0 (0.0%) |
| 15 to 17 Year Olds | 62 (100.0%) | 0 (0.0%) |
| 18 to 19 Year Olds | 24 (100.0%) | 0 (0.0%) |
| 20 to 24 Year Olds | 81 (66.9%) | 40 (33.1%) |
| 25 to 34 Year Olds | 138 (100.0%) | 0 (0.0%) |
| 35 Years and over | 0 (0.0%) | 0 (0.0%) |
| Total | 1,081 (94.7%) | 61 (5.3%) |
Educational Attainment by Field of Study in Willis
Business (151 | 26.1%), education (127 | 21.9%), computers & mathematics (79 | 13.6%), bio, nature & agricultural (51 | 8.8%), and science & technology (50 | 8.6%) are the most common fields of study among 579 individuals in Willis who have obtained a bachelor's degree or higher.
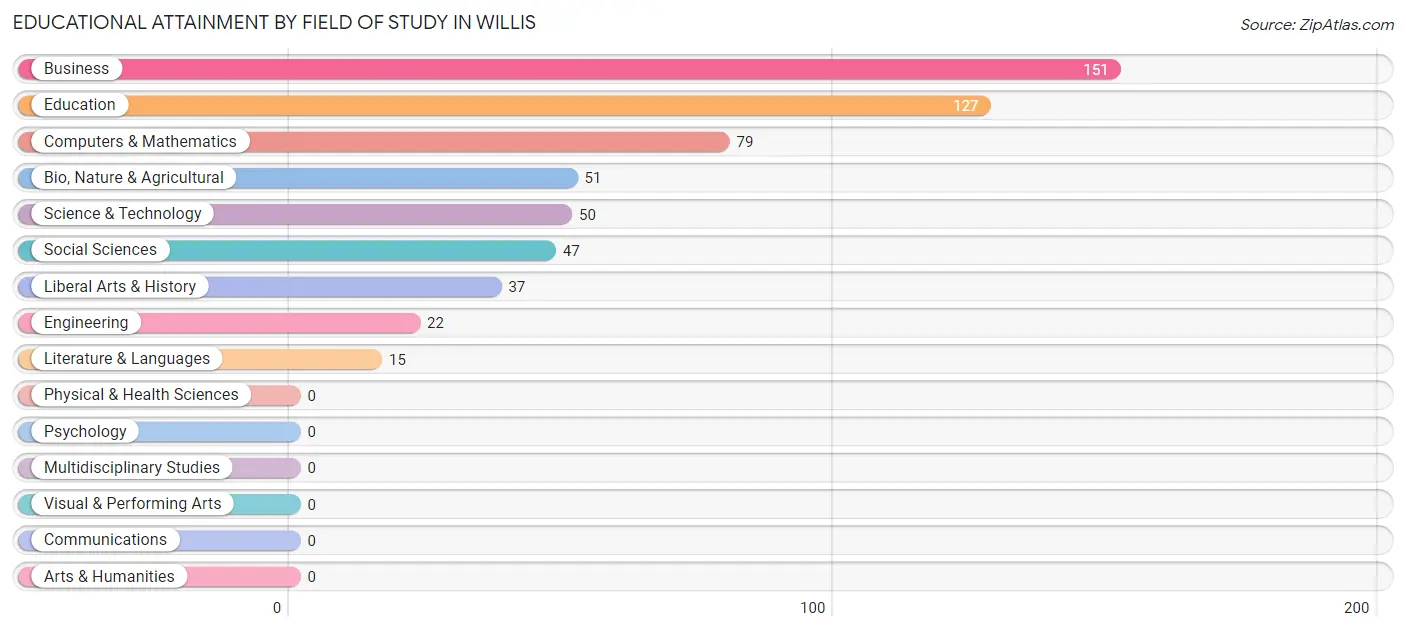
| Field of Study | # Graduates | % Graduates |
| Computers & Mathematics | 79 | 13.6% |
| Bio, Nature & Agricultural | 51 | 8.8% |
| Physical & Health Sciences | 0 | 0.0% |
| Psychology | 0 | 0.0% |
| Social Sciences | 47 | 8.1% |
| Engineering | 22 | 3.8% |
| Multidisciplinary Studies | 0 | 0.0% |
| Science & Technology | 50 | 8.6% |
| Business | 151 | 26.1% |
| Education | 127 | 21.9% |
| Literature & Languages | 15 | 2.6% |
| Liberal Arts & History | 37 | 6.4% |
| Visual & Performing Arts | 0 | 0.0% |
| Communications | 0 | 0.0% |
| Arts & Humanities | 0 | 0.0% |
| Total | 579 | 100.0% |
Transportation & Commute in Willis
Vehicle Availability by Sex in Willis
The most prevalent vehicle ownership categories in Willis are males with 2 vehicles (829, accounting for 41.6%) and females with 2 vehicles (311, making up 79.3%).
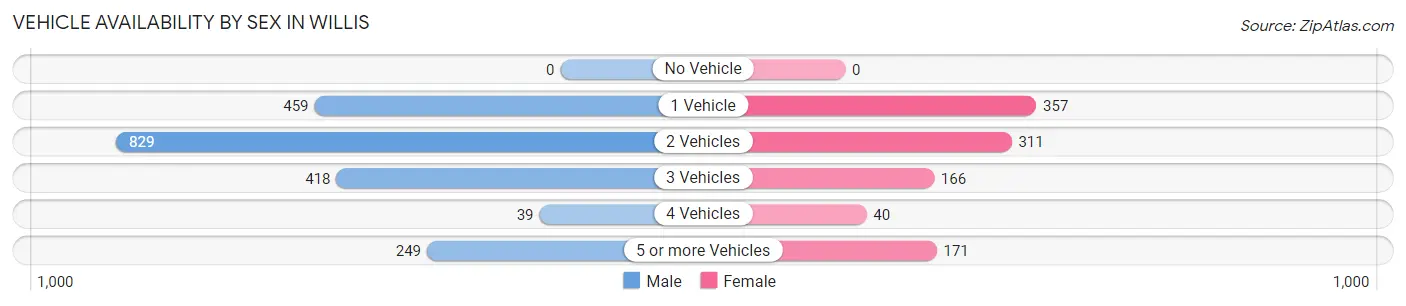
| Vehicles Available | Male | Female |
| No Vehicle | 0 (0.0%) | 0 (0.0%) |
| 1 Vehicle | 459 (23.0%) | 357 (34.2%) |
| 2 Vehicles | 829 (41.6%) | 311 (29.8%) |
| 3 Vehicles | 418 (21.0%) | 166 (15.9%) |
| 4 Vehicles | 39 (2.0%) | 40 (3.8%) |
| 5 or more Vehicles | 249 (12.5%) | 171 (16.4%) |
| Total | 1,994 (100.0%) | 1,045 (100.0%) |
Commute Time in Willis
The most frequently occuring commute durations in Willis are 15 to 19 minutes (528 commuters, 17.7%), 20 to 24 minutes (493 commuters, 16.6%), and 30 to 34 minutes (485 commuters, 16.3%).
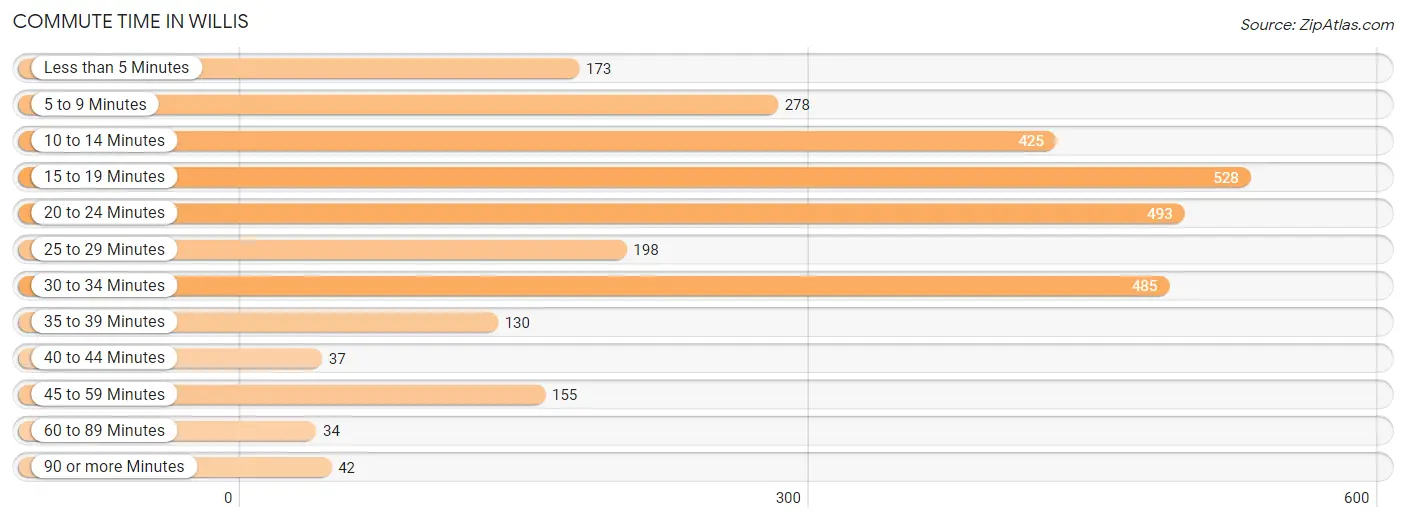
| Commute Time | # Commuters | % Commuters |
| Less than 5 Minutes | 173 | 5.8% |
| 5 to 9 Minutes | 278 | 9.3% |
| 10 to 14 Minutes | 425 | 14.3% |
| 15 to 19 Minutes | 528 | 17.7% |
| 20 to 24 Minutes | 493 | 16.6% |
| 25 to 29 Minutes | 198 | 6.7% |
| 30 to 34 Minutes | 485 | 16.3% |
| 35 to 39 Minutes | 130 | 4.4% |
| 40 to 44 Minutes | 37 | 1.2% |
| 45 to 59 Minutes | 155 | 5.2% |
| 60 to 89 Minutes | 34 | 1.1% |
| 90 or more Minutes | 42 | 1.4% |
Commute Time by Sex in Willis
The most common commute times in Willis are 15 to 19 minutes (391 commuters, 19.6%) for males and 20 to 24 minutes (203 commuters, 20.6%) for females.
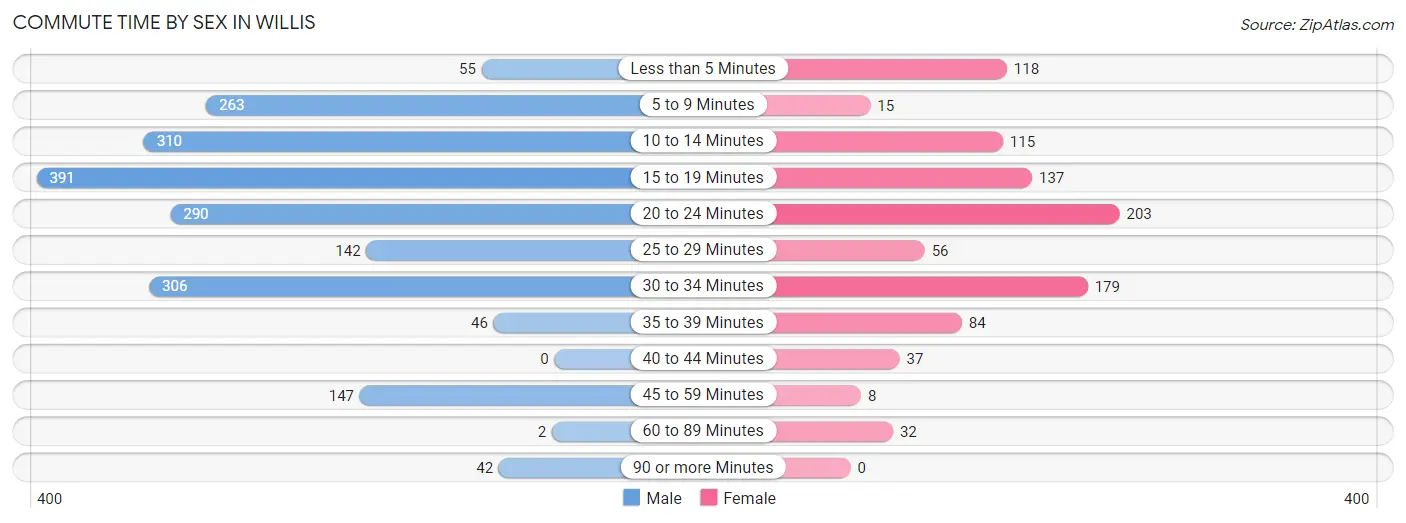
| Commute Time | Male | Female |
| Less than 5 Minutes | 55 (2.8%) | 118 (12.0%) |
| 5 to 9 Minutes | 263 (13.2%) | 15 (1.5%) |
| 10 to 14 Minutes | 310 (15.5%) | 115 (11.7%) |
| 15 to 19 Minutes | 391 (19.6%) | 137 (13.9%) |
| 20 to 24 Minutes | 290 (14.5%) | 203 (20.6%) |
| 25 to 29 Minutes | 142 (7.1%) | 56 (5.7%) |
| 30 to 34 Minutes | 306 (15.3%) | 179 (18.2%) |
| 35 to 39 Minutes | 46 (2.3%) | 84 (8.5%) |
| 40 to 44 Minutes | 0 (0.0%) | 37 (3.8%) |
| 45 to 59 Minutes | 147 (7.4%) | 8 (0.8%) |
| 60 to 89 Minutes | 2 (0.1%) | 32 (3.3%) |
| 90 or more Minutes | 42 (2.1%) | 0 (0.0%) |
Time of Departure to Work by Sex in Willis
The most frequent times of departure to work in Willis are 6:30 AM to 6:59 AM (321, 16.1%) for males and 12:00 PM to 3:59 PM (183, 18.6%) for females.
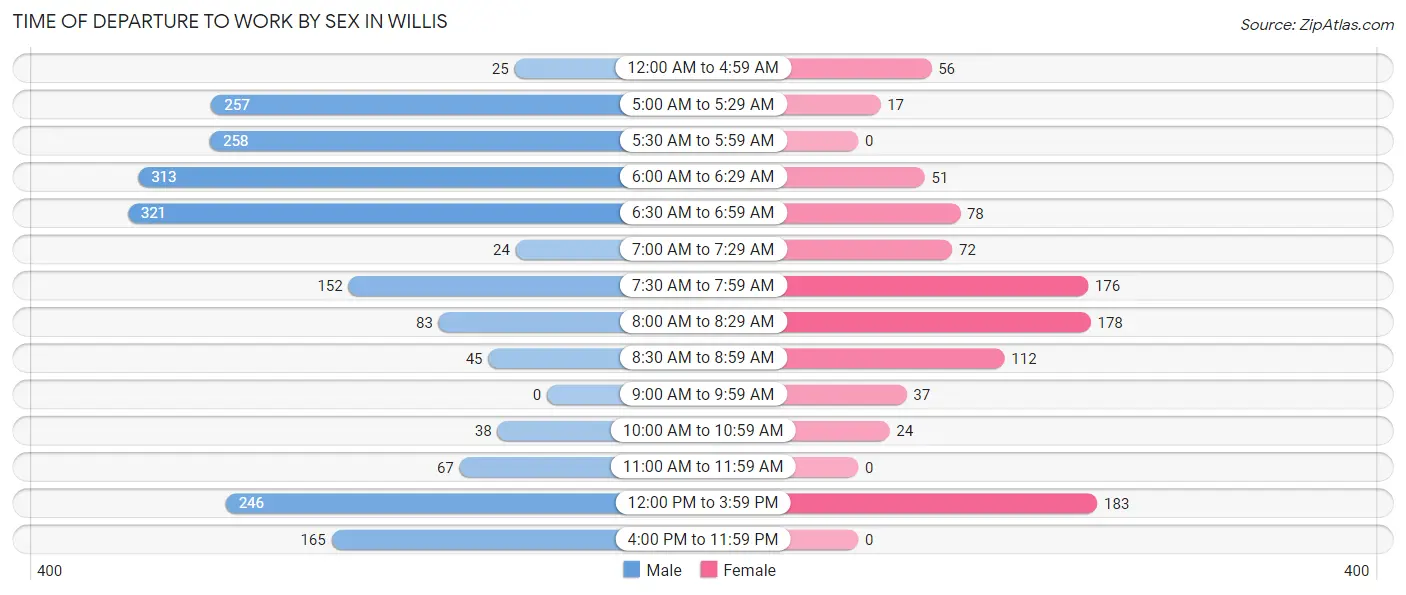
| Time of Departure | Male | Female |
| 12:00 AM to 4:59 AM | 25 (1.3%) | 56 (5.7%) |
| 5:00 AM to 5:29 AM | 257 (12.9%) | 17 (1.7%) |
| 5:30 AM to 5:59 AM | 258 (12.9%) | 0 (0.0%) |
| 6:00 AM to 6:29 AM | 313 (15.7%) | 51 (5.2%) |
| 6:30 AM to 6:59 AM | 321 (16.1%) | 78 (7.9%) |
| 7:00 AM to 7:29 AM | 24 (1.2%) | 72 (7.3%) |
| 7:30 AM to 7:59 AM | 152 (7.6%) | 176 (17.9%) |
| 8:00 AM to 8:29 AM | 83 (4.2%) | 178 (18.1%) |
| 8:30 AM to 8:59 AM | 45 (2.3%) | 112 (11.4%) |
| 9:00 AM to 9:59 AM | 0 (0.0%) | 37 (3.8%) |
| 10:00 AM to 10:59 AM | 38 (1.9%) | 24 (2.4%) |
| 11:00 AM to 11:59 AM | 67 (3.4%) | 0 (0.0%) |
| 12:00 PM to 3:59 PM | 246 (12.3%) | 183 (18.6%) |
| 4:00 PM to 11:59 PM | 165 (8.3%) | 0 (0.0%) |
| Total | 1,994 (100.0%) | 984 (100.0%) |
Housing Occupancy in Willis
Occupancy by Ownership in Willis
Of the total 2,351 dwellings in Willis, owner-occupied units account for 1,434 (61.0%), while renter-occupied units make up 917 (39.0%).
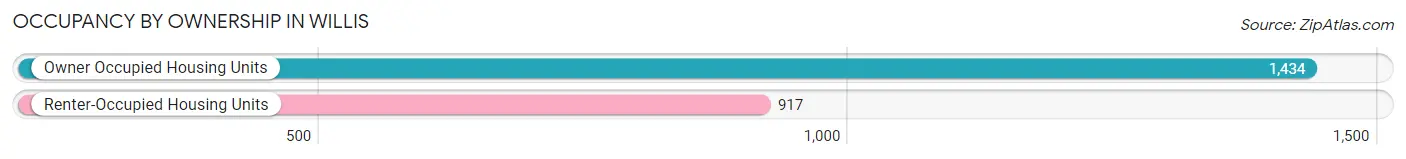
| Occupancy | # Housing Units | % Housing Units |
| Owner Occupied Housing Units | 1,434 | 61.0% |
| Renter-Occupied Housing Units | 917 | 39.0% |
| Total Occupied Housing Units | 2,351 | 100.0% |
Occupancy by Household Size in Willis
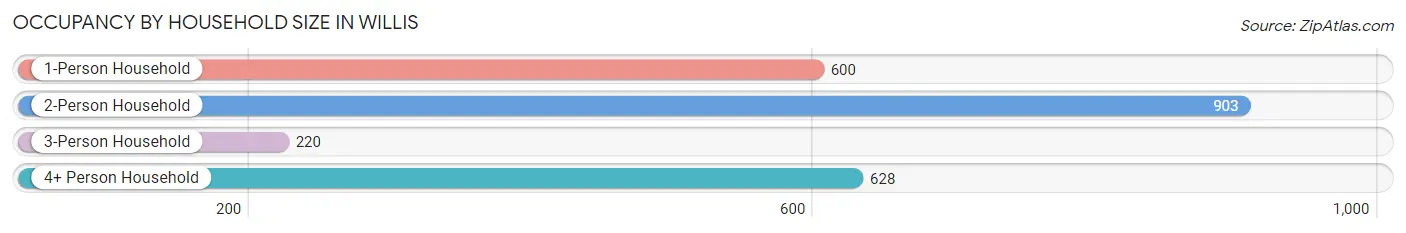
| Household Size | # Housing Units | % Housing Units |
| 1-Person Household | 600 | 25.5% |
| 2-Person Household | 903 | 38.4% |
| 3-Person Household | 220 | 9.4% |
| 4+ Person Household | 628 | 26.7% |
| Total Housing Units | 2,351 | 100.0% |
Occupancy by Ownership by Household Size in Willis
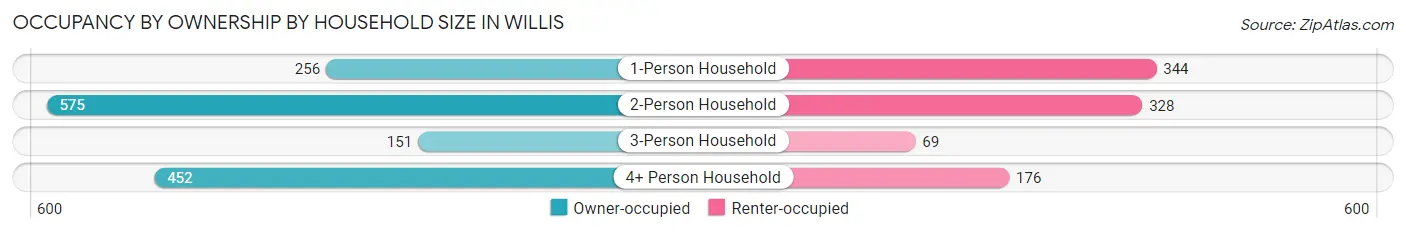
| Household Size | Owner-occupied | Renter-occupied |
| 1-Person Household | 256 (42.7%) | 344 (57.3%) |
| 2-Person Household | 575 (63.7%) | 328 (36.3%) |
| 3-Person Household | 151 (68.6%) | 69 (31.4%) |
| 4+ Person Household | 452 (72.0%) | 176 (28.0%) |
| Total Housing Units | 1,434 (61.0%) | 917 (39.0%) |
Occupancy by Educational Attainment in Willis
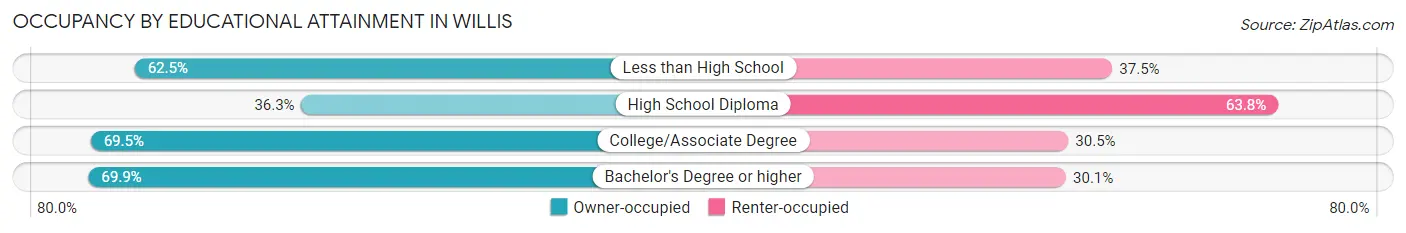
| Household Size | Owner-occupied | Renter-occupied |
| Less than High School | 307 (62.5%) | 184 (37.5%) |
| High School Diploma | 182 (36.2%) | 320 (63.7%) |
| College/Associate Degree | 734 (69.5%) | 322 (30.5%) |
| Bachelor's Degree or higher | 211 (69.9%) | 91 (30.1%) |
Occupancy by Age of Householder in Willis
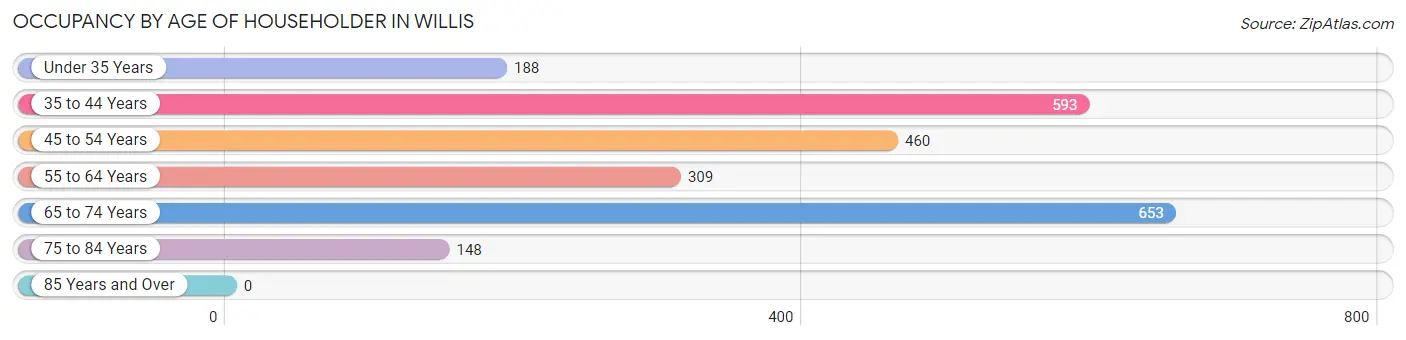
| Age Bracket | # Households | % Households |
| Under 35 Years | 188 | 8.0% |
| 35 to 44 Years | 593 | 25.2% |
| 45 to 54 Years | 460 | 19.6% |
| 55 to 64 Years | 309 | 13.1% |
| 65 to 74 Years | 653 | 27.8% |
| 75 to 84 Years | 148 | 6.3% |
| 85 Years and Over | 0 | 0.0% |
| Total | 2,351 | 100.0% |
Housing Finances in Willis
Median Income by Occupancy in Willis
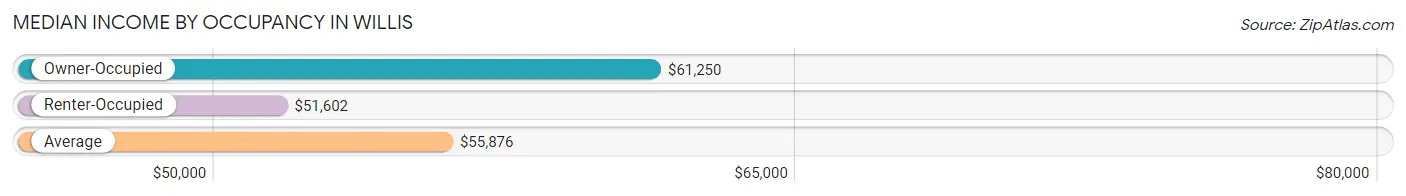
| Occupancy Type | # Households | Median Income |
| Owner-Occupied | 1,434 (61.0%) | $61,250 |
| Renter-Occupied | 917 (39.0%) | $51,602 |
| Average | 2,351 (100.0%) | $55,876 |
Occupancy by Householder Income Bracket in Willis
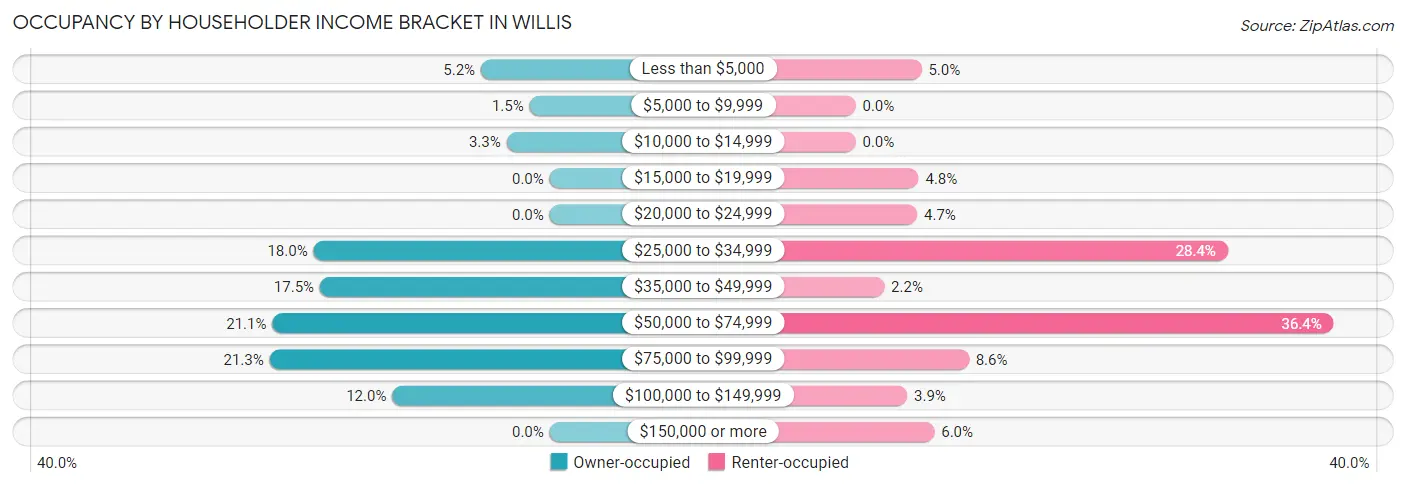
| Income Bracket | Owner-occupied | Renter-occupied |
| Less than $5,000 | 75 (5.2%) | 46 (5.0%) |
| $5,000 to $9,999 | 22 (1.5%) | 0 (0.0%) |
| $10,000 to $14,999 | 47 (3.3%) | 0 (0.0%) |
| $15,000 to $19,999 | 0 (0.0%) | 44 (4.8%) |
| $20,000 to $24,999 | 0 (0.0%) | 43 (4.7%) |
| $25,000 to $34,999 | 258 (18.0%) | 260 (28.3%) |
| $35,000 to $49,999 | 251 (17.5%) | 20 (2.2%) |
| $50,000 to $74,999 | 303 (21.1%) | 334 (36.4%) |
| $75,000 to $99,999 | 306 (21.3%) | 79 (8.6%) |
| $100,000 to $149,999 | 172 (12.0%) | 36 (3.9%) |
| $150,000 or more | 0 (0.0%) | 55 (6.0%) |
| Total | 1,434 (100.0%) | 917 (100.0%) |
Monthly Housing Cost Tiers in Willis
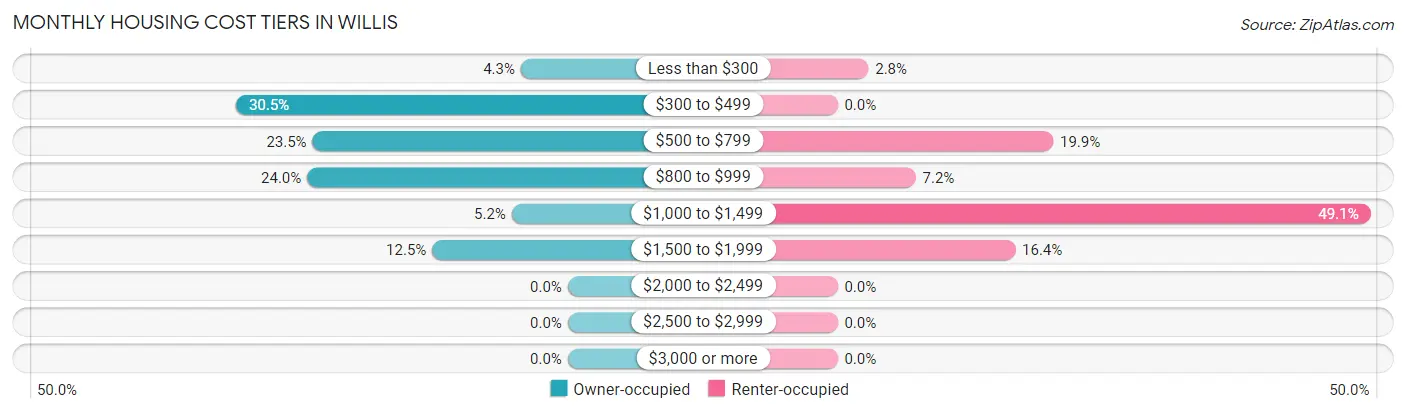
| Monthly Cost | Owner-occupied | Renter-occupied |
| Less than $300 | 62 (4.3%) | 26 (2.8%) |
| $300 to $499 | 438 (30.5%) | 0 (0.0%) |
| $500 to $799 | 337 (23.5%) | 182 (19.9%) |
| $800 to $999 | 344 (24.0%) | 66 (7.2%) |
| $1,000 to $1,499 | 74 (5.2%) | 450 (49.1%) |
| $1,500 to $1,999 | 179 (12.5%) | 150 (16.4%) |
| $2,000 to $2,499 | 0 (0.0%) | 0 (0.0%) |
| $2,500 to $2,999 | 0 (0.0%) | 0 (0.0%) |
| $3,000 or more | 0 (0.0%) | 0 (0.0%) |
| Total | 1,434 (100.0%) | 917 (100.0%) |
Physical Housing Characteristics in Willis
Housing Structures in Willis
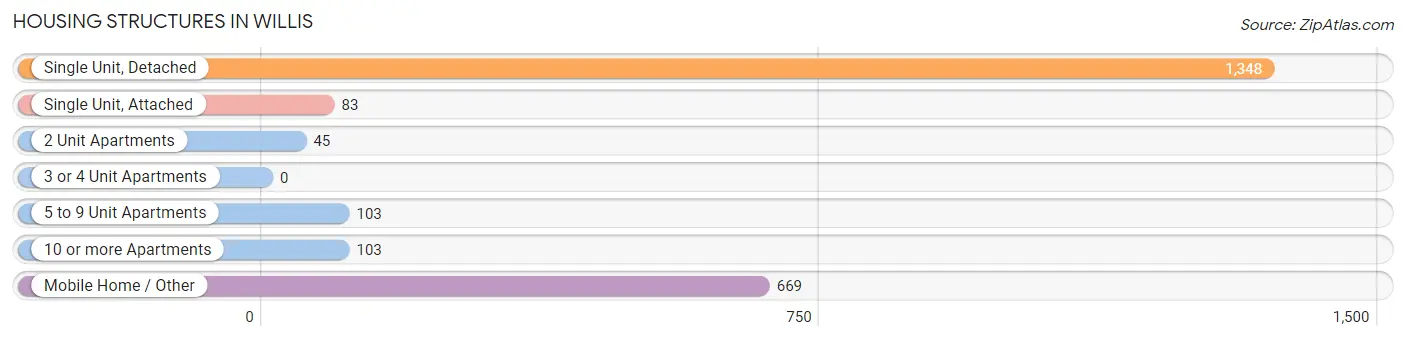
| Structure Type | # Housing Units | % Housing Units |
| Single Unit, Detached | 1,348 | 57.3% |
| Single Unit, Attached | 83 | 3.5% |
| 2 Unit Apartments | 45 | 1.9% |
| 3 or 4 Unit Apartments | 0 | 0.0% |
| 5 to 9 Unit Apartments | 103 | 4.4% |
| 10 or more Apartments | 103 | 4.4% |
| Mobile Home / Other | 669 | 28.5% |
| Total | 2,351 | 100.0% |
Housing Structures by Occupancy in Willis
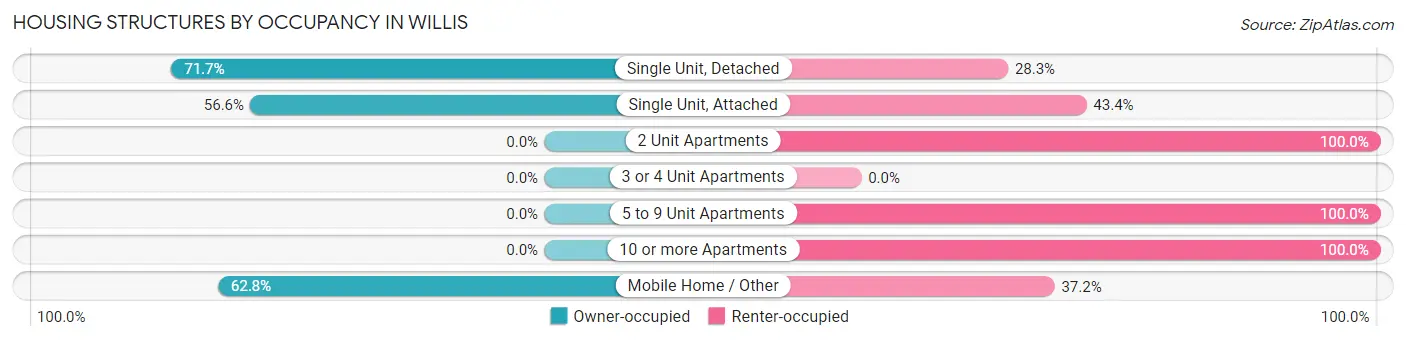
| Structure Type | Owner-occupied | Renter-occupied |
| Single Unit, Detached | 967 (71.7%) | 381 (28.3%) |
| Single Unit, Attached | 47 (56.6%) | 36 (43.4%) |
| 2 Unit Apartments | 0 (0.0%) | 45 (100.0%) |
| 3 or 4 Unit Apartments | 0 (0.0%) | 0 (0.0%) |
| 5 to 9 Unit Apartments | 0 (0.0%) | 103 (100.0%) |
| 10 or more Apartments | 0 (0.0%) | 103 (100.0%) |
| Mobile Home / Other | 420 (62.8%) | 249 (37.2%) |
| Total | 1,434 (61.0%) | 917 (39.0%) |
Housing Structures by Number of Rooms in Willis
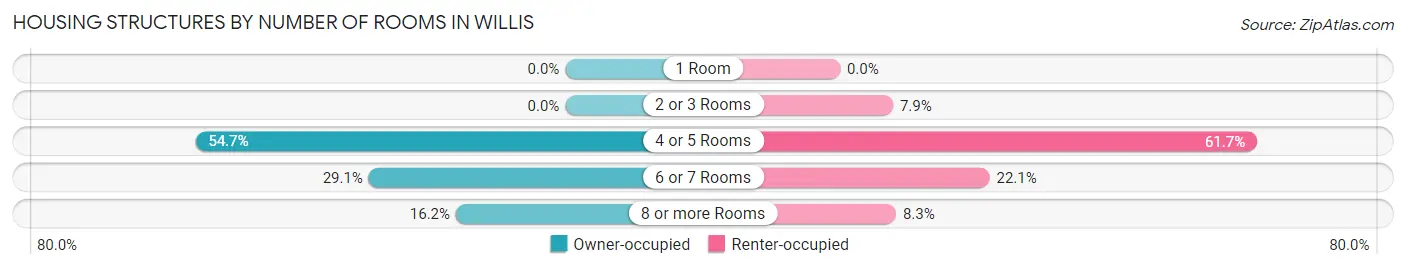
| Number of Rooms | Owner-occupied | Renter-occupied |
| 1 Room | 0 (0.0%) | 0 (0.0%) |
| 2 or 3 Rooms | 0 (0.0%) | 72 (7.9%) |
| 4 or 5 Rooms | 785 (54.7%) | 566 (61.7%) |
| 6 or 7 Rooms | 417 (29.1%) | 203 (22.1%) |
| 8 or more Rooms | 232 (16.2%) | 76 (8.3%) |
| Total | 1,434 (100.0%) | 917 (100.0%) |
Housing Structure by Heating Type in Willis
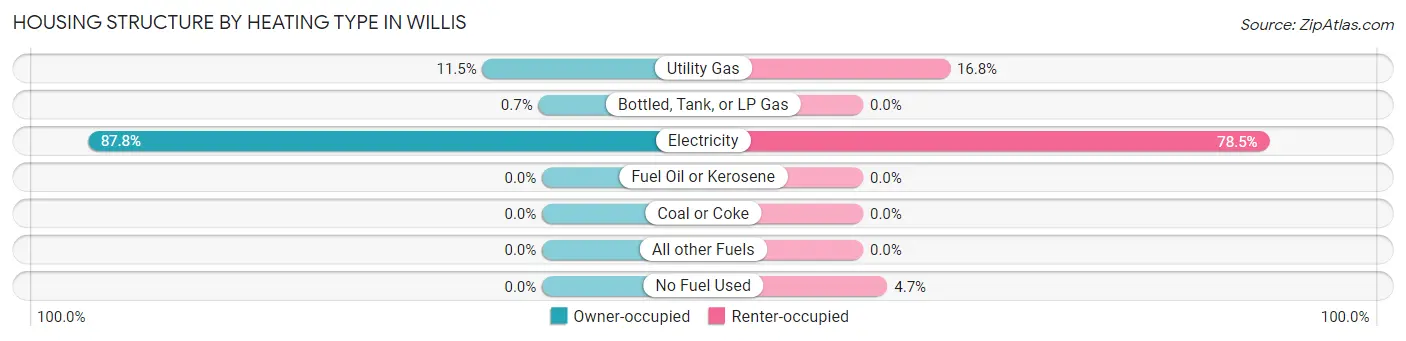
| Heating Type | Owner-occupied | Renter-occupied |
| Utility Gas | 165 (11.5%) | 154 (16.8%) |
| Bottled, Tank, or LP Gas | 10 (0.7%) | 0 (0.0%) |
| Electricity | 1,259 (87.8%) | 720 (78.5%) |
| Fuel Oil or Kerosene | 0 (0.0%) | 0 (0.0%) |
| Coal or Coke | 0 (0.0%) | 0 (0.0%) |
| All other Fuels | 0 (0.0%) | 0 (0.0%) |
| No Fuel Used | 0 (0.0%) | 43 (4.7%) |
| Total | 1,434 (100.0%) | 917 (100.0%) |
Household Vehicle Usage in Willis
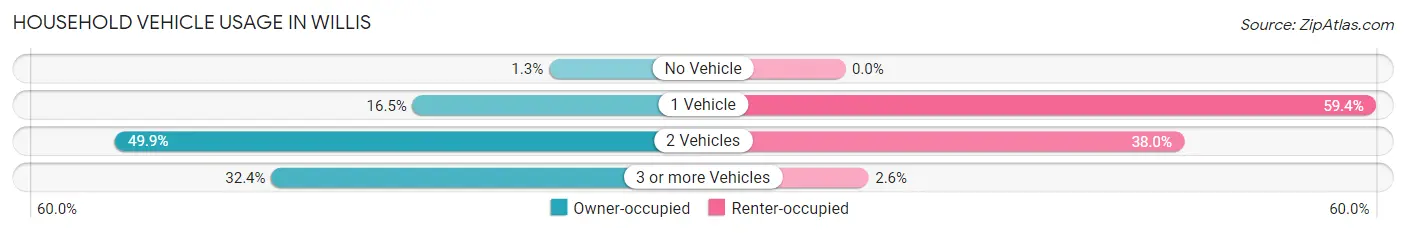
| Vehicles per Household | Owner-occupied | Renter-occupied |
| No Vehicle | 18 (1.3%) | 0 (0.0%) |
| 1 Vehicle | 237 (16.5%) | 545 (59.4%) |
| 2 Vehicles | 715 (49.9%) | 348 (38.0%) |
| 3 or more Vehicles | 464 (32.4%) | 24 (2.6%) |
| Total | 1,434 (100.0%) | 917 (100.0%) |
Real Estate & Mortgages in Willis
Real Estate and Mortgage Overview in Willis
| Characteristic | Without Mortgage | With Mortgage |
| Housing Units | 784 | 650 |
| Median Property Value | $108,400 | $130,400 |
| Median Household Income | $65,805 | $0 |
| Monthly Housing Costs | $473 | $0 |
| Real Estate Taxes | $1,560 | $37 |
Property Value by Mortgage Status in Willis
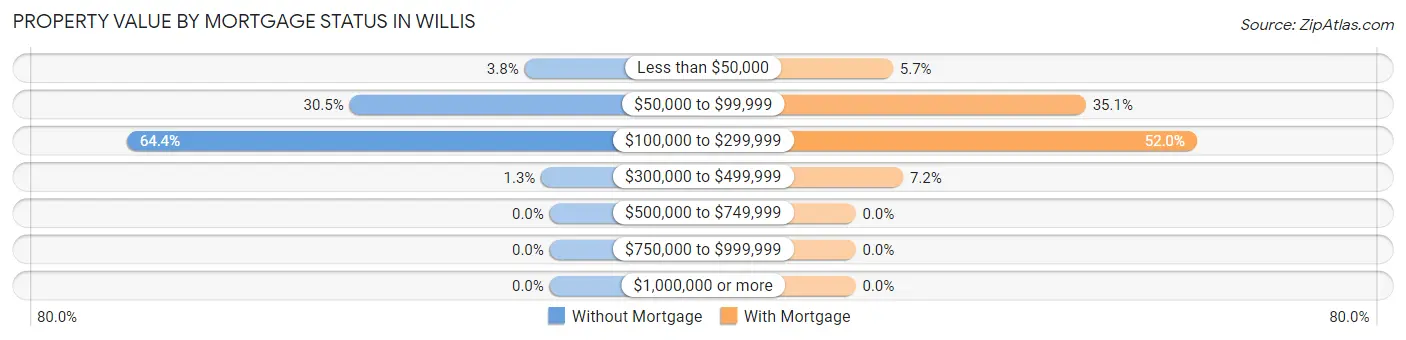
| Property Value | Without Mortgage | With Mortgage |
| Less than $50,000 | 30 (3.8%) | 37 (5.7%) |
| $50,000 to $99,999 | 239 (30.5%) | 228 (35.1%) |
| $100,000 to $299,999 | 505 (64.4%) | 338 (52.0%) |
| $300,000 to $499,999 | 10 (1.3%) | 47 (7.2%) |
| $500,000 to $749,999 | 0 (0.0%) | 0 (0.0%) |
| $750,000 to $999,999 | 0 (0.0%) | 0 (0.0%) |
| $1,000,000 or more | 0 (0.0%) | 0 (0.0%) |
| Total | 784 (100.0%) | 650 (100.0%) |
Household Income by Mortgage Status in Willis
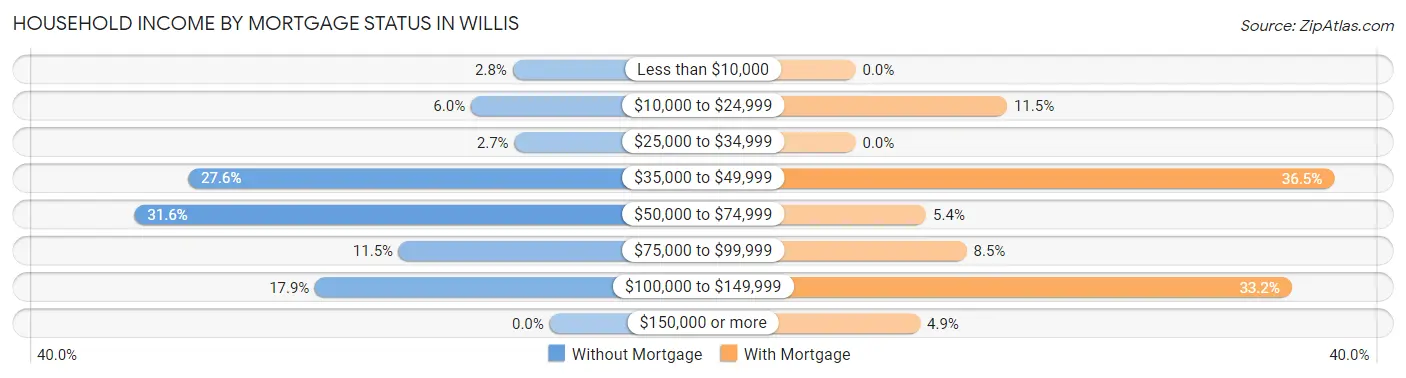
| Household Income | Without Mortgage | With Mortgage |
| Less than $10,000 | 22 (2.8%) | 0 (0.0%) |
| $10,000 to $24,999 | 47 (6.0%) | 75 (11.5%) |
| $25,000 to $34,999 | 21 (2.7%) | 0 (0.0%) |
| $35,000 to $49,999 | 216 (27.6%) | 237 (36.5%) |
| $50,000 to $74,999 | 248 (31.6%) | 35 (5.4%) |
| $75,000 to $99,999 | 90 (11.5%) | 55 (8.5%) |
| $100,000 to $149,999 | 140 (17.9%) | 216 (33.2%) |
| $150,000 or more | 0 (0.0%) | 32 (4.9%) |
| Total | 784 (100.0%) | 650 (100.0%) |
Property Value to Household Income Ratio in Willis
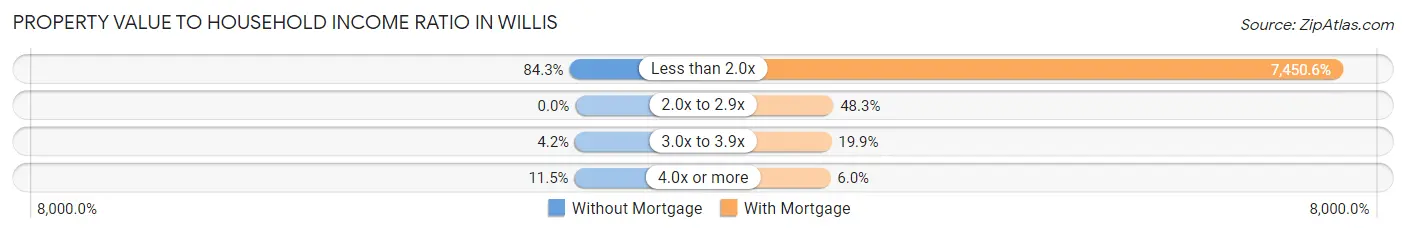
| Value-to-Income Ratio | Without Mortgage | With Mortgage |
| Less than 2.0x | 661 (84.3%) | 48,429 (7,450.6%) |
| 2.0x to 2.9x | 0 (0.0%) | 314 (48.3%) |
| 3.0x to 3.9x | 33 (4.2%) | 129 (19.9%) |
| 4.0x or more | 90 (11.5%) | 39 (6.0%) |
| Total | 784 (100.0%) | 650 (100.0%) |
Real Estate Taxes by Mortgage Status in Willis
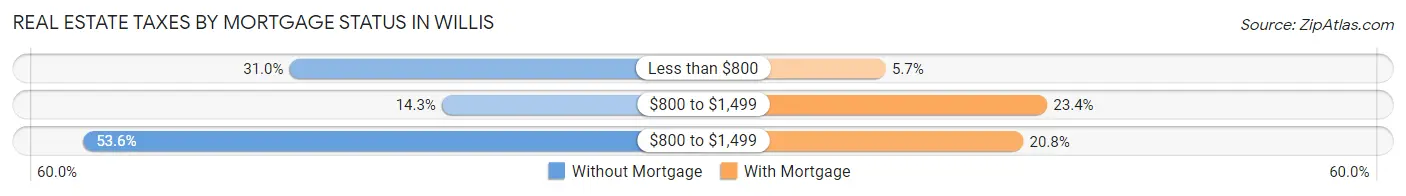
| Property Taxes | Without Mortgage | With Mortgage |
| Less than $800 | 243 (31.0%) | 37 (5.7%) |
| $800 to $1,499 | 112 (14.3%) | 152 (23.4%) |
| $800 to $1,499 | 420 (53.6%) | 135 (20.8%) |
| Total | 784 (100.0%) | 650 (100.0%) |
Health & Disability in Willis
Health Insurance Coverage by Age in Willis
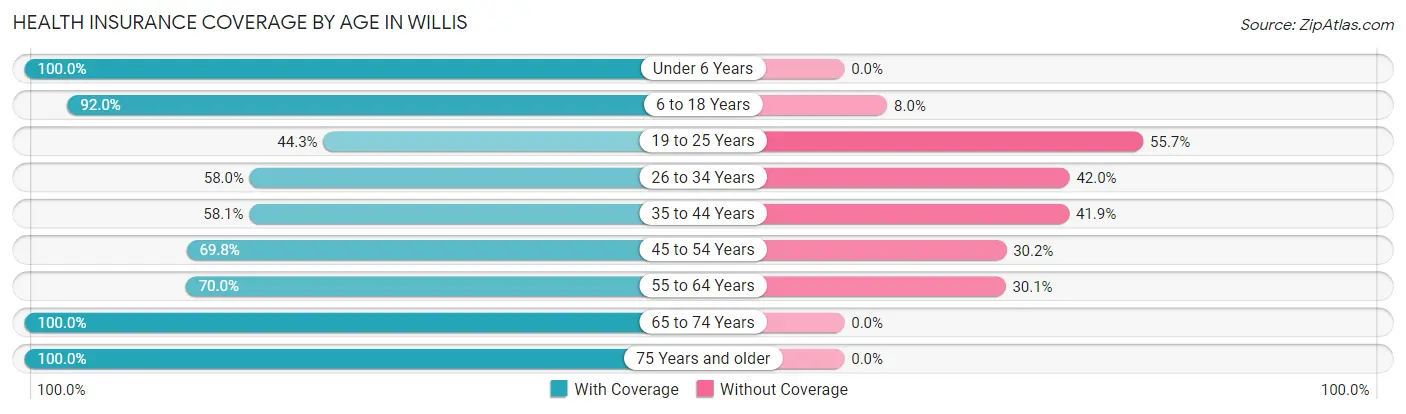
| Age Bracket | With Coverage | Without Coverage |
| Under 6 Years | 416 (100.0%) | 0 (0.0%) |
| 6 to 18 Years | 875 (92.0%) | 76 (8.0%) |
| 19 to 25 Years | 298 (44.3%) | 375 (55.7%) |
| 26 to 34 Years | 442 (58.0%) | 320 (42.0%) |
| 35 to 44 Years | 621 (58.1%) | 448 (41.9%) |
| 45 to 54 Years | 488 (69.8%) | 211 (30.2%) |
| 55 to 64 Years | 703 (70.0%) | 302 (30.0%) |
| 65 to 74 Years | 733 (100.0%) | 0 (0.0%) |
| 75 Years and older | 175 (100.0%) | 0 (0.0%) |
| Total | 4,751 (73.3%) | 1,732 (26.7%) |
Health Insurance Coverage by Citizenship Status in Willis
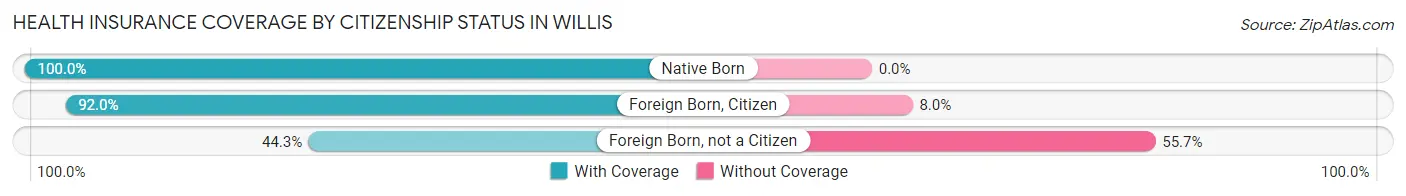
| Citizenship Status | With Coverage | Without Coverage |
| Native Born | 416 (100.0%) | 0 (0.0%) |
| Foreign Born, Citizen | 875 (92.0%) | 76 (8.0%) |
| Foreign Born, not a Citizen | 298 (44.3%) | 375 (55.7%) |
Health Insurance Coverage by Household Income in Willis
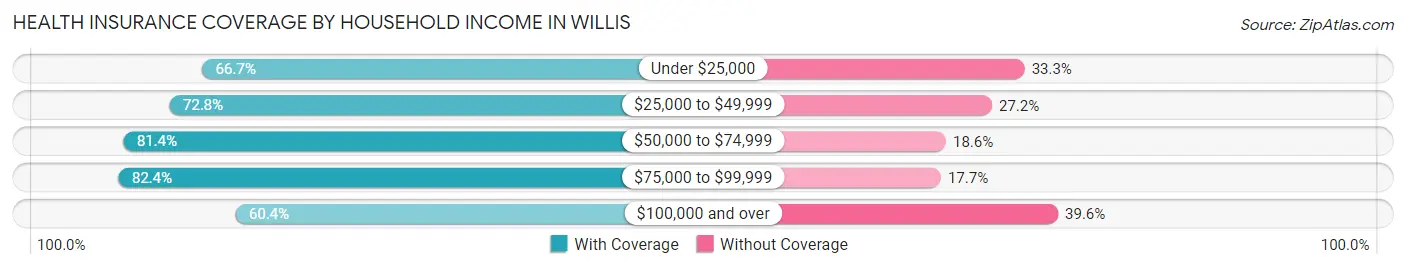
| Household Income | With Coverage | Without Coverage |
| Under $25,000 | 332 (66.7%) | 166 (33.3%) |
| $25,000 to $49,999 | 1,374 (72.8%) | 514 (27.2%) |
| $50,000 to $74,999 | 1,270 (81.4%) | 290 (18.6%) |
| $75,000 to $99,999 | 910 (82.4%) | 195 (17.6%) |
| $100,000 and over | 865 (60.4%) | 567 (39.6%) |
Public vs Private Health Insurance Coverage by Age in Willis
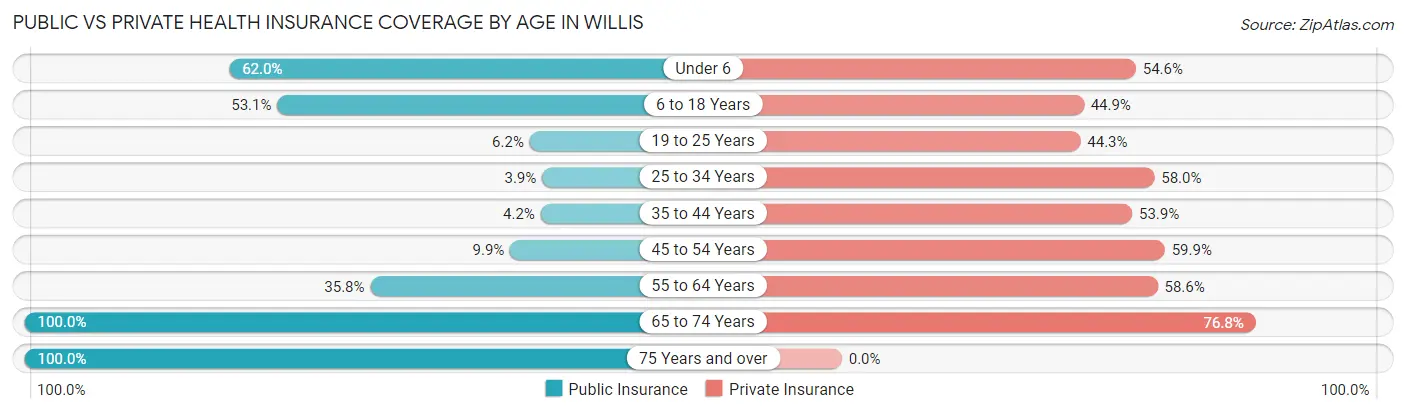
| Age Bracket | Public Insurance | Private Insurance |
| Under 6 | 258 (62.0%) | 227 (54.6%) |
| 6 to 18 Years | 505 (53.1%) | 427 (44.9%) |
| 19 to 25 Years | 42 (6.2%) | 298 (44.3%) |
| 25 to 34 Years | 30 (3.9%) | 442 (58.0%) |
| 35 to 44 Years | 45 (4.2%) | 576 (53.9%) |
| 45 to 54 Years | 69 (9.9%) | 419 (59.9%) |
| 55 to 64 Years | 360 (35.8%) | 589 (58.6%) |
| 65 to 74 Years | 733 (100.0%) | 563 (76.8%) |
| 75 Years and over | 175 (100.0%) | 0 (0.0%) |
| Total | 2,217 (34.2%) | 3,541 (54.6%) |
Disability Status by Sex by Age in Willis
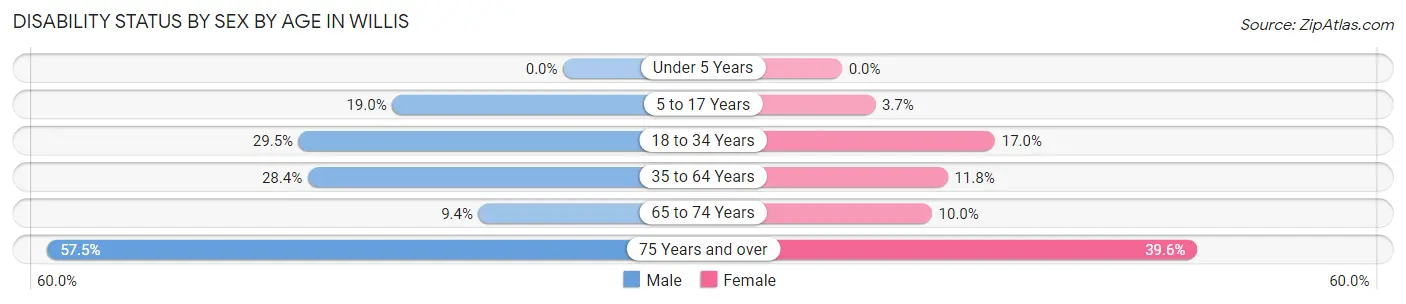
| Age Bracket | Male | Female |
| Under 5 Years | 0 (0.0%) | 0 (0.0%) |
| 5 to 17 Years | 67 (19.0%) | 21 (3.7%) |
| 18 to 34 Years | 298 (29.4%) | 83 (17.0%) |
| 35 to 64 Years | 448 (28.4%) | 141 (11.8%) |
| 65 to 74 Years | 21 (9.4%) | 51 (10.0%) |
| 75 Years and over | 73 (57.5%) | 19 (39.6%) |
Disability Class by Sex by Age in Willis
Disability Class: Hearing Difficulty
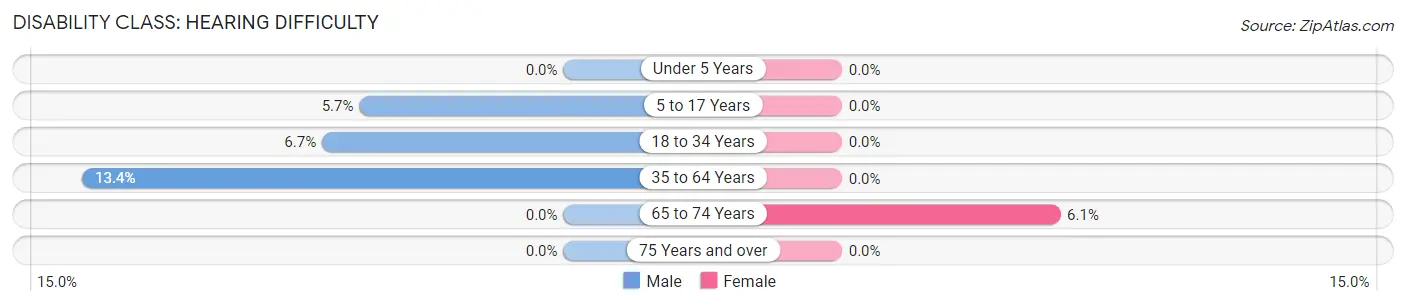
| Age Bracket | Male | Female |
| Under 5 Years | 0 (0.0%) | 0 (0.0%) |
| 5 to 17 Years | 20 (5.7%) | 0 (0.0%) |
| 18 to 34 Years | 68 (6.7%) | 0 (0.0%) |
| 35 to 64 Years | 211 (13.4%) | 0 (0.0%) |
| 65 to 74 Years | 0 (0.0%) | 31 (6.1%) |
| 75 Years and over | 0 (0.0%) | 0 (0.0%) |
Disability Class: Vision Difficulty
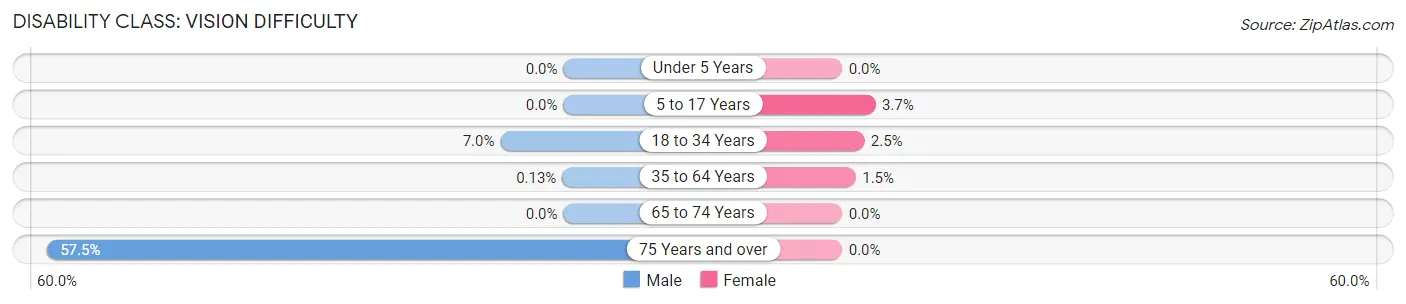
| Age Bracket | Male | Female |
| Under 5 Years | 0 (0.0%) | 0 (0.0%) |
| 5 to 17 Years | 0 (0.0%) | 21 (3.7%) |
| 18 to 34 Years | 71 (7.0%) | 12 (2.5%) |
| 35 to 64 Years | 2 (0.1%) | 18 (1.5%) |
| 65 to 74 Years | 0 (0.0%) | 0 (0.0%) |
| 75 Years and over | 73 (57.5%) | 0 (0.0%) |
Disability Class: Cognitive Difficulty
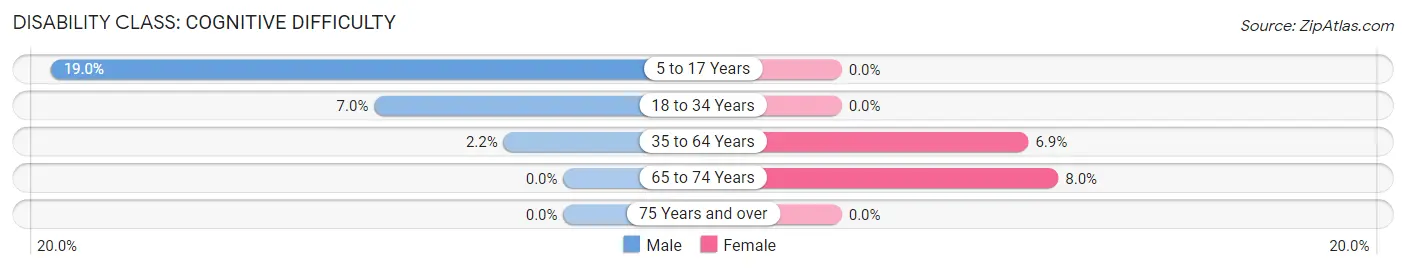
| Age Bracket | Male | Female |
| 5 to 17 Years | 67 (19.0%) | 0 (0.0%) |
| 18 to 34 Years | 71 (7.0%) | 0 (0.0%) |
| 35 to 64 Years | 35 (2.2%) | 83 (6.9%) |
| 65 to 74 Years | 0 (0.0%) | 41 (8.0%) |
| 75 Years and over | 0 (0.0%) | 0 (0.0%) |
Disability Class: Ambulatory Difficulty
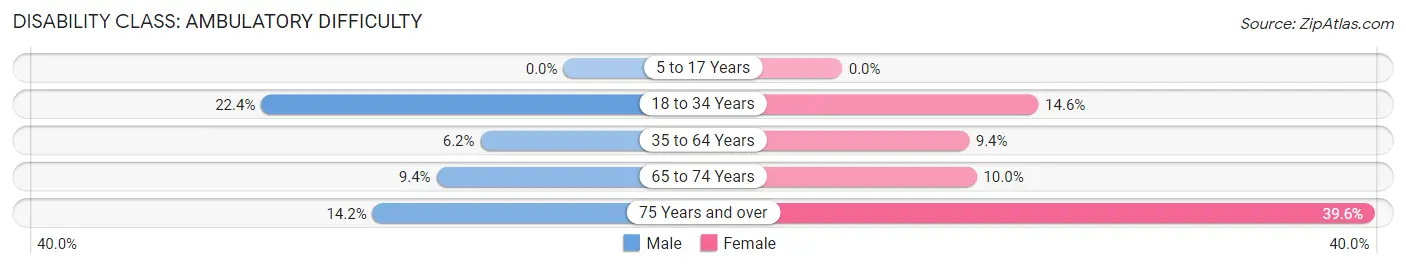
| Age Bracket | Male | Female |
| 5 to 17 Years | 0 (0.0%) | 0 (0.0%) |
| 18 to 34 Years | 227 (22.4%) | 71 (14.6%) |
| 35 to 64 Years | 97 (6.2%) | 113 (9.4%) |
| 65 to 74 Years | 21 (9.4%) | 51 (10.0%) |
| 75 Years and over | 18 (14.2%) | 19 (39.6%) |
Disability Class: Self-Care Difficulty
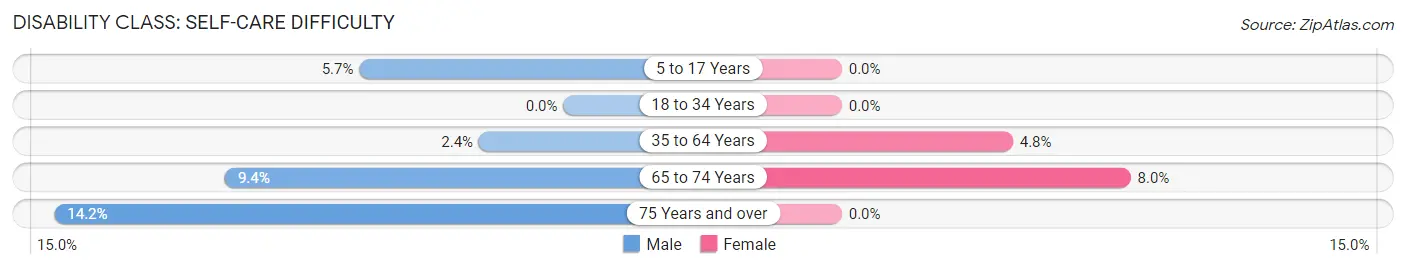
| Age Bracket | Male | Female |
| 5 to 17 Years | 20 (5.7%) | 0 (0.0%) |
| 18 to 34 Years | 0 (0.0%) | 0 (0.0%) |
| 35 to 64 Years | 37 (2.4%) | 57 (4.8%) |
| 65 to 74 Years | 21 (9.4%) | 41 (8.0%) |
| 75 Years and over | 18 (14.2%) | 0 (0.0%) |
Technology Access in Willis
Computing Device Access in Willis
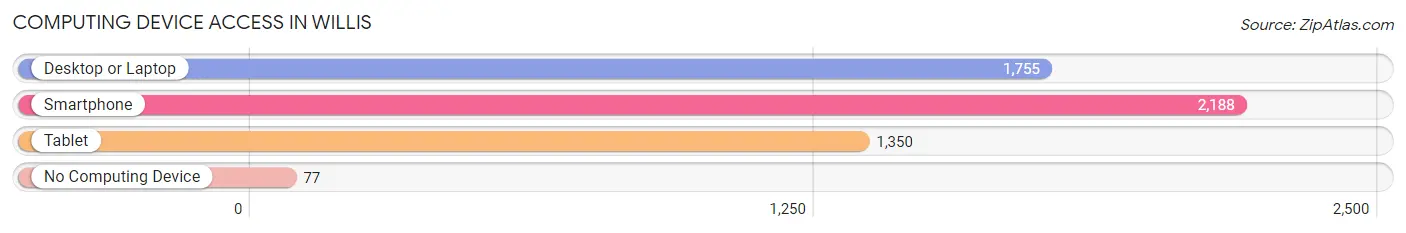
| Device Type | # Households | % Households |
| Desktop or Laptop | 1,755 | 74.7% |
| Smartphone | 2,188 | 93.1% |
| Tablet | 1,350 | 57.4% |
| No Computing Device | 77 | 3.3% |
| Total | 2,351 | 100.0% |
Internet Access in Willis
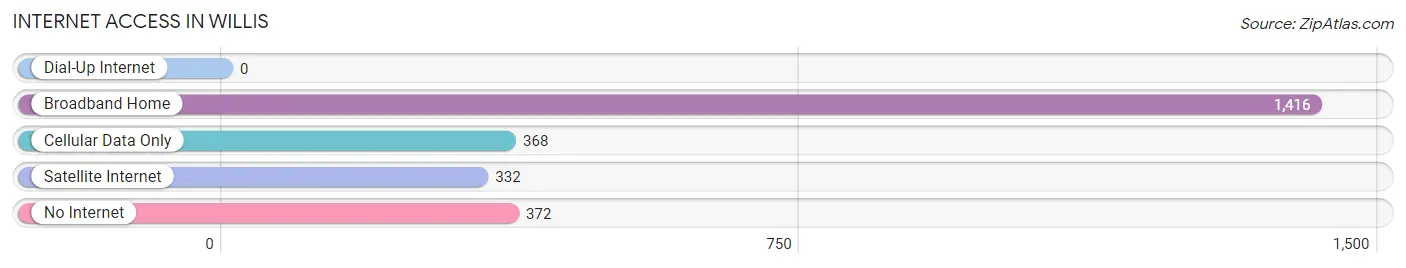
| Internet Type | # Households | % Households |
| Dial-Up Internet | 0 | 0.0% |
| Broadband Home | 1,416 | 60.2% |
| Cellular Data Only | 368 | 15.7% |
| Satellite Internet | 332 | 14.1% |
| No Internet | 372 | 15.8% |
| Total | 2,351 | 100.0% |
Willis Summary
Willis, Texas is a small city located in Montgomery County, Texas, United States. It is situated approximately 40 miles north of Houston and is part of the Houston–The Woodlands–Sugar Land metropolitan area. The city was founded in 1873 and was named after a local settler, Willis J. Miller. As of the 2010 census, the population of Willis was 5,662.
History
The area that is now Willis was originally inhabited by the Atakapan Indians. The first settlers in the area were the Miller family, who arrived in 1873. The family was led by Willis J. Miller, who was a veteran of the Civil War. Miller purchased land in the area and established a homestead. He also built a sawmill and a gristmill, which helped to attract other settlers to the area.
In 1879, the town of Willis was officially established and named after Miller. The town quickly grew and by the early 1900s, it had become a thriving community with a population of over 1,000. The town was home to several businesses, including a bank, a hotel, a cotton gin, and a lumber mill.
In the early 1900s, the town was also home to a large African-American population. The African-American community was centered around the town’s churches and schools. The town also had a thriving music scene, with several blues and jazz musicians performing in the area.
In the 1950s, the town began to decline as many of its residents moved away in search of better economic opportunities. By the 1970s, the population had dropped to just over 1,000. In the 1980s, the town began to experience a resurgence as new businesses moved into the area.
Geography
Willis is located in Montgomery County, Texas, approximately 40 miles north of Houston. The city is situated at the intersection of Interstate 45 and State Highway 75. The city covers an area of 4.3 square miles and has a population density of 1,312 people per square mile.
The city is located in a humid subtropical climate zone and experiences hot, humid summers and mild winters. The average annual temperature is 68 degrees Fahrenheit and the average annual precipitation is 45 inches.
Economy
Willis is a small city with a diverse economy. The city is home to several businesses, including manufacturing, retail, and healthcare. The city is also home to several educational institutions, including Sam Houston State University and Lone Star College.
The city’s largest employer is the Willis Independent School District, which employs over 1,000 people. Other major employers in the city include the Montgomery County Hospital District, the City of Willis, and the Willis Police Department.
Demographics
As of the 2010 census, the population of Willis was 5,662. The racial makeup of the city was 79.3% White, 11.2% African American, 0.7% Native American, 0.7% Asian, 0.1% Pacific Islander, 5.7% from other races, and 2.2% from two or more races. Hispanic or Latino of any race were 13.2% of the population.
The median household income in Willis was $41,945 and the median family income was $48,958. The per capita income in the city was $19,945. About 17.2% of the population was below the poverty line.
Willis is a small city with a rich history and a diverse economy. The city is home to several businesses, educational institutions, and a large African-American population. The city is also home to a thriving music scene and is a popular destination for tourists.
Common Questions
What is Per Capita Income in Willis?
Per Capita income in Willis is $22,060.
What is the Median Family Income in Willis?
Median Family Income in Willis is $65,565.
What is the Median Household income in Willis?
Median Household Income in Willis is $55,876.
What is Income or Wage Gap in Willis?
Income or Wage Gap in Willis is 31.5%.
Women in Willis earn 68.5 cents for every dollar earned by a man.
What is Inequality or Gini Index in Willis?
Inequality or Gini Index in Willis is 0.35.
What is the Total Population of Willis?
Total Population of Willis is 6,561.
What is the Total Male Population of Willis?
Total Male Population of Willis is 3,645.
What is the Total Female Population of Willis?
Total Female Population of Willis is 2,916.
What is the Ratio of Males per 100 Females in Willis?
There are 125.00 Males per 100 Females in Willis.
What is the Ratio of Females per 100 Males in Willis?
There are 80.00 Females per 100 Males in Willis.
What is the Median Population Age in Willis?
Median Population Age in Willis is 39.5 Years.
What is the Average Family Size in Willis
Average Family Size in Willis is 3.4 People.
What is the Average Household Size in Willis
Average Household Size in Willis is 2.8 People.
How Large is the Labor Force in Willis?
There are 3,389 People in the Labor Forcein in Willis.
What is the Percentage of People in the Labor Force in Willis?
63.7% of People are in the Labor Force in Willis.
What is the Unemployment Rate in Willis?
Unemployment Rate in Willis is 8.5%.