Wild Peach Village, TX Map & Demographics
Wild Peach Village Map
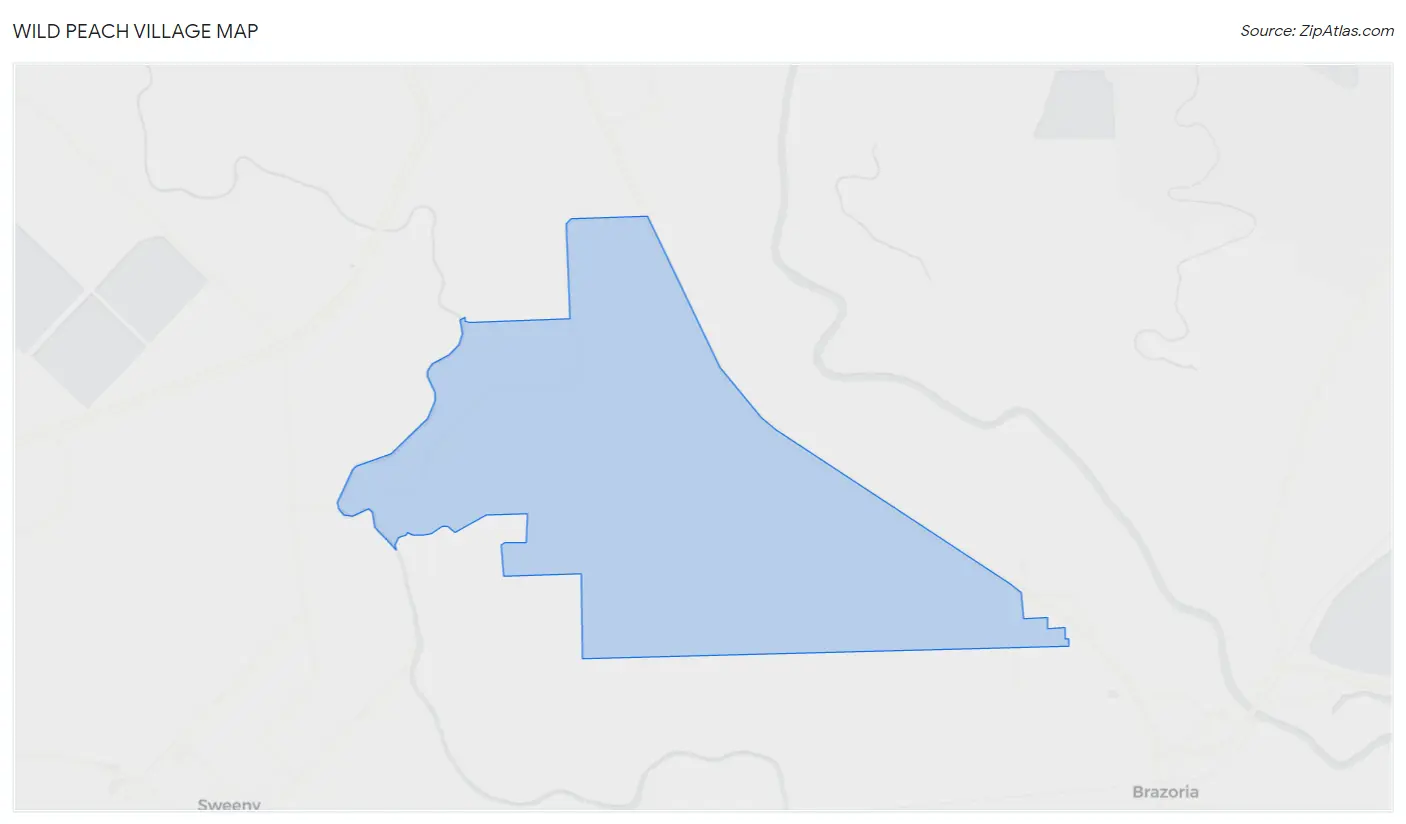
Wild Peach Village Overview
$32,923
PER CAPITA INCOME
$81,136
AVG FAMILY INCOME
$53,182
AVG HOUSEHOLD INCOME
30.4%
WAGE / INCOME GAP [ % ]
69.6¢/ $1
WAGE / INCOME GAP [ $ ]
0.42
INEQUALITY / GINI INDEX
2,325
TOTAL POPULATION
1,329
MALE POPULATION
996
FEMALE POPULATION
133.43
MALES / 100 FEMALES
74.94
FEMALES / 100 MALES
48.5
MEDIAN AGE
2.7
AVG FAMILY SIZE
2.2
AVG HOUSEHOLD SIZE
888
LABOR FORCE [ PEOPLE ]
46.7%
PERCENT IN LABOR FORCE
8.6%
UNEMPLOYMENT RATE
Income in Wild Peach Village
Income Overview in Wild Peach Village
Per Capita Income in Wild Peach Village is $32,923, while median incomes of families and households are $81,136 and $53,182 respectively.
| Characteristic | Number | Measure |
| Per Capita Income | 2,325 | $32,923 |
| Median Family Income | 724 | $81,136 |
| Mean Family Income | 724 | $86,501 |
| Median Household Income | 1,032 | $53,182 |
| Mean Household Income | 1,032 | $75,617 |
| Income Deficit | 724 | $0 |
| Wage / Income Gap (%) | 2,325 | 30.37% |
| Wage / Income Gap ($) | 2,325 | 69.63¢ per $1 |
| Gini / Inequality Index | 2,325 | 0.42 |
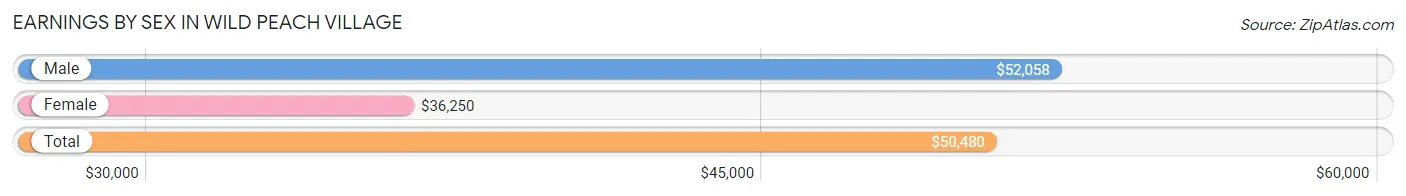
Earnings by Sex in Wild Peach Village
Average Earnings in Wild Peach Village are $50,480, $52,058 for men and $36,250 for women, a difference of 30.4%.
| Sex | Number | Average Earnings |
| Male | 581 (64.8%) | $52,058 |
| Female | 315 (35.2%) | $36,250 |
| Total | 896 (100.0%) | $50,480 |
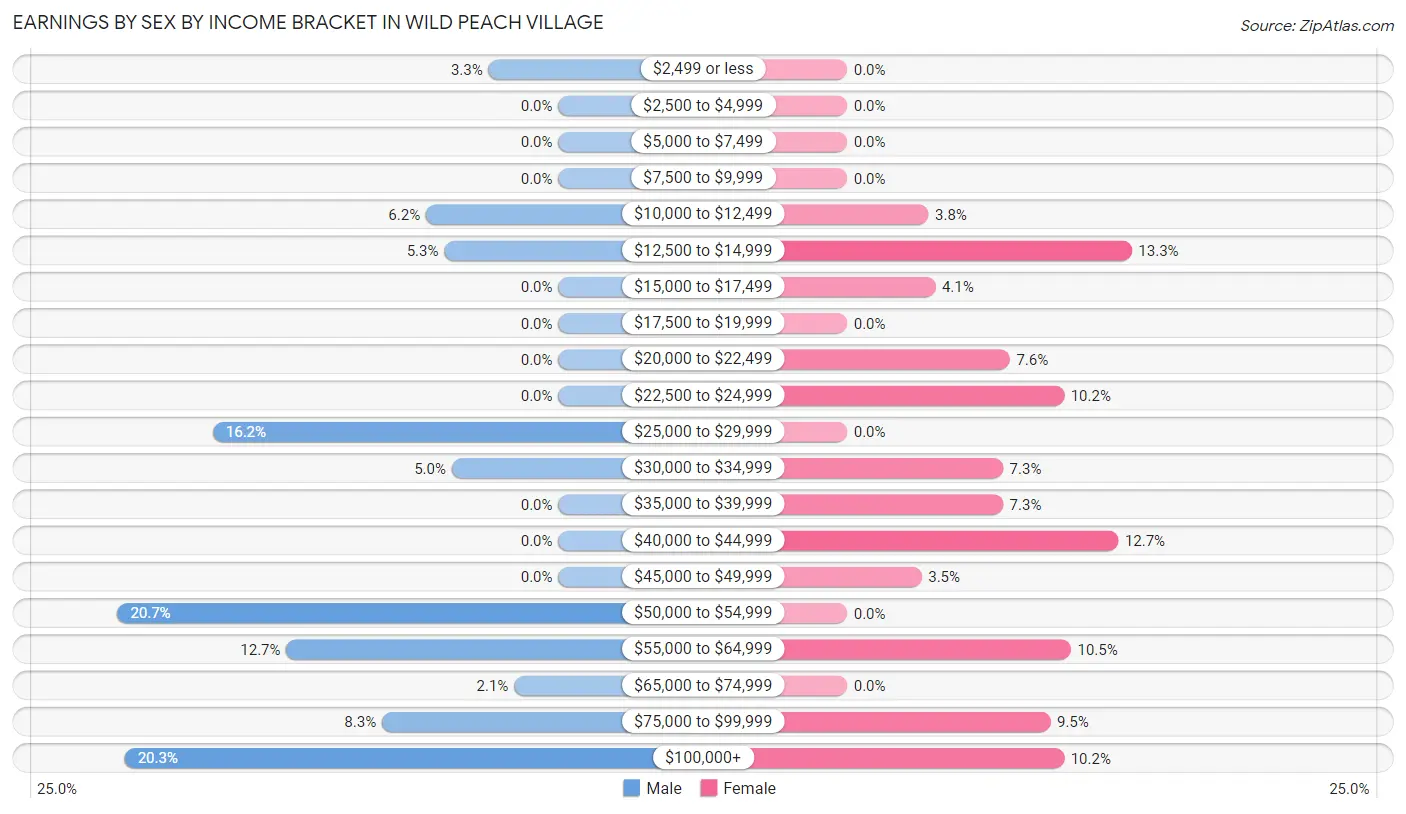
Earnings by Sex by Income Bracket in Wild Peach Village
The most common earnings brackets in Wild Peach Village are $50,000 to $54,999 for men (120 | 20.6%) and $12,500 to $14,999 for women (42 | 13.3%).
| Income | Male | Female |
| $2,499 or less | 19 (3.3%) | 0 (0.0%) |
| $2,500 to $4,999 | 0 (0.0%) | 0 (0.0%) |
| $5,000 to $7,499 | 0 (0.0%) | 0 (0.0%) |
| $7,500 to $9,999 | 0 (0.0%) | 0 (0.0%) |
| $10,000 to $12,499 | 36 (6.2%) | 12 (3.8%) |
| $12,500 to $14,999 | 31 (5.3%) | 42 (13.3%) |
| $15,000 to $17,499 | 0 (0.0%) | 13 (4.1%) |
| $17,500 to $19,999 | 0 (0.0%) | 0 (0.0%) |
| $20,000 to $22,499 | 0 (0.0%) | 24 (7.6%) |
| $22,500 to $24,999 | 0 (0.0%) | 32 (10.2%) |
| $25,000 to $29,999 | 94 (16.2%) | 0 (0.0%) |
| $30,000 to $34,999 | 29 (5.0%) | 23 (7.3%) |
| $35,000 to $39,999 | 0 (0.0%) | 23 (7.3%) |
| $40,000 to $44,999 | 0 (0.0%) | 40 (12.7%) |
| $45,000 to $49,999 | 0 (0.0%) | 11 (3.5%) |
| $50,000 to $54,999 | 120 (20.6%) | 0 (0.0%) |
| $55,000 to $64,999 | 74 (12.7%) | 33 (10.5%) |
| $65,000 to $74,999 | 12 (2.1%) | 0 (0.0%) |
| $75,000 to $99,999 | 48 (8.3%) | 30 (9.5%) |
| $100,000+ | 118 (20.3%) | 32 (10.2%) |
| Total | 581 (100.0%) | 315 (100.0%) |
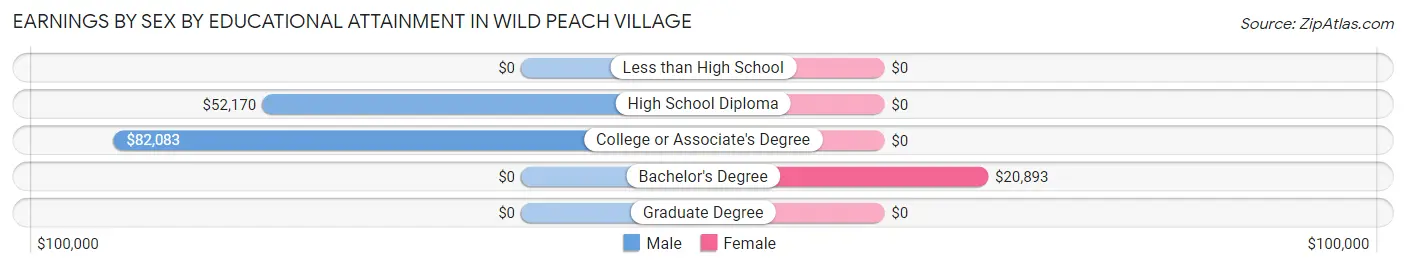
Earnings by Sex by Educational Attainment in Wild Peach Village
Average earnings in Wild Peach Village are $54,940 for men and $35,054 for women, a difference of 36.2%. Men with an educational attainment of college or associate's degree enjoy the highest average annual earnings of $82,083, while those with high school diploma education earn the least with $52,170. Women with an educational attainment of bachelor's degree earn the most with the average annual earnings of $20,893, while those with bachelor's degree education have the smallest earnings of $20,893.
| Educational Attainment | Male Income | Female Income |
| Less than High School | - | - |
| High School Diploma | $52,170 | $0 |
| College or Associate's Degree | $82,083 | $0 |
| Bachelor's Degree | - | - |
| Graduate Degree | - | - |
| Total | $54,940 | $35,054 |
Family Income in Wild Peach Village
Family Income Brackets in Wild Peach Village
According to the Wild Peach Village family income data, there are 231 families falling into the $100,000 to $149,999 income range, which is the most common income bracket and makes up 31.9% of all families.
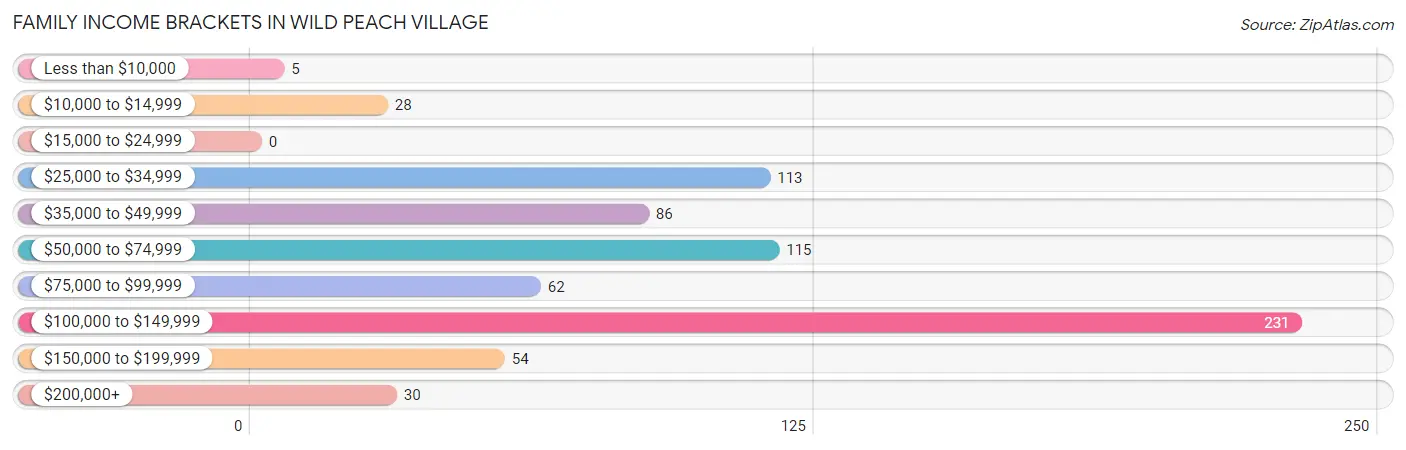
| Income Bracket | # Families | % Families |
| Less than $10,000 | 5 | 0.7% |
| $10,000 to $14,999 | 28 | 3.9% |
| $15,000 to $24,999 | 0 | 0.0% |
| $25,000 to $34,999 | 113 | 15.6% |
| $35,000 to $49,999 | 86 | 11.9% |
| $50,000 to $74,999 | 115 | 15.9% |
| $75,000 to $99,999 | 62 | 8.6% |
| $100,000 to $149,999 | 231 | 31.9% |
| $150,000 to $199,999 | 54 | 7.5% |
| $200,000+ | 30 | 4.1% |
Family Income by Famaliy Size in Wild Peach Village
3-person families (98 | 13.5%) account for the highest median family income in Wild Peach Village with $165,000 per family, while 3-person families (98 | 13.5%) have the highest median income of $55,000 per family member.
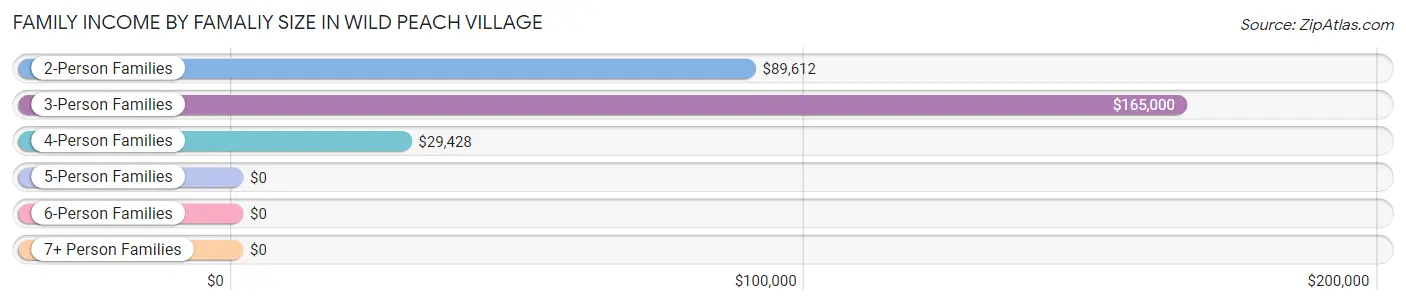
| Income Bracket | # Families | Median Income |
| 2-Person Families | 467 (64.5%) | $89,612 |
| 3-Person Families | 98 (13.5%) | $165,000 |
| 4-Person Families | 91 (12.6%) | $29,428 |
| 5-Person Families | 39 (5.4%) | $0 |
| 6-Person Families | 29 (4.0%) | $0 |
| 7+ Person Families | 0 (0.0%) | $0 |
| Total | 724 (100.0%) | $81,136 |
Family Income by Number of Earners in Wild Peach Village
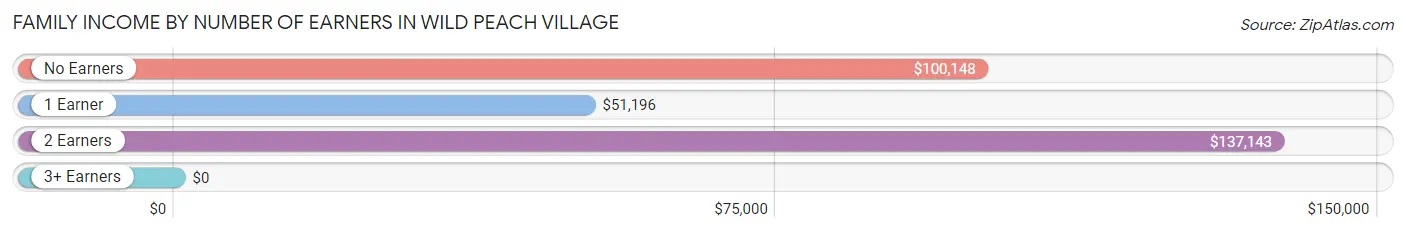
| Number of Earners | # Families | Median Income |
| No Earners | 222 (30.7%) | $100,148 |
| 1 Earner | 286 (39.5%) | $51,196 |
| 2 Earners | 206 (28.4%) | $137,143 |
| 3+ Earners | 10 (1.4%) | $0 |
| Total | 724 (100.0%) | $81,136 |
Household Income in Wild Peach Village
Household Income Brackets in Wild Peach Village
With 221 households falling in the category, the $100,000 to $149,999 income range is the most frequent in Wild Peach Village, accounting for 21.4% of all households. In contrast, only 19 households (1.8%) fall into the less than $10,000 income bracket, making it the least populous group.
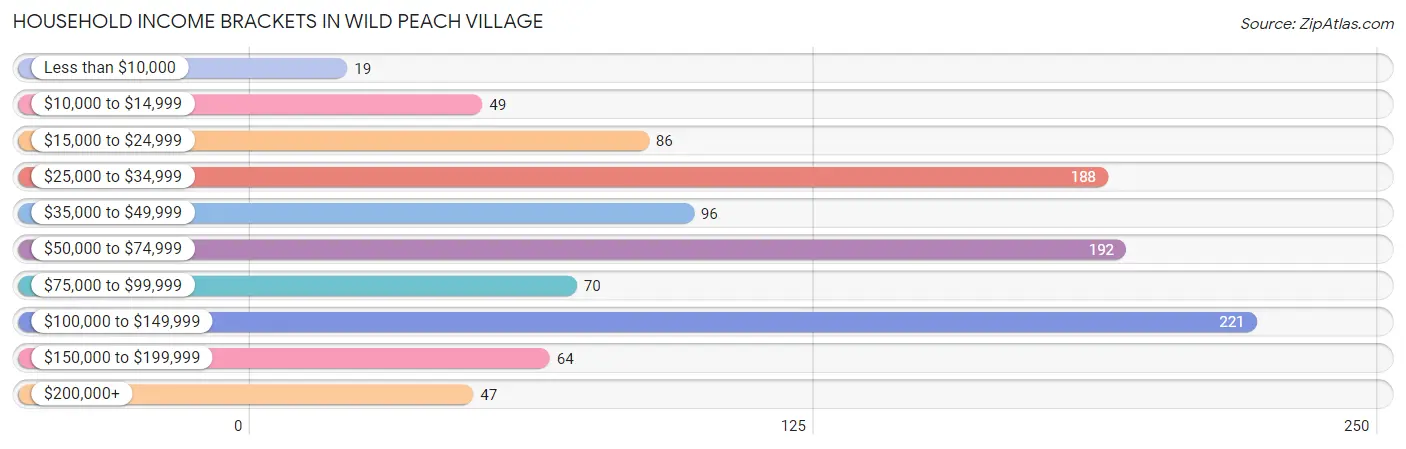
| Income Bracket | # Households | % Households |
| Less than $10,000 | 19 | 1.8% |
| $10,000 to $14,999 | 49 | 4.7% |
| $15,000 to $24,999 | 86 | 8.3% |
| $25,000 to $34,999 | 188 | 18.2% |
| $35,000 to $49,999 | 96 | 9.3% |
| $50,000 to $74,999 | 192 | 18.6% |
| $75,000 to $99,999 | 70 | 6.8% |
| $100,000 to $149,999 | 221 | 21.4% |
| $150,000 to $199,999 | 64 | 6.2% |
| $200,000+ | 47 | 4.6% |
Household Income by Householder Age in Wild Peach Village
The median household income in Wild Peach Village is $53,182, with the highest median household income of $118,125 found in the 45 to 64 years age bracket for the primary householder. A total of 275 households (26.7%) fall into this category. Meanwhile, the 15 to 24 years age bracket for the primary householder has the lowest median household income of $0, with 51 households (4.9%) in this group.
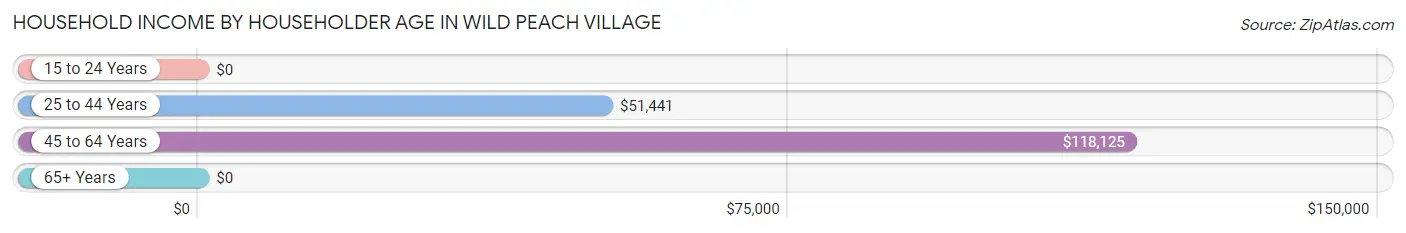
| Income Bracket | # Households | Median Income |
| 15 to 24 Years | 51 (4.9%) | $0 |
| 25 to 44 Years | 265 (25.7%) | $51,441 |
| 45 to 64 Years | 275 (26.7%) | $118,125 |
| 65+ Years | 441 (42.7%) | $0 |
| Total | 1,032 (100.0%) | $53,182 |
Poverty in Wild Peach Village
Income Below Poverty by Sex and Age in Wild Peach Village
With 18.4% poverty level for males and 9.6% for females among the residents of Wild Peach Village, 16 and 17 year old males and 5 year old females are the most vulnerable to poverty, with 31 males (100.0%) and 31 females (62.0%) in their respective age groups living below the poverty level.
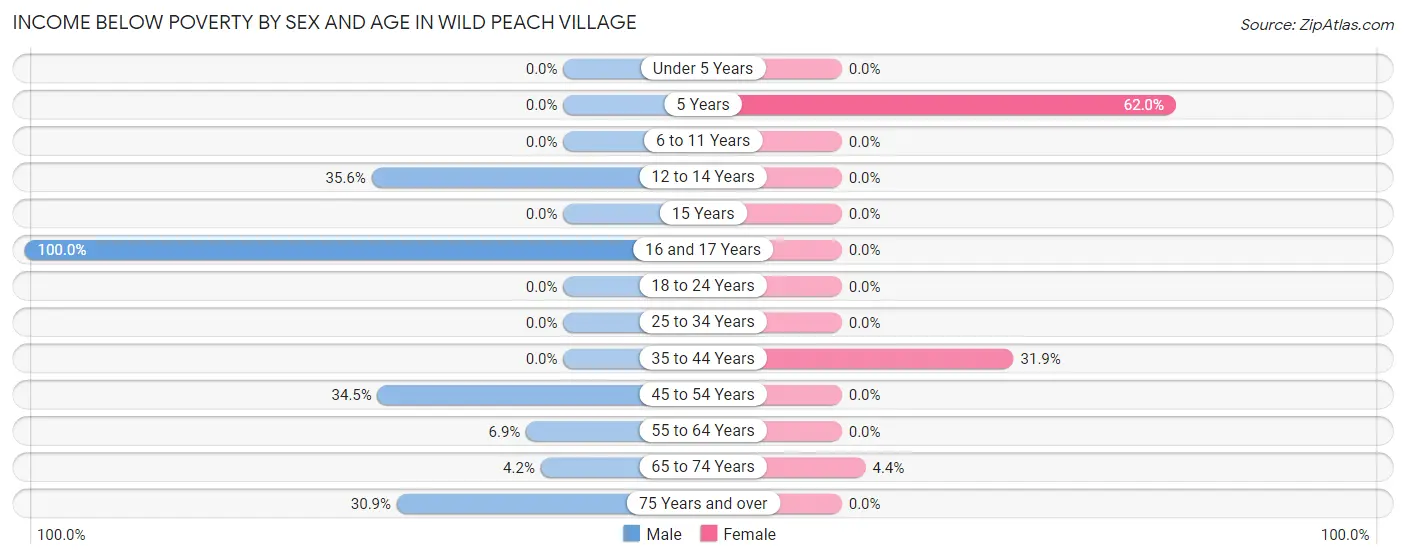
| Age Bracket | Male | Female |
| Under 5 Years | 0 (0.0%) | 0 (0.0%) |
| 5 Years | 0 (0.0%) | 31 (62.0%) |
| 6 to 11 Years | 0 (0.0%) | 0 (0.0%) |
| 12 to 14 Years | 42 (35.6%) | 0 (0.0%) |
| 15 Years | 0 (0.0%) | 0 (0.0%) |
| 16 and 17 Years | 31 (100.0%) | 0 (0.0%) |
| 18 to 24 Years | 0 (0.0%) | 0 (0.0%) |
| 25 to 34 Years | 0 (0.0%) | 0 (0.0%) |
| 35 to 44 Years | 0 (0.0%) | 59 (31.9%) |
| 45 to 54 Years | 80 (34.5%) | 0 (0.0%) |
| 55 to 64 Years | 14 (6.9%) | 0 (0.0%) |
| 65 to 74 Years | 5 (4.2%) | 6 (4.4%) |
| 75 Years and over | 72 (30.9%) | 0 (0.0%) |
| Total | 244 (18.4%) | 96 (9.6%) |
Income Above Poverty by Sex and Age in Wild Peach Village
According to the poverty statistics in Wild Peach Village, males aged 6 to 11 years and females aged under 5 years are the age groups that are most secure financially, with 100.0% of males and 100.0% of females in these age groups living above the poverty line.
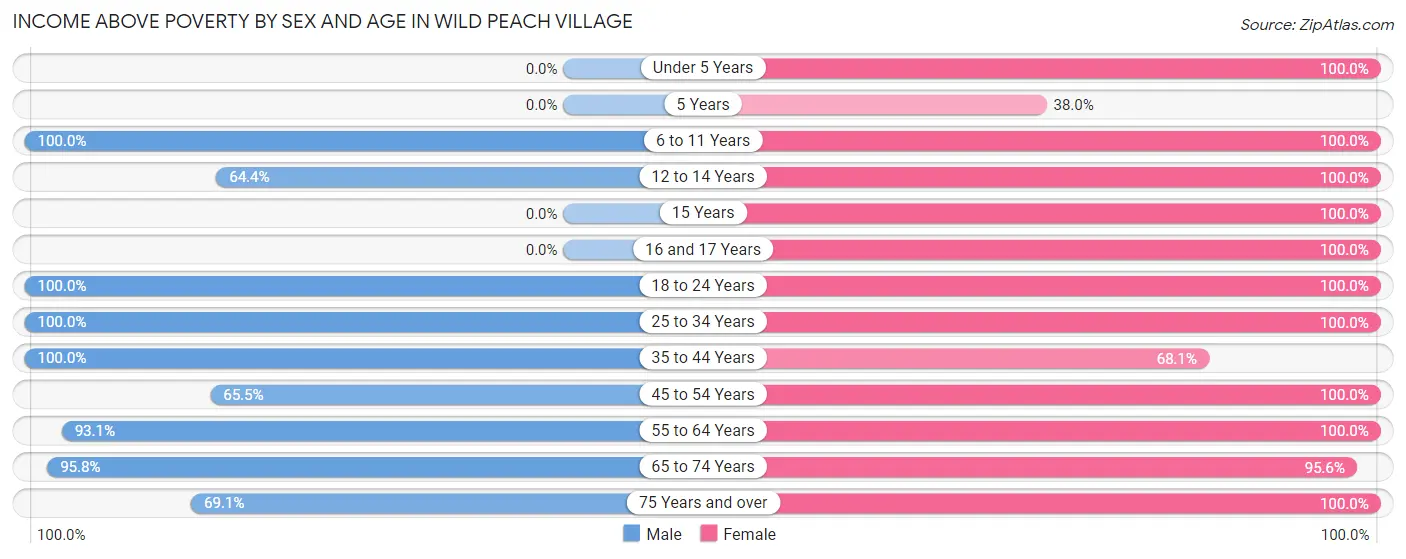
| Age Bracket | Male | Female |
| Under 5 Years | 0 (0.0%) | 11 (100.0%) |
| 5 Years | 0 (0.0%) | 19 (38.0%) |
| 6 to 11 Years | 121 (100.0%) | 20 (100.0%) |
| 12 to 14 Years | 76 (64.4%) | 74 (100.0%) |
| 15 Years | 0 (0.0%) | 29 (100.0%) |
| 16 and 17 Years | 0 (0.0%) | 11 (100.0%) |
| 18 to 24 Years | 76 (100.0%) | 22 (100.0%) |
| 25 to 34 Years | 69 (100.0%) | 53 (100.0%) |
| 35 to 44 Years | 127 (100.0%) | 126 (68.1%) |
| 45 to 54 Years | 152 (65.5%) | 97 (100.0%) |
| 55 to 64 Years | 189 (93.1%) | 124 (100.0%) |
| 65 to 74 Years | 114 (95.8%) | 130 (95.6%) |
| 75 Years and over | 161 (69.1%) | 184 (100.0%) |
| Total | 1,085 (81.6%) | 900 (90.4%) |
Income Below Poverty Among Married-Couple Families in Wild Peach Village
The poverty statistics for married-couple families in Wild Peach Village show that 10.7% or 64 of the total 599 families live below the poverty line. Families with 1 or 2 children have the highest poverty rate of 45.4%, comprising of 59 families. On the other hand, families with 3 or 4 children have the lowest poverty rate of 0.0%, which includes 0 families.
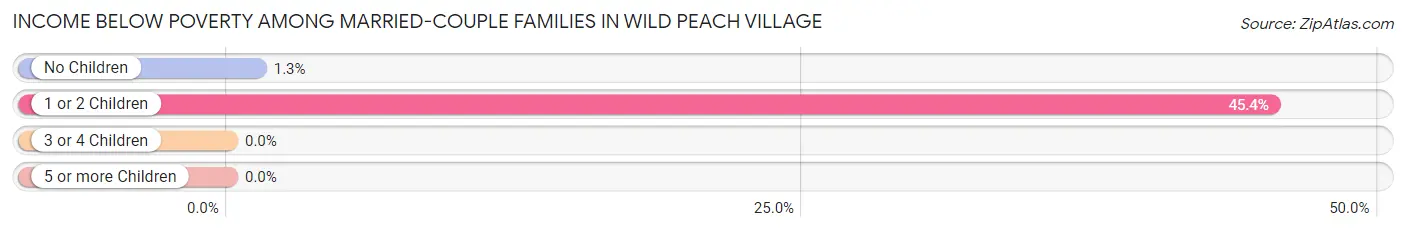
| Children | Above Poverty | Below Poverty |
| No Children | 396 (98.8%) | 5 (1.3%) |
| 1 or 2 Children | 71 (54.6%) | 59 (45.4%) |
| 3 or 4 Children | 68 (100.0%) | 0 (0.0%) |
| 5 or more Children | 0 (0.0%) | 0 (0.0%) |
| Total | 535 (89.3%) | 64 (10.7%) |
Income Below Poverty Among Single-Parent Households in Wild Peach Village
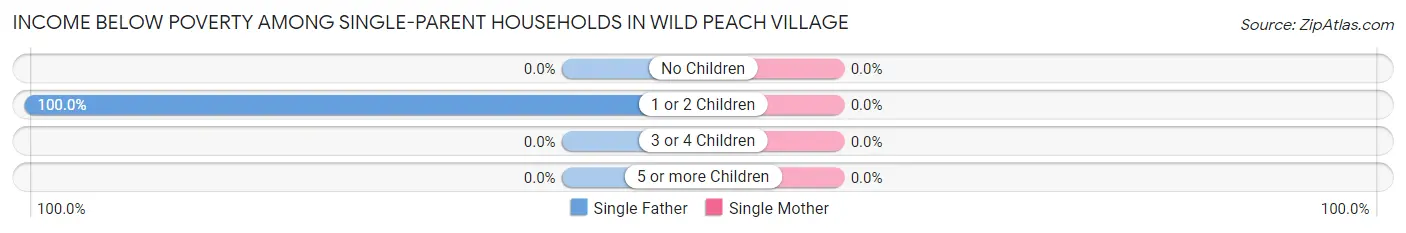
| Children | Single Father | Single Mother |
| No Children | 0 (0.0%) | 0 (0.0%) |
| 1 or 2 Children | 28 (100.0%) | 0 (0.0%) |
| 3 or 4 Children | 0 (0.0%) | 0 (0.0%) |
| 5 or more Children | 0 (0.0%) | 0 (0.0%) |
| Total | 28 (40.6%) | 0 (0.0%) |
Income Below Poverty Among Married-Couple vs Single-Parent Households in Wild Peach Village
The poverty data for Wild Peach Village shows that 64 of the married-couple family households (10.7%) and 28 of the single-parent households (22.4%) are living below the poverty level. Within the married-couple family households, those with 1 or 2 children have the highest poverty rate, with 59 households (45.4%) falling below the poverty line. Among the single-parent households, those with 1 or 2 children have the highest poverty rate, with 28 household (56.0%) living below poverty.
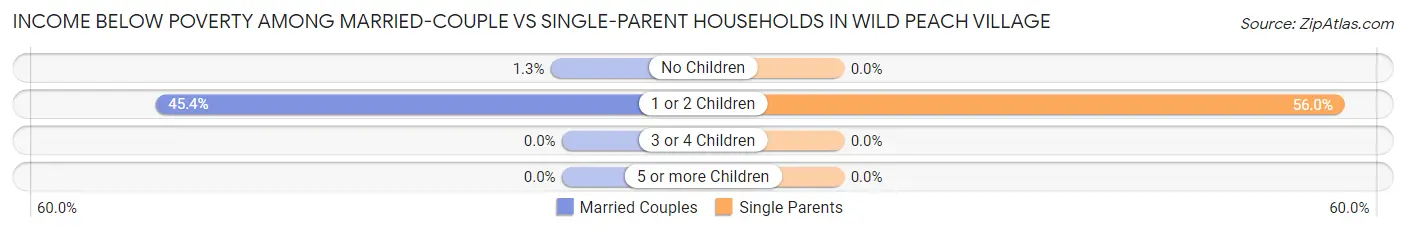
| Children | Married-Couple Families | Single-Parent Households |
| No Children | 5 (1.3%) | 0 (0.0%) |
| 1 or 2 Children | 59 (45.4%) | 28 (56.0%) |
| 3 or 4 Children | 0 (0.0%) | 0 (0.0%) |
| 5 or more Children | 0 (0.0%) | 0 (0.0%) |
| Total | 64 (10.7%) | 28 (22.4%) |
Race in Wild Peach Village
The most populous races in Wild Peach Village are White / Caucasian (1,980 | 85.2%), Hispanic or Latino (341 | 14.7%), and Black / African American (177 | 7.6%).
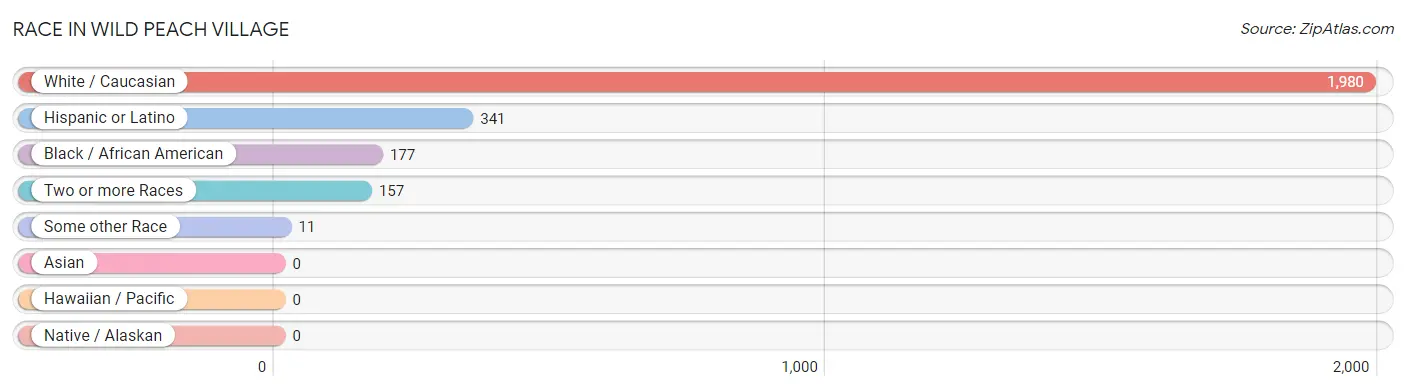
| Race | # Population | % Population |
| Asian | 0 | 0.0% |
| Black / African American | 177 | 7.6% |
| Hawaiian / Pacific | 0 | 0.0% |
| Hispanic or Latino | 341 | 14.7% |
| Native / Alaskan | 0 | 0.0% |
| White / Caucasian | 1,980 | 85.2% |
| Two or more Races | 157 | 6.8% |
| Some other Race | 11 | 0.5% |
| Total | 2,325 | 100.0% |
Ancestry in Wild Peach Village
The most populous ancestries reported in Wild Peach Village are British (333 | 14.3%), Mexican (327 | 14.1%), American (252 | 10.8%), Irish (252 | 10.8%), and English (171 | 7.3%), together accounting for 57.4% of all Wild Peach Village residents.
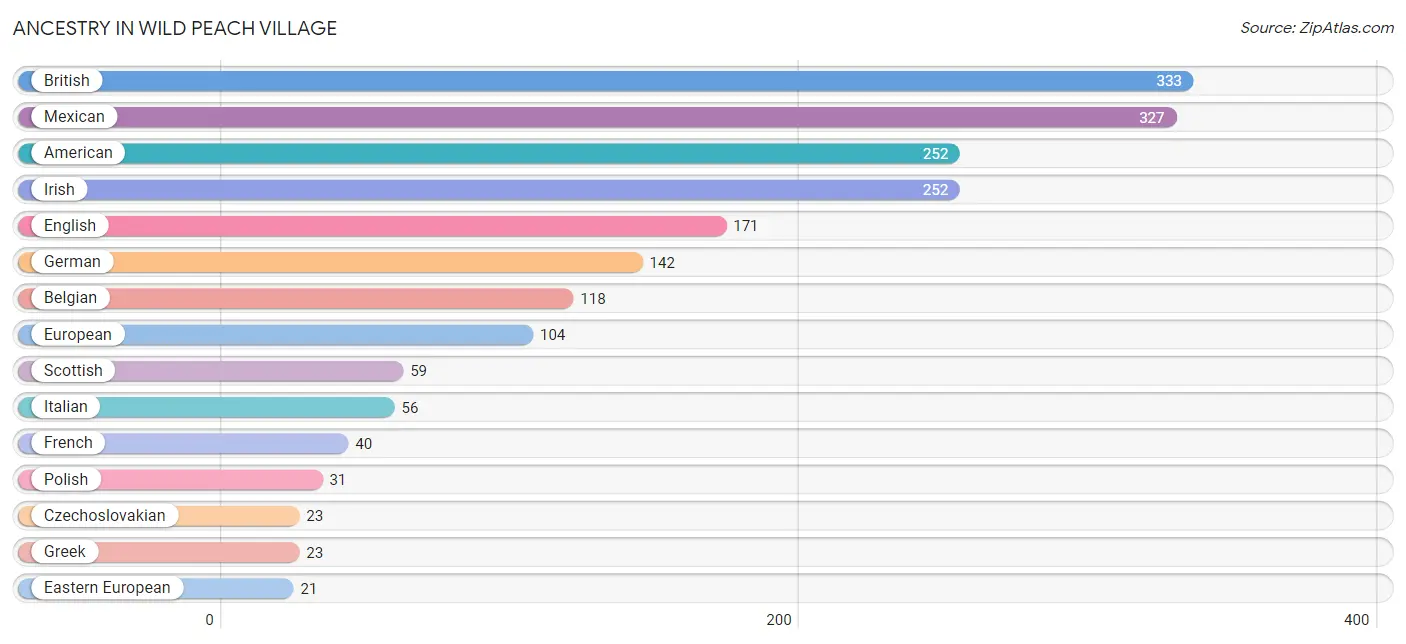
| Ancestry | # Population | % Population |
| American | 252 | 10.8% |
| Belgian | 118 | 5.1% |
| British | 333 | 14.3% |
| Central American | 14 | 0.6% |
| Cherokee | 3 | 0.1% |
| Czech | 12 | 0.5% |
| Czechoslovakian | 23 | 1.0% |
| Dutch | 9 | 0.4% |
| Eastern European | 21 | 0.9% |
| English | 171 | 7.3% |
| European | 104 | 4.5% |
| French | 40 | 1.7% |
| German | 142 | 6.1% |
| Greek | 23 | 1.0% |
| Guatemalan | 14 | 0.6% |
| Irish | 252 | 10.8% |
| Italian | 56 | 2.4% |
| Mexican | 327 | 14.1% |
| Polish | 31 | 1.3% |
| Scotch-Irish | 19 | 0.8% |
| Scottish | 59 | 2.5% |
| Welsh | 10 | 0.4% | View All 22 Rows |
Immigrants in Wild Peach Village
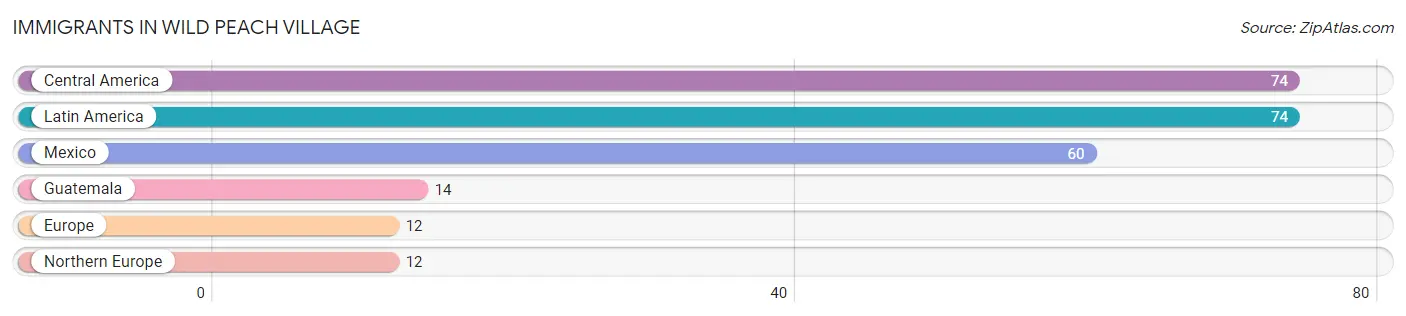
The most numerous immigrant groups reported in Wild Peach Village came from Central America (74 | 3.2%), Latin America (74 | 3.2%), Mexico (60 | 2.6%), Guatemala (14 | 0.6%), and Europe (12 | 0.5%), together accounting for 10.1% of all Wild Peach Village residents.
| Immigration Origin | # Population | % Population |
| Central America | 74 | 3.2% |
| Europe | 12 | 0.5% |
| Guatemala | 14 | 0.6% |
| Latin America | 74 | 3.2% |
| Mexico | 60 | 2.6% |
| Northern Europe | 12 | 0.5% | View All 6 Rows |
Sex and Age in Wild Peach Village
Sex and Age in Wild Peach Village
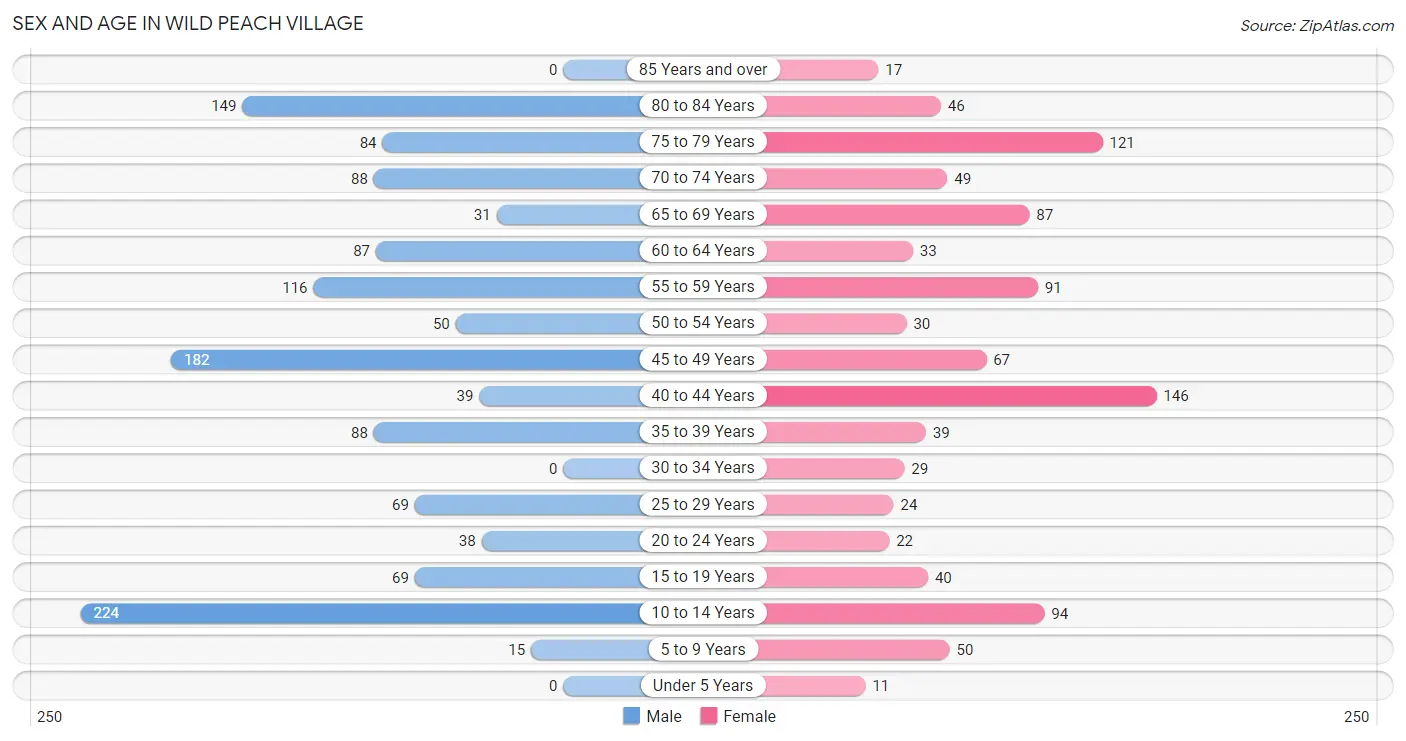
The most populous age groups in Wild Peach Village are 10 to 14 Years (224 | 16.9%) for men and 40 to 44 Years (146 | 14.7%) for women.
| Age Bracket | Male | Female |
| Under 5 Years | 0 (0.0%) | 11 (1.1%) |
| 5 to 9 Years | 15 (1.1%) | 50 (5.0%) |
| 10 to 14 Years | 224 (16.9%) | 94 (9.4%) |
| 15 to 19 Years | 69 (5.2%) | 40 (4.0%) |
| 20 to 24 Years | 38 (2.9%) | 22 (2.2%) |
| 25 to 29 Years | 69 (5.2%) | 24 (2.4%) |
| 30 to 34 Years | 0 (0.0%) | 29 (2.9%) |
| 35 to 39 Years | 88 (6.6%) | 39 (3.9%) |
| 40 to 44 Years | 39 (2.9%) | 146 (14.7%) |
| 45 to 49 Years | 182 (13.7%) | 67 (6.7%) |
| 50 to 54 Years | 50 (3.8%) | 30 (3.0%) |
| 55 to 59 Years | 116 (8.7%) | 91 (9.1%) |
| 60 to 64 Years | 87 (6.6%) | 33 (3.3%) |
| 65 to 69 Years | 31 (2.3%) | 87 (8.7%) |
| 70 to 74 Years | 88 (6.6%) | 49 (4.9%) |
| 75 to 79 Years | 84 (6.3%) | 121 (12.1%) |
| 80 to 84 Years | 149 (11.2%) | 46 (4.6%) |
| 85 Years and over | 0 (0.0%) | 17 (1.7%) |
| Total | 1,329 (100.0%) | 996 (100.0%) |
Families and Households in Wild Peach Village
Median Family Size in Wild Peach Village
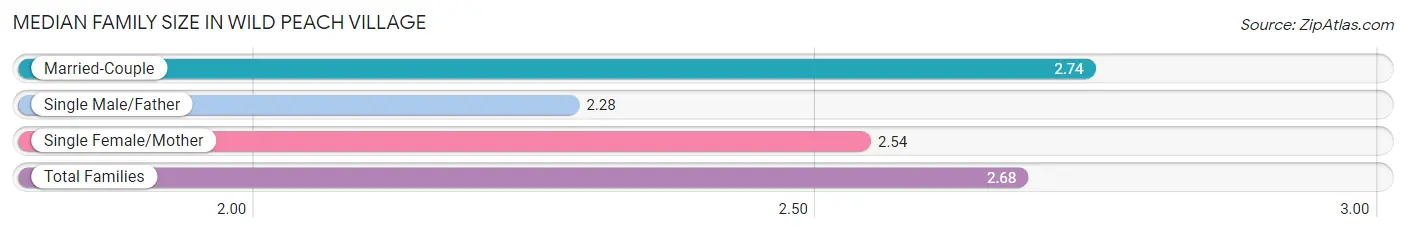
The median family size in Wild Peach Village is 2.68 persons per family, with married-couple families (599 | 82.7%) accounting for the largest median family size of 2.74 persons per family. On the other hand, single male/father families (69 | 9.5%) represent the smallest median family size with 2.28 persons per family.
| Family Type | # Families | Family Size |
| Married-Couple | 599 (82.7%) | 2.74 |
| Single Male/Father | 69 (9.5%) | 2.28 |
| Single Female/Mother | 56 (7.7%) | 2.54 |
| Total Families | 724 (100.0%) | 2.68 |
Median Household Size in Wild Peach Village
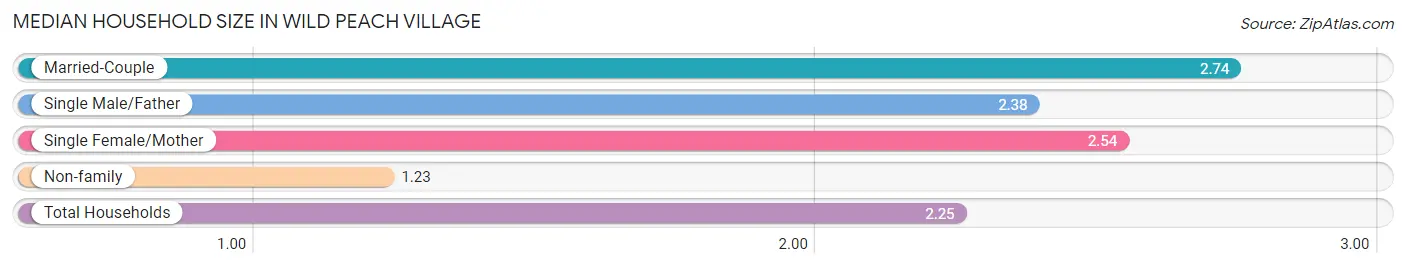
The median household size in Wild Peach Village is 2.25 persons per household, with married-couple households (599 | 58.0%) accounting for the largest median household size of 2.74 persons per household. non-family households (308 | 29.8%) represent the smallest median household size with 1.23 persons per household.
| Household Type | # Households | Household Size |
| Married-Couple | 599 (58.0%) | 2.74 |
| Single Male/Father | 69 (6.7%) | 2.38 |
| Single Female/Mother | 56 (5.4%) | 2.54 |
| Non-family | 308 (29.8%) | 1.23 |
| Total Households | 1,032 (100.0%) | 2.25 |
Household Size by Marriage Status in Wild Peach Village
Out of a total of 1,032 households in Wild Peach Village, 724 (70.2%) are family households, while 308 (29.8%) are nonfamily households. The most numerous type of family households are 2-person households, comprising 457, and the most common type of nonfamily households are 1-person households, comprising 272.
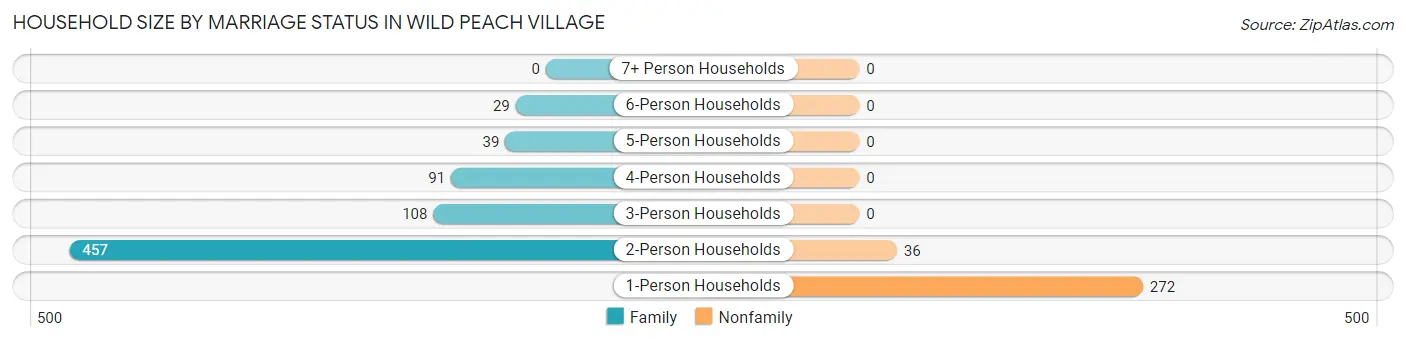
| Household Size | Family Households | Nonfamily Households |
| 1-Person Households | - | 272 (26.4%) |
| 2-Person Households | 457 (44.3%) | 36 (3.5%) |
| 3-Person Households | 108 (10.5%) | 0 (0.0%) |
| 4-Person Households | 91 (8.8%) | 0 (0.0%) |
| 5-Person Households | 39 (3.8%) | 0 (0.0%) |
| 6-Person Households | 29 (2.8%) | 0 (0.0%) |
| 7+ Person Households | 0 (0.0%) | 0 (0.0%) |
| Total | 724 (70.2%) | 308 (29.8%) |
Female Fertility in Wild Peach Village
Fertility by Age in Wild Peach Village
| Age Bracket | Women with Births | Births / 1,000 Women |
| 15 to 19 years | 0 (0.0%) | 0.0 |
| 20 to 34 years | 0 (0.0%) | 0.0 |
| 35 to 50 years | 0 (0.0%) | 0.0 |
| Total | 0 (0.0%) | 0.0 |
Fertility by Age by Marriage Status in Wild Peach Village
| Age Bracket | Married | Unmarried |
| 15 to 19 years | 0 (0.0%) | 0 (0.0%) |
| 20 to 34 years | 0 (0.0%) | 0 (0.0%) |
| 35 to 50 years | 0 (0.0%) | 0 (0.0%) |
| Total | 0 (0.0%) | 0 (0.0%) |
Fertility by Education in Wild Peach Village
| Educational Attainment | Women with Births | Births / 1,000 Women |
| Less than High School | 0 (0.0%) | 0.0 |
| High School Diploma | 0 (0.0%) | 0.0 |
| College or Associate's Degree | 0 (0.0%) | 0.0 |
| Bachelor's Degree | 0 (0.0%) | 0.0 |
| Graduate Degree | 0 (0.0%) | 0.0 |
| Total | 0 (0.0%) | 0.0 |
Fertility by Education by Marriage Status in Wild Peach Village
| Educational Attainment | Married | Unmarried |
| Less than High School | 0 (0.0%) | 0 (0.0%) |
| High School Diploma | 0 (0.0%) | 0 (0.0%) |
| College or Associate's Degree | 0 (0.0%) | 0 (0.0%) |
| Bachelor's Degree | 0 (0.0%) | 0 (0.0%) |
| Graduate Degree | 0 (0.0%) | 0 (0.0%) |
| Total | 0 (0.0%) | 0 (0.0%) |
Employment Characteristics in Wild Peach Village
Employment by Class of Employer in Wild Peach Village
Among the 812 employed individuals in Wild Peach Village, private company employees (589 | 72.5%), self-employed (not incorporated) (70 | 8.6%), and state government employees (65 | 8.0%) make up the most common classes of employment.
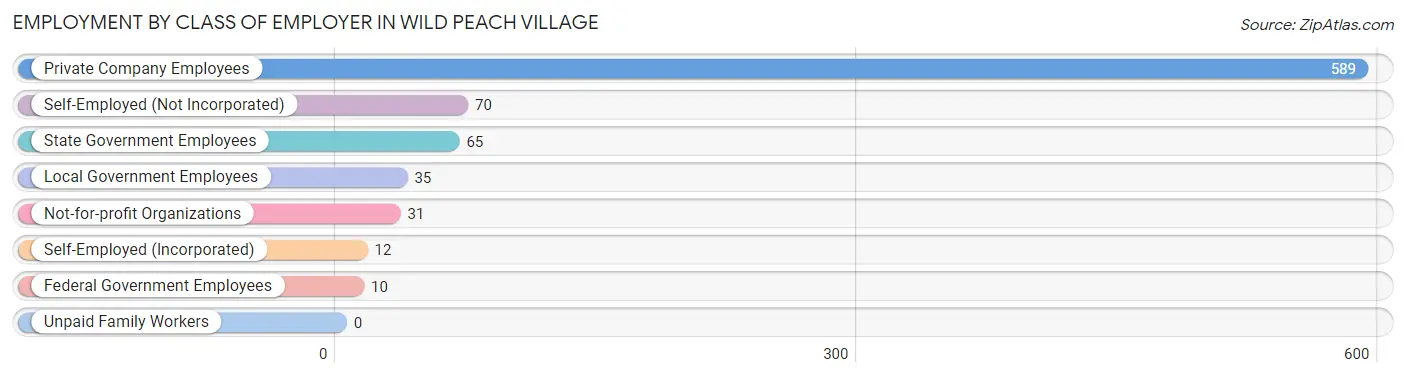
| Employer Class | # Employees | % Employees |
| Private Company Employees | 589 | 72.5% |
| Self-Employed (Incorporated) | 12 | 1.5% |
| Self-Employed (Not Incorporated) | 70 | 8.6% |
| Not-for-profit Organizations | 31 | 3.8% |
| Local Government Employees | 35 | 4.3% |
| State Government Employees | 65 | 8.0% |
| Federal Government Employees | 10 | 1.2% |
| Unpaid Family Workers | 0 | 0.0% |
| Total | 812 | 100.0% |
Employment Status by Age in Wild Peach Village
According to the labor force statistics for Wild Peach Village, out of the total population over 16 years of age (1,902), 46.7% or 888 individuals are in the labor force, with 8.6% or 76 of them unemployed. The age group with the highest labor force participation rate is 20 to 24 years, with 100.0% or 60 individuals in the labor force. Within the labor force, the 60 to 64 years age range has the highest percentage of unemployed individuals, with 50.8% or 31 of them being unemployed.
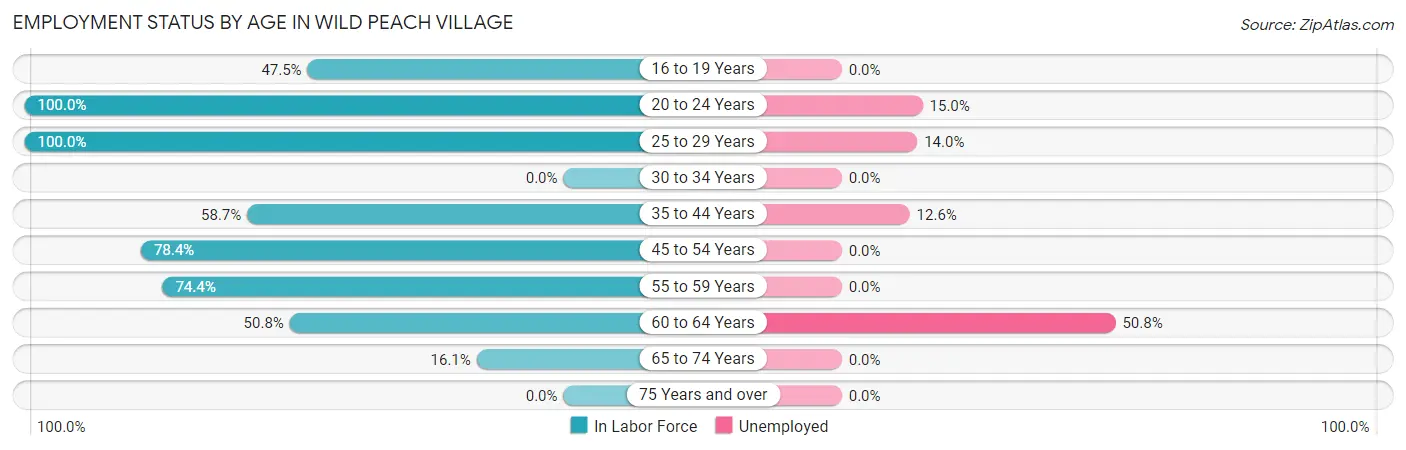
| Age Bracket | In Labor Force | Unemployed |
| 16 to 19 Years | 38 (47.5%) | 0 (0.0%) |
| 20 to 24 Years | 60 (100.0%) | 9 (15.0%) |
| 25 to 29 Years | 93 (100.0%) | 13 (14.0%) |
| 30 to 34 Years | 0 (0.0%) | 0 (0.0%) |
| 35 to 44 Years | 183 (58.7%) | 23 (12.6%) |
| 45 to 54 Years | 258 (78.4%) | 0 (0.0%) |
| 55 to 59 Years | 154 (74.4%) | 0 (0.0%) |
| 60 to 64 Years | 61 (50.8%) | 31 (50.8%) |
| 65 to 74 Years | 41 (16.1%) | 0 (0.0%) |
| 75 Years and over | 0 (0.0%) | 0 (0.0%) |
| Total | 888 (46.7%) | 76 (8.6%) |
Employment Status by Educational Attainment in Wild Peach Village
According to labor force statistics for Wild Peach Village, 68.7% of individuals (749) out of the total population between 25 and 64 years of age (1,090) are in the labor force, with 8.9% or 67 of them being unemployed. The group with the highest labor force participation rate are those with the educational attainment of bachelor's degree or higher, with 100.0% or 93 individuals in the labor force. Within the labor force, individuals with less than high school education have the highest percentage of unemployment, with 33.3% or 23 of them being unemployed.
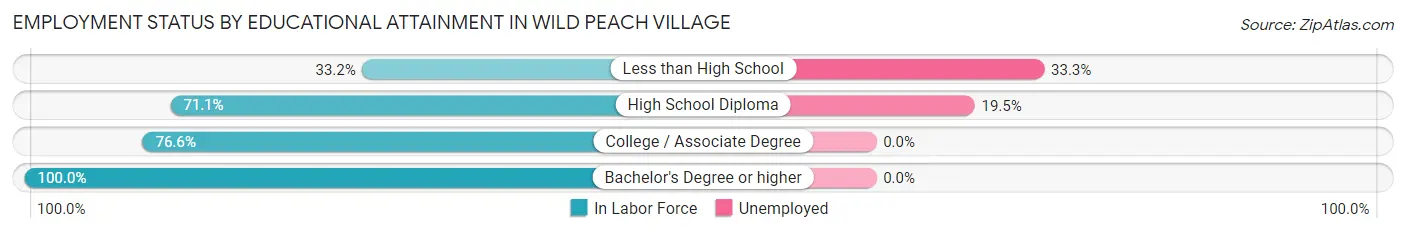
| Educational Attainment | In Labor Force | Unemployed |
| Less than High School | 69 (33.2%) | 69 (33.3%) |
| High School Diploma | 226 (71.1%) | 62 (19.5%) |
| College / Associate Degree | 361 (76.6%) | 0 (0.0%) |
| Bachelor's Degree or higher | 93 (100.0%) | 0 (0.0%) |
| Total | 749 (68.7%) | 97 (8.9%) |
Employment Occupations by Sex in Wild Peach Village
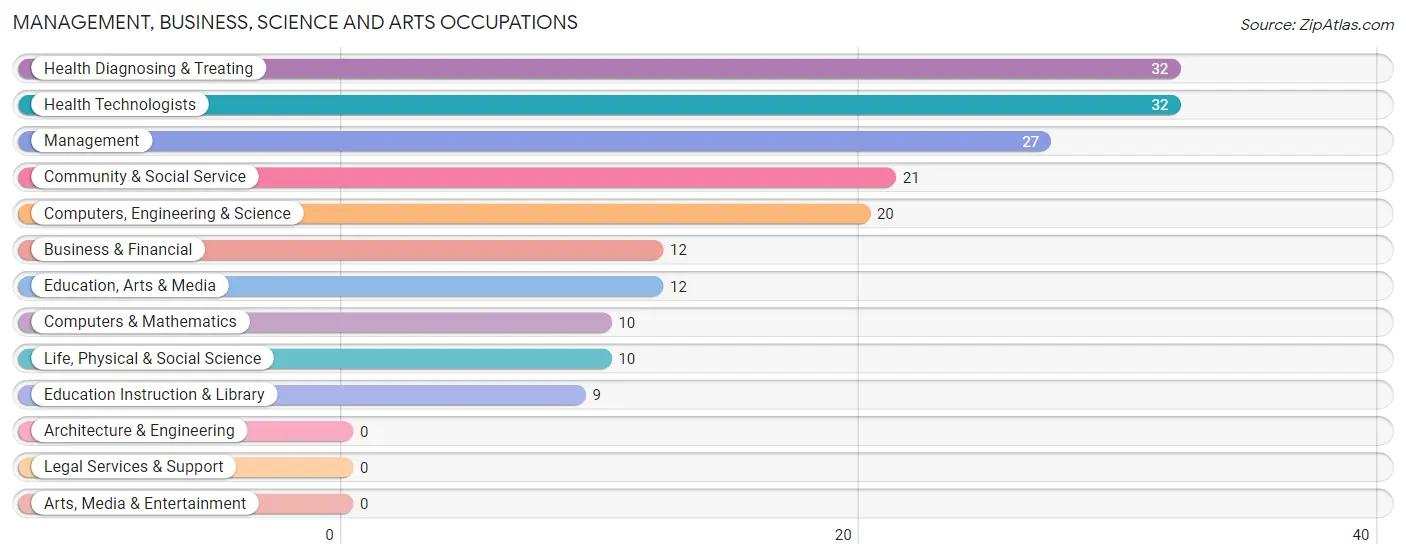
Management, Business, Science and Arts Occupations
The most common Management, Business, Science and Arts occupations in Wild Peach Village are Health Diagnosing & Treating (32 | 3.9%), Health Technologists (32 | 3.9%), Management (27 | 3.3%), Community & Social Service (21 | 2.6%), and Computers, Engineering & Science (20 | 2.5%).
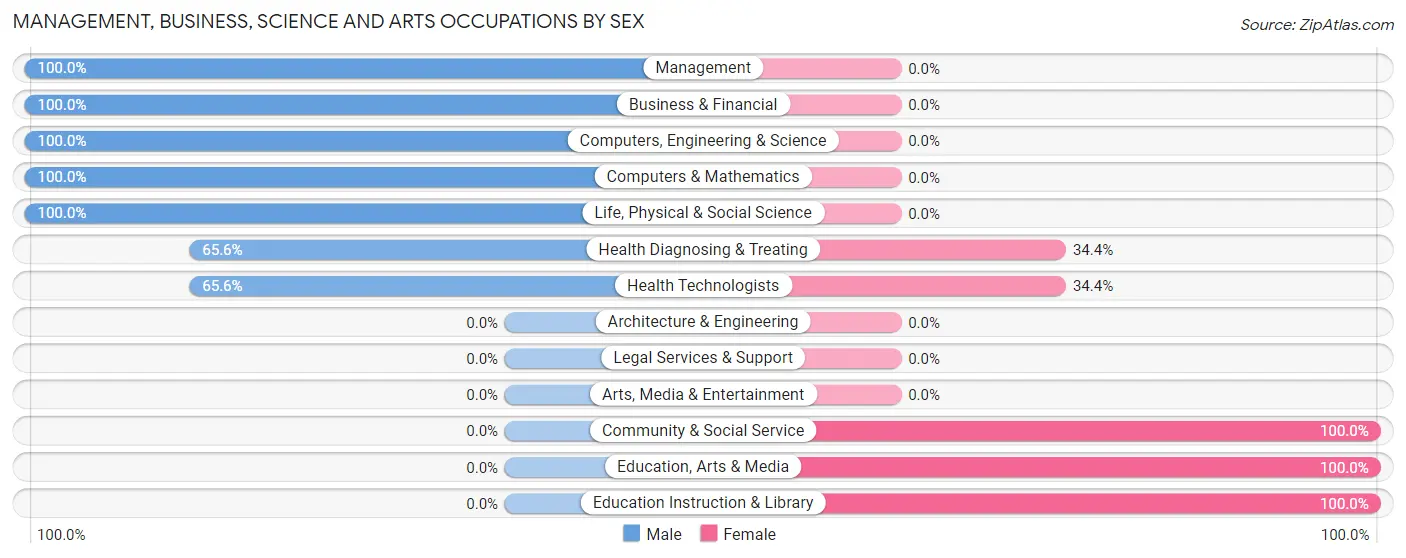
Management, Business, Science and Arts Occupations by Sex
Within the Management, Business, Science and Arts occupations in Wild Peach Village, the most male-oriented occupations are Management (100.0%), Business & Financial (100.0%), and Computers, Engineering & Science (100.0%), while the most female-oriented occupations are Community & Social Service (100.0%), Education, Arts & Media (100.0%), and Education Instruction & Library (100.0%).
| Occupation | Male | Female |
| Management | 27 (100.0%) | 0 (0.0%) |
| Business & Financial | 12 (100.0%) | 0 (0.0%) |
| Computers, Engineering & Science | 20 (100.0%) | 0 (0.0%) |
| Computers & Mathematics | 10 (100.0%) | 0 (0.0%) |
| Architecture & Engineering | 0 (0.0%) | 0 (0.0%) |
| Life, Physical & Social Science | 10 (100.0%) | 0 (0.0%) |
| Community & Social Service | 0 (0.0%) | 21 (100.0%) |
| Education, Arts & Media | 0 (0.0%) | 12 (100.0%) |
| Legal Services & Support | 0 (0.0%) | 0 (0.0%) |
| Education Instruction & Library | 0 (0.0%) | 9 (100.0%) |
| Arts, Media & Entertainment | 0 (0.0%) | 0 (0.0%) |
| Health Diagnosing & Treating | 21 (65.6%) | 11 (34.4%) |
| Health Technologists | 21 (65.6%) | 11 (34.4%) |
| Total (Category) | 80 (71.4%) | 32 (28.6%) |
| Total (Overall) | 533 (65.6%) | 279 (34.4%) |
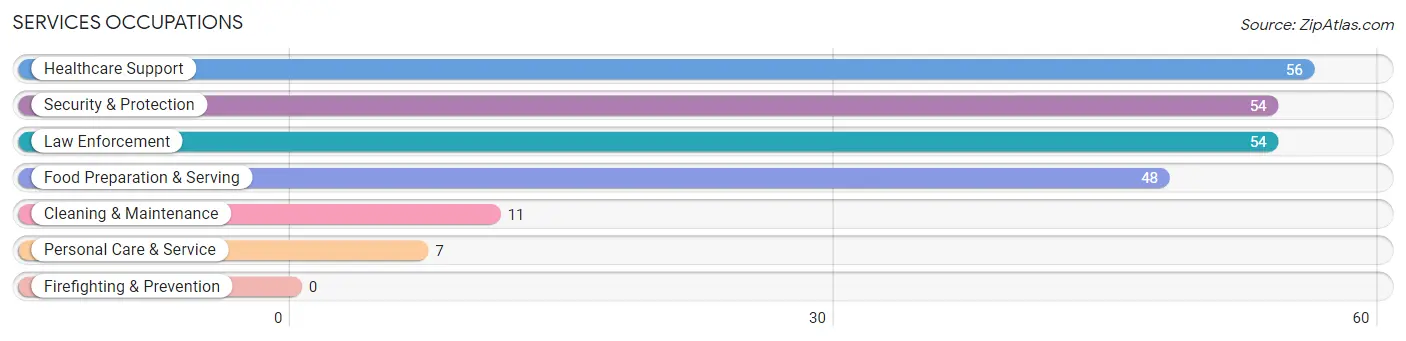
Services Occupations
The most common Services occupations in Wild Peach Village are Healthcare Support (56 | 6.9%), Security & Protection (54 | 6.7%), Law Enforcement (54 | 6.7%), Food Preparation & Serving (48 | 5.9%), and Cleaning & Maintenance (11 | 1.3%).
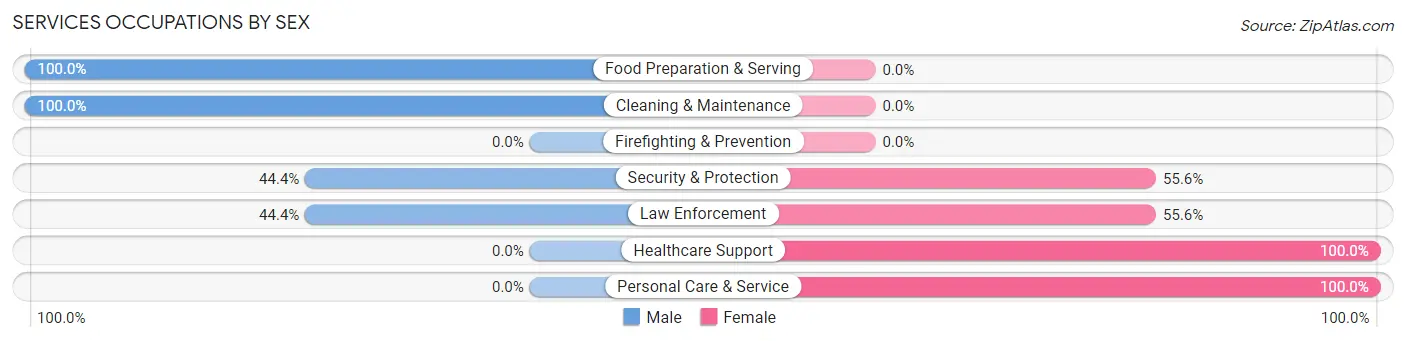
Services Occupations by Sex
Within the Services occupations in Wild Peach Village, the most male-oriented occupations are Food Preparation & Serving (100.0%), Cleaning & Maintenance (100.0%), and Security & Protection (44.4%), while the most female-oriented occupations are Healthcare Support (100.0%), Personal Care & Service (100.0%), and Security & Protection (55.6%).
| Occupation | Male | Female |
| Healthcare Support | 0 (0.0%) | 56 (100.0%) |
| Security & Protection | 24 (44.4%) | 30 (55.6%) |
| Firefighting & Prevention | 0 (0.0%) | 0 (0.0%) |
| Law Enforcement | 24 (44.4%) | 30 (55.6%) |
| Food Preparation & Serving | 48 (100.0%) | 0 (0.0%) |
| Cleaning & Maintenance | 11 (100.0%) | 0 (0.0%) |
| Personal Care & Service | 0 (0.0%) | 7 (100.0%) |
| Total (Category) | 83 (47.2%) | 93 (52.8%) |
| Total (Overall) | 533 (65.6%) | 279 (34.4%) |
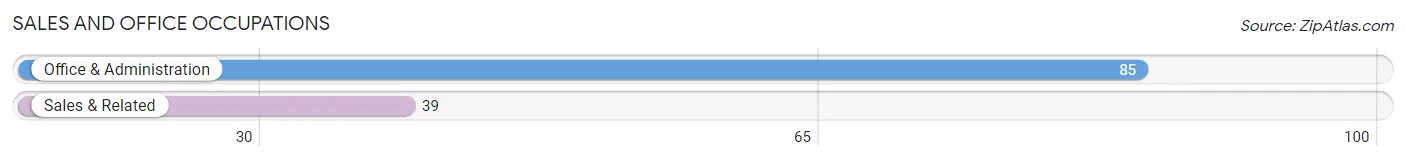
Sales and Office Occupations
The most common Sales and Office occupations in Wild Peach Village are Office & Administration (85 | 10.5%), and Sales & Related (39 | 4.8%).
Sales and Office Occupations by Sex
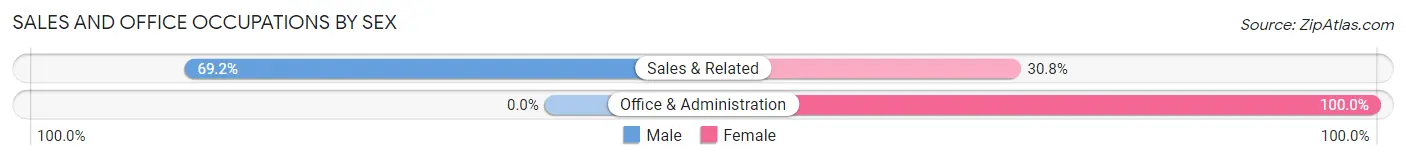
| Occupation | Male | Female |
| Sales & Related | 27 (69.2%) | 12 (30.8%) |
| Office & Administration | 0 (0.0%) | 85 (100.0%) |
| Total (Category) | 27 (21.8%) | 97 (78.2%) |
| Total (Overall) | 533 (65.6%) | 279 (34.4%) |
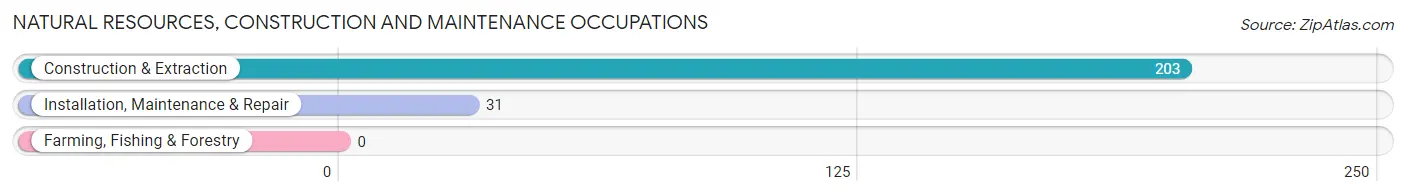
Natural Resources, Construction and Maintenance Occupations
The most common Natural Resources, Construction and Maintenance occupations in Wild Peach Village are Construction & Extraction (203 | 25.0%), and Installation, Maintenance & Repair (31 | 3.8%).
Natural Resources, Construction and Maintenance Occupations by Sex
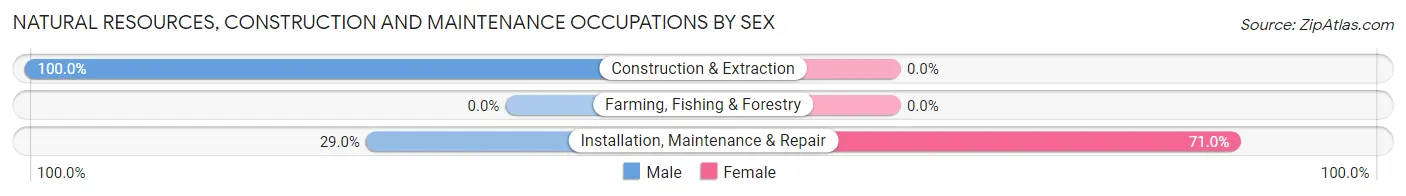
| Occupation | Male | Female |
| Farming, Fishing & Forestry | 0 (0.0%) | 0 (0.0%) |
| Construction & Extraction | 203 (100.0%) | 0 (0.0%) |
| Installation, Maintenance & Repair | 9 (29.0%) | 22 (71.0%) |
| Total (Category) | 212 (90.6%) | 22 (9.4%) |
| Total (Overall) | 533 (65.6%) | 279 (34.4%) |
Production, Transportation and Moving Occupations
The most common Production, Transportation and Moving occupations in Wild Peach Village are Material Moving (103 | 12.7%), and Production (63 | 7.8%).
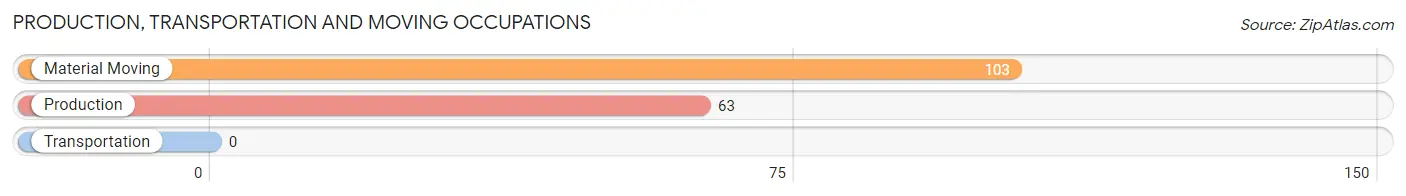
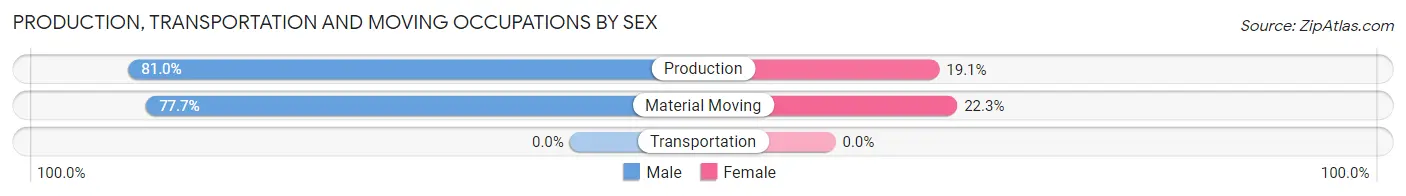
Production, Transportation and Moving Occupations by Sex
| Occupation | Male | Female |
| Production | 51 (80.9%) | 12 (19.1%) |
| Transportation | 0 (0.0%) | 0 (0.0%) |
| Material Moving | 80 (77.7%) | 23 (22.3%) |
| Total (Category) | 131 (78.9%) | 35 (21.1%) |
| Total (Overall) | 533 (65.6%) | 279 (34.4%) |
Employment Industries by Sex in Wild Peach Village
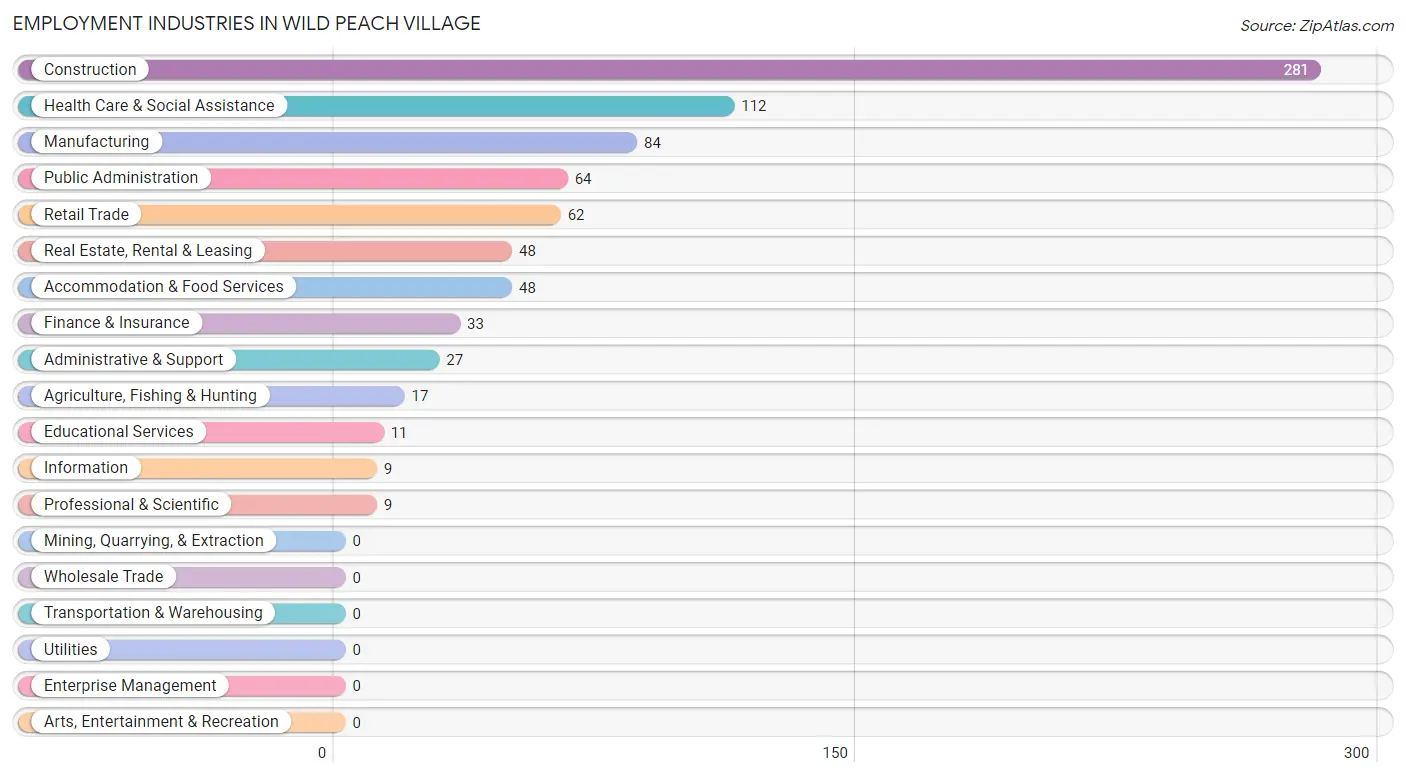
Employment Industries in Wild Peach Village
The major employment industries in Wild Peach Village include Construction (281 | 34.6%), Health Care & Social Assistance (112 | 13.8%), Manufacturing (84 | 10.3%), Public Administration (64 | 7.9%), and Retail Trade (62 | 7.6%).
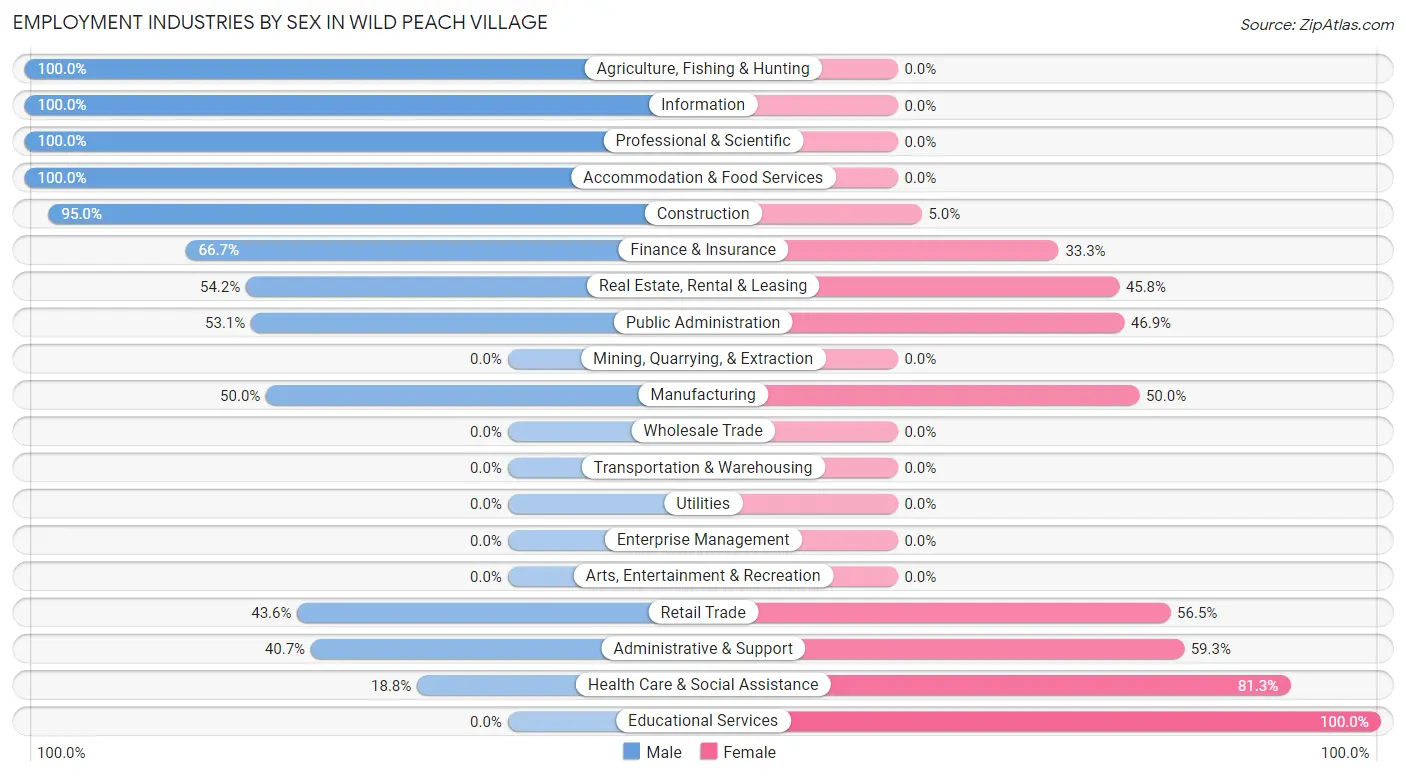
Employment Industries by Sex in Wild Peach Village
The Wild Peach Village industries that see more men than women are Agriculture, Fishing & Hunting (100.0%), Information (100.0%), and Professional & Scientific (100.0%), whereas the industries that tend to have a higher number of women are Educational Services (100.0%), Health Care & Social Assistance (81.2%), and Administrative & Support (59.3%).
| Industry | Male | Female |
| Agriculture, Fishing & Hunting | 17 (100.0%) | 0 (0.0%) |
| Mining, Quarrying, & Extraction | 0 (0.0%) | 0 (0.0%) |
| Construction | 267 (95.0%) | 14 (5.0%) |
| Manufacturing | 42 (50.0%) | 42 (50.0%) |
| Wholesale Trade | 0 (0.0%) | 0 (0.0%) |
| Retail Trade | 27 (43.5%) | 35 (56.5%) |
| Transportation & Warehousing | 0 (0.0%) | 0 (0.0%) |
| Utilities | 0 (0.0%) | 0 (0.0%) |
| Information | 9 (100.0%) | 0 (0.0%) |
| Finance & Insurance | 22 (66.7%) | 11 (33.3%) |
| Real Estate, Rental & Leasing | 26 (54.2%) | 22 (45.8%) |
| Professional & Scientific | 9 (100.0%) | 0 (0.0%) |
| Enterprise Management | 0 (0.0%) | 0 (0.0%) |
| Administrative & Support | 11 (40.7%) | 16 (59.3%) |
| Educational Services | 0 (0.0%) | 11 (100.0%) |
| Health Care & Social Assistance | 21 (18.8%) | 91 (81.2%) |
| Arts, Entertainment & Recreation | 0 (0.0%) | 0 (0.0%) |
| Accommodation & Food Services | 48 (100.0%) | 0 (0.0%) |
| Public Administration | 34 (53.1%) | 30 (46.9%) |
| Total | 533 (65.6%) | 279 (34.4%) |
Education in Wild Peach Village
School Enrollment in Wild Peach Village
The most common levels of schooling among the 486 students in Wild Peach Village are middle school (236 | 48.6%), high school (114 | 23.5%), and college / undergraduate (56 | 11.5%).
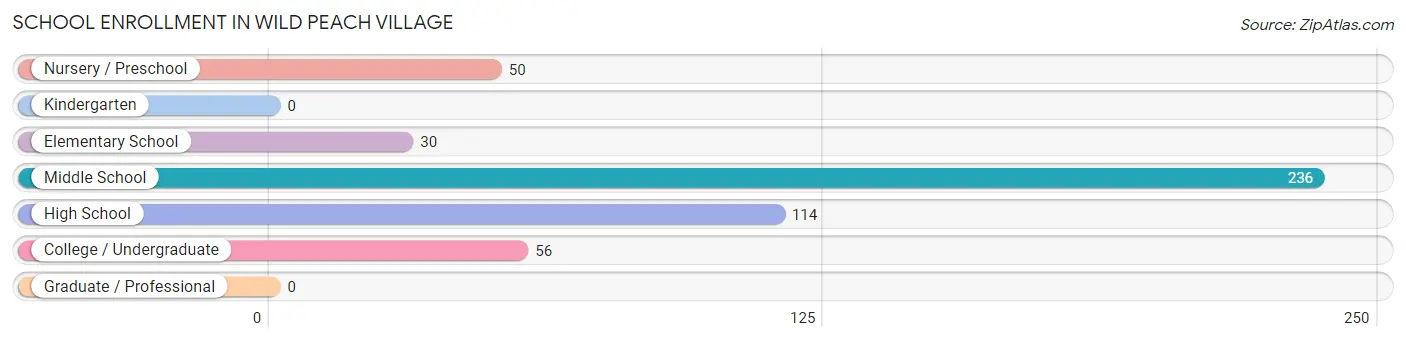
| School Level | # Students | % Students |
| Nursery / Preschool | 50 | 10.3% |
| Kindergarten | 0 | 0.0% |
| Elementary School | 30 | 6.2% |
| Middle School | 236 | 48.6% |
| High School | 114 | 23.5% |
| College / Undergraduate | 56 | 11.5% |
| Graduate / Professional | 0 | 0.0% |
| Total | 486 | 100.0% |
School Enrollment by Age by Funding Source in Wild Peach Village
Out of a total of 486 students who are enrolled in schools in Wild Peach Village, 126 (25.9%) attend a private institution, while the remaining 360 (74.1%) are enrolled in public schools. The age group of 10 to 14 year olds has the highest likelihood of being enrolled in private schools, with 96 (32.7% in the age bracket) enrolled. Conversely, the age group of 18 to 19 year olds has the lowest likelihood of being enrolled in a private school, with 27 (100.0% in the age bracket) attending a public institution.
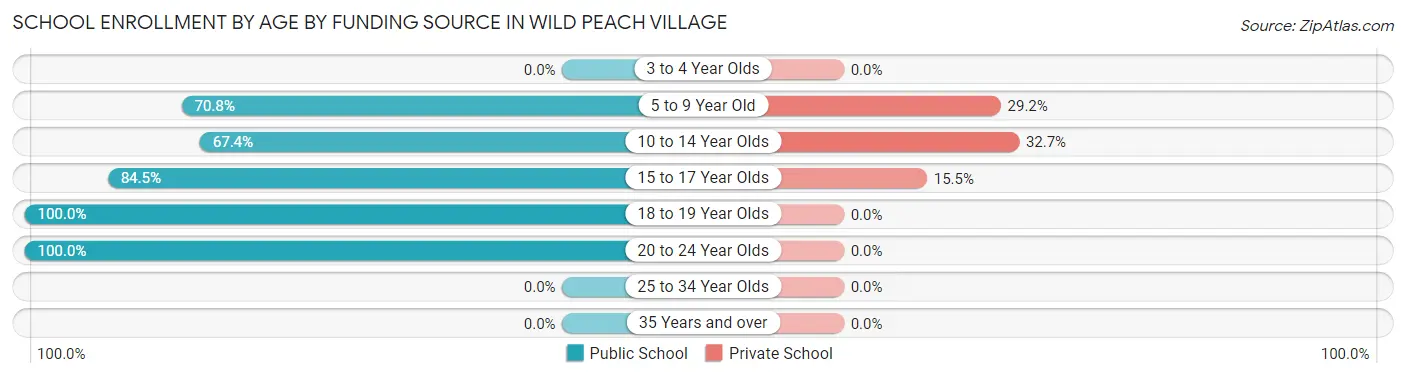
| Age Bracket | Public School | Private School |
| 3 to 4 Year Olds | 0 (0.0%) | 0 (0.0%) |
| 5 to 9 Year Old | 46 (70.8%) | 19 (29.2%) |
| 10 to 14 Year Olds | 198 (67.3%) | 96 (32.7%) |
| 15 to 17 Year Olds | 60 (84.5%) | 11 (15.5%) |
| 18 to 19 Year Olds | 27 (100.0%) | 0 (0.0%) |
| 20 to 24 Year Olds | 29 (100.0%) | 0 (0.0%) |
| 25 to 34 Year Olds | 0 (0.0%) | 0 (0.0%) |
| 35 Years and over | 0 (0.0%) | 0 (0.0%) |
| Total | 360 (74.1%) | 126 (25.9%) |
Educational Attainment by Field of Study in Wild Peach Village
Science & technology (28 | 20.1%), psychology (17 | 12.2%), arts & humanities (14 | 10.1%), physical & health sciences (12 | 8.6%), and literature & languages (12 | 8.6%) are the most common fields of study among 139 individuals in Wild Peach Village who have obtained a bachelor's degree or higher.
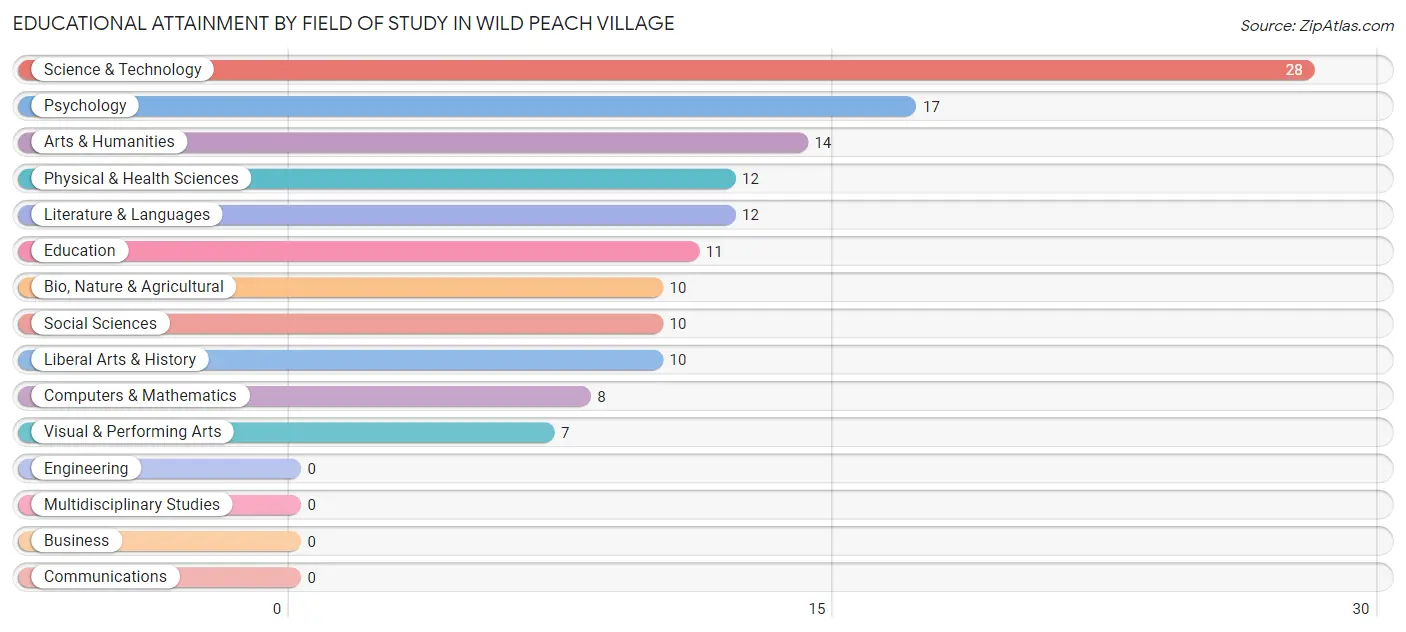
| Field of Study | # Graduates | % Graduates |
| Computers & Mathematics | 8 | 5.8% |
| Bio, Nature & Agricultural | 10 | 7.2% |
| Physical & Health Sciences | 12 | 8.6% |
| Psychology | 17 | 12.2% |
| Social Sciences | 10 | 7.2% |
| Engineering | 0 | 0.0% |
| Multidisciplinary Studies | 0 | 0.0% |
| Science & Technology | 28 | 20.1% |
| Business | 0 | 0.0% |
| Education | 11 | 7.9% |
| Literature & Languages | 12 | 8.6% |
| Liberal Arts & History | 10 | 7.2% |
| Visual & Performing Arts | 7 | 5.0% |
| Communications | 0 | 0.0% |
| Arts & Humanities | 14 | 10.1% |
| Total | 139 | 100.0% |
Transportation & Commute in Wild Peach Village
Vehicle Availability by Sex in Wild Peach Village
The most prevalent vehicle ownership categories in Wild Peach Village are males with 2 vehicles (177, accounting for 33.2%) and females with 2 vehicles (80, making up 63.4%).
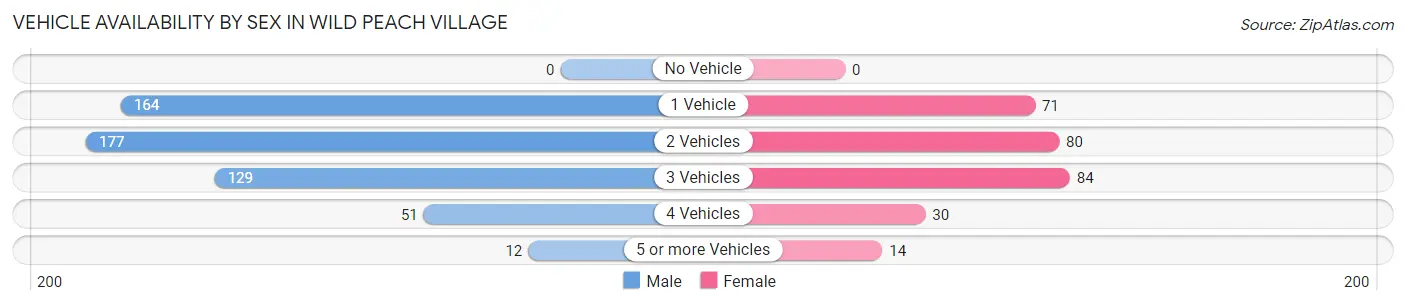
| Vehicles Available | Male | Female |
| No Vehicle | 0 (0.0%) | 0 (0.0%) |
| 1 Vehicle | 164 (30.8%) | 71 (25.5%) |
| 2 Vehicles | 177 (33.2%) | 80 (28.7%) |
| 3 Vehicles | 129 (24.2%) | 84 (30.1%) |
| 4 Vehicles | 51 (9.6%) | 30 (10.7%) |
| 5 or more Vehicles | 12 (2.2%) | 14 (5.0%) |
| Total | 533 (100.0%) | 279 (100.0%) |
Commute Time in Wild Peach Village
The most frequently occuring commute durations in Wild Peach Village are 30 to 34 minutes (291 commuters, 36.6%), 10 to 14 minutes (114 commuters, 14.3%), and 45 to 59 minutes (90 commuters, 11.3%).
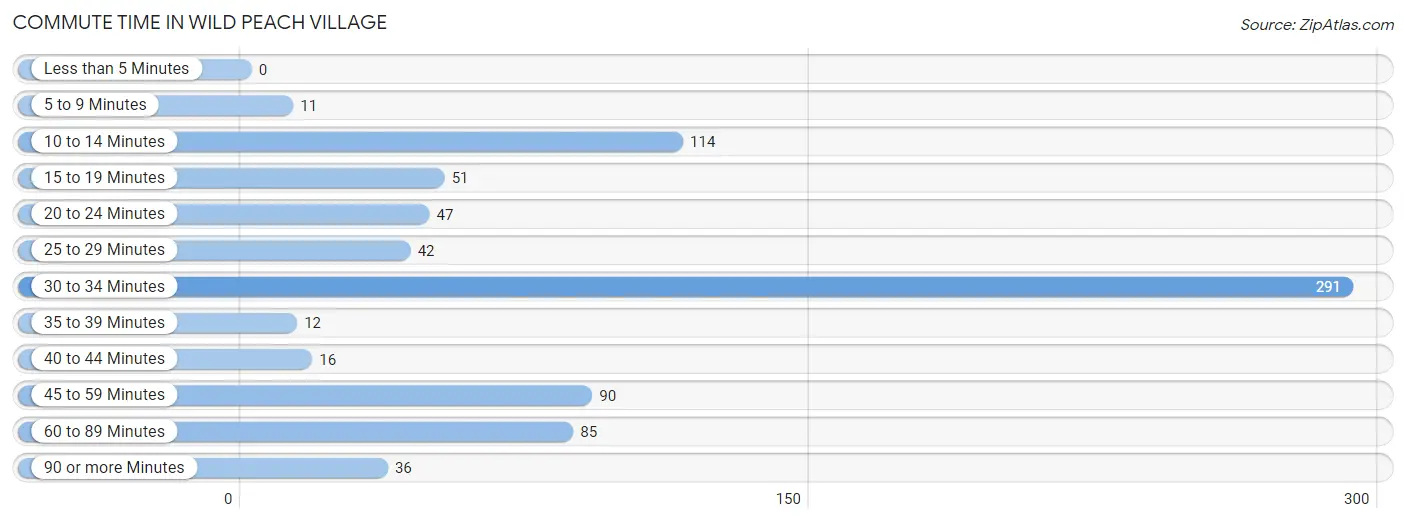
| Commute Time | # Commuters | % Commuters |
| Less than 5 Minutes | 0 | 0.0% |
| 5 to 9 Minutes | 11 | 1.4% |
| 10 to 14 Minutes | 114 | 14.3% |
| 15 to 19 Minutes | 51 | 6.4% |
| 20 to 24 Minutes | 47 | 5.9% |
| 25 to 29 Minutes | 42 | 5.3% |
| 30 to 34 Minutes | 291 | 36.6% |
| 35 to 39 Minutes | 12 | 1.5% |
| 40 to 44 Minutes | 16 | 2.0% |
| 45 to 59 Minutes | 90 | 11.3% |
| 60 to 89 Minutes | 85 | 10.7% |
| 90 or more Minutes | 36 | 4.5% |
Commute Time by Sex in Wild Peach Village
The most common commute times in Wild Peach Village are 30 to 34 minutes (216 commuters, 41.9%) for males and 30 to 34 minutes (75 commuters, 26.9%) for females.
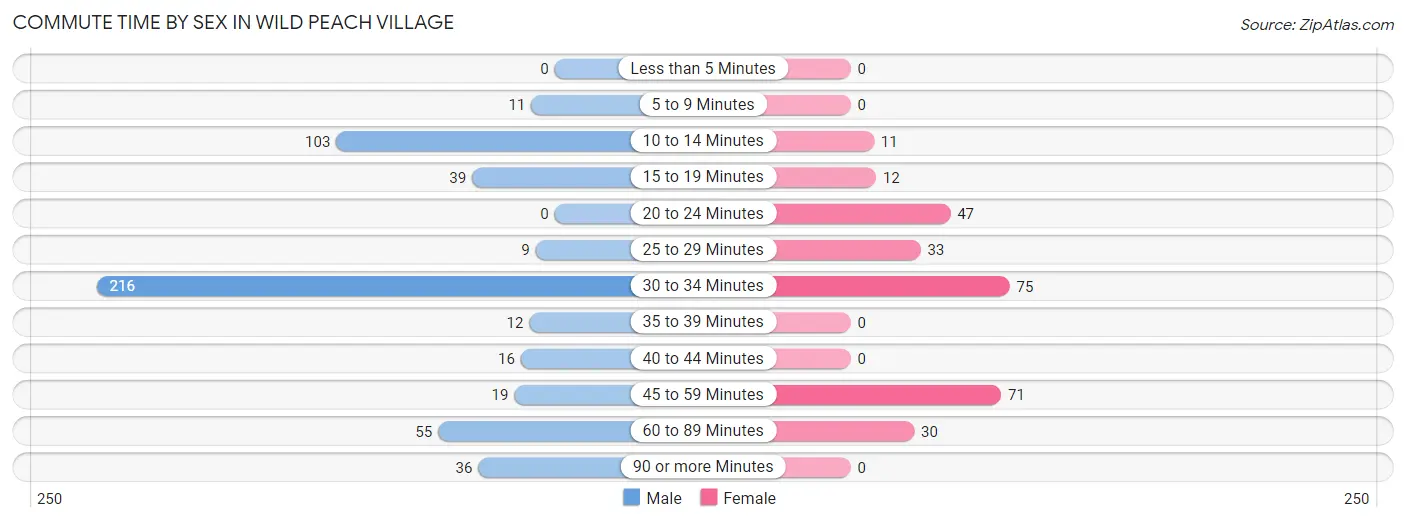
| Commute Time | Male | Female |
| Less than 5 Minutes | 0 (0.0%) | 0 (0.0%) |
| 5 to 9 Minutes | 11 (2.1%) | 0 (0.0%) |
| 10 to 14 Minutes | 103 (20.0%) | 11 (3.9%) |
| 15 to 19 Minutes | 39 (7.6%) | 12 (4.3%) |
| 20 to 24 Minutes | 0 (0.0%) | 47 (16.9%) |
| 25 to 29 Minutes | 9 (1.7%) | 33 (11.8%) |
| 30 to 34 Minutes | 216 (41.9%) | 75 (26.9%) |
| 35 to 39 Minutes | 12 (2.3%) | 0 (0.0%) |
| 40 to 44 Minutes | 16 (3.1%) | 0 (0.0%) |
| 45 to 59 Minutes | 19 (3.7%) | 71 (25.5%) |
| 60 to 89 Minutes | 55 (10.7%) | 30 (10.7%) |
| 90 or more Minutes | 36 (7.0%) | 0 (0.0%) |
Time of Departure to Work by Sex in Wild Peach Village
The most frequent times of departure to work in Wild Peach Village are 6:00 AM to 6:29 AM (187, 36.2%) for males and 7:00 AM to 7:29 AM (44, 15.8%) for females.
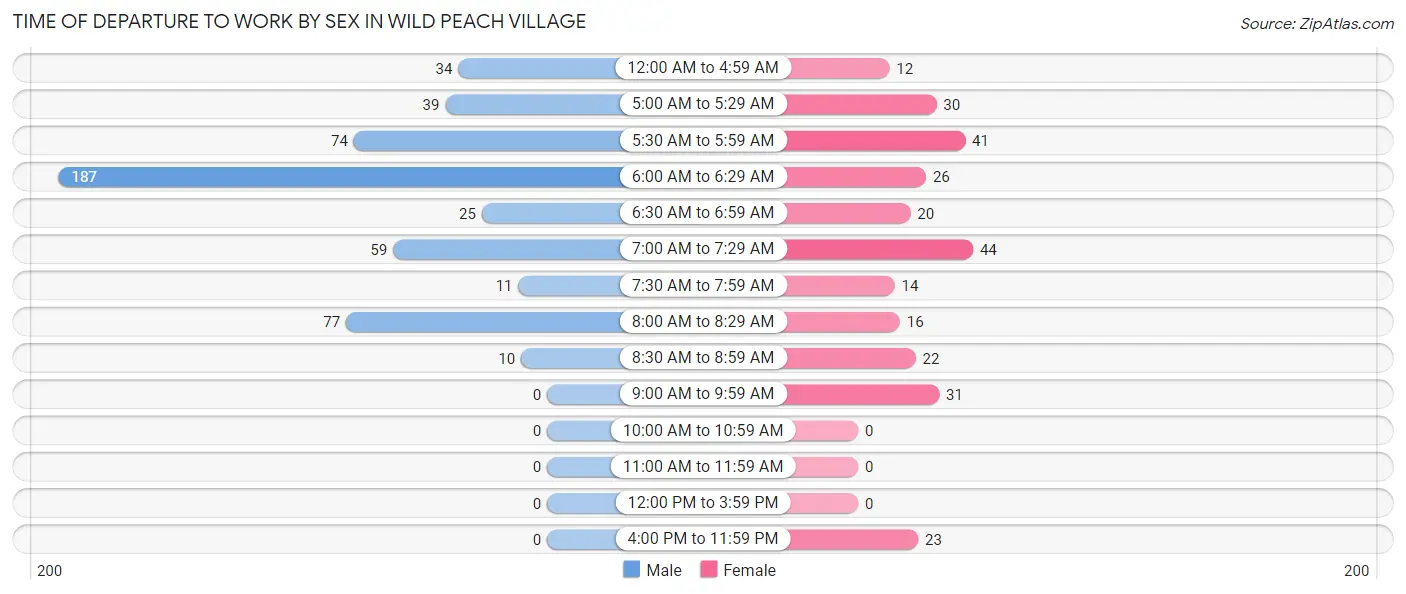
| Time of Departure | Male | Female |
| 12:00 AM to 4:59 AM | 34 (6.6%) | 12 (4.3%) |
| 5:00 AM to 5:29 AM | 39 (7.6%) | 30 (10.7%) |
| 5:30 AM to 5:59 AM | 74 (14.3%) | 41 (14.7%) |
| 6:00 AM to 6:29 AM | 187 (36.2%) | 26 (9.3%) |
| 6:30 AM to 6:59 AM | 25 (4.8%) | 20 (7.2%) |
| 7:00 AM to 7:29 AM | 59 (11.4%) | 44 (15.8%) |
| 7:30 AM to 7:59 AM | 11 (2.1%) | 14 (5.0%) |
| 8:00 AM to 8:29 AM | 77 (14.9%) | 16 (5.7%) |
| 8:30 AM to 8:59 AM | 10 (1.9%) | 22 (7.9%) |
| 9:00 AM to 9:59 AM | 0 (0.0%) | 31 (11.1%) |
| 10:00 AM to 10:59 AM | 0 (0.0%) | 0 (0.0%) |
| 11:00 AM to 11:59 AM | 0 (0.0%) | 0 (0.0%) |
| 12:00 PM to 3:59 PM | 0 (0.0%) | 0 (0.0%) |
| 4:00 PM to 11:59 PM | 0 (0.0%) | 23 (8.2%) |
| Total | 516 (100.0%) | 279 (100.0%) |
Housing Occupancy in Wild Peach Village
Occupancy by Ownership in Wild Peach Village
Of the total 1,032 dwellings in Wild Peach Village, owner-occupied units account for 912 (88.4%), while renter-occupied units make up 120 (11.6%).
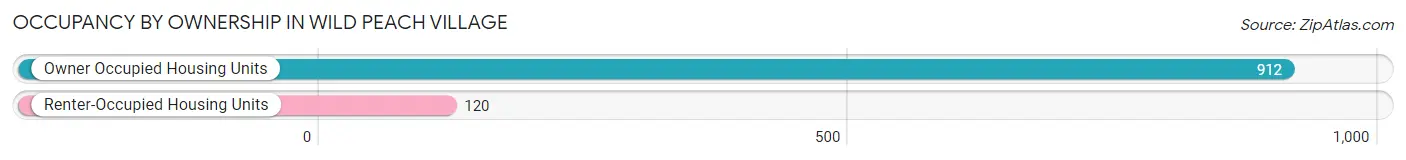
| Occupancy | # Housing Units | % Housing Units |
| Owner Occupied Housing Units | 912 | 88.4% |
| Renter-Occupied Housing Units | 120 | 11.6% |
| Total Occupied Housing Units | 1,032 | 100.0% |
Occupancy by Household Size in Wild Peach Village
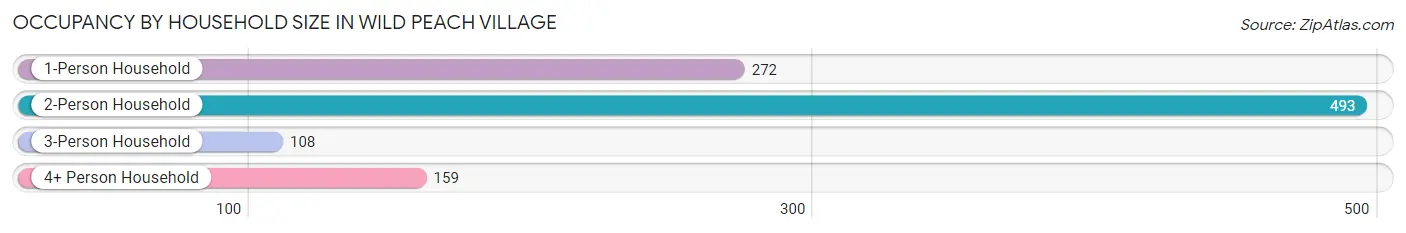
| Household Size | # Housing Units | % Housing Units |
| 1-Person Household | 272 | 26.4% |
| 2-Person Household | 493 | 47.8% |
| 3-Person Household | 108 | 10.5% |
| 4+ Person Household | 159 | 15.4% |
| Total Housing Units | 1,032 | 100.0% |
Occupancy by Ownership by Household Size in Wild Peach Village
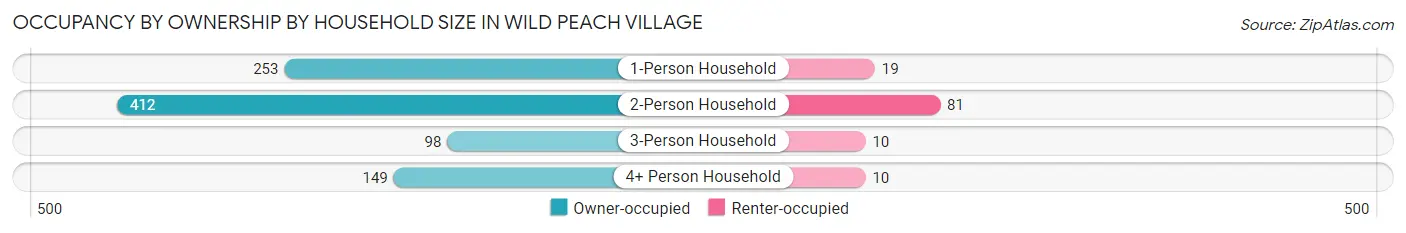
| Household Size | Owner-occupied | Renter-occupied |
| 1-Person Household | 253 (93.0%) | 19 (7.0%) |
| 2-Person Household | 412 (83.6%) | 81 (16.4%) |
| 3-Person Household | 98 (90.7%) | 10 (9.3%) |
| 4+ Person Household | 149 (93.7%) | 10 (6.3%) |
| Total Housing Units | 912 (88.4%) | 120 (11.6%) |
Occupancy by Educational Attainment in Wild Peach Village
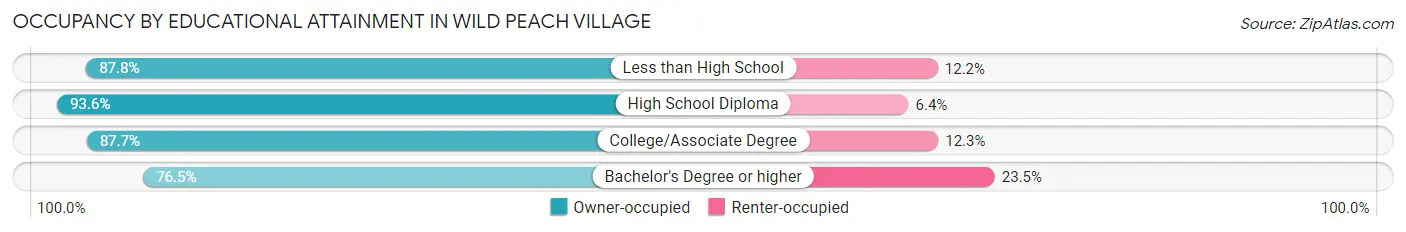
| Household Size | Owner-occupied | Renter-occupied |
| Less than High School | 165 (87.8%) | 23 (12.2%) |
| High School Diploma | 262 (93.6%) | 18 (6.4%) |
| College/Associate Degree | 420 (87.7%) | 59 (12.3%) |
| Bachelor's Degree or higher | 65 (76.5%) | 20 (23.5%) |
Occupancy by Age of Householder in Wild Peach Village
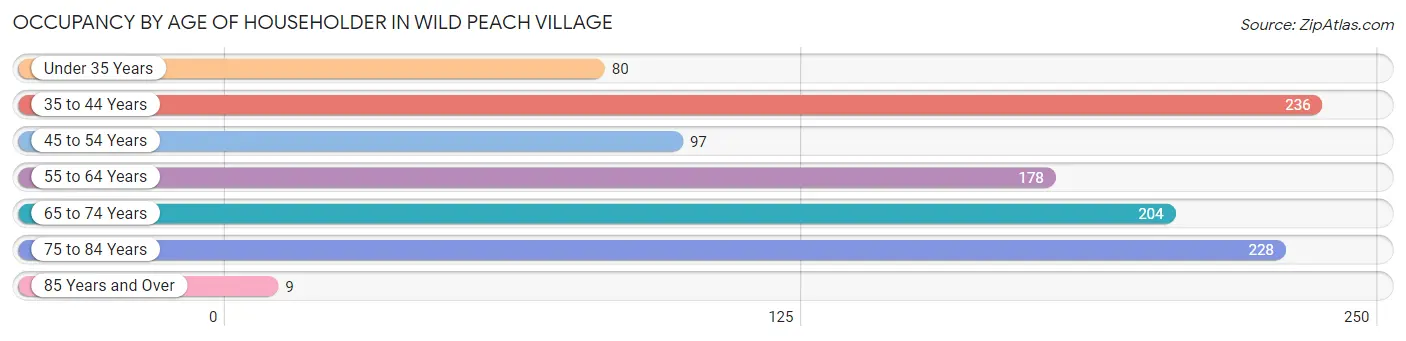
| Age Bracket | # Households | % Households |
| Under 35 Years | 80 | 7.7% |
| 35 to 44 Years | 236 | 22.9% |
| 45 to 54 Years | 97 | 9.4% |
| 55 to 64 Years | 178 | 17.2% |
| 65 to 74 Years | 204 | 19.8% |
| 75 to 84 Years | 228 | 22.1% |
| 85 Years and Over | 9 | 0.9% |
| Total | 1,032 | 100.0% |
Housing Finances in Wild Peach Village
Median Income by Occupancy in Wild Peach Village
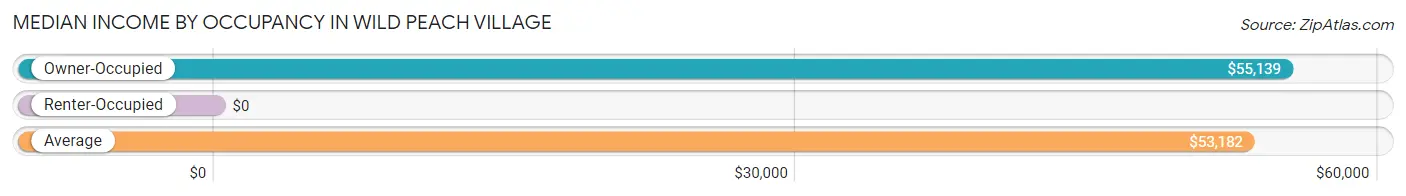
| Occupancy Type | # Households | Median Income |
| Owner-Occupied | 912 (88.4%) | $55,139 |
| Renter-Occupied | 120 (11.6%) | $0 |
| Average | 1,032 (100.0%) | $53,182 |
Occupancy by Householder Income Bracket in Wild Peach Village
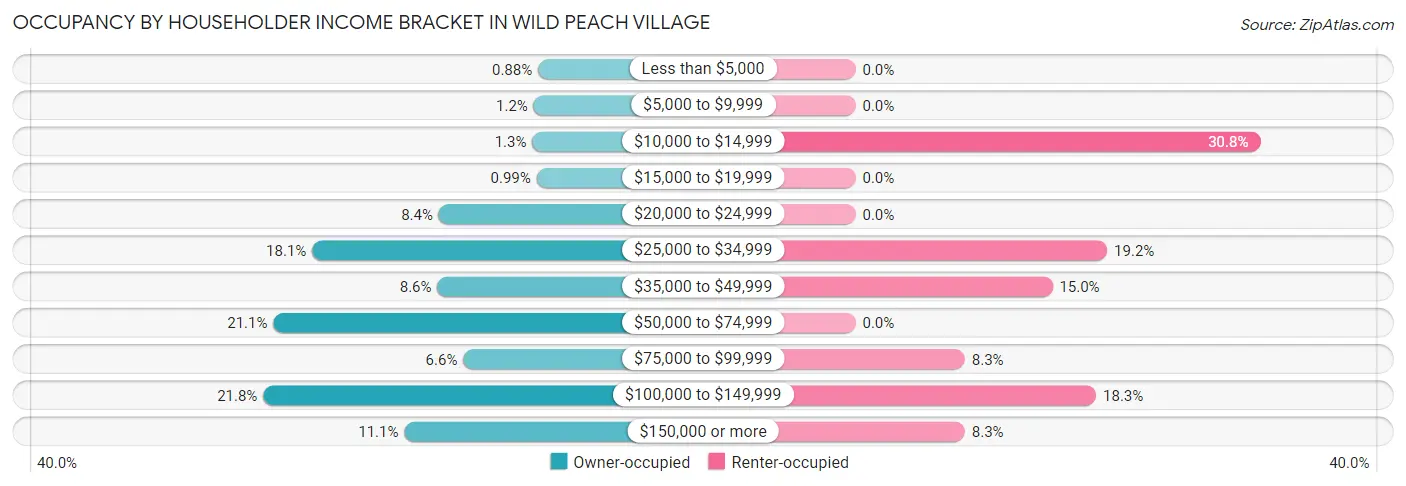
| Income Bracket | Owner-occupied | Renter-occupied |
| Less than $5,000 | 8 (0.9%) | 0 (0.0%) |
| $5,000 to $9,999 | 11 (1.2%) | 0 (0.0%) |
| $10,000 to $14,999 | 12 (1.3%) | 37 (30.8%) |
| $15,000 to $19,999 | 9 (1.0%) | 0 (0.0%) |
| $20,000 to $24,999 | 77 (8.4%) | 0 (0.0%) |
| $25,000 to $34,999 | 165 (18.1%) | 23 (19.2%) |
| $35,000 to $49,999 | 78 (8.6%) | 18 (15.0%) |
| $50,000 to $74,999 | 192 (21.0%) | 0 (0.0%) |
| $75,000 to $99,999 | 60 (6.6%) | 10 (8.3%) |
| $100,000 to $149,999 | 199 (21.8%) | 22 (18.3%) |
| $150,000 or more | 101 (11.1%) | 10 (8.3%) |
| Total | 912 (100.0%) | 120 (100.0%) |
Monthly Housing Cost Tiers in Wild Peach Village
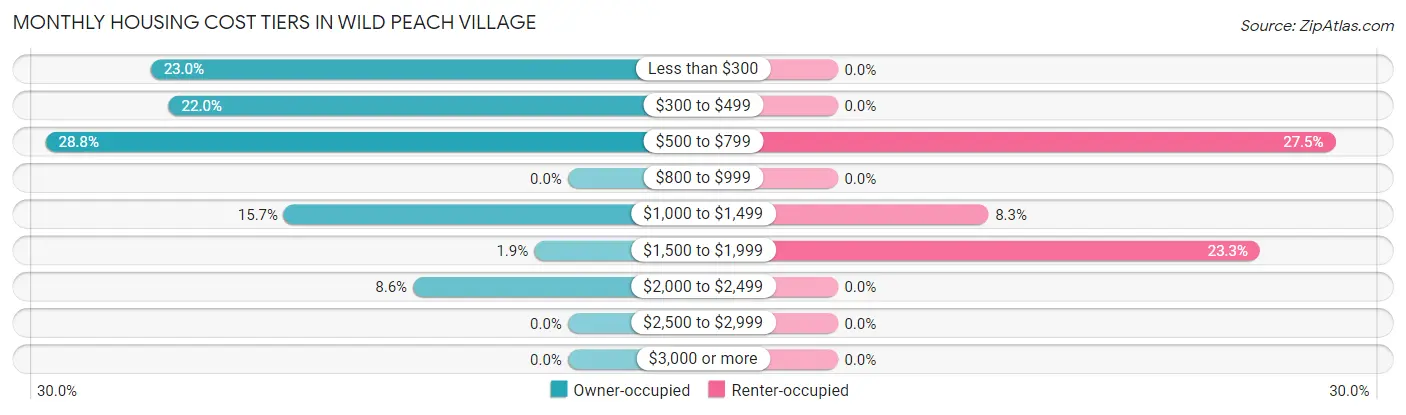
| Monthly Cost | Owner-occupied | Renter-occupied |
| Less than $300 | 210 (23.0%) | 0 (0.0%) |
| $300 to $499 | 201 (22.0%) | 0 (0.0%) |
| $500 to $799 | 263 (28.8%) | 33 (27.5%) |
| $800 to $999 | 0 (0.0%) | 0 (0.0%) |
| $1,000 to $1,499 | 143 (15.7%) | 10 (8.3%) |
| $1,500 to $1,999 | 17 (1.9%) | 28 (23.3%) |
| $2,000 to $2,499 | 78 (8.6%) | 0 (0.0%) |
| $2,500 to $2,999 | 0 (0.0%) | 0 (0.0%) |
| $3,000 or more | 0 (0.0%) | 0 (0.0%) |
| Total | 912 (100.0%) | 120 (100.0%) |
Physical Housing Characteristics in Wild Peach Village
Housing Structures in Wild Peach Village
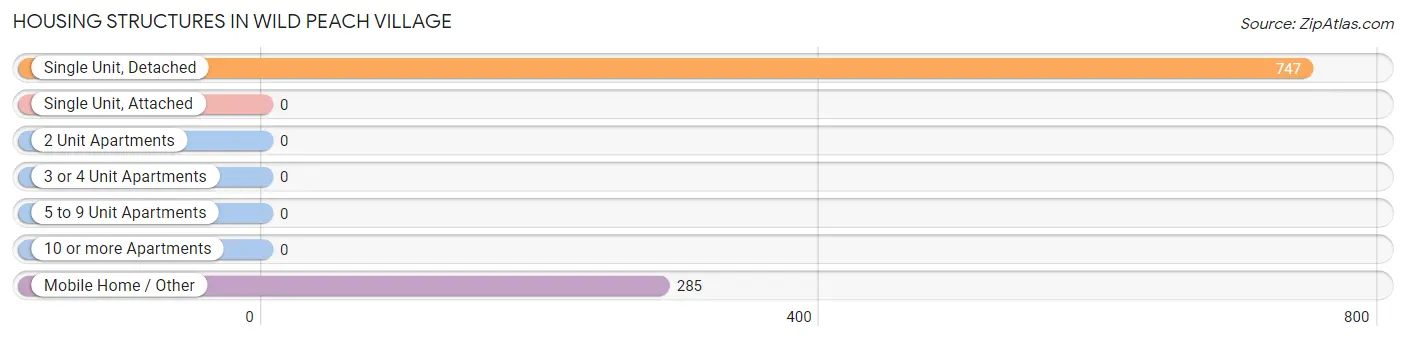
| Structure Type | # Housing Units | % Housing Units |
| Single Unit, Detached | 747 | 72.4% |
| Single Unit, Attached | 0 | 0.0% |
| 2 Unit Apartments | 0 | 0.0% |
| 3 or 4 Unit Apartments | 0 | 0.0% |
| 5 to 9 Unit Apartments | 0 | 0.0% |
| 10 or more Apartments | 0 | 0.0% |
| Mobile Home / Other | 285 | 27.6% |
| Total | 1,032 | 100.0% |
Housing Structures by Occupancy in Wild Peach Village
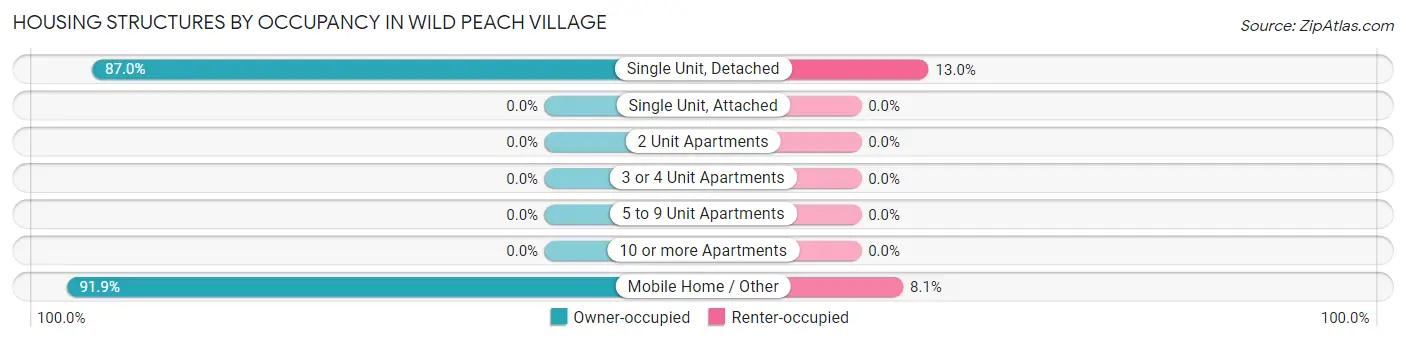
| Structure Type | Owner-occupied | Renter-occupied |
| Single Unit, Detached | 650 (87.0%) | 97 (13.0%) |
| Single Unit, Attached | 0 (0.0%) | 0 (0.0%) |
| 2 Unit Apartments | 0 (0.0%) | 0 (0.0%) |
| 3 or 4 Unit Apartments | 0 (0.0%) | 0 (0.0%) |
| 5 to 9 Unit Apartments | 0 (0.0%) | 0 (0.0%) |
| 10 or more Apartments | 0 (0.0%) | 0 (0.0%) |
| Mobile Home / Other | 262 (91.9%) | 23 (8.1%) |
| Total | 912 (88.4%) | 120 (11.6%) |
Housing Structures by Number of Rooms in Wild Peach Village
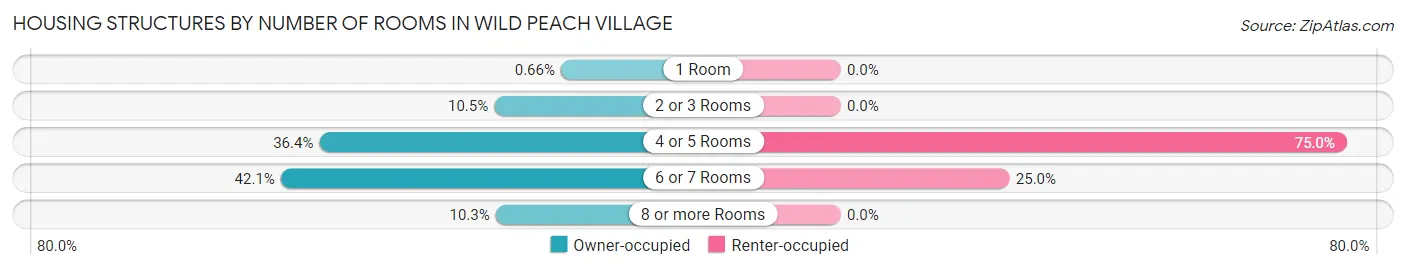
| Number of Rooms | Owner-occupied | Renter-occupied |
| 1 Room | 6 (0.7%) | 0 (0.0%) |
| 2 or 3 Rooms | 96 (10.5%) | 0 (0.0%) |
| 4 or 5 Rooms | 332 (36.4%) | 90 (75.0%) |
| 6 or 7 Rooms | 384 (42.1%) | 30 (25.0%) |
| 8 or more Rooms | 94 (10.3%) | 0 (0.0%) |
| Total | 912 (100.0%) | 120 (100.0%) |
Housing Structure by Heating Type in Wild Peach Village
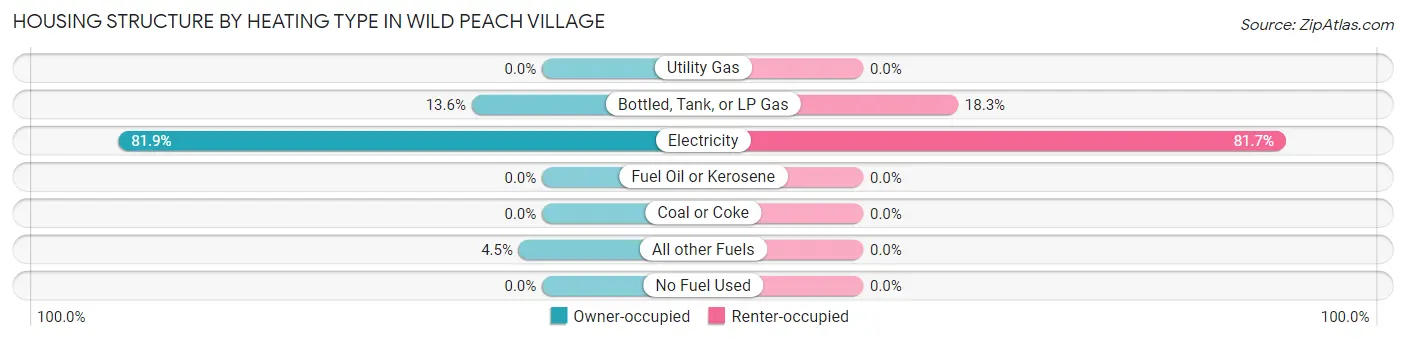
| Heating Type | Owner-occupied | Renter-occupied |
| Utility Gas | 0 (0.0%) | 0 (0.0%) |
| Bottled, Tank, or LP Gas | 124 (13.6%) | 22 (18.3%) |
| Electricity | 747 (81.9%) | 98 (81.7%) |
| Fuel Oil or Kerosene | 0 (0.0%) | 0 (0.0%) |
| Coal or Coke | 0 (0.0%) | 0 (0.0%) |
| All other Fuels | 41 (4.5%) | 0 (0.0%) |
| No Fuel Used | 0 (0.0%) | 0 (0.0%) |
| Total | 912 (100.0%) | 120 (100.0%) |
Household Vehicle Usage in Wild Peach Village
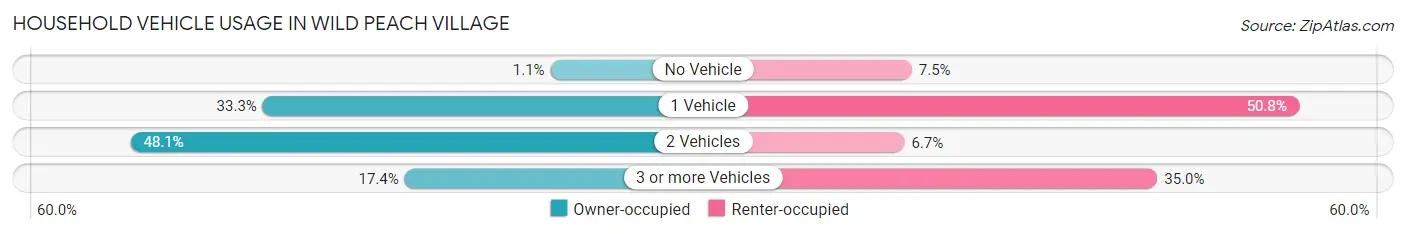
| Vehicles per Household | Owner-occupied | Renter-occupied |
| No Vehicle | 10 (1.1%) | 9 (7.5%) |
| 1 Vehicle | 304 (33.3%) | 61 (50.8%) |
| 2 Vehicles | 439 (48.1%) | 8 (6.7%) |
| 3 or more Vehicles | 159 (17.4%) | 42 (35.0%) |
| Total | 912 (100.0%) | 120 (100.0%) |
Real Estate & Mortgages in Wild Peach Village
Real Estate and Mortgage Overview in Wild Peach Village
| Characteristic | Without Mortgage | With Mortgage |
| Housing Units | 692 | 220 |
| Median Property Value | $142,800 | $0 |
| Median Household Income | $55,417 | $12 |
| Monthly Housing Costs | $387 | $0 |
| Real Estate Taxes | $926 | $7 |
Property Value by Mortgage Status in Wild Peach Village
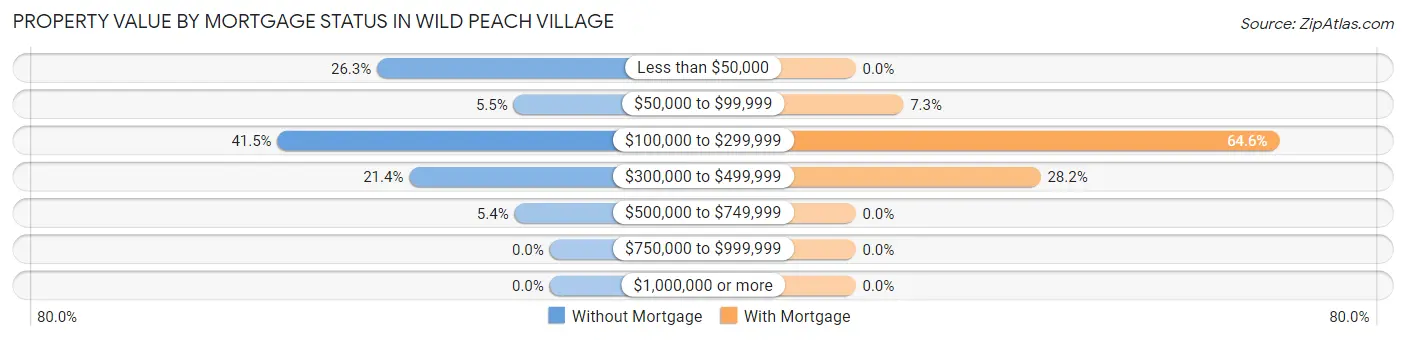
| Property Value | Without Mortgage | With Mortgage |
| Less than $50,000 | 182 (26.3%) | 0 (0.0%) |
| $50,000 to $99,999 | 38 (5.5%) | 16 (7.3%) |
| $100,000 to $299,999 | 287 (41.5%) | 142 (64.5%) |
| $300,000 to $499,999 | 148 (21.4%) | 62 (28.2%) |
| $500,000 to $749,999 | 37 (5.3%) | 0 (0.0%) |
| $750,000 to $999,999 | 0 (0.0%) | 0 (0.0%) |
| $1,000,000 or more | 0 (0.0%) | 0 (0.0%) |
| Total | 692 (100.0%) | 220 (100.0%) |
Household Income by Mortgage Status in Wild Peach Village
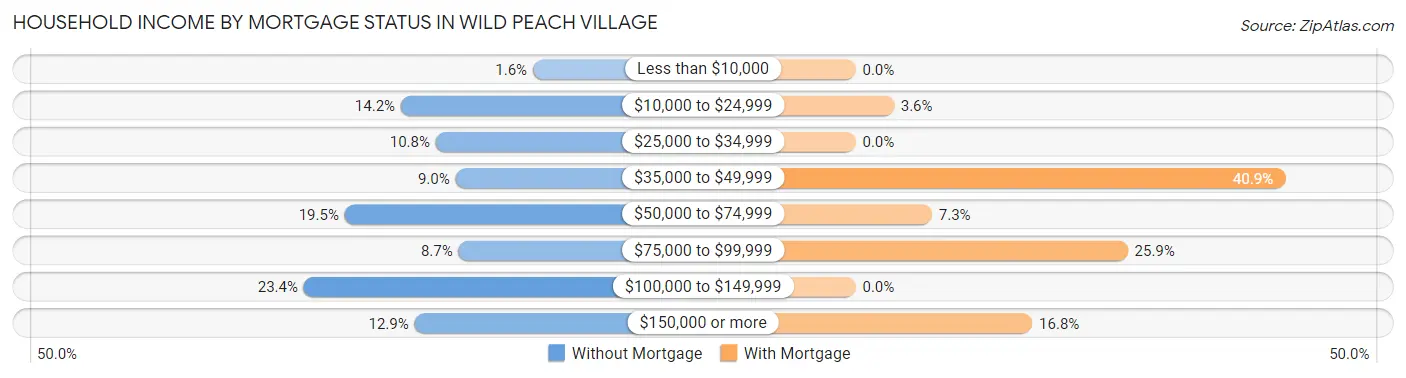
| Household Income | Without Mortgage | With Mortgage |
| Less than $10,000 | 11 (1.6%) | 0 (0.0%) |
| $10,000 to $24,999 | 98 (14.2%) | 8 (3.6%) |
| $25,000 to $34,999 | 75 (10.8%) | 0 (0.0%) |
| $35,000 to $49,999 | 62 (9.0%) | 90 (40.9%) |
| $50,000 to $74,999 | 135 (19.5%) | 16 (7.3%) |
| $75,000 to $99,999 | 60 (8.7%) | 57 (25.9%) |
| $100,000 to $149,999 | 162 (23.4%) | 0 (0.0%) |
| $150,000 or more | 89 (12.9%) | 37 (16.8%) |
| Total | 692 (100.0%) | 220 (100.0%) |
Property Value to Household Income Ratio in Wild Peach Village
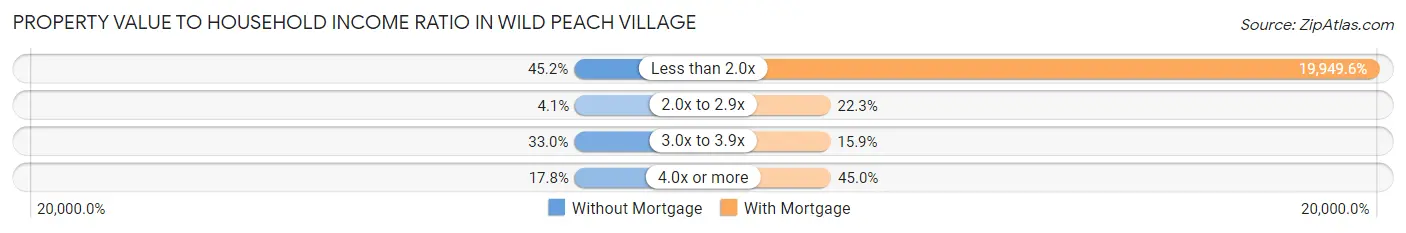
| Value-to-Income Ratio | Without Mortgage | With Mortgage |
| Less than 2.0x | 313 (45.2%) | 43,889 (19,949.5%) |
| 2.0x to 2.9x | 28 (4.1%) | 49 (22.3%) |
| 3.0x to 3.9x | 228 (33.0%) | 35 (15.9%) |
| 4.0x or more | 123 (17.8%) | 99 (45.0%) |
| Total | 692 (100.0%) | 220 (100.0%) |
Real Estate Taxes by Mortgage Status in Wild Peach Village
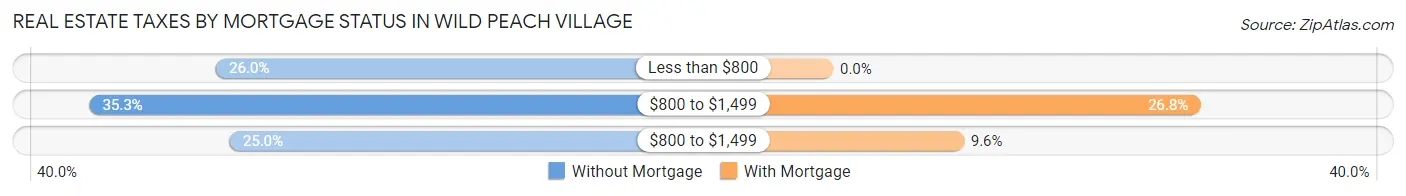
| Property Taxes | Without Mortgage | With Mortgage |
| Less than $800 | 180 (26.0%) | 0 (0.0%) |
| $800 to $1,499 | 244 (35.3%) | 59 (26.8%) |
| $800 to $1,499 | 173 (25.0%) | 21 (9.6%) |
| Total | 692 (100.0%) | 220 (100.0%) |
Health & Disability in Wild Peach Village
Health Insurance Coverage by Age in Wild Peach Village
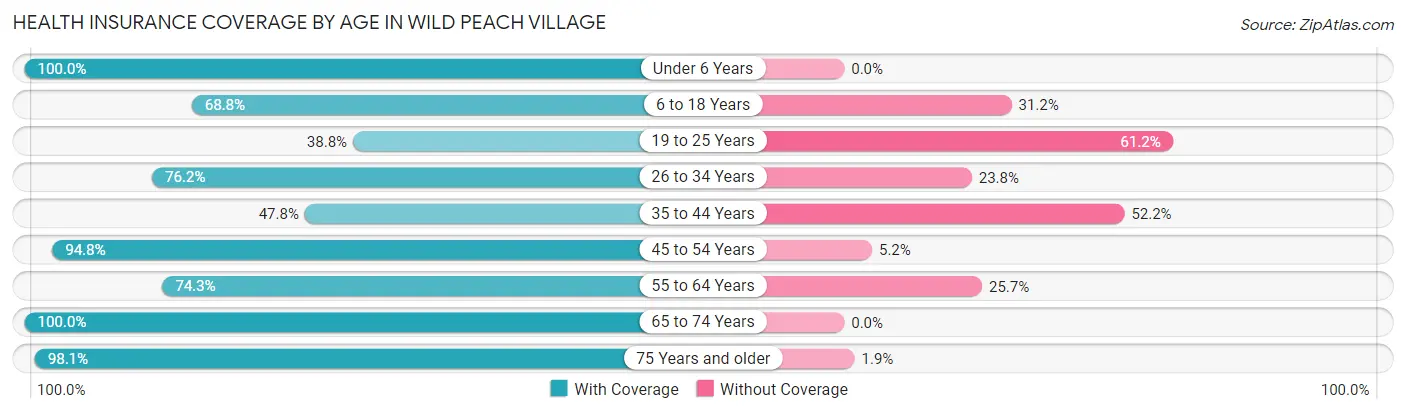
| Age Bracket | With Coverage | Without Coverage |
| Under 6 Years | 61 (100.0%) | 0 (0.0%) |
| 6 to 18 Years | 278 (68.8%) | 126 (31.2%) |
| 19 to 25 Years | 38 (38.8%) | 60 (61.2%) |
| 26 to 34 Years | 93 (76.2%) | 29 (23.8%) |
| 35 to 44 Years | 149 (47.8%) | 163 (52.2%) |
| 45 to 54 Years | 312 (94.8%) | 17 (5.2%) |
| 55 to 64 Years | 243 (74.3%) | 84 (25.7%) |
| 65 to 74 Years | 255 (100.0%) | 0 (0.0%) |
| 75 Years and older | 409 (98.1%) | 8 (1.9%) |
| Total | 1,838 (79.0%) | 487 (20.9%) |
Health Insurance Coverage by Citizenship Status in Wild Peach Village
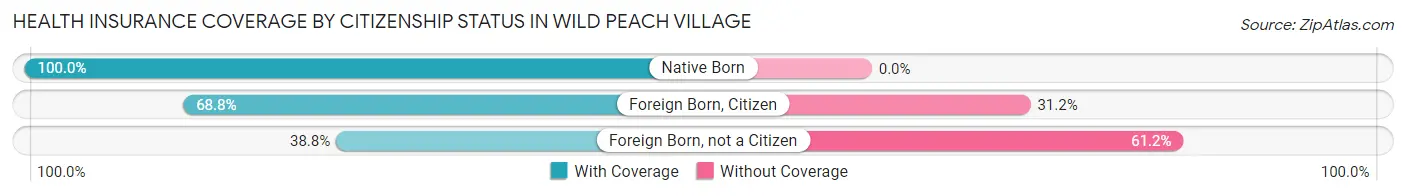
| Citizenship Status | With Coverage | Without Coverage |
| Native Born | 61 (100.0%) | 0 (0.0%) |
| Foreign Born, Citizen | 278 (68.8%) | 126 (31.2%) |
| Foreign Born, not a Citizen | 38 (38.8%) | 60 (61.2%) |
Health Insurance Coverage by Household Income in Wild Peach Village
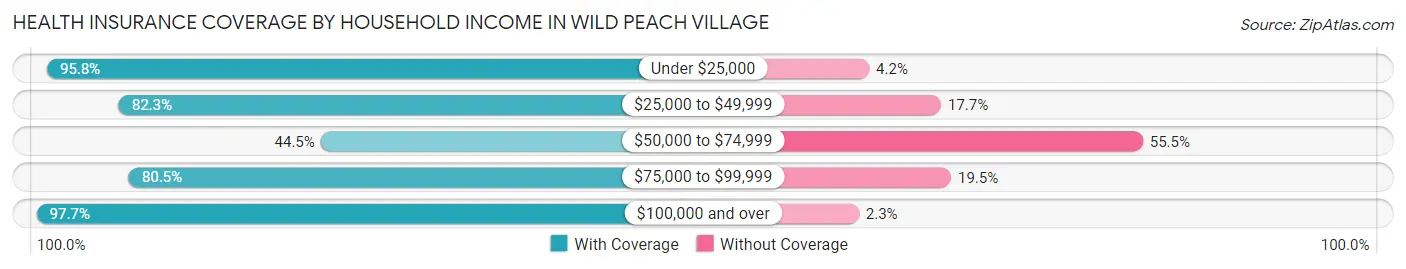
| Household Income | With Coverage | Without Coverage |
| Under $25,000 | 183 (95.8%) | 8 (4.2%) |
| $25,000 to $49,999 | 527 (82.3%) | 113 (17.7%) |
| $50,000 to $74,999 | 253 (44.5%) | 315 (55.5%) |
| $75,000 to $99,999 | 140 (80.5%) | 34 (19.5%) |
| $100,000 and over | 735 (97.7%) | 17 (2.3%) |
Public vs Private Health Insurance Coverage by Age in Wild Peach Village
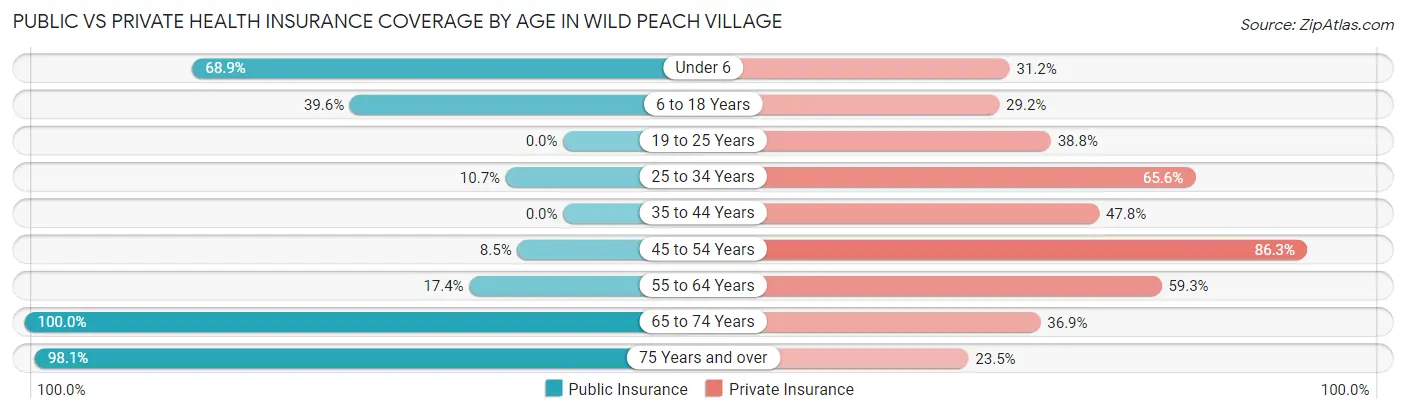
| Age Bracket | Public Insurance | Private Insurance |
| Under 6 | 42 (68.9%) | 19 (31.1%) |
| 6 to 18 Years | 160 (39.6%) | 118 (29.2%) |
| 19 to 25 Years | 0 (0.0%) | 38 (38.8%) |
| 25 to 34 Years | 13 (10.7%) | 80 (65.6%) |
| 35 to 44 Years | 0 (0.0%) | 149 (47.8%) |
| 45 to 54 Years | 28 (8.5%) | 284 (86.3%) |
| 55 to 64 Years | 57 (17.4%) | 194 (59.3%) |
| 65 to 74 Years | 255 (100.0%) | 94 (36.9%) |
| 75 Years and over | 409 (98.1%) | 98 (23.5%) |
| Total | 964 (41.5%) | 1,074 (46.2%) |
Disability Status by Sex by Age in Wild Peach Village
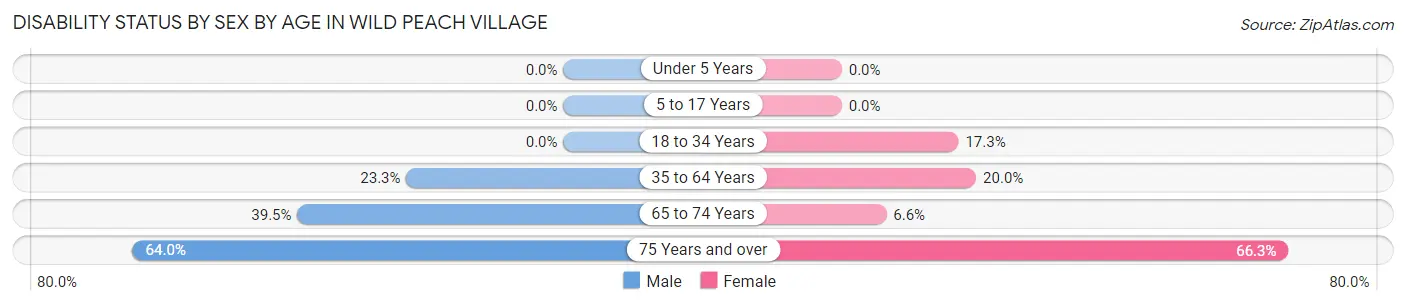
| Age Bracket | Male | Female |
| Under 5 Years | 0 (0.0%) | 0 (0.0%) |
| 5 to 17 Years | 0 (0.0%) | 0 (0.0%) |
| 18 to 34 Years | 0 (0.0%) | 13 (17.3%) |
| 35 to 64 Years | 131 (23.3%) | 81 (20.0%) |
| 65 to 74 Years | 47 (39.5%) | 9 (6.6%) |
| 75 Years and over | 149 (63.9%) | 122 (66.3%) |
Disability Class by Sex by Age in Wild Peach Village
Disability Class: Hearing Difficulty
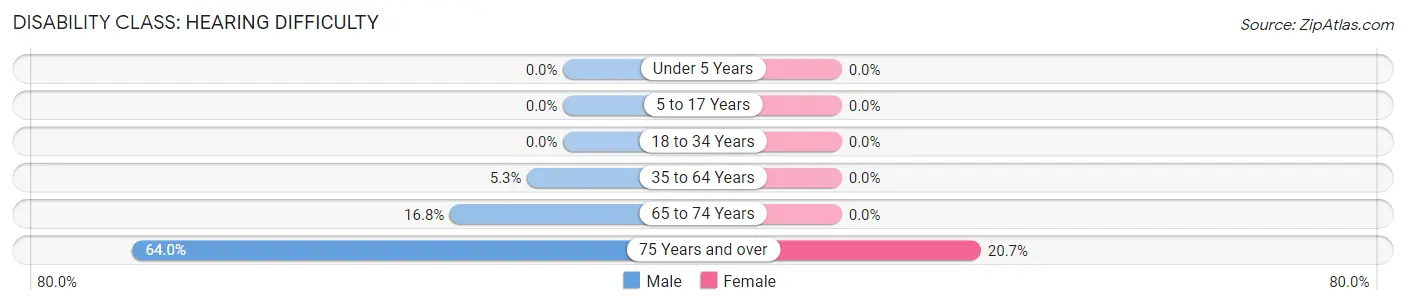
| Age Bracket | Male | Female |
| Under 5 Years | 0 (0.0%) | 0 (0.0%) |
| 5 to 17 Years | 0 (0.0%) | 0 (0.0%) |
| 18 to 34 Years | 0 (0.0%) | 0 (0.0%) |
| 35 to 64 Years | 30 (5.3%) | 0 (0.0%) |
| 65 to 74 Years | 20 (16.8%) | 0 (0.0%) |
| 75 Years and over | 149 (63.9%) | 38 (20.6%) |
Disability Class: Vision Difficulty
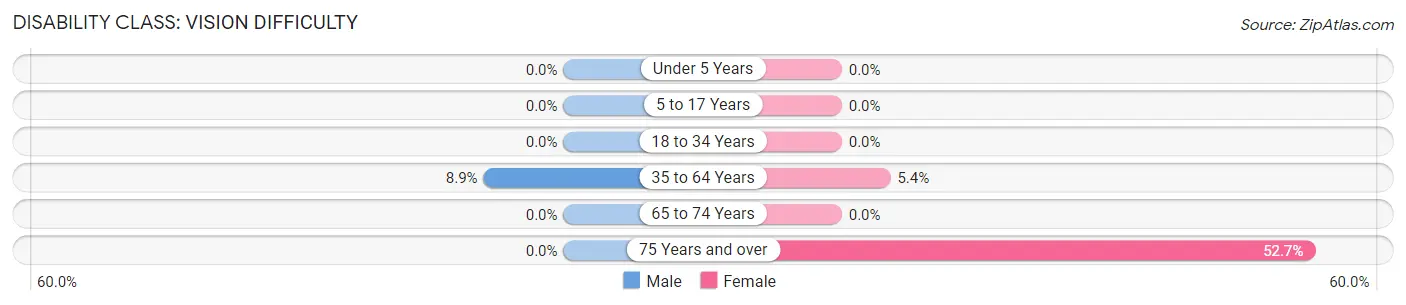
| Age Bracket | Male | Female |
| Under 5 Years | 0 (0.0%) | 0 (0.0%) |
| 5 to 17 Years | 0 (0.0%) | 0 (0.0%) |
| 18 to 34 Years | 0 (0.0%) | 0 (0.0%) |
| 35 to 64 Years | 50 (8.9%) | 22 (5.4%) |
| 65 to 74 Years | 0 (0.0%) | 0 (0.0%) |
| 75 Years and over | 0 (0.0%) | 97 (52.7%) |
Disability Class: Cognitive Difficulty
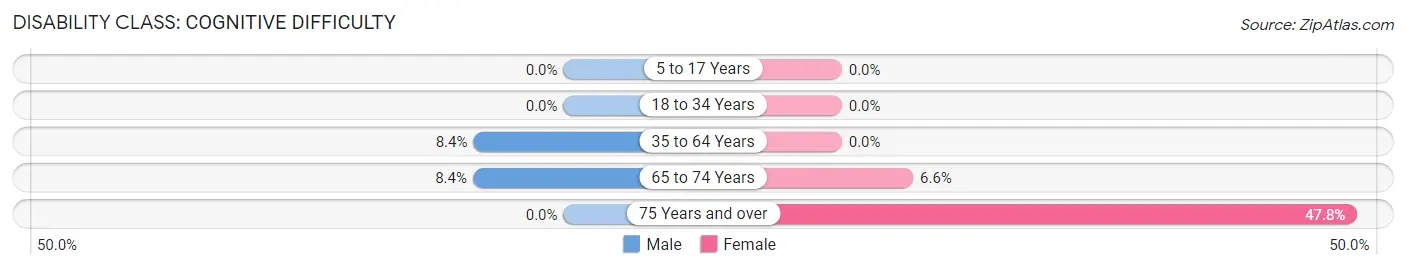
| Age Bracket | Male | Female |
| 5 to 17 Years | 0 (0.0%) | 0 (0.0%) |
| 18 to 34 Years | 0 (0.0%) | 0 (0.0%) |
| 35 to 64 Years | 47 (8.4%) | 0 (0.0%) |
| 65 to 74 Years | 10 (8.4%) | 9 (6.6%) |
| 75 Years and over | 0 (0.0%) | 88 (47.8%) |
Disability Class: Ambulatory Difficulty
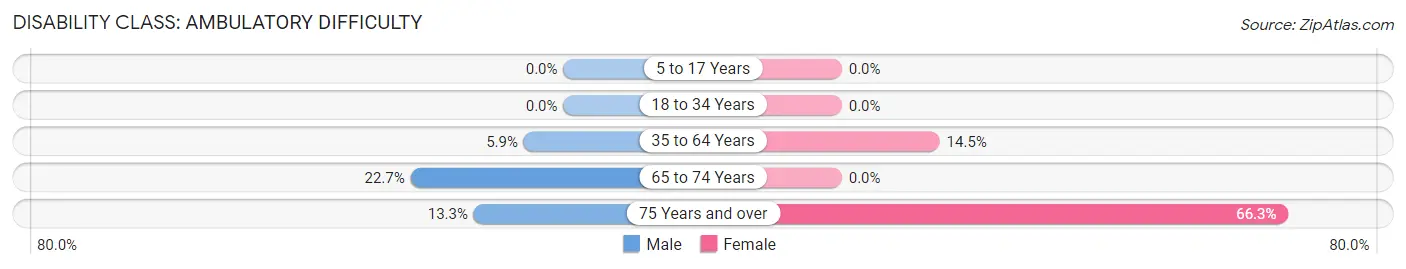
| Age Bracket | Male | Female |
| 5 to 17 Years | 0 (0.0%) | 0 (0.0%) |
| 18 to 34 Years | 0 (0.0%) | 0 (0.0%) |
| 35 to 64 Years | 33 (5.9%) | 59 (14.5%) |
| 65 to 74 Years | 27 (22.7%) | 0 (0.0%) |
| 75 Years and over | 31 (13.3%) | 122 (66.3%) |
Disability Class: Self-Care Difficulty
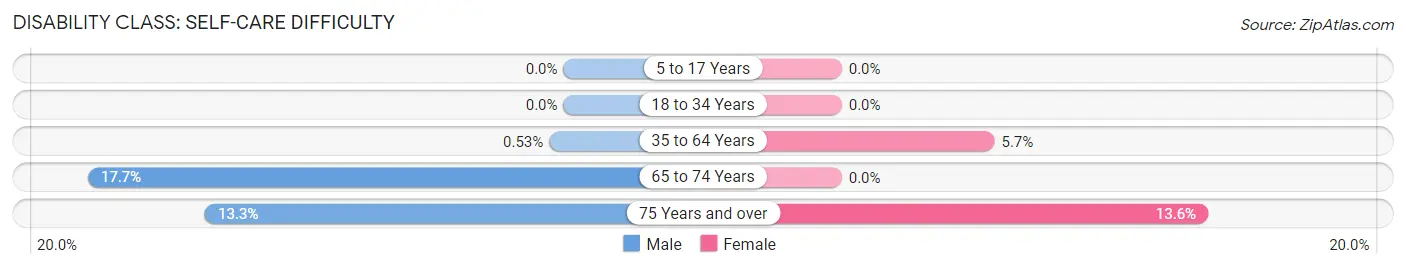
| Age Bracket | Male | Female |
| 5 to 17 Years | 0 (0.0%) | 0 (0.0%) |
| 18 to 34 Years | 0 (0.0%) | 0 (0.0%) |
| 35 to 64 Years | 3 (0.5%) | 23 (5.7%) |
| 65 to 74 Years | 21 (17.6%) | 0 (0.0%) |
| 75 Years and over | 31 (13.3%) | 25 (13.6%) |
Technology Access in Wild Peach Village
Computing Device Access in Wild Peach Village
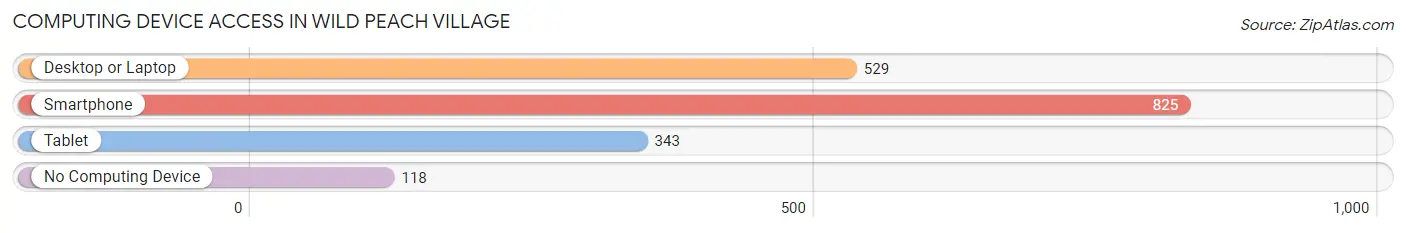
| Device Type | # Households | % Households |
| Desktop or Laptop | 529 | 51.3% |
| Smartphone | 825 | 79.9% |
| Tablet | 343 | 33.2% |
| No Computing Device | 118 | 11.4% |
| Total | 1,032 | 100.0% |
Internet Access in Wild Peach Village
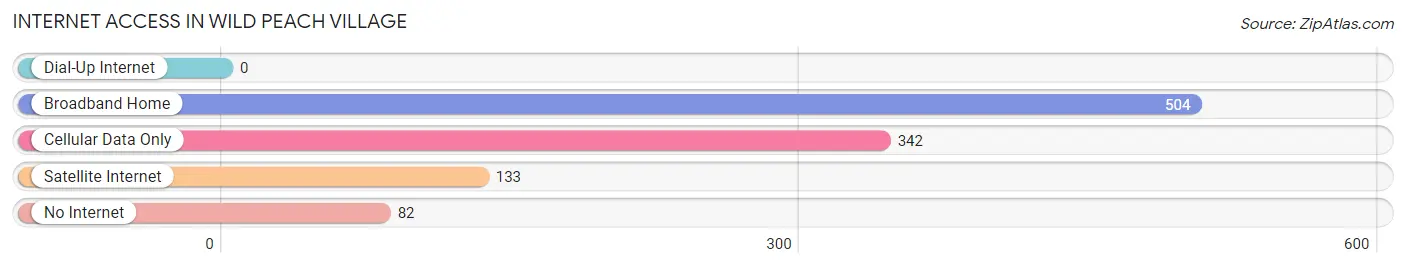
| Internet Type | # Households | % Households |
| Dial-Up Internet | 0 | 0.0% |
| Broadband Home | 504 | 48.8% |
| Cellular Data Only | 342 | 33.1% |
| Satellite Internet | 133 | 12.9% |
| No Internet | 82 | 8.0% |
| Total | 1,032 | 100.0% |
Wild Peach Village Summary
Peach Village, Texas is a small town located in the southeastern part of the state, about an hour and a half from Houston. It is situated in the heart of the Brazos River Valley, and is surrounded by rolling hills and lush green pastures. The town is home to a population of just over 1,000 people, and is known for its friendly atmosphere and laid-back lifestyle.
The history of Peach Village dates back to the early 1800s, when the area was first settled by a group of German immigrants. The town was originally called “Wild Peach”, and was named after the wild peach trees that grew in abundance in the area. The town was officially incorporated in 1891, and has since grown to become a thriving community.
The geography of Peach Village is characterized by rolling hills and lush green pastures. The town is situated in the Brazos River Valley, and is surrounded by several small lakes and rivers. The area is known for its mild climate, with temperatures rarely reaching extreme highs or lows.
The economy of Peach Village is largely based on agriculture. The town is home to several farms and ranches, and is known for its production of hay, cotton, and other crops. The town also has a thriving tourism industry, with many visitors coming to enjoy the area’s natural beauty and laid-back atmosphere.
The demographics of Peach Village are largely made up of white, non-Hispanic residents. The town has a median household income of $45,000, and the poverty rate is slightly above the national average. The town is also home to a large Hispanic population, with nearly a quarter of the population identifying as Hispanic or Latino.
Overall, Peach Village is a small town with a rich history and a friendly atmosphere. The town is known for its agricultural roots, and its laid-back lifestyle. The town is also home to a diverse population, with a mix of white, non-Hispanic, and Hispanic residents. The town is a great place to live, work, and raise a family, and is a great example of the beauty and charm of small-town Texas.
Common Questions
What is Per Capita Income in Wild Peach Village?
Per Capita income in Wild Peach Village is $32,923.
What is the Median Family Income in Wild Peach Village?
Median Family Income in Wild Peach Village is $81,136.
What is the Median Household income in Wild Peach Village?
Median Household Income in Wild Peach Village is $53,182.
What is Income or Wage Gap in Wild Peach Village?
Income or Wage Gap in Wild Peach Village is 30.4%.
Women in Wild Peach Village earn 69.6 cents for every dollar earned by a man.
What is Inequality or Gini Index in Wild Peach Village?
Inequality or Gini Index in Wild Peach Village is 0.42.
What is the Total Population of Wild Peach Village?
Total Population of Wild Peach Village is 2,325.
What is the Total Male Population of Wild Peach Village?
Total Male Population of Wild Peach Village is 1,329.
What is the Total Female Population of Wild Peach Village?
Total Female Population of Wild Peach Village is 996.
What is the Ratio of Males per 100 Females in Wild Peach Village?
There are 133.43 Males per 100 Females in Wild Peach Village.
What is the Ratio of Females per 100 Males in Wild Peach Village?
There are 74.94 Females per 100 Males in Wild Peach Village.
What is the Median Population Age in Wild Peach Village?
Median Population Age in Wild Peach Village is 48.5 Years.
What is the Average Family Size in Wild Peach Village
Average Family Size in Wild Peach Village is 2.7 People.
What is the Average Household Size in Wild Peach Village
Average Household Size in Wild Peach Village is 2.2 People.
How Large is the Labor Force in Wild Peach Village?
There are 888 People in the Labor Forcein in Wild Peach Village.
What is the Percentage of People in the Labor Force in Wild Peach Village?
46.7% of People are in the Labor Force in Wild Peach Village.
What is the Unemployment Rate in Wild Peach Village?
Unemployment Rate in Wild Peach Village is 8.6%.