Whitney, TX Map & Demographics
Whitney Map
Whitney Overview
$22,210
PER CAPITA INCOME
$49,808
AVG FAMILY INCOME
$39,215
AVG HOUSEHOLD INCOME
48.0%
WAGE / INCOME GAP [ % ]
52.0¢/ $1
WAGE / INCOME GAP [ $ ]
0.44
INEQUALITY / GINI INDEX
2,336
TOTAL POPULATION
1,115
MALE POPULATION
1,221
FEMALE POPULATION
91.32
MALES / 100 FEMALES
109.51
FEMALES / 100 MALES
37.9
MEDIAN AGE
3.2
AVG FAMILY SIZE
2.6
AVG HOUSEHOLD SIZE
1,006
LABOR FORCE [ PEOPLE ]
55.5%
PERCENT IN LABOR FORCE
3.2%
UNEMPLOYMENT RATE
Whitney Zip Codes
Whitney Area Codes
Income in Whitney
Income Overview in Whitney
Per Capita Income in Whitney is $22,210, while median incomes of families and households are $49,808 and $39,215 respectively.
| Characteristic | Number | Measure |
| Per Capita Income | 2,336 | $22,210 |
| Median Family Income | 550 | $49,808 |
| Mean Family Income | 550 | $63,071 |
| Median Household Income | 835 | $39,215 |
| Mean Household Income | 835 | $53,785 |
| Income Deficit | 550 | $0 |
| Wage / Income Gap (%) | 2,336 | 47.95% |
| Wage / Income Gap ($) | 2,336 | 52.05¢ per $1 |
| Gini / Inequality Index | 2,336 | 0.44 |
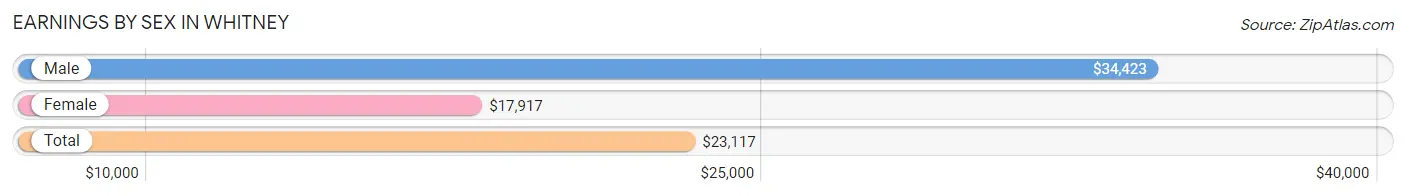
Earnings by Sex in Whitney
Average Earnings in Whitney are $23,117, $34,423 for men and $17,917 for women, a difference of 47.9%.
| Sex | Number | Average Earnings |
| Male | 532 (52.7%) | $34,423 |
| Female | 478 (47.3%) | $17,917 |
| Total | 1,010 (100.0%) | $23,117 |
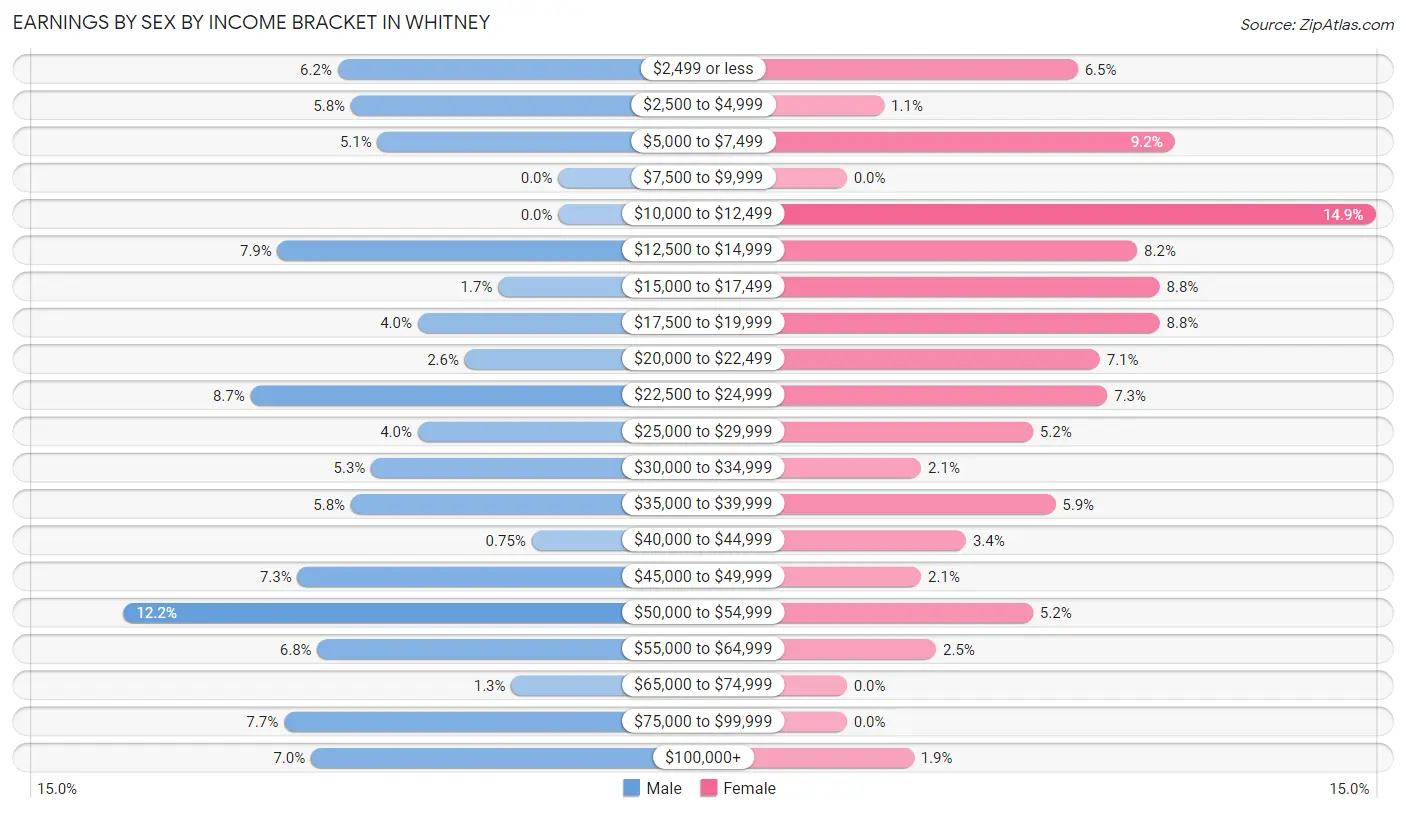
Earnings by Sex by Income Bracket in Whitney
The most common earnings brackets in Whitney are $50,000 to $54,999 for men (65 | 12.2%) and $10,000 to $12,499 for women (71 | 14.8%).
| Income | Male | Female |
| $2,499 or less | 33 (6.2%) | 31 (6.5%) |
| $2,500 to $4,999 | 31 (5.8%) | 5 (1.1%) |
| $5,000 to $7,499 | 27 (5.1%) | 44 (9.2%) |
| $7,500 to $9,999 | 0 (0.0%) | 0 (0.0%) |
| $10,000 to $12,499 | 0 (0.0%) | 71 (14.8%) |
| $12,500 to $14,999 | 42 (7.9%) | 39 (8.2%) |
| $15,000 to $17,499 | 9 (1.7%) | 42 (8.8%) |
| $17,500 to $19,999 | 21 (4.0%) | 42 (8.8%) |
| $20,000 to $22,499 | 14 (2.6%) | 34 (7.1%) |
| $22,500 to $24,999 | 46 (8.6%) | 35 (7.3%) |
| $25,000 to $29,999 | 21 (4.0%) | 25 (5.2%) |
| $30,000 to $34,999 | 28 (5.3%) | 10 (2.1%) |
| $35,000 to $39,999 | 31 (5.8%) | 28 (5.9%) |
| $40,000 to $44,999 | 4 (0.7%) | 16 (3.4%) |
| $45,000 to $49,999 | 39 (7.3%) | 10 (2.1%) |
| $50,000 to $54,999 | 65 (12.2%) | 25 (5.2%) |
| $55,000 to $64,999 | 36 (6.8%) | 12 (2.5%) |
| $65,000 to $74,999 | 7 (1.3%) | 0 (0.0%) |
| $75,000 to $99,999 | 41 (7.7%) | 0 (0.0%) |
| $100,000+ | 37 (7.0%) | 9 (1.9%) |
| Total | 532 (100.0%) | 478 (100.0%) |
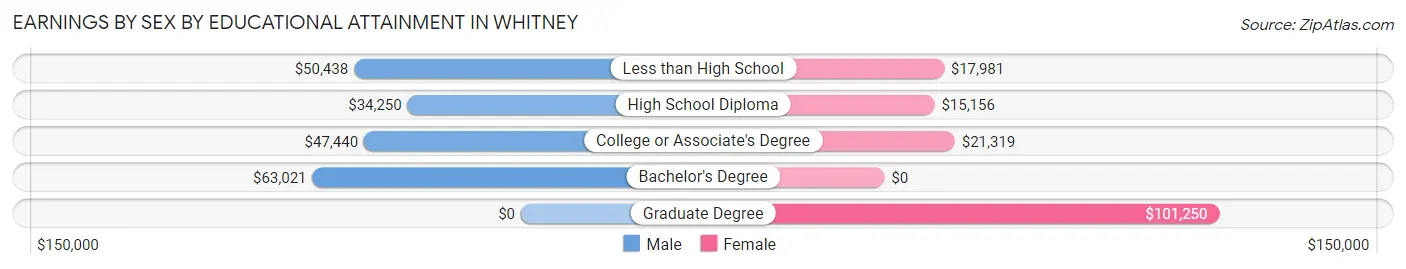
Earnings by Sex by Educational Attainment in Whitney
Average earnings in Whitney are $46,827 for men and $18,988 for women, a difference of 59.5%. Men with an educational attainment of bachelor's degree enjoy the highest average annual earnings of $63,021, while those with high school diploma education earn the least with $34,250. Women with an educational attainment of graduate degree earn the most with the average annual earnings of $101,250, while those with high school diploma education have the smallest earnings of $15,156.
| Educational Attainment | Male Income | Female Income |
| Less than High School | $50,438 | $17,981 |
| High School Diploma | $34,250 | $15,156 |
| College or Associate's Degree | $47,440 | $21,319 |
| Bachelor's Degree | $63,021 | $0 |
| Graduate Degree | - | - |
| Total | $46,827 | $18,988 |
Family Income in Whitney
Family Income Brackets in Whitney
According to the Whitney family income data, there are 124 families falling into the $50,000 to $74,999 income range, which is the most common income bracket and makes up 22.6% of all families. Conversely, the $200,000+ income bracket is the least frequent group with only 7 families (1.3%) belonging to this category.
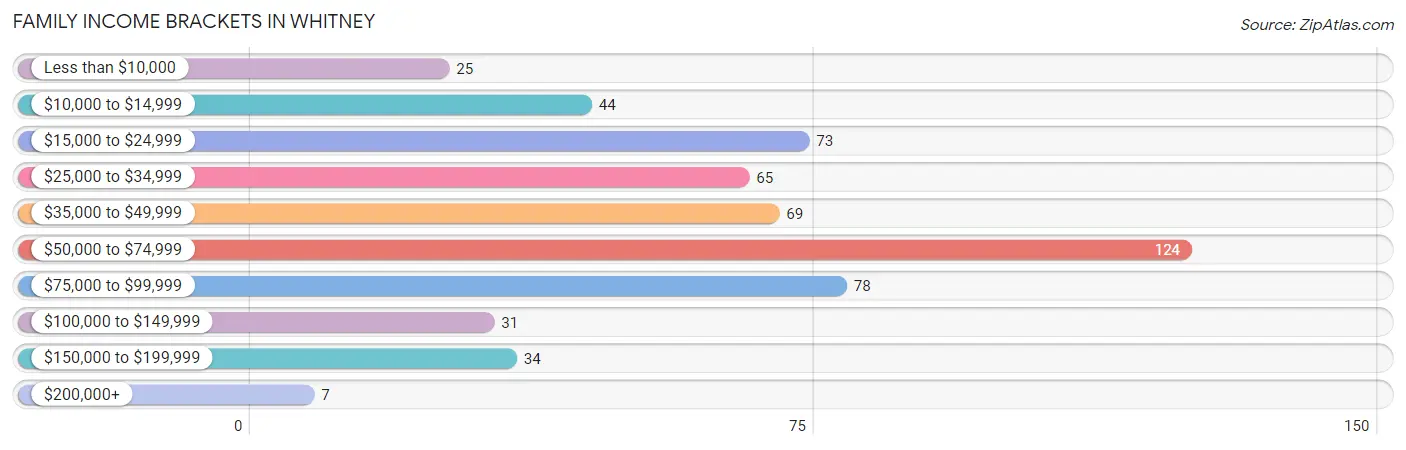
| Income Bracket | # Families | % Families |
| Less than $10,000 | 25 | 4.5% |
| $10,000 to $14,999 | 44 | 8.0% |
| $15,000 to $24,999 | 73 | 13.3% |
| $25,000 to $34,999 | 65 | 11.8% |
| $35,000 to $49,999 | 69 | 12.5% |
| $50,000 to $74,999 | 124 | 22.5% |
| $75,000 to $99,999 | 78 | 14.2% |
| $100,000 to $149,999 | 31 | 5.6% |
| $150,000 to $199,999 | 34 | 6.2% |
| $200,000+ | 7 | 1.3% |
Family Income by Famaliy Size in Whitney
5-person families (38 | 6.9%) account for the highest median family income in Whitney with $118,125 per family, while 2-person families (278 | 50.5%) have the highest median income of $24,166 per family member.
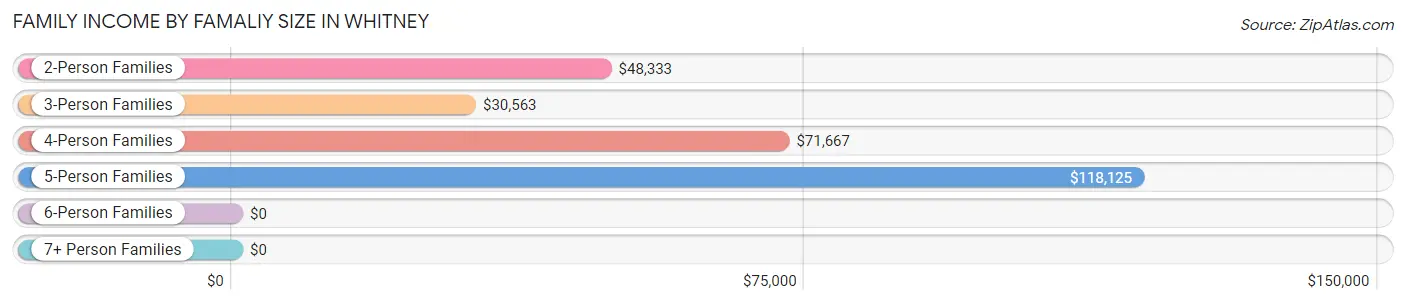
| Income Bracket | # Families | Median Income |
| 2-Person Families | 278 (50.5%) | $48,333 |
| 3-Person Families | 127 (23.1%) | $30,563 |
| 4-Person Families | 98 (17.8%) | $71,667 |
| 5-Person Families | 38 (6.9%) | $118,125 |
| 6-Person Families | 9 (1.6%) | $0 |
| 7+ Person Families | 0 (0.0%) | $0 |
| Total | 550 (100.0%) | $49,808 |
Family Income by Number of Earners in Whitney
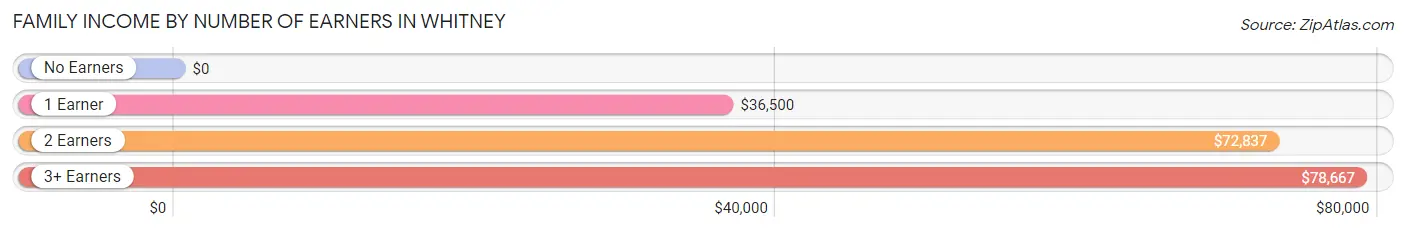
| Number of Earners | # Families | Median Income |
| No Earners | 77 (14.0%) | $0 |
| 1 Earner | 278 (50.5%) | $36,500 |
| 2 Earners | 169 (30.7%) | $72,837 |
| 3+ Earners | 26 (4.7%) | $78,667 |
| Total | 550 (100.0%) | $49,808 |
Household Income in Whitney
Household Income Brackets in Whitney
With 174 households falling in the category, the $50,000 to $74,999 income range is the most frequent in Whitney, accounting for 20.8% of all households. In contrast, only 7 households (0.8%) fall into the $200,000+ income bracket, making it the least populous group.
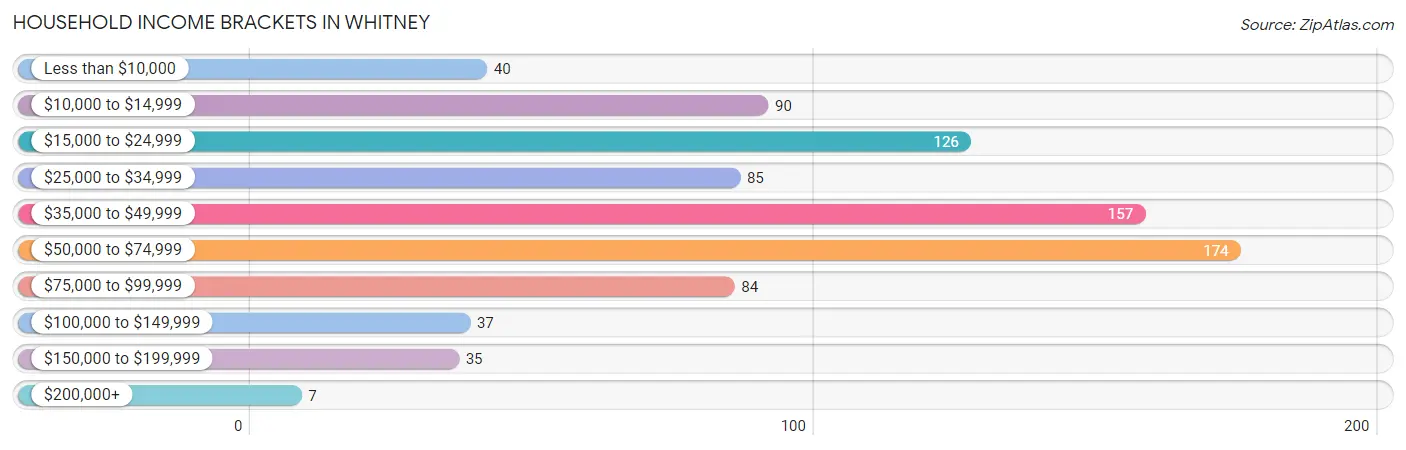
| Income Bracket | # Households | % Households |
| Less than $10,000 | 40 | 4.8% |
| $10,000 to $14,999 | 90 | 10.8% |
| $15,000 to $24,999 | 126 | 15.1% |
| $25,000 to $34,999 | 85 | 10.2% |
| $35,000 to $49,999 | 157 | 18.8% |
| $50,000 to $74,999 | 174 | 20.8% |
| $75,000 to $99,999 | 84 | 10.1% |
| $100,000 to $149,999 | 37 | 4.4% |
| $150,000 to $199,999 | 35 | 4.2% |
| $200,000+ | 7 | 0.8% |
Household Income by Householder Age in Whitney
The median household income in Whitney is $39,215, with the highest median household income of $68,750 found in the 45 to 64 years age bracket for the primary householder. A total of 248 households (29.7%) fall into this category. Meanwhile, the 15 to 24 years age bracket for the primary householder has the lowest median household income of $0, with 52 households (6.2%) in this group.
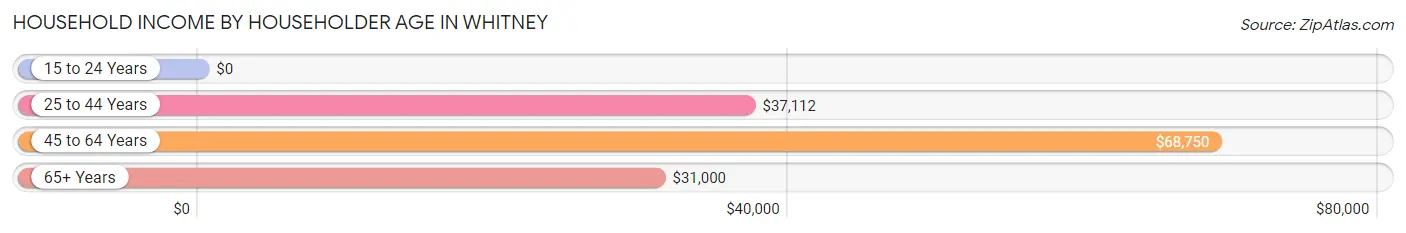
| Income Bracket | # Households | Median Income |
| 15 to 24 Years | 52 (6.2%) | $0 |
| 25 to 44 Years | 317 (38.0%) | $37,112 |
| 45 to 64 Years | 248 (29.7%) | $68,750 |
| 65+ Years | 218 (26.1%) | $31,000 |
| Total | 835 (100.0%) | $39,215 |
Poverty in Whitney
Income Below Poverty by Sex and Age in Whitney
With 23.3% poverty level for males and 31.2% for females among the residents of Whitney, 15 year old males and 6 to 11 year old females are the most vulnerable to poverty, with 2 males (100.0%) and 62 females (60.8%) in their respective age groups living below the poverty level.
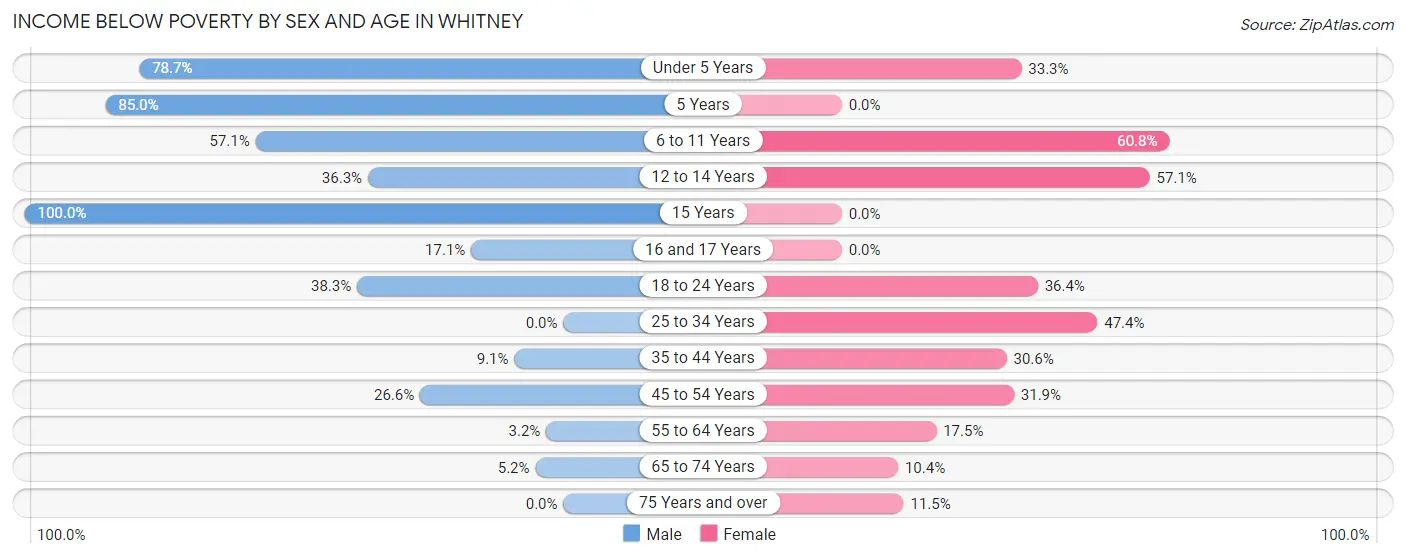
| Age Bracket | Male | Female |
| Under 5 Years | 37 (78.7%) | 32 (33.3%) |
| 5 Years | 17 (85.0%) | 0 (0.0%) |
| 6 to 11 Years | 36 (57.1%) | 62 (60.8%) |
| 12 to 14 Years | 41 (36.3%) | 12 (57.1%) |
| 15 Years | 2 (100.0%) | 0 (0.0%) |
| 16 and 17 Years | 13 (17.1%) | 0 (0.0%) |
| 18 to 24 Years | 54 (38.3%) | 28 (36.4%) |
| 25 to 34 Years | 0 (0.0%) | 83 (47.4%) |
| 35 to 44 Years | 12 (9.1%) | 37 (30.6%) |
| 45 to 54 Years | 25 (26.6%) | 46 (31.9%) |
| 55 to 64 Years | 5 (3.2%) | 17 (17.5%) |
| 65 to 74 Years | 4 (5.2%) | 12 (10.4%) |
| 75 Years and over | 0 (0.0%) | 11 (11.5%) |
| Total | 246 (23.3%) | 340 (31.2%) |
Income Above Poverty by Sex and Age in Whitney
According to the poverty statistics in Whitney, males aged 25 to 34 years and females aged 15 years are the age groups that are most secure financially, with 100.0% of males and 100.0% of females in these age groups living above the poverty line.
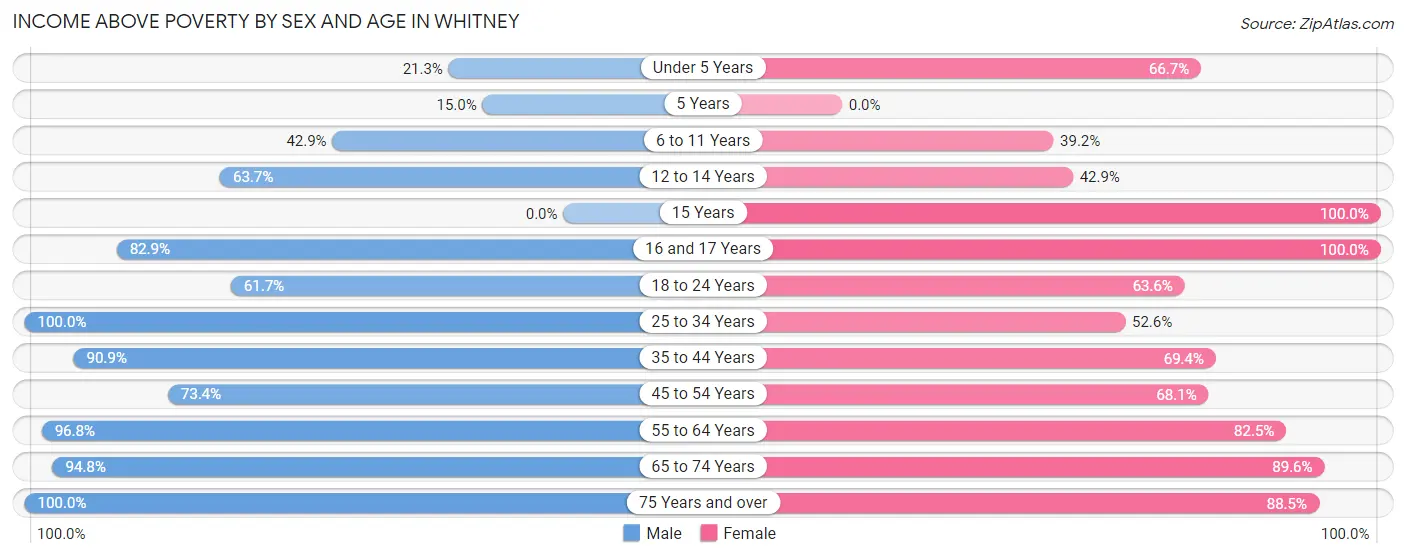
| Age Bracket | Male | Female |
| Under 5 Years | 10 (21.3%) | 64 (66.7%) |
| 5 Years | 3 (15.0%) | 0 (0.0%) |
| 6 to 11 Years | 27 (42.9%) | 40 (39.2%) |
| 12 to 14 Years | 72 (63.7%) | 9 (42.9%) |
| 15 Years | 0 (0.0%) | 20 (100.0%) |
| 16 and 17 Years | 63 (82.9%) | 26 (100.0%) |
| 18 to 24 Years | 87 (61.7%) | 49 (63.6%) |
| 25 to 34 Years | 77 (100.0%) | 92 (52.6%) |
| 35 to 44 Years | 120 (90.9%) | 84 (69.4%) |
| 45 to 54 Years | 69 (73.4%) | 98 (68.1%) |
| 55 to 64 Years | 152 (96.8%) | 80 (82.5%) |
| 65 to 74 Years | 73 (94.8%) | 103 (89.6%) |
| 75 Years and over | 56 (100.0%) | 85 (88.5%) |
| Total | 809 (76.7%) | 750 (68.8%) |
Income Below Poverty Among Married-Couple Families in Whitney
The poverty statistics for married-couple families in Whitney show that 9.8% or 29 of the total 297 families live below the poverty line. Families with 3 or 4 children have the highest poverty rate of 29.0%, comprising of 9 families. On the other hand, families with 1 or 2 children have the lowest poverty rate of 0.0%, which includes 0 families.
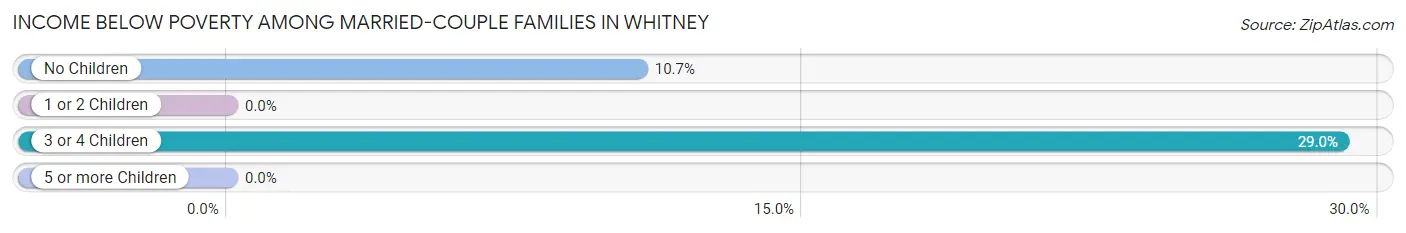
| Children | Above Poverty | Below Poverty |
| No Children | 167 (89.3%) | 20 (10.7%) |
| 1 or 2 Children | 79 (100.0%) | 0 (0.0%) |
| 3 or 4 Children | 22 (71.0%) | 9 (29.0%) |
| 5 or more Children | 0 (0.0%) | 0 (0.0%) |
| Total | 268 (90.2%) | 29 (9.8%) |
Income Below Poverty Among Single-Parent Households in Whitney
According to the poverty data in Whitney, 6.2% or 2 single-father households and 54.3% or 120 single-mother households are living below the poverty line. Among single-father households, those with 1 or 2 children have the highest poverty rate, with 2 households (33.3%) experiencing poverty. Likewise, among single-mother households, those with 3 or 4 children have the highest poverty rate, with 17 households (100.0%) falling below the poverty line.
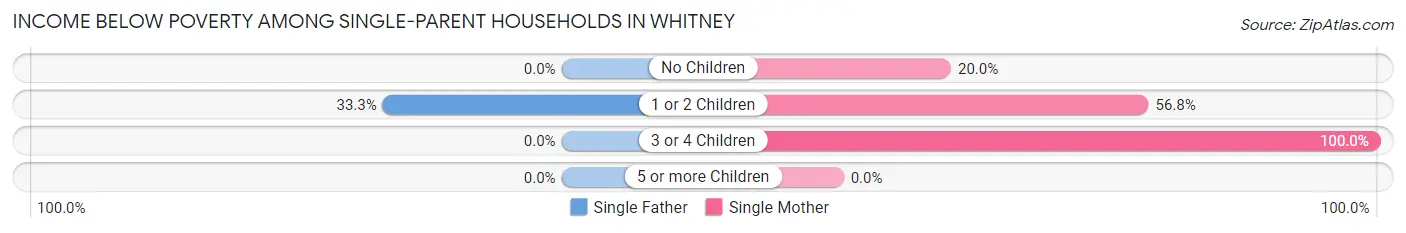
| Children | Single Father | Single Mother |
| No Children | 0 (0.0%) | 7 (20.0%) |
| 1 or 2 Children | 2 (33.3%) | 96 (56.8%) |
| 3 or 4 Children | 0 (0.0%) | 17 (100.0%) |
| 5 or more Children | 0 (0.0%) | 0 (0.0%) |
| Total | 2 (6.2%) | 120 (54.3%) |
Income Below Poverty Among Married-Couple vs Single-Parent Households in Whitney
The poverty data for Whitney shows that 29 of the married-couple family households (9.8%) and 122 of the single-parent households (48.2%) are living below the poverty level. Within the married-couple family households, those with 3 or 4 children have the highest poverty rate, with 9 households (29.0%) falling below the poverty line. Among the single-parent households, those with 3 or 4 children have the highest poverty rate, with 17 household (100.0%) living below poverty.
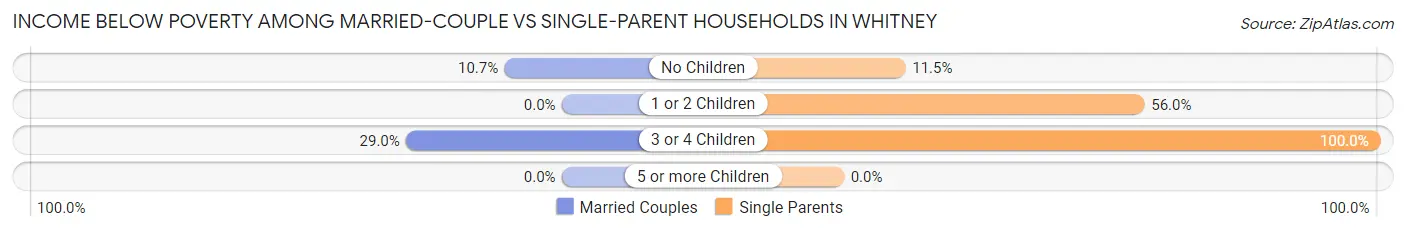
| Children | Married-Couple Families | Single-Parent Households |
| No Children | 20 (10.7%) | 7 (11.5%) |
| 1 or 2 Children | 0 (0.0%) | 98 (56.0%) |
| 3 or 4 Children | 9 (29.0%) | 17 (100.0%) |
| 5 or more Children | 0 (0.0%) | 0 (0.0%) |
| Total | 29 (9.8%) | 122 (48.2%) |
Race in Whitney
The most populous races in Whitney are White / Caucasian (1,826 | 78.2%), Hispanic or Latino (457 | 19.6%), and Two or more Races (174 | 7.4%).
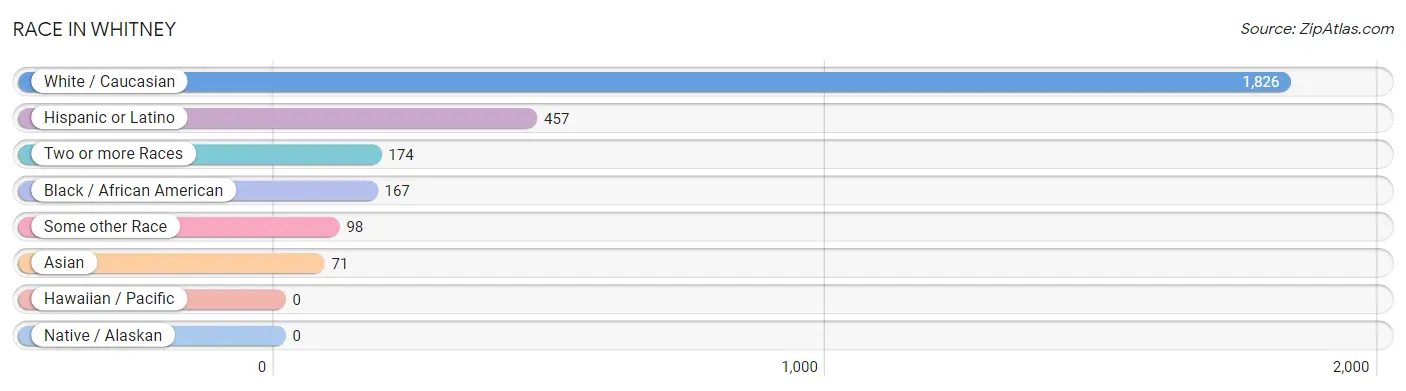
| Race | # Population | % Population |
| Asian | 71 | 3.0% |
| Black / African American | 167 | 7.1% |
| Hawaiian / Pacific | 0 | 0.0% |
| Hispanic or Latino | 457 | 19.6% |
| Native / Alaskan | 0 | 0.0% |
| White / Caucasian | 1,826 | 78.2% |
| Two or more Races | 174 | 7.4% |
| Some other Race | 98 | 4.2% |
| Total | 2,336 | 100.0% |
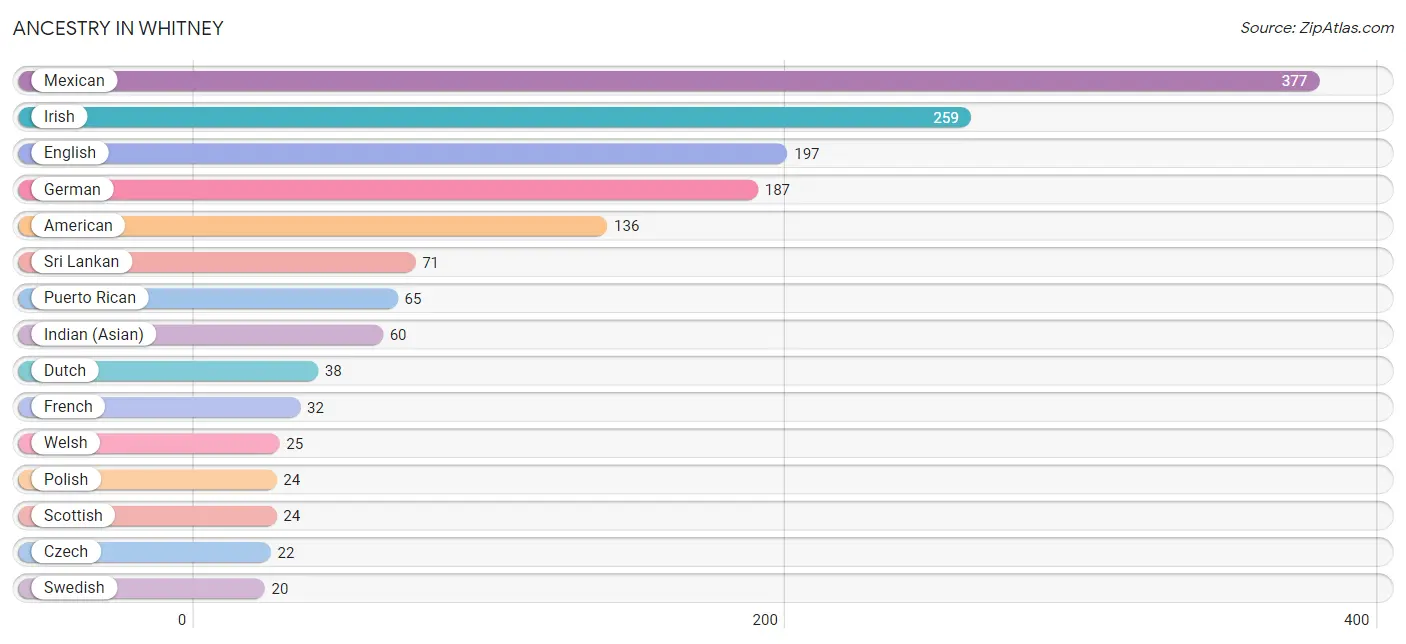
Ancestry in Whitney
The most populous ancestries reported in Whitney are Mexican (377 | 16.1%), Irish (259 | 11.1%), English (197 | 8.4%), German (187 | 8.0%), and American (136 | 5.8%), together accounting for 49.5% of all Whitney residents.
| Ancestry | # Population | % Population |
| American | 136 | 5.8% |
| British | 6 | 0.3% |
| Central American | 13 | 0.6% |
| Cherokee | 10 | 0.4% |
| Comanche | 4 | 0.2% |
| Czech | 22 | 0.9% |
| Czechoslovakian | 4 | 0.2% |
| Dutch | 38 | 1.6% |
| Dutch West Indian | 5 | 0.2% |
| English | 197 | 8.4% |
| Finnish | 4 | 0.2% |
| French | 32 | 1.4% |
| German | 187 | 8.0% |
| Indian (Asian) | 60 | 2.6% |
| Irish | 259 | 11.1% |
| Italian | 10 | 0.4% |
| Korean | 4 | 0.2% |
| Mexican | 377 | 16.1% |
| Navajo | 4 | 0.2% |
| Norwegian | 4 | 0.2% |
| Polish | 24 | 1.0% |
| Puerto Rican | 65 | 2.8% |
| Russian | 9 | 0.4% |
| Salvadoran | 13 | 0.6% |
| Scandinavian | 5 | 0.2% |
| Scotch-Irish | 3 | 0.1% |
| Scottish | 24 | 1.0% |
| Sri Lankan | 71 | 3.0% |
| Swedish | 20 | 0.9% |
| Swiss | 2 | 0.1% |
| Welsh | 25 | 1.1% | View All 31 Rows |
Immigrants in Whitney
The most numerous immigrant groups reported in Whitney came from Central America (101 | 4.3%), Latin America (101 | 4.3%), Mexico (101 | 4.3%), Asia (52 | 2.2%), and South Eastern Asia (52 | 2.2%), together accounting for 17.4% of all Whitney residents.
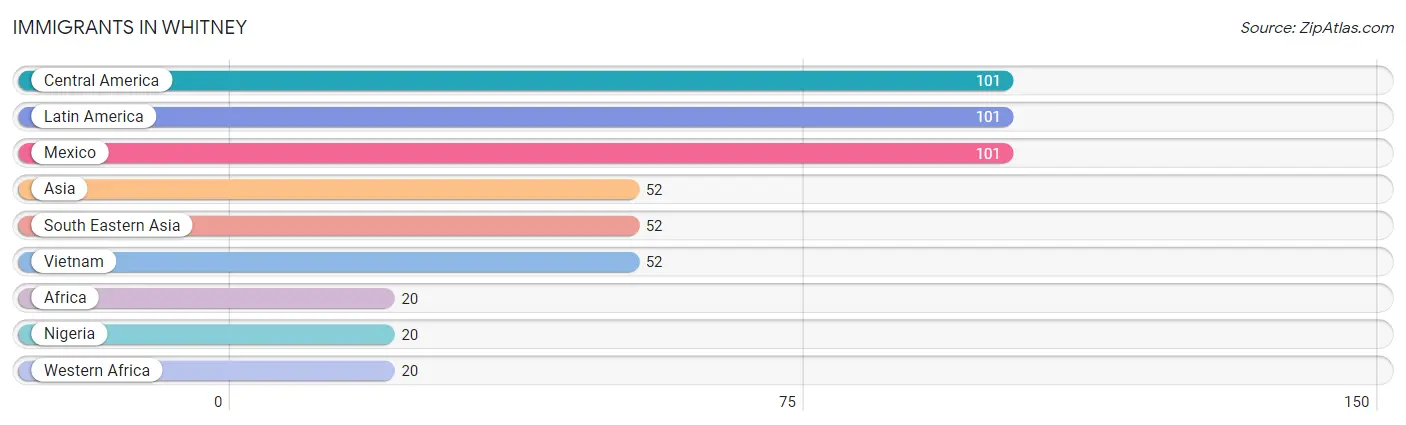
| Immigration Origin | # Population | % Population |
| Africa | 20 | 0.9% |
| Asia | 52 | 2.2% |
| Central America | 101 | 4.3% |
| Latin America | 101 | 4.3% |
| Mexico | 101 | 4.3% |
| Nigeria | 20 | 0.9% |
| South Eastern Asia | 52 | 2.2% |
| Vietnam | 52 | 2.2% |
| Western Africa | 20 | 0.9% | View All 9 Rows |
Sex and Age in Whitney
Sex and Age in Whitney
The most populous age groups in Whitney are 10 to 14 Years (150 | 13.5%) for men and 65 to 69 Years (106 | 8.7%) for women.
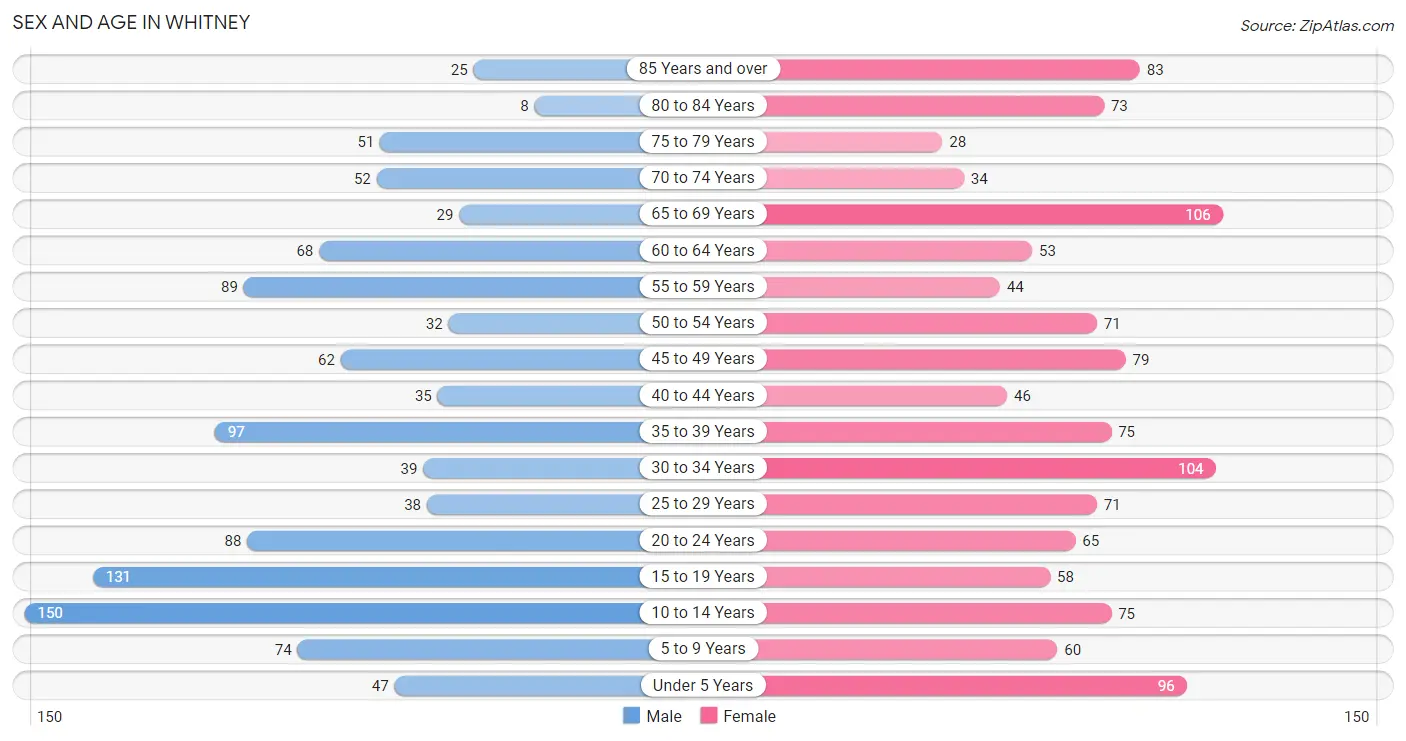
| Age Bracket | Male | Female |
| Under 5 Years | 47 (4.2%) | 96 (7.9%) |
| 5 to 9 Years | 74 (6.6%) | 60 (4.9%) |
| 10 to 14 Years | 150 (13.5%) | 75 (6.1%) |
| 15 to 19 Years | 131 (11.7%) | 58 (4.8%) |
| 20 to 24 Years | 88 (7.9%) | 65 (5.3%) |
| 25 to 29 Years | 38 (3.4%) | 71 (5.8%) |
| 30 to 34 Years | 39 (3.5%) | 104 (8.5%) |
| 35 to 39 Years | 97 (8.7%) | 75 (6.1%) |
| 40 to 44 Years | 35 (3.1%) | 46 (3.8%) |
| 45 to 49 Years | 62 (5.6%) | 79 (6.5%) |
| 50 to 54 Years | 32 (2.9%) | 71 (5.8%) |
| 55 to 59 Years | 89 (8.0%) | 44 (3.6%) |
| 60 to 64 Years | 68 (6.1%) | 53 (4.3%) |
| 65 to 69 Years | 29 (2.6%) | 106 (8.7%) |
| 70 to 74 Years | 52 (4.7%) | 34 (2.8%) |
| 75 to 79 Years | 51 (4.6%) | 28 (2.3%) |
| 80 to 84 Years | 8 (0.7%) | 73 (6.0%) |
| 85 Years and over | 25 (2.2%) | 83 (6.8%) |
| Total | 1,115 (100.0%) | 1,221 (100.0%) |
Families and Households in Whitney
Median Family Size in Whitney
The median family size in Whitney is 3.16 persons per family, with married-couple families (297 | 54.0%) accounting for the largest median family size of 3.44 persons per family. On the other hand, single male/father families (32 | 5.8%) represent the smallest median family size with 2.63 persons per family.
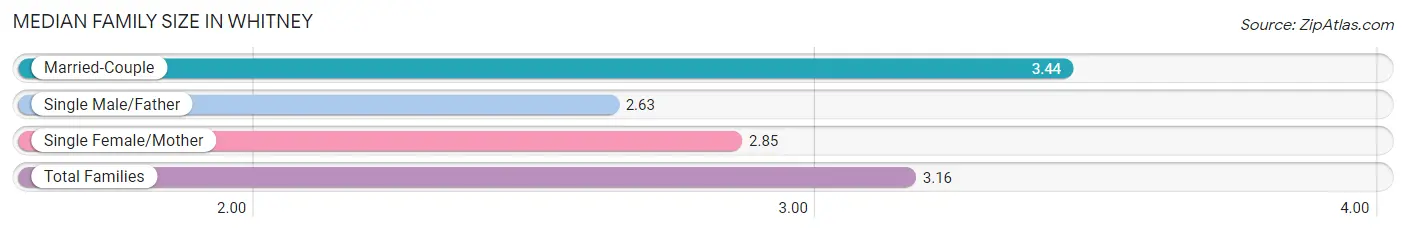
| Family Type | # Families | Family Size |
| Married-Couple | 297 (54.0%) | 3.44 |
| Single Male/Father | 32 (5.8%) | 2.63 |
| Single Female/Mother | 221 (40.2%) | 2.85 |
| Total Families | 550 (100.0%) | 3.16 |
Median Household Size in Whitney
The median household size in Whitney is 2.62 persons per household, with married-couple households (297 | 35.6%) accounting for the largest median household size of 3.53 persons per household. non-family households (285 | 34.1%) represent the smallest median household size with 1.32 persons per household.
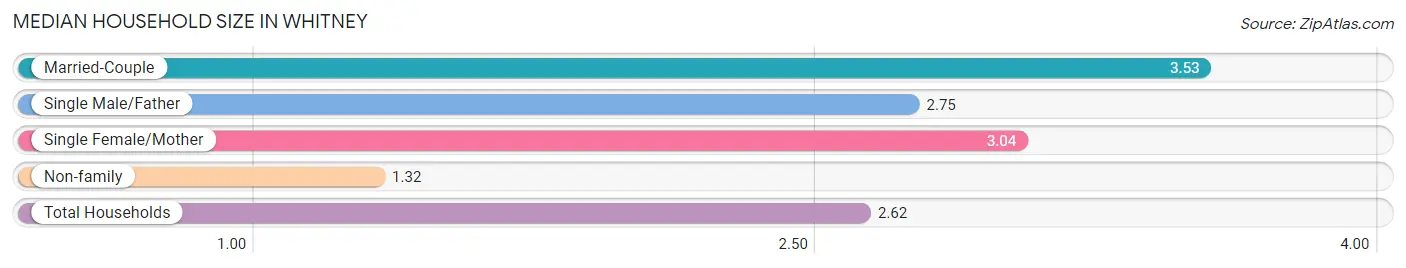
| Household Type | # Households | Household Size |
| Married-Couple | 297 (35.6%) | 3.53 |
| Single Male/Father | 32 (3.8%) | 2.75 |
| Single Female/Mother | 221 (26.5%) | 3.04 |
| Non-family | 285 (34.1%) | 1.32 |
| Total Households | 835 (100.0%) | 2.62 |
Household Size by Marriage Status in Whitney
Out of a total of 835 households in Whitney, 550 (65.9%) are family households, while 285 (34.1%) are nonfamily households. The most numerous type of family households are 2-person households, comprising 260, and the most common type of nonfamily households are 1-person households, comprising 228.
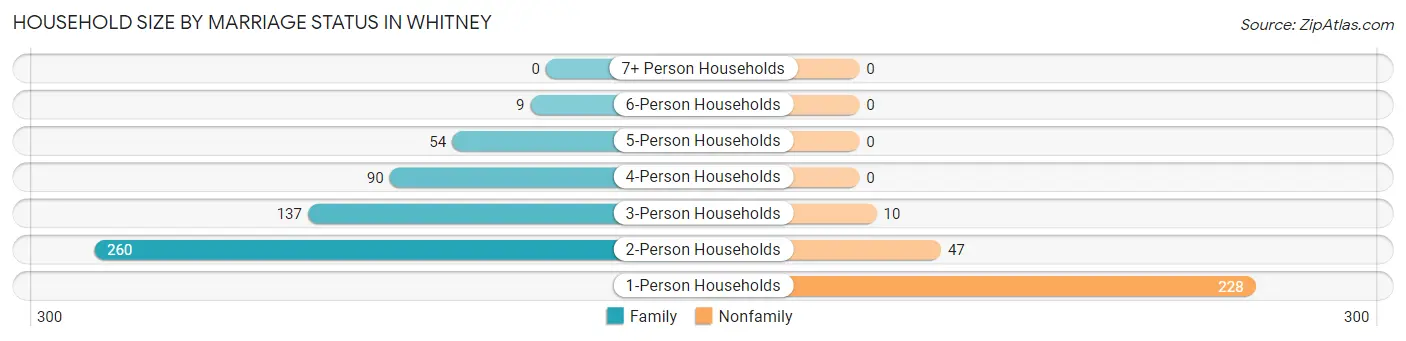
| Household Size | Family Households | Nonfamily Households |
| 1-Person Households | - | 228 (27.3%) |
| 2-Person Households | 260 (31.1%) | 47 (5.6%) |
| 3-Person Households | 137 (16.4%) | 10 (1.2%) |
| 4-Person Households | 90 (10.8%) | 0 (0.0%) |
| 5-Person Households | 54 (6.5%) | 0 (0.0%) |
| 6-Person Households | 9 (1.1%) | 0 (0.0%) |
| 7+ Person Households | 0 (0.0%) | 0 (0.0%) |
| Total | 550 (65.9%) | 285 (34.1%) |
Female Fertility in Whitney
Fertility by Age in Whitney
Average fertility rate in Whitney is 58.0 births per 1,000 women. Women in the age bracket of 20 to 34 years have the highest fertility rate with 117.0 births per 1,000 women. Women in the age bracket of 20 to 34 years acount for 90.3% of all women with births.
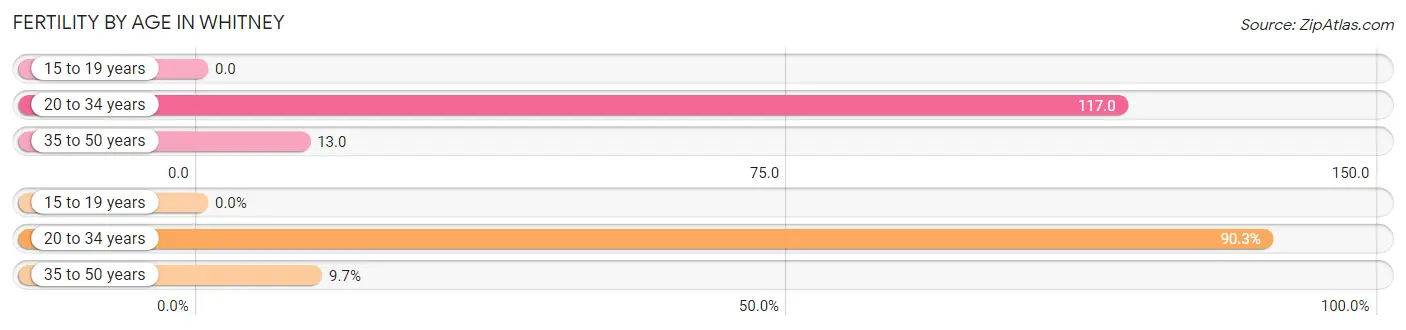
| Age Bracket | Women with Births | Births / 1,000 Women |
| 15 to 19 years | 0 (0.0%) | 0.0 |
| 20 to 34 years | 28 (90.3%) | 117.0 |
| 35 to 50 years | 3 (9.7%) | 13.0 |
| Total | 31 (100.0%) | 58.0 |
Fertility by Age by Marriage Status in Whitney
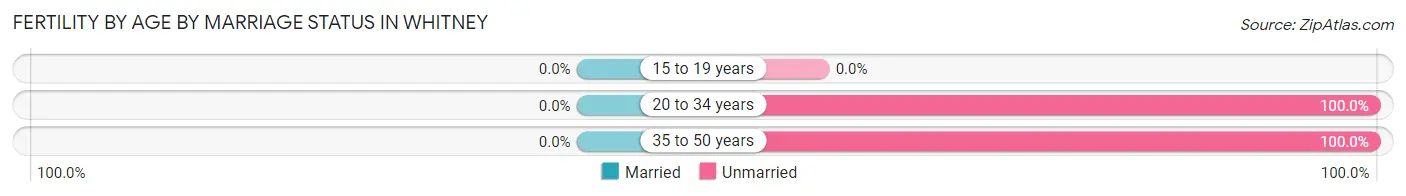
| Age Bracket | Married | Unmarried |
| 15 to 19 years | 0 (0.0%) | 0 (0.0%) |
| 20 to 34 years | 0 (0.0%) | 28 (100.0%) |
| 35 to 50 years | 0 (0.0%) | 3 (100.0%) |
| Total | 0 (0.0%) | 31 (100.0%) |
Fertility by Education in Whitney
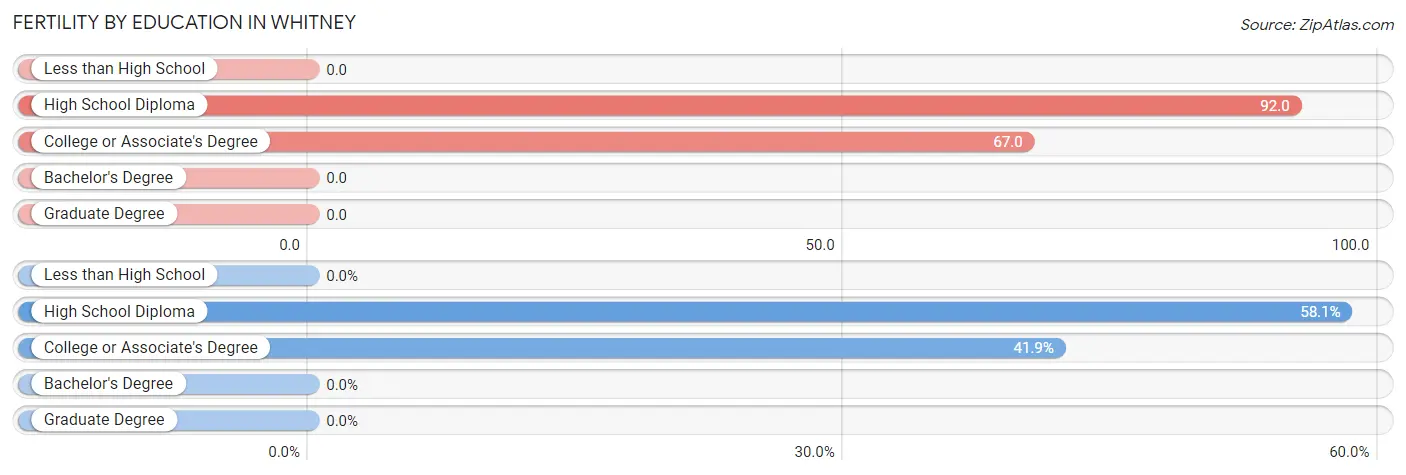
| Educational Attainment | Women with Births | Births / 1,000 Women |
| Less than High School | 0 (0.0%) | 0.0 |
| High School Diploma | 18 (58.1%) | 92.0 |
| College or Associate's Degree | 13 (41.9%) | 67.0 |
| Bachelor's Degree | 0 (0.0%) | 0.0 |
| Graduate Degree | 0 (0.0%) | 0.0 |
| Total | 31 (100.0%) | 58.0 |
Fertility by Education by Marriage Status in Whitney
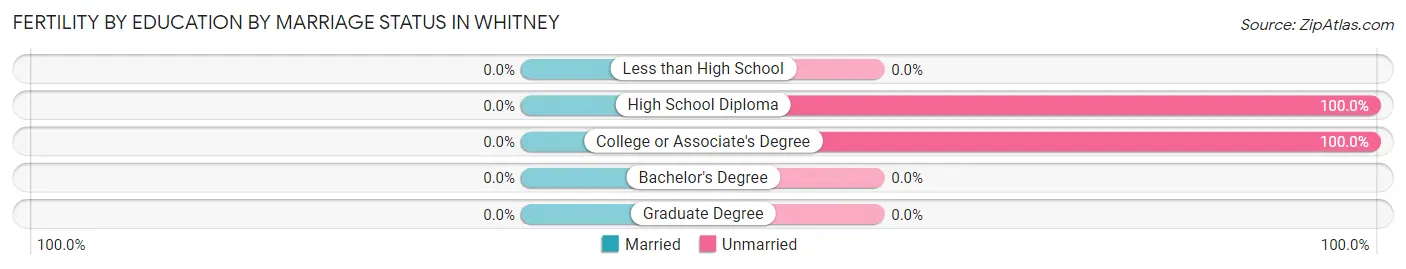
| Educational Attainment | Married | Unmarried |
| Less than High School | 0 (0.0%) | 0 (0.0%) |
| High School Diploma | 0 (0.0%) | 18 (100.0%) |
| College or Associate's Degree | 0 (0.0%) | 13 (100.0%) |
| Bachelor's Degree | 0 (0.0%) | 0 (0.0%) |
| Graduate Degree | 0 (0.0%) | 0 (0.0%) |
| Total | 0 (0.0%) | 31 (100.0%) |
Employment Characteristics in Whitney
Employment by Class of Employer in Whitney
Among the 952 employed individuals in Whitney, private company employees (696 | 73.1%), local government employees (115 | 12.1%), and self-employed (not incorporated) (57 | 6.0%) make up the most common classes of employment.
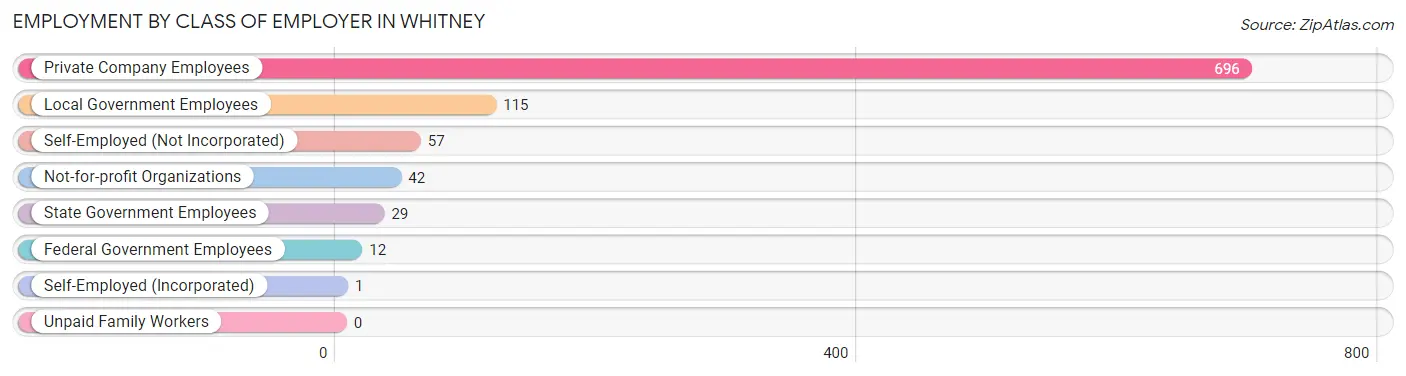
| Employer Class | # Employees | % Employees |
| Private Company Employees | 696 | 73.1% |
| Self-Employed (Incorporated) | 1 | 0.1% |
| Self-Employed (Not Incorporated) | 57 | 6.0% |
| Not-for-profit Organizations | 42 | 4.4% |
| Local Government Employees | 115 | 12.1% |
| State Government Employees | 29 | 3.0% |
| Federal Government Employees | 12 | 1.3% |
| Unpaid Family Workers | 0 | 0.0% |
| Total | 952 | 100.0% |
Employment Status by Age in Whitney
According to the labor force statistics for Whitney, out of the total population over 16 years of age (1,812), 55.5% or 1,006 individuals are in the labor force, with 3.2% or 32 of them unemployed. The age group with the highest labor force participation rate is 25 to 29 years, with 98.2% or 107 individuals in the labor force. Within the labor force, the 55 to 59 years age range has the highest percentage of unemployed individuals, with 15.7% or 18 of them being unemployed.
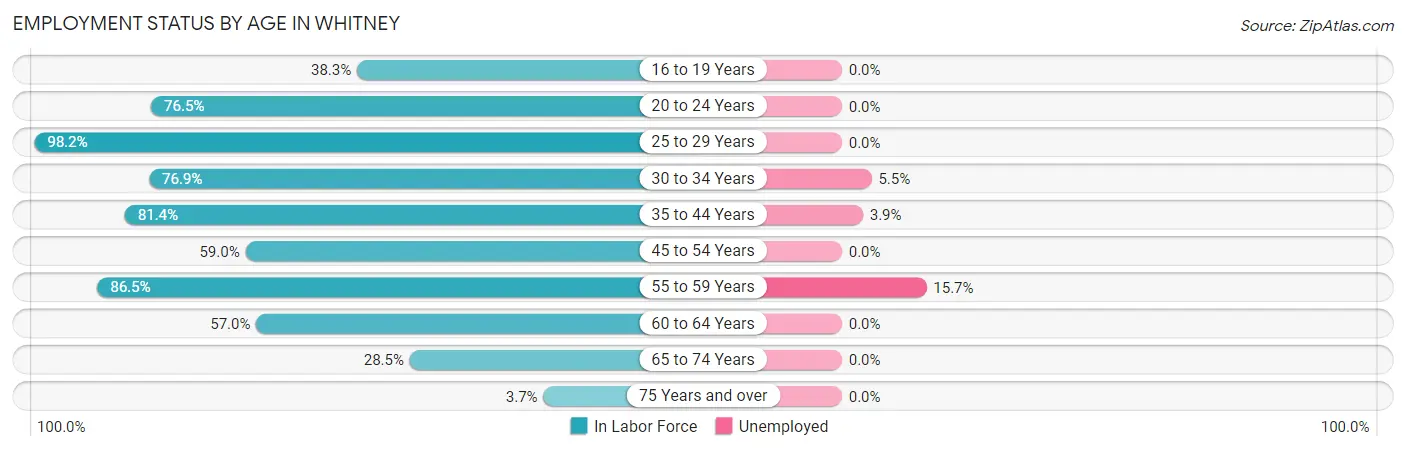
| Age Bracket | In Labor Force | Unemployed |
| 16 to 19 Years | 64 (38.3%) | 0 (0.0%) |
| 20 to 24 Years | 117 (76.5%) | 0 (0.0%) |
| 25 to 29 Years | 107 (98.2%) | 0 (0.0%) |
| 30 to 34 Years | 110 (76.9%) | 6 (5.5%) |
| 35 to 44 Years | 206 (81.4%) | 8 (3.9%) |
| 45 to 54 Years | 144 (59.0%) | 0 (0.0%) |
| 55 to 59 Years | 115 (86.5%) | 18 (15.7%) |
| 60 to 64 Years | 69 (57.0%) | 0 (0.0%) |
| 65 to 74 Years | 63 (28.5%) | 0 (0.0%) |
| 75 Years and over | 10 (3.7%) | 0 (0.0%) |
| Total | 1,006 (55.5%) | 32 (3.2%) |
Employment Status by Educational Attainment in Whitney
According to labor force statistics for Whitney, 74.9% of individuals (751) out of the total population between 25 and 64 years of age (1,003) are in the labor force, with 4.3% or 32 of them being unemployed. The group with the highest labor force participation rate are those with the educational attainment of bachelor's degree or higher, with 93.0% or 53 individuals in the labor force. Within the labor force, individuals with bachelor's degree or higher education have the highest percentage of unemployment, with 11.3% or 6 of them being unemployed.

| Educational Attainment | In Labor Force | Unemployed |
| Less than High School | 195 (80.9%) | 15 (6.2%) |
| High School Diploma | 220 (63.6%) | 0 (0.0%) |
| College / Associate Degree | 283 (78.8%) | 18 (4.9%) |
| Bachelor's Degree or higher | 53 (93.0%) | 6 (11.3%) |
| Total | 751 (74.9%) | 43 (4.3%) |
Employment Occupations by Sex in Whitney
Management, Business, Science and Arts Occupations
The most common Management, Business, Science and Arts occupations in Whitney are Community & Social Service (55 | 5.7%), Health Diagnosing & Treating (45 | 4.6%), Education Instruction & Library (27 | 2.8%), Management (22 | 2.3%), and Health Technologists (19 | 1.9%).
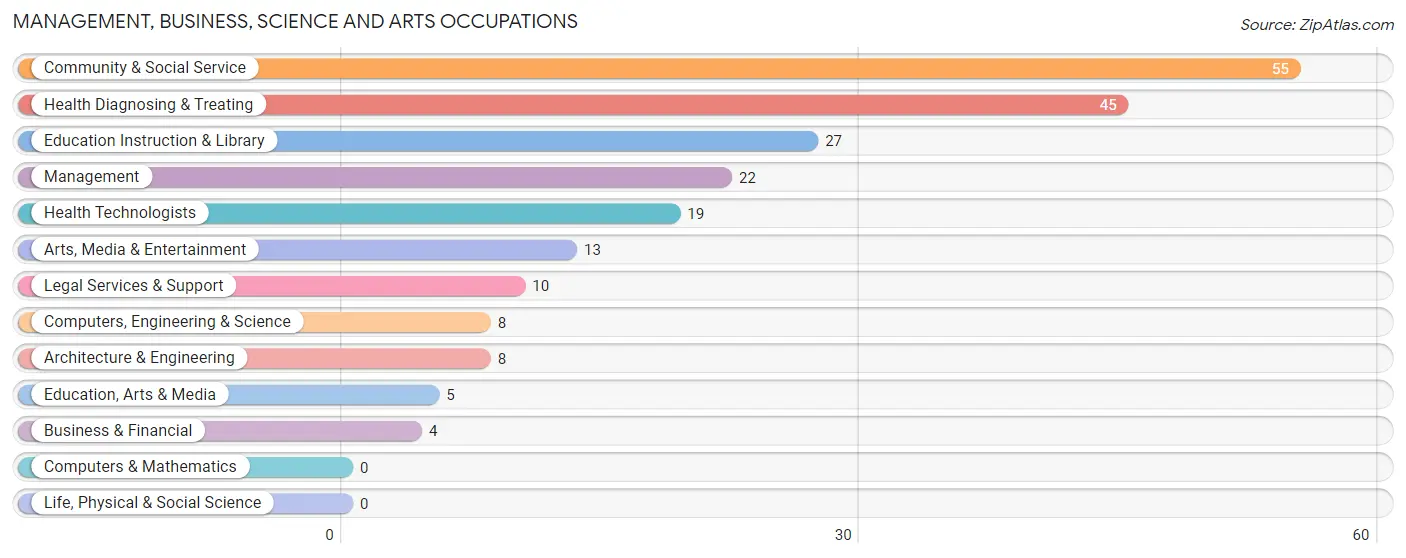
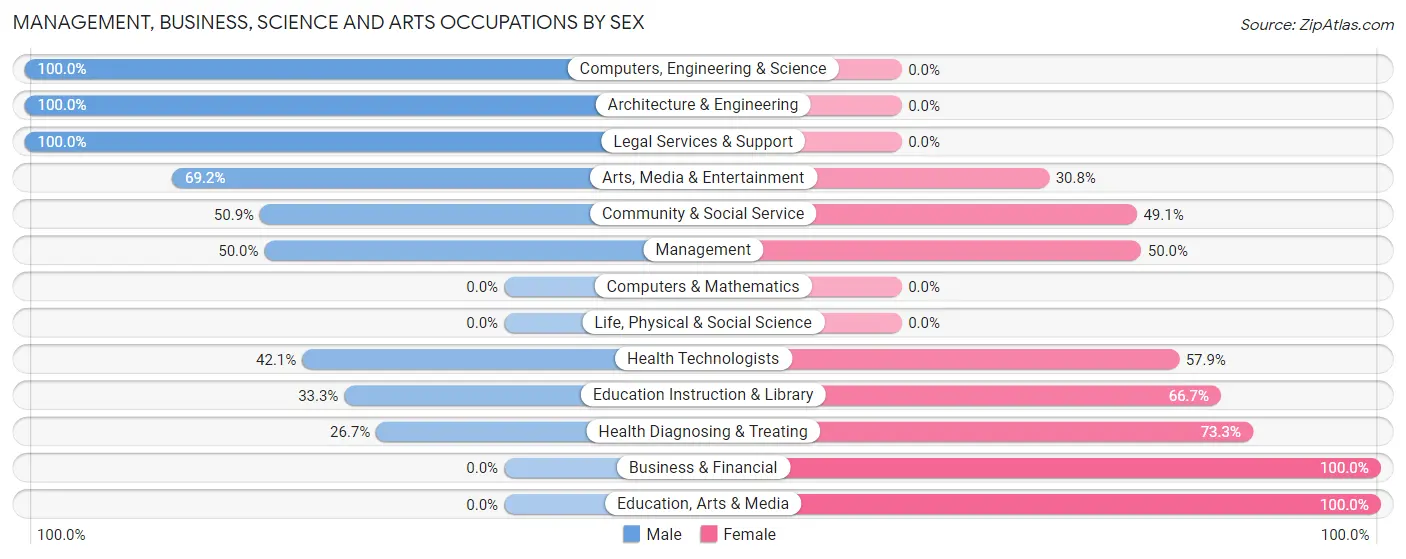
Management, Business, Science and Arts Occupations by Sex
Within the Management, Business, Science and Arts occupations in Whitney, the most male-oriented occupations are Computers, Engineering & Science (100.0%), Architecture & Engineering (100.0%), and Legal Services & Support (100.0%), while the most female-oriented occupations are Business & Financial (100.0%), Education, Arts & Media (100.0%), and Health Diagnosing & Treating (73.3%).
| Occupation | Male | Female |
| Management | 11 (50.0%) | 11 (50.0%) |
| Business & Financial | 0 (0.0%) | 4 (100.0%) |
| Computers, Engineering & Science | 8 (100.0%) | 0 (0.0%) |
| Computers & Mathematics | 0 (0.0%) | 0 (0.0%) |
| Architecture & Engineering | 8 (100.0%) | 0 (0.0%) |
| Life, Physical & Social Science | 0 (0.0%) | 0 (0.0%) |
| Community & Social Service | 28 (50.9%) | 27 (49.1%) |
| Education, Arts & Media | 0 (0.0%) | 5 (100.0%) |
| Legal Services & Support | 10 (100.0%) | 0 (0.0%) |
| Education Instruction & Library | 9 (33.3%) | 18 (66.7%) |
| Arts, Media & Entertainment | 9 (69.2%) | 4 (30.8%) |
| Health Diagnosing & Treating | 12 (26.7%) | 33 (73.3%) |
| Health Technologists | 8 (42.1%) | 11 (57.9%) |
| Total (Category) | 59 (44.0%) | 75 (56.0%) |
| Total (Overall) | 509 (52.3%) | 464 (47.7%) |
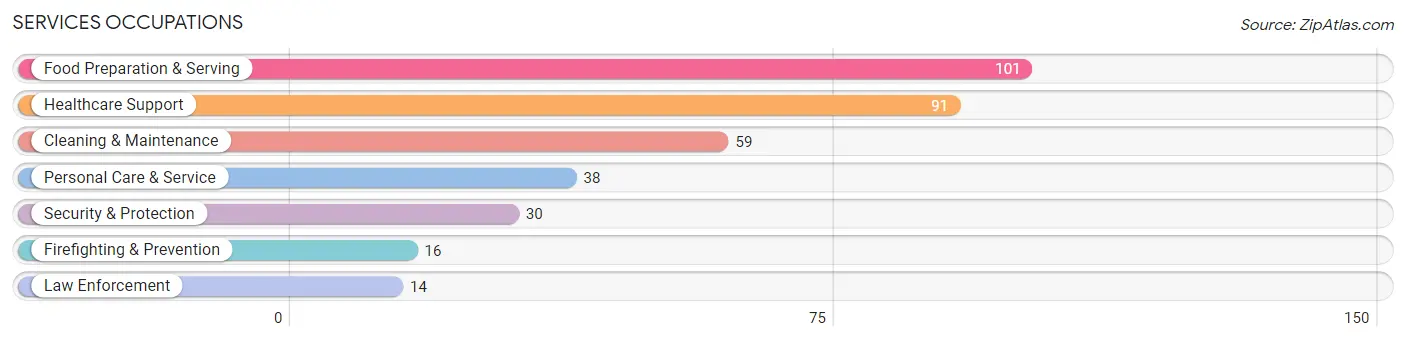
Services Occupations
The most common Services occupations in Whitney are Food Preparation & Serving (101 | 10.4%), Healthcare Support (91 | 9.3%), Cleaning & Maintenance (59 | 6.1%), Personal Care & Service (38 | 3.9%), and Security & Protection (30 | 3.1%).
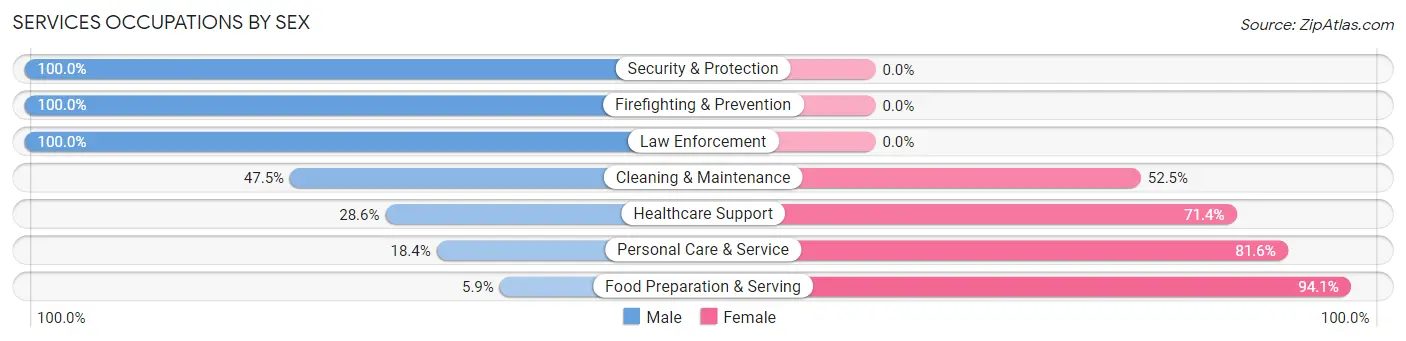
Services Occupations by Sex
Within the Services occupations in Whitney, the most male-oriented occupations are Security & Protection (100.0%), Firefighting & Prevention (100.0%), and Law Enforcement (100.0%), while the most female-oriented occupations are Food Preparation & Serving (94.1%), Personal Care & Service (81.6%), and Healthcare Support (71.4%).
| Occupation | Male | Female |
| Healthcare Support | 26 (28.6%) | 65 (71.4%) |
| Security & Protection | 30 (100.0%) | 0 (0.0%) |
| Firefighting & Prevention | 16 (100.0%) | 0 (0.0%) |
| Law Enforcement | 14 (100.0%) | 0 (0.0%) |
| Food Preparation & Serving | 6 (5.9%) | 95 (94.1%) |
| Cleaning & Maintenance | 28 (47.5%) | 31 (52.5%) |
| Personal Care & Service | 7 (18.4%) | 31 (81.6%) |
| Total (Category) | 97 (30.4%) | 222 (69.6%) |
| Total (Overall) | 509 (52.3%) | 464 (47.7%) |
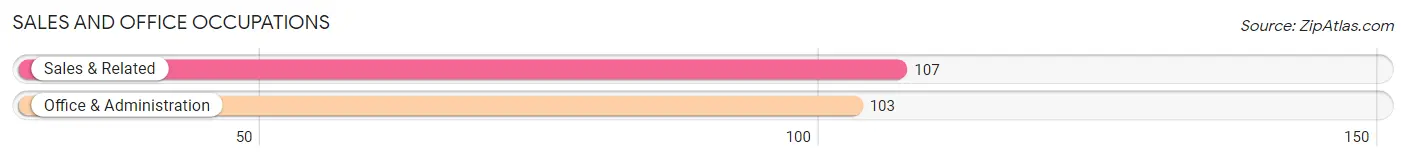
Sales and Office Occupations
The most common Sales and Office occupations in Whitney are Sales & Related (107 | 11.0%), and Office & Administration (103 | 10.6%).
Sales and Office Occupations by Sex
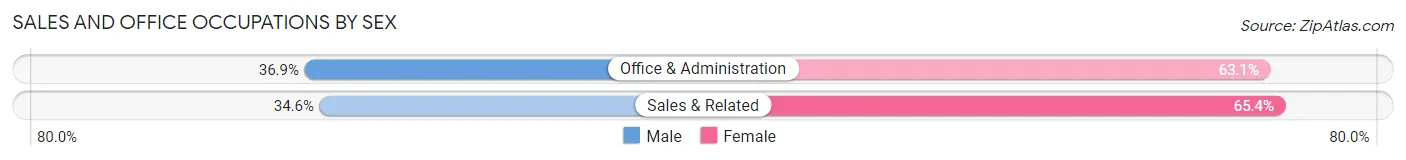
| Occupation | Male | Female |
| Sales & Related | 37 (34.6%) | 70 (65.4%) |
| Office & Administration | 38 (36.9%) | 65 (63.1%) |
| Total (Category) | 75 (35.7%) | 135 (64.3%) |
| Total (Overall) | 509 (52.3%) | 464 (47.7%) |
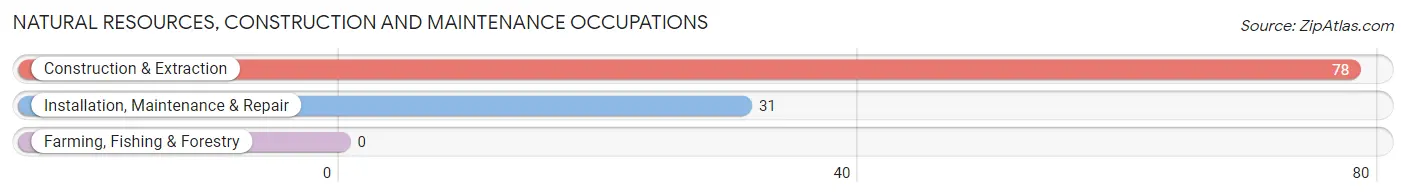
Natural Resources, Construction and Maintenance Occupations
The most common Natural Resources, Construction and Maintenance occupations in Whitney are Construction & Extraction (78 | 8.0%), and Installation, Maintenance & Repair (31 | 3.2%).
Natural Resources, Construction and Maintenance Occupations by Sex
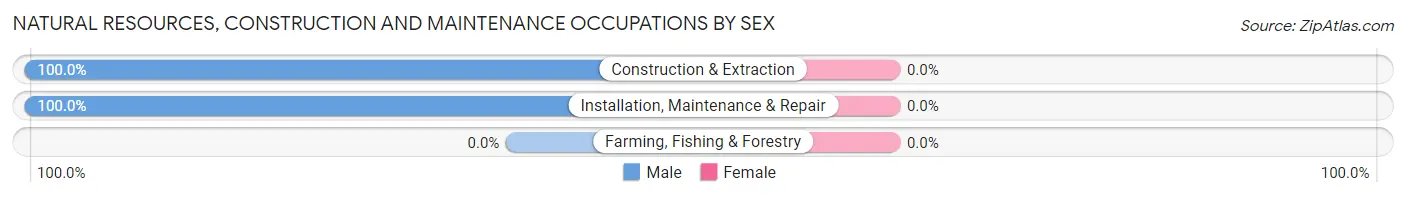
| Occupation | Male | Female |
| Farming, Fishing & Forestry | 0 (0.0%) | 0 (0.0%) |
| Construction & Extraction | 78 (100.0%) | 0 (0.0%) |
| Installation, Maintenance & Repair | 31 (100.0%) | 0 (0.0%) |
| Total (Category) | 109 (100.0%) | 0 (0.0%) |
| Total (Overall) | 509 (52.3%) | 464 (47.7%) |
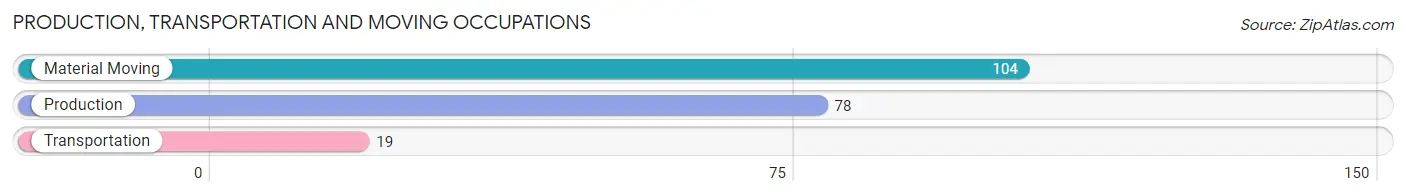
Production, Transportation and Moving Occupations
The most common Production, Transportation and Moving occupations in Whitney are Material Moving (104 | 10.7%), Production (78 | 8.0%), and Transportation (19 | 1.9%).
Production, Transportation and Moving Occupations by Sex
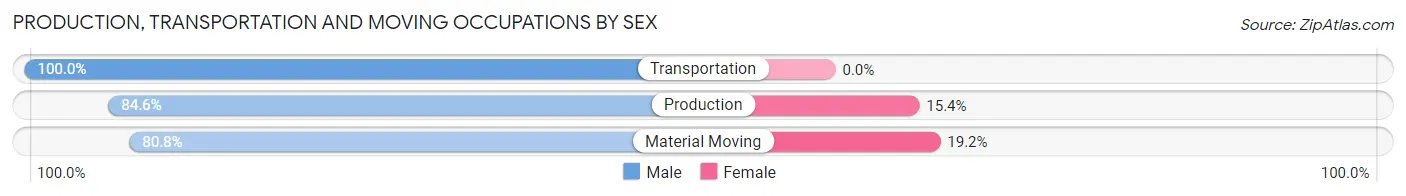
| Occupation | Male | Female |
| Production | 66 (84.6%) | 12 (15.4%) |
| Transportation | 19 (100.0%) | 0 (0.0%) |
| Material Moving | 84 (80.8%) | 20 (19.2%) |
| Total (Category) | 169 (84.1%) | 32 (15.9%) |
| Total (Overall) | 509 (52.3%) | 464 (47.7%) |
Employment Industries by Sex in Whitney
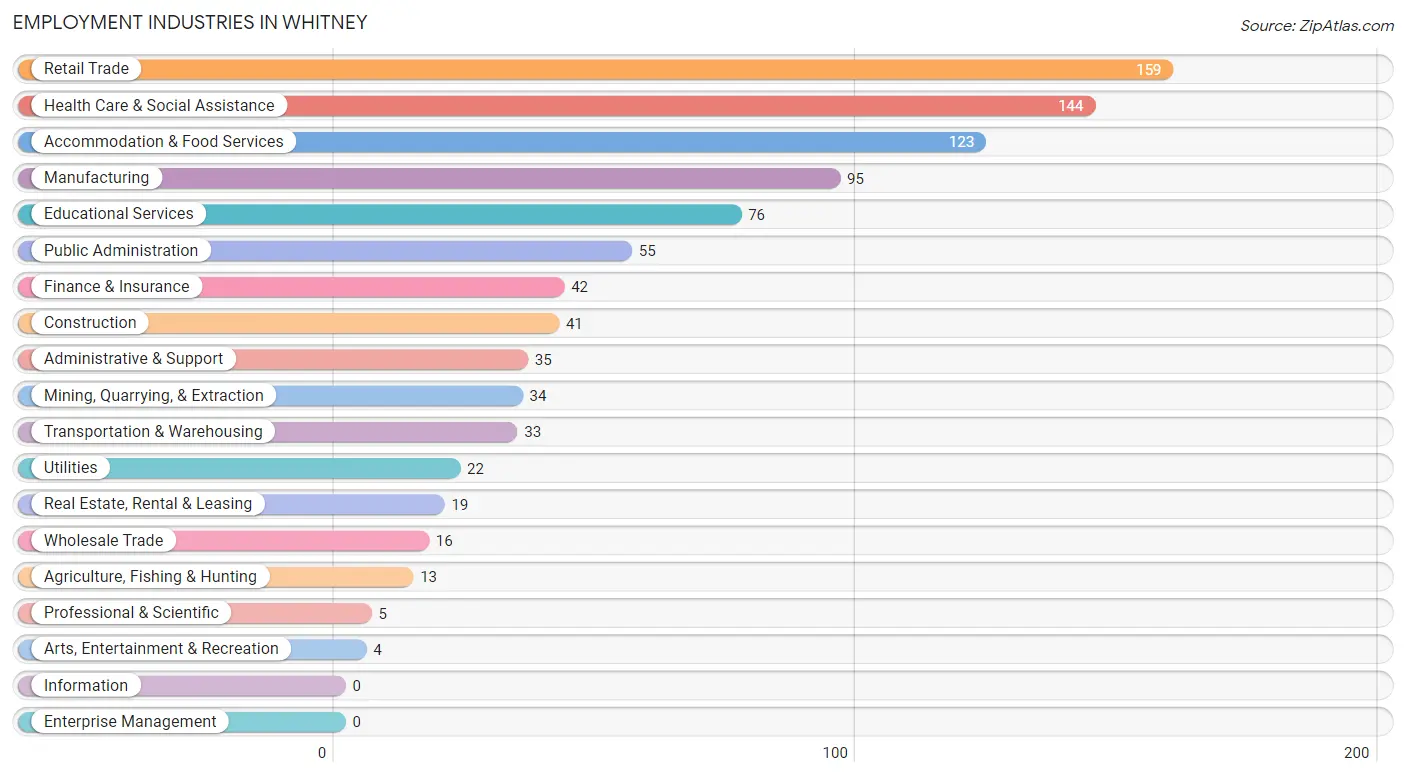
Employment Industries in Whitney
The major employment industries in Whitney include Retail Trade (159 | 16.3%), Health Care & Social Assistance (144 | 14.8%), Accommodation & Food Services (123 | 12.6%), Manufacturing (95 | 9.8%), and Educational Services (76 | 7.8%).
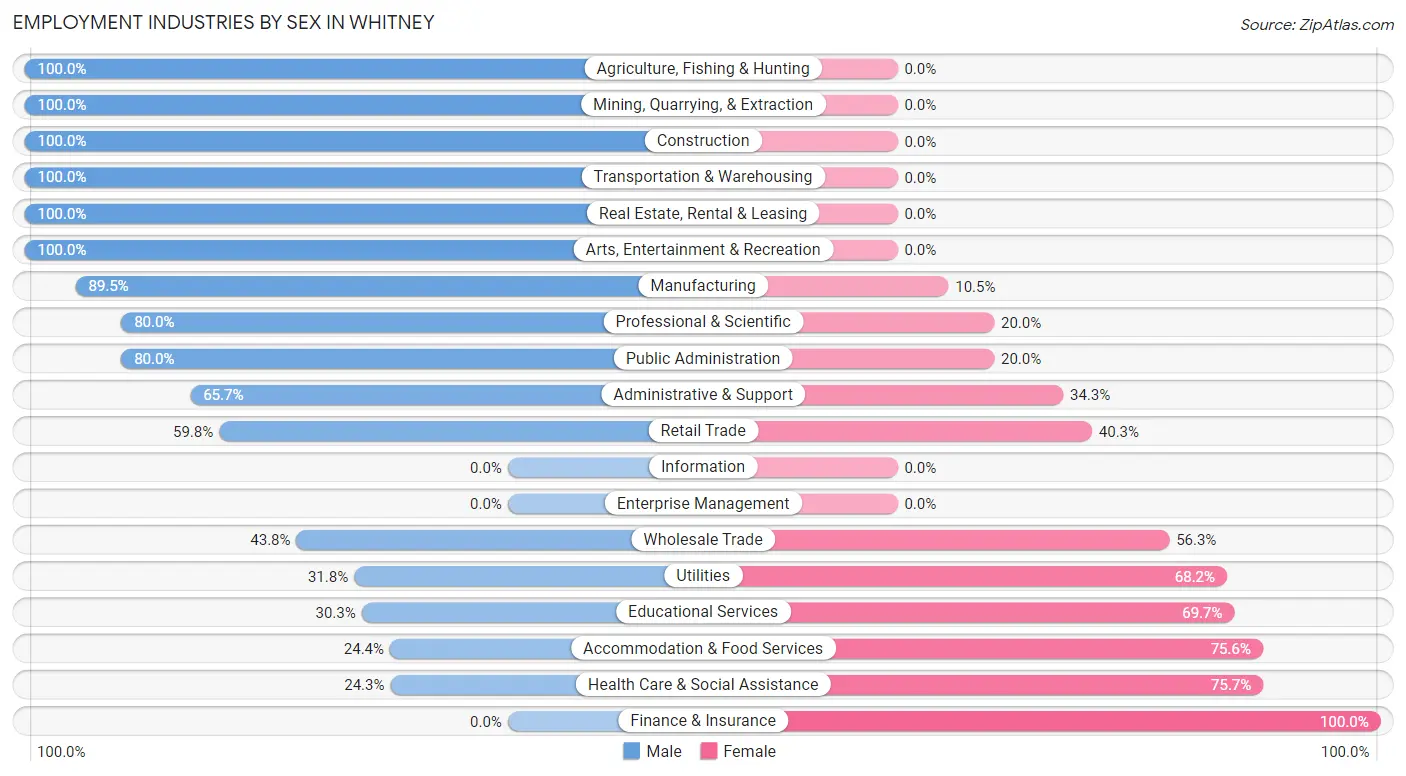
Employment Industries by Sex in Whitney
The Whitney industries that see more men than women are Agriculture, Fishing & Hunting (100.0%), Mining, Quarrying, & Extraction (100.0%), and Construction (100.0%), whereas the industries that tend to have a higher number of women are Finance & Insurance (100.0%), Health Care & Social Assistance (75.7%), and Accommodation & Food Services (75.6%).
| Industry | Male | Female |
| Agriculture, Fishing & Hunting | 13 (100.0%) | 0 (0.0%) |
| Mining, Quarrying, & Extraction | 34 (100.0%) | 0 (0.0%) |
| Construction | 41 (100.0%) | 0 (0.0%) |
| Manufacturing | 85 (89.5%) | 10 (10.5%) |
| Wholesale Trade | 7 (43.8%) | 9 (56.2%) |
| Retail Trade | 95 (59.8%) | 64 (40.3%) |
| Transportation & Warehousing | 33 (100.0%) | 0 (0.0%) |
| Utilities | 7 (31.8%) | 15 (68.2%) |
| Information | 0 (0.0%) | 0 (0.0%) |
| Finance & Insurance | 0 (0.0%) | 42 (100.0%) |
| Real Estate, Rental & Leasing | 19 (100.0%) | 0 (0.0%) |
| Professional & Scientific | 4 (80.0%) | 1 (20.0%) |
| Enterprise Management | 0 (0.0%) | 0 (0.0%) |
| Administrative & Support | 23 (65.7%) | 12 (34.3%) |
| Educational Services | 23 (30.3%) | 53 (69.7%) |
| Health Care & Social Assistance | 35 (24.3%) | 109 (75.7%) |
| Arts, Entertainment & Recreation | 4 (100.0%) | 0 (0.0%) |
| Accommodation & Food Services | 30 (24.4%) | 93 (75.6%) |
| Public Administration | 44 (80.0%) | 11 (20.0%) |
| Total | 509 (52.3%) | 464 (47.7%) |
Education in Whitney
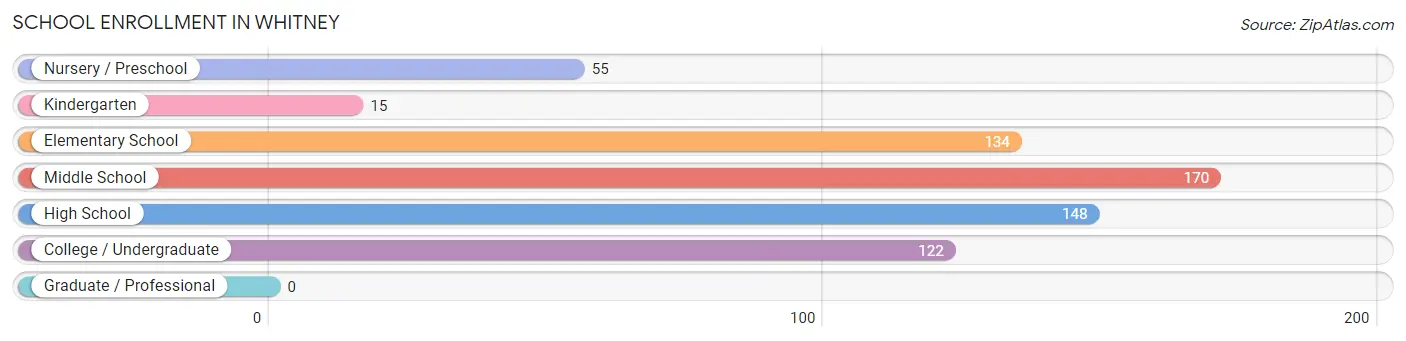
School Enrollment in Whitney
The most common levels of schooling among the 644 students in Whitney are middle school (170 | 26.4%), high school (148 | 23.0%), and elementary school (134 | 20.8%).
| School Level | # Students | % Students |
| Nursery / Preschool | 55 | 8.5% |
| Kindergarten | 15 | 2.3% |
| Elementary School | 134 | 20.8% |
| Middle School | 170 | 26.4% |
| High School | 148 | 23.0% |
| College / Undergraduate | 122 | 18.9% |
| Graduate / Professional | 0 | 0.0% |
| Total | 644 | 100.0% |
School Enrollment by Age by Funding Source in Whitney
Out of a total of 644 students who are enrolled in schools in Whitney, 10 (1.6%) attend a private institution, while the remaining 634 (98.4%) are enrolled in public schools. The age group of 35 years and over has the highest likelihood of being enrolled in private schools, with 5 (12.5% in the age bracket) enrolled. Conversely, the age group of 3 to 4 year olds has the lowest likelihood of being enrolled in a private school, with 42 (100.0% in the age bracket) attending a public institution.
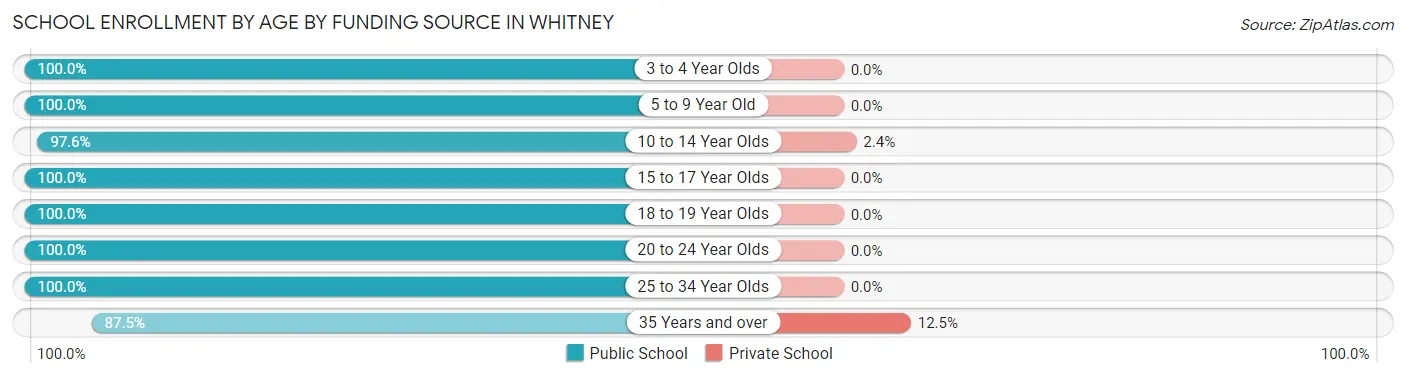
| Age Bracket | Public School | Private School |
| 3 to 4 Year Olds | 42 (100.0%) | 0 (0.0%) |
| 5 to 9 Year Old | 130 (100.0%) | 0 (0.0%) |
| 10 to 14 Year Olds | 206 (97.6%) | 5 (2.4%) |
| 15 to 17 Year Olds | 120 (100.0%) | 0 (0.0%) |
| 18 to 19 Year Olds | 22 (100.0%) | 0 (0.0%) |
| 20 to 24 Year Olds | 45 (100.0%) | 0 (0.0%) |
| 25 to 34 Year Olds | 34 (100.0%) | 0 (0.0%) |
| 35 Years and over | 35 (87.5%) | 5 (12.5%) |
| Total | 634 (98.4%) | 10 (1.6%) |
Educational Attainment by Field of Study in Whitney
Education (45 | 47.9%), arts & humanities (11 | 11.7%), psychology (9 | 9.6%), science & technology (9 | 9.6%), and visual & performing arts (8 | 8.5%) are the most common fields of study among 94 individuals in Whitney who have obtained a bachelor's degree or higher.
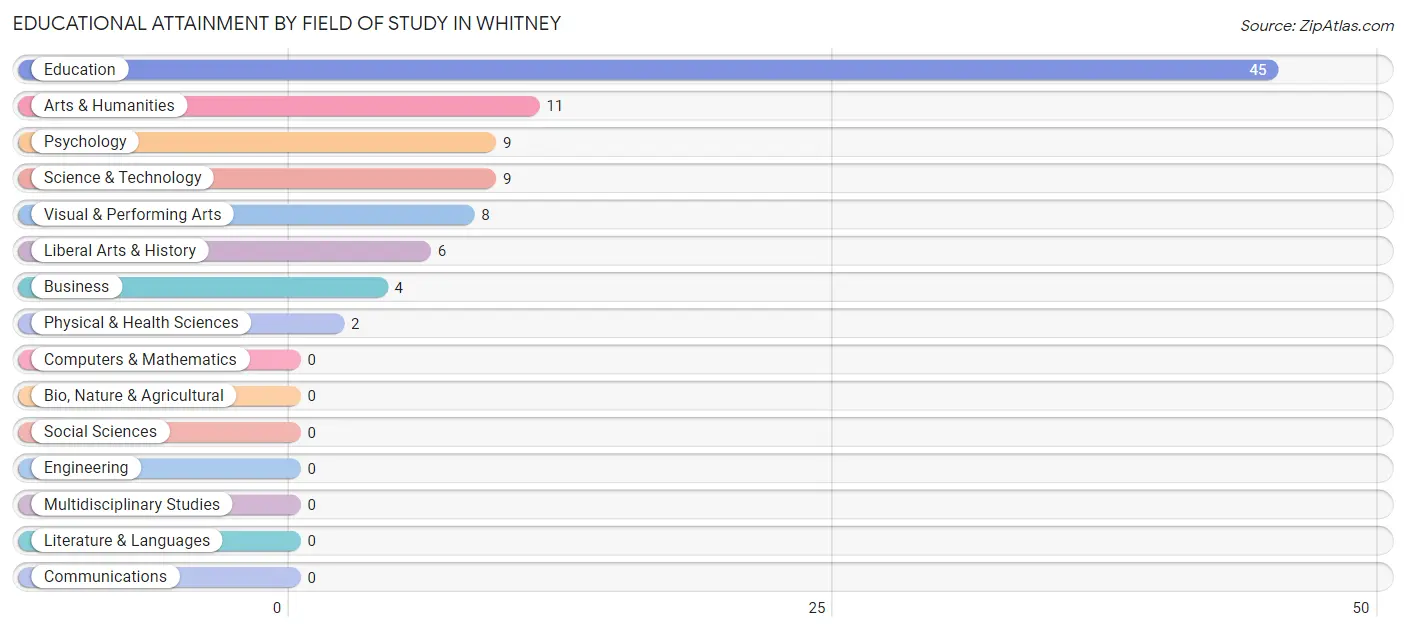
| Field of Study | # Graduates | % Graduates |
| Computers & Mathematics | 0 | 0.0% |
| Bio, Nature & Agricultural | 0 | 0.0% |
| Physical & Health Sciences | 2 | 2.1% |
| Psychology | 9 | 9.6% |
| Social Sciences | 0 | 0.0% |
| Engineering | 0 | 0.0% |
| Multidisciplinary Studies | 0 | 0.0% |
| Science & Technology | 9 | 9.6% |
| Business | 4 | 4.3% |
| Education | 45 | 47.9% |
| Literature & Languages | 0 | 0.0% |
| Liberal Arts & History | 6 | 6.4% |
| Visual & Performing Arts | 8 | 8.5% |
| Communications | 0 | 0.0% |
| Arts & Humanities | 11 | 11.7% |
| Total | 94 | 100.0% |
Transportation & Commute in Whitney
Vehicle Availability by Sex in Whitney
The most prevalent vehicle ownership categories in Whitney are males with 2 vehicles (242, accounting for 47.5%) and females with 2 vehicles (154, making up 54.6%).
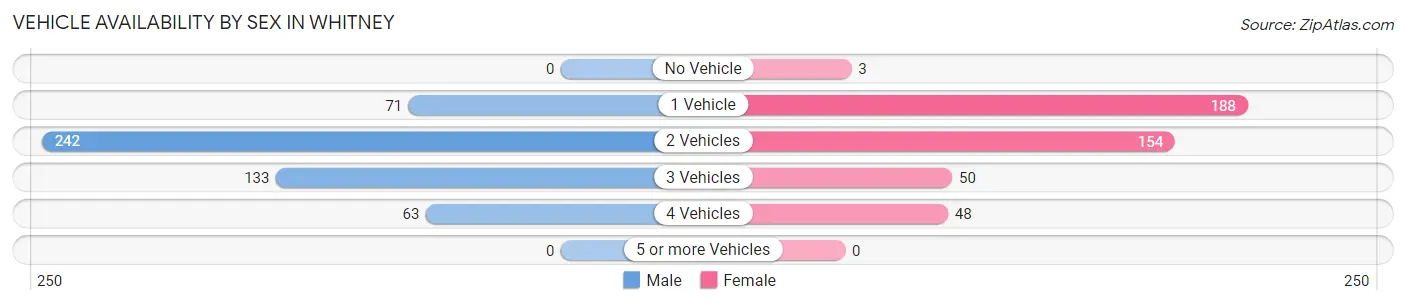
| Vehicles Available | Male | Female |
| No Vehicle | 0 (0.0%) | 3 (0.7%) |
| 1 Vehicle | 71 (14.0%) | 188 (42.4%) |
| 2 Vehicles | 242 (47.5%) | 154 (34.8%) |
| 3 Vehicles | 133 (26.1%) | 50 (11.3%) |
| 4 Vehicles | 63 (12.4%) | 48 (10.8%) |
| 5 or more Vehicles | 0 (0.0%) | 0 (0.0%) |
| Total | 509 (100.0%) | 443 (100.0%) |
Commute Time in Whitney
The most frequently occuring commute durations in Whitney are 5 to 9 minutes (185 commuters, 20.0%), less than 5 minutes (127 commuters, 13.7%), and 10 to 14 minutes (122 commuters, 13.2%).
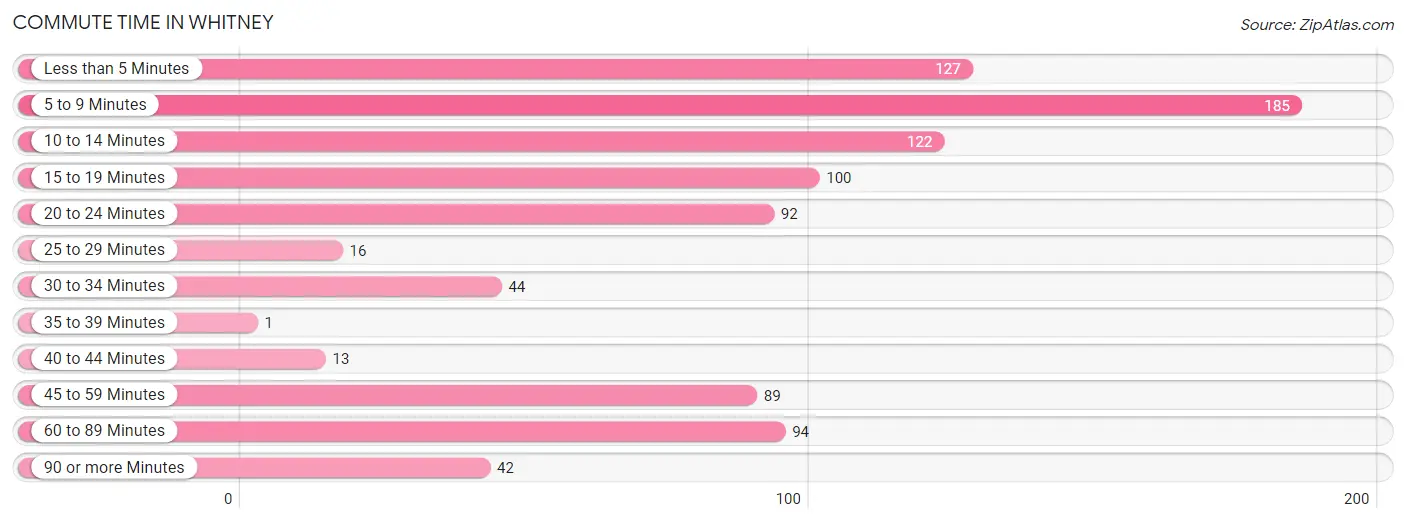
| Commute Time | # Commuters | % Commuters |
| Less than 5 Minutes | 127 | 13.7% |
| 5 to 9 Minutes | 185 | 20.0% |
| 10 to 14 Minutes | 122 | 13.2% |
| 15 to 19 Minutes | 100 | 10.8% |
| 20 to 24 Minutes | 92 | 10.0% |
| 25 to 29 Minutes | 16 | 1.7% |
| 30 to 34 Minutes | 44 | 4.8% |
| 35 to 39 Minutes | 1 | 0.1% |
| 40 to 44 Minutes | 13 | 1.4% |
| 45 to 59 Minutes | 89 | 9.6% |
| 60 to 89 Minutes | 94 | 10.2% |
| 90 or more Minutes | 42 | 4.5% |
Commute Time by Sex in Whitney
The most common commute times in Whitney are 5 to 9 minutes (131 commuters, 25.7%) for males and less than 5 minutes (81 commuters, 19.5%) for females.
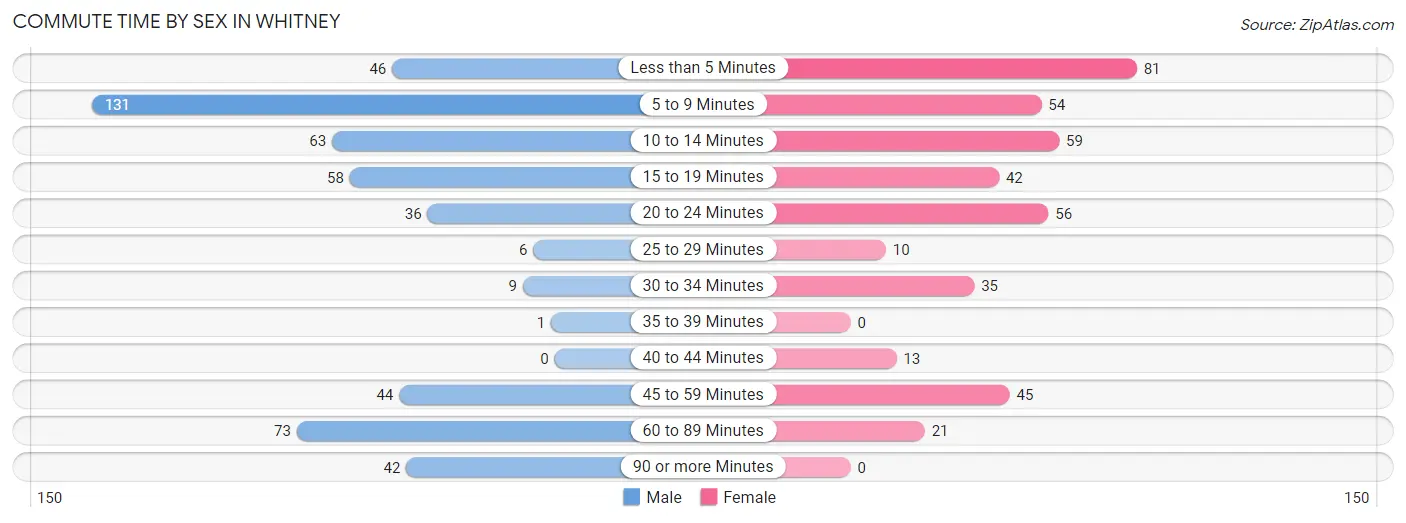
| Commute Time | Male | Female |
| Less than 5 Minutes | 46 (9.0%) | 81 (19.5%) |
| 5 to 9 Minutes | 131 (25.7%) | 54 (13.0%) |
| 10 to 14 Minutes | 63 (12.4%) | 59 (14.2%) |
| 15 to 19 Minutes | 58 (11.4%) | 42 (10.1%) |
| 20 to 24 Minutes | 36 (7.1%) | 56 (13.5%) |
| 25 to 29 Minutes | 6 (1.2%) | 10 (2.4%) |
| 30 to 34 Minutes | 9 (1.8%) | 35 (8.4%) |
| 35 to 39 Minutes | 1 (0.2%) | 0 (0.0%) |
| 40 to 44 Minutes | 0 (0.0%) | 13 (3.1%) |
| 45 to 59 Minutes | 44 (8.6%) | 45 (10.8%) |
| 60 to 89 Minutes | 73 (14.3%) | 21 (5.1%) |
| 90 or more Minutes | 42 (8.3%) | 0 (0.0%) |
Time of Departure to Work by Sex in Whitney
The most frequent times of departure to work in Whitney are 7:30 AM to 7:59 AM (112, 22.0%) for males and 4:00 PM to 11:59 PM (98, 23.6%) for females.
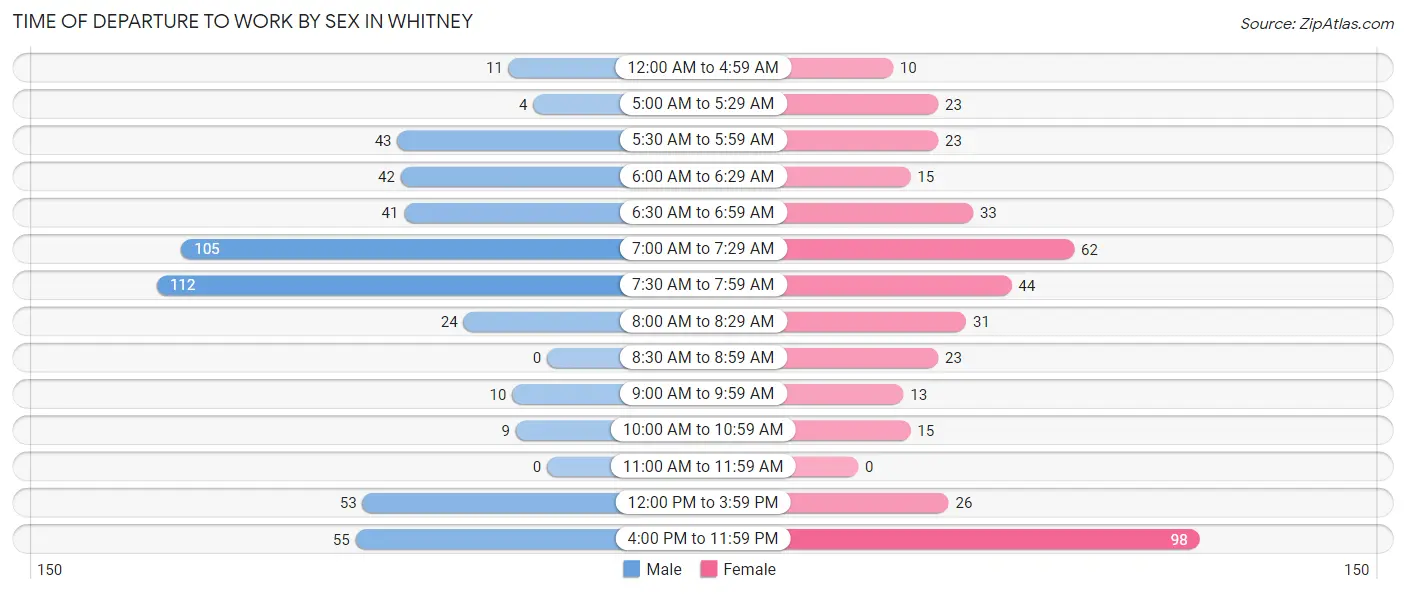
| Time of Departure | Male | Female |
| 12:00 AM to 4:59 AM | 11 (2.2%) | 10 (2.4%) |
| 5:00 AM to 5:29 AM | 4 (0.8%) | 23 (5.5%) |
| 5:30 AM to 5:59 AM | 43 (8.5%) | 23 (5.5%) |
| 6:00 AM to 6:29 AM | 42 (8.3%) | 15 (3.6%) |
| 6:30 AM to 6:59 AM | 41 (8.1%) | 33 (7.9%) |
| 7:00 AM to 7:29 AM | 105 (20.6%) | 62 (14.9%) |
| 7:30 AM to 7:59 AM | 112 (22.0%) | 44 (10.6%) |
| 8:00 AM to 8:29 AM | 24 (4.7%) | 31 (7.4%) |
| 8:30 AM to 8:59 AM | 0 (0.0%) | 23 (5.5%) |
| 9:00 AM to 9:59 AM | 10 (2.0%) | 13 (3.1%) |
| 10:00 AM to 10:59 AM | 9 (1.8%) | 15 (3.6%) |
| 11:00 AM to 11:59 AM | 0 (0.0%) | 0 (0.0%) |
| 12:00 PM to 3:59 PM | 53 (10.4%) | 26 (6.2%) |
| 4:00 PM to 11:59 PM | 55 (10.8%) | 98 (23.6%) |
| Total | 509 (100.0%) | 416 (100.0%) |
Housing Occupancy in Whitney
Occupancy by Ownership in Whitney
Of the total 835 dwellings in Whitney, owner-occupied units account for 438 (52.5%), while renter-occupied units make up 397 (47.5%).
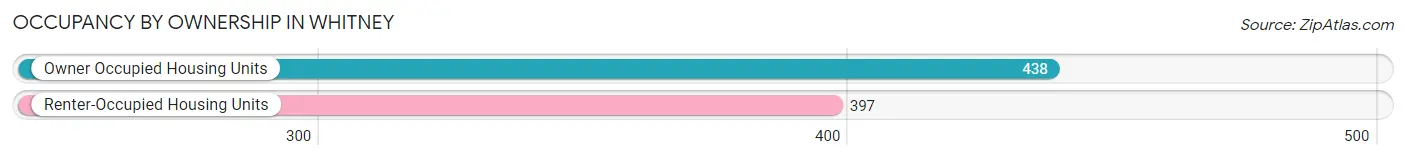
| Occupancy | # Housing Units | % Housing Units |
| Owner Occupied Housing Units | 438 | 52.5% |
| Renter-Occupied Housing Units | 397 | 47.5% |
| Total Occupied Housing Units | 835 | 100.0% |
Occupancy by Household Size in Whitney
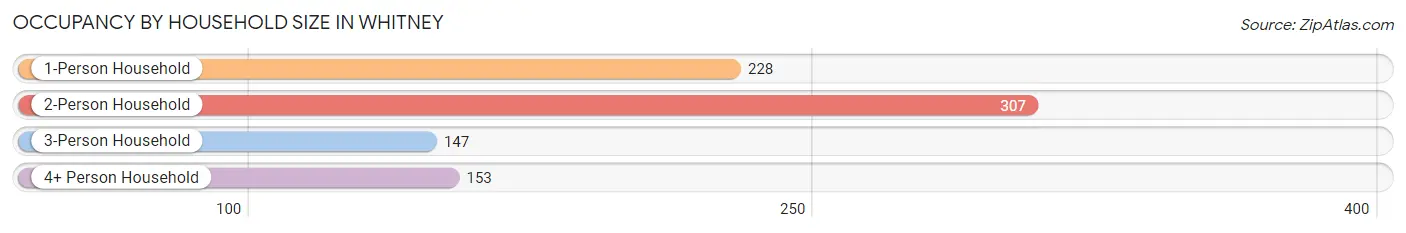
| Household Size | # Housing Units | % Housing Units |
| 1-Person Household | 228 | 27.3% |
| 2-Person Household | 307 | 36.8% |
| 3-Person Household | 147 | 17.6% |
| 4+ Person Household | 153 | 18.3% |
| Total Housing Units | 835 | 100.0% |
Occupancy by Ownership by Household Size in Whitney
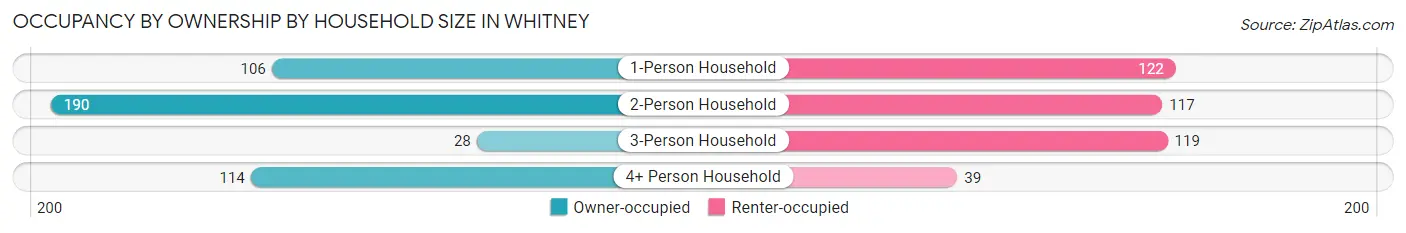
| Household Size | Owner-occupied | Renter-occupied |
| 1-Person Household | 106 (46.5%) | 122 (53.5%) |
| 2-Person Household | 190 (61.9%) | 117 (38.1%) |
| 3-Person Household | 28 (19.1%) | 119 (80.9%) |
| 4+ Person Household | 114 (74.5%) | 39 (25.5%) |
| Total Housing Units | 438 (52.5%) | 397 (47.5%) |
Occupancy by Educational Attainment in Whitney
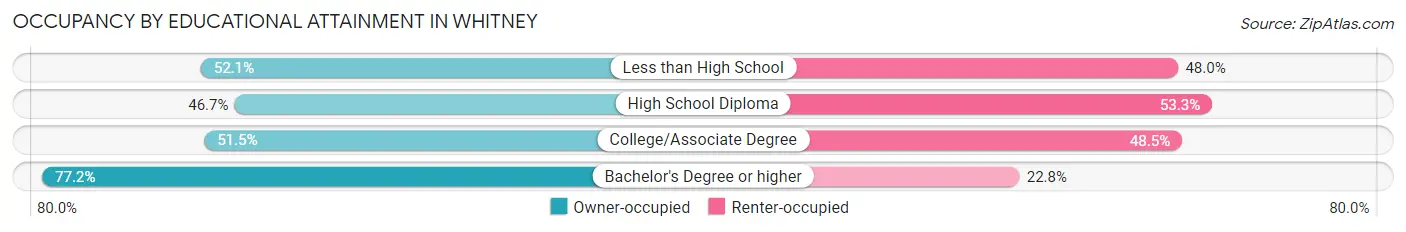
| Household Size | Owner-occupied | Renter-occupied |
| Less than High School | 76 (52.0%) | 70 (47.9%) |
| High School Diploma | 129 (46.7%) | 147 (53.3%) |
| College/Associate Degree | 172 (51.5%) | 162 (48.5%) |
| Bachelor's Degree or higher | 61 (77.2%) | 18 (22.8%) |
Occupancy by Age of Householder in Whitney
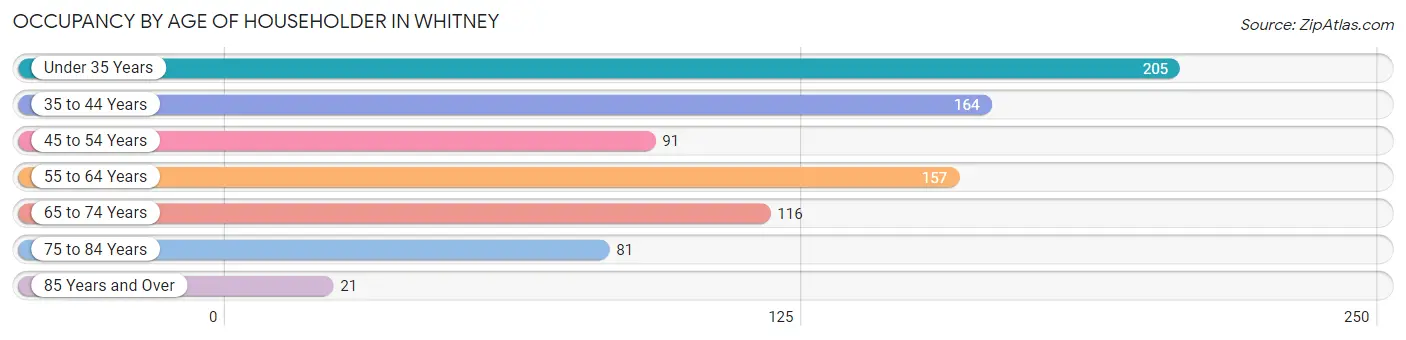
| Age Bracket | # Households | % Households |
| Under 35 Years | 205 | 24.5% |
| 35 to 44 Years | 164 | 19.6% |
| 45 to 54 Years | 91 | 10.9% |
| 55 to 64 Years | 157 | 18.8% |
| 65 to 74 Years | 116 | 13.9% |
| 75 to 84 Years | 81 | 9.7% |
| 85 Years and Over | 21 | 2.5% |
| Total | 835 | 100.0% |
Housing Finances in Whitney
Median Income by Occupancy in Whitney
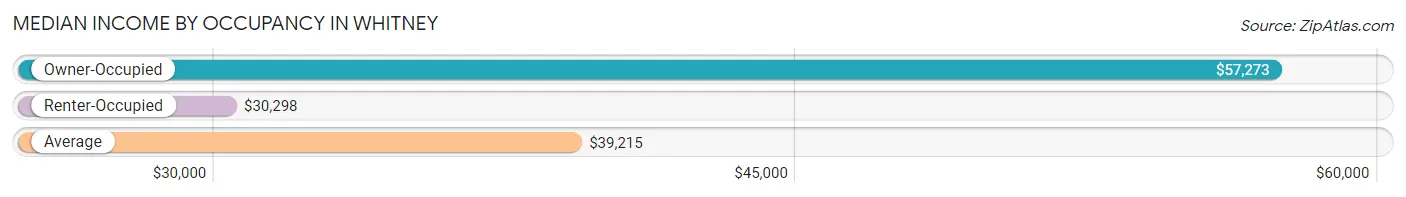
| Occupancy Type | # Households | Median Income |
| Owner-Occupied | 438 (52.5%) | $57,273 |
| Renter-Occupied | 397 (47.5%) | $30,298 |
| Average | 835 (100.0%) | $39,215 |
Occupancy by Householder Income Bracket in Whitney
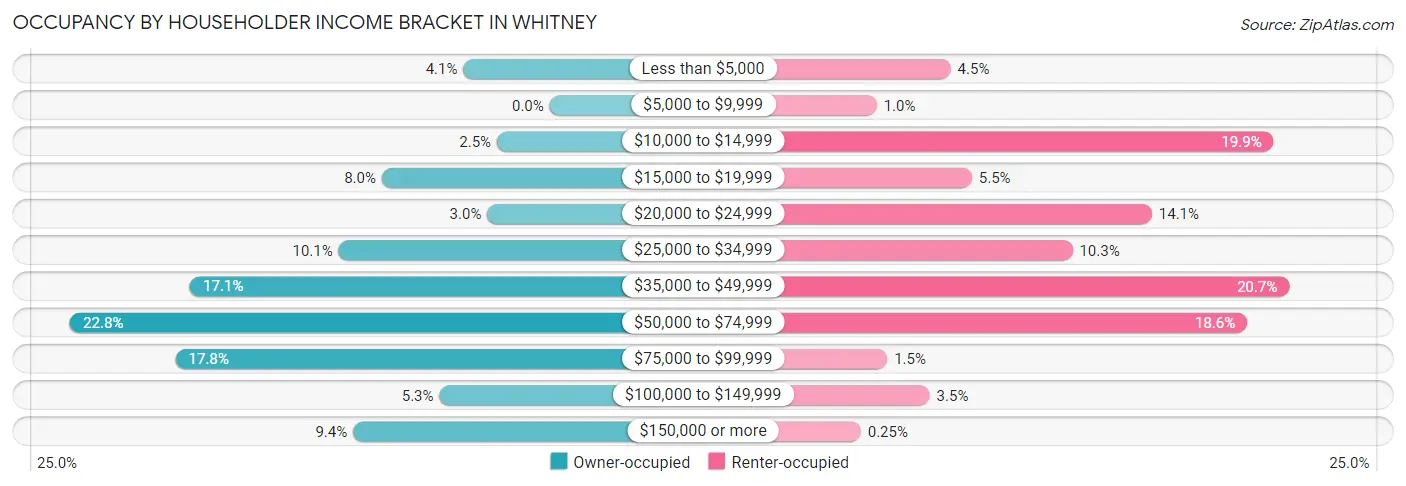
| Income Bracket | Owner-occupied | Renter-occupied |
| Less than $5,000 | 18 (4.1%) | 18 (4.5%) |
| $5,000 to $9,999 | 0 (0.0%) | 4 (1.0%) |
| $10,000 to $14,999 | 11 (2.5%) | 79 (19.9%) |
| $15,000 to $19,999 | 35 (8.0%) | 22 (5.5%) |
| $20,000 to $24,999 | 13 (3.0%) | 56 (14.1%) |
| $25,000 to $34,999 | 44 (10.1%) | 41 (10.3%) |
| $35,000 to $49,999 | 75 (17.1%) | 82 (20.6%) |
| $50,000 to $74,999 | 100 (22.8%) | 74 (18.6%) |
| $75,000 to $99,999 | 78 (17.8%) | 6 (1.5%) |
| $100,000 to $149,999 | 23 (5.2%) | 14 (3.5%) |
| $150,000 or more | 41 (9.4%) | 1 (0.3%) |
| Total | 438 (100.0%) | 397 (100.0%) |
Monthly Housing Cost Tiers in Whitney
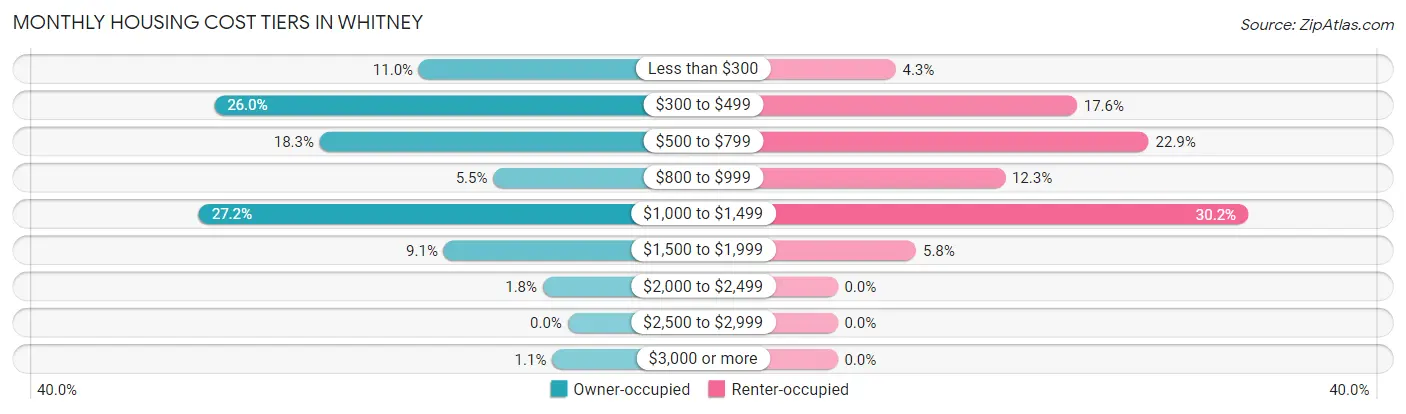
| Monthly Cost | Owner-occupied | Renter-occupied |
| Less than $300 | 48 (11.0%) | 17 (4.3%) |
| $300 to $499 | 114 (26.0%) | 70 (17.6%) |
| $500 to $799 | 80 (18.3%) | 91 (22.9%) |
| $800 to $999 | 24 (5.5%) | 49 (12.3%) |
| $1,000 to $1,499 | 119 (27.2%) | 120 (30.2%) |
| $1,500 to $1,999 | 40 (9.1%) | 23 (5.8%) |
| $2,000 to $2,499 | 8 (1.8%) | 0 (0.0%) |
| $2,500 to $2,999 | 0 (0.0%) | 0 (0.0%) |
| $3,000 or more | 5 (1.1%) | 0 (0.0%) |
| Total | 438 (100.0%) | 397 (100.0%) |
Physical Housing Characteristics in Whitney
Housing Structures in Whitney
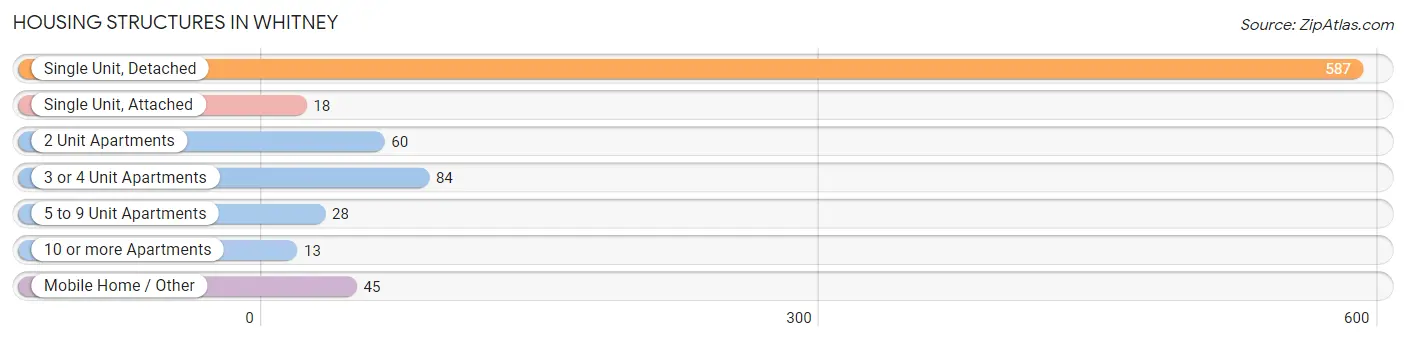
| Structure Type | # Housing Units | % Housing Units |
| Single Unit, Detached | 587 | 70.3% |
| Single Unit, Attached | 18 | 2.2% |
| 2 Unit Apartments | 60 | 7.2% |
| 3 or 4 Unit Apartments | 84 | 10.1% |
| 5 to 9 Unit Apartments | 28 | 3.4% |
| 10 or more Apartments | 13 | 1.6% |
| Mobile Home / Other | 45 | 5.4% |
| Total | 835 | 100.0% |
Housing Structures by Occupancy in Whitney
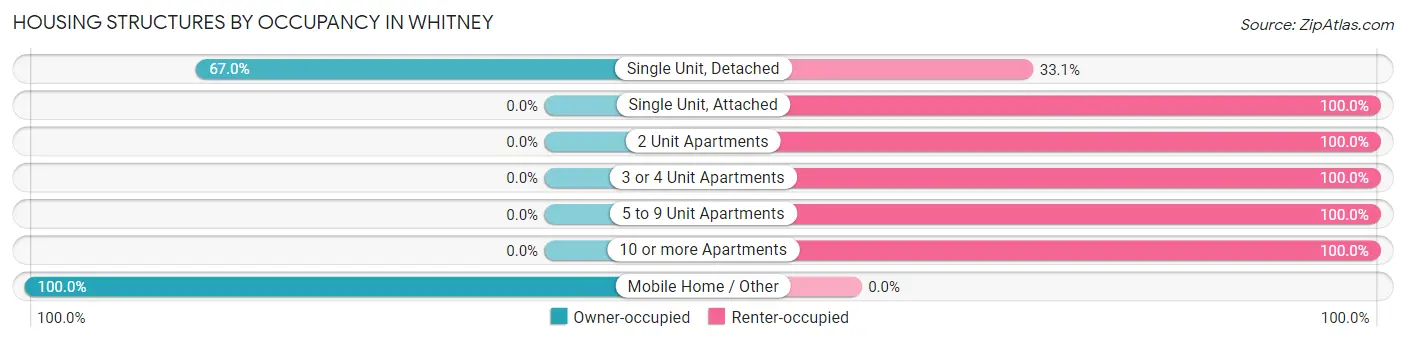
| Structure Type | Owner-occupied | Renter-occupied |
| Single Unit, Detached | 393 (66.9%) | 194 (33.1%) |
| Single Unit, Attached | 0 (0.0%) | 18 (100.0%) |
| 2 Unit Apartments | 0 (0.0%) | 60 (100.0%) |
| 3 or 4 Unit Apartments | 0 (0.0%) | 84 (100.0%) |
| 5 to 9 Unit Apartments | 0 (0.0%) | 28 (100.0%) |
| 10 or more Apartments | 0 (0.0%) | 13 (100.0%) |
| Mobile Home / Other | 45 (100.0%) | 0 (0.0%) |
| Total | 438 (52.5%) | 397 (47.5%) |
Housing Structures by Number of Rooms in Whitney
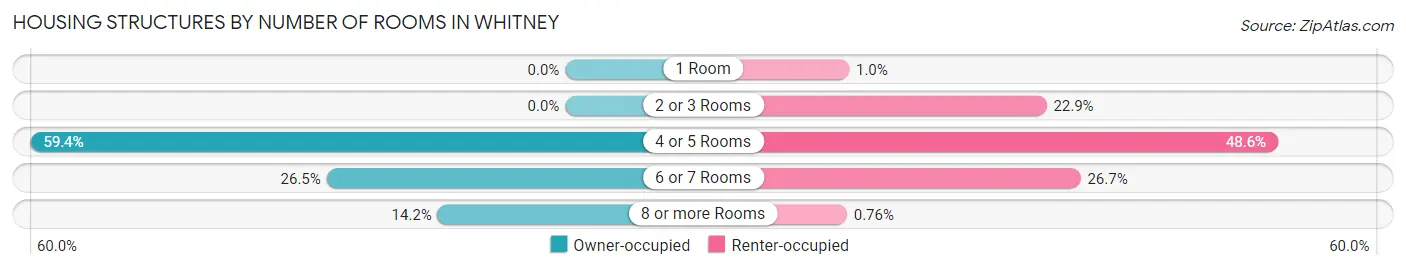
| Number of Rooms | Owner-occupied | Renter-occupied |
| 1 Room | 0 (0.0%) | 4 (1.0%) |
| 2 or 3 Rooms | 0 (0.0%) | 91 (22.9%) |
| 4 or 5 Rooms | 260 (59.4%) | 193 (48.6%) |
| 6 or 7 Rooms | 116 (26.5%) | 106 (26.7%) |
| 8 or more Rooms | 62 (14.2%) | 3 (0.8%) |
| Total | 438 (100.0%) | 397 (100.0%) |
Housing Structure by Heating Type in Whitney
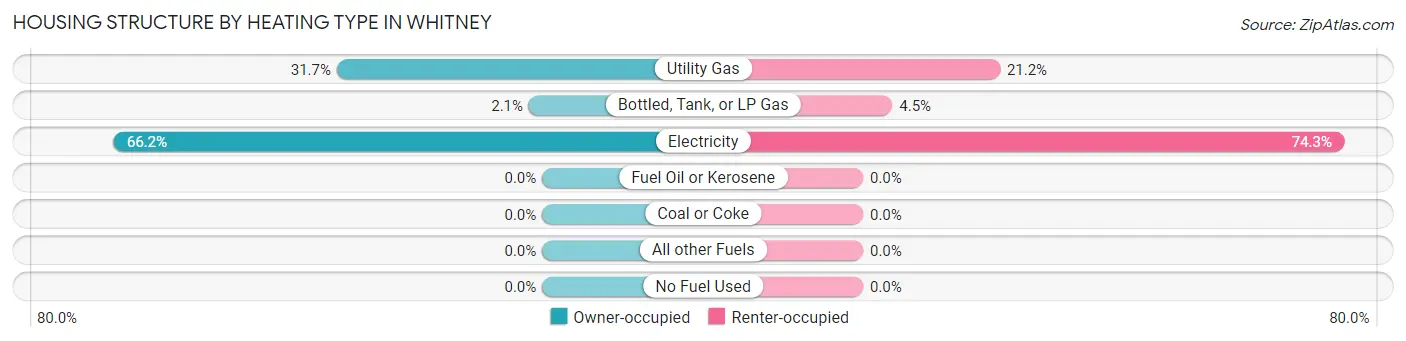
| Heating Type | Owner-occupied | Renter-occupied |
| Utility Gas | 139 (31.7%) | 84 (21.2%) |
| Bottled, Tank, or LP Gas | 9 (2.1%) | 18 (4.5%) |
| Electricity | 290 (66.2%) | 295 (74.3%) |
| Fuel Oil or Kerosene | 0 (0.0%) | 0 (0.0%) |
| Coal or Coke | 0 (0.0%) | 0 (0.0%) |
| All other Fuels | 0 (0.0%) | 0 (0.0%) |
| No Fuel Used | 0 (0.0%) | 0 (0.0%) |
| Total | 438 (100.0%) | 397 (100.0%) |
Household Vehicle Usage in Whitney
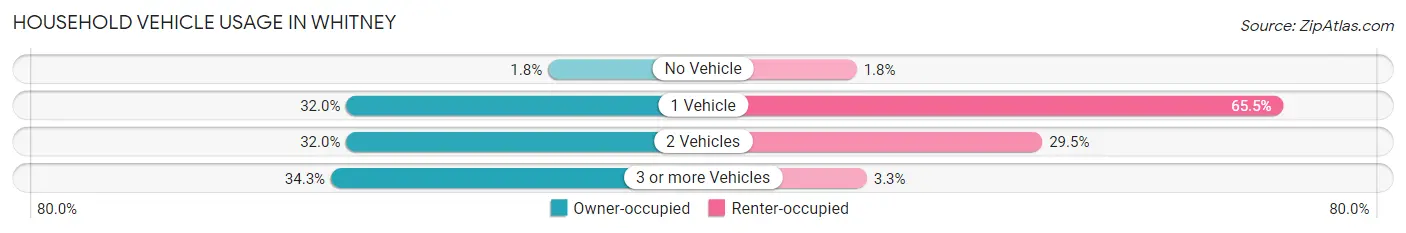
| Vehicles per Household | Owner-occupied | Renter-occupied |
| No Vehicle | 8 (1.8%) | 7 (1.8%) |
| 1 Vehicle | 140 (32.0%) | 260 (65.5%) |
| 2 Vehicles | 140 (32.0%) | 117 (29.5%) |
| 3 or more Vehicles | 150 (34.3%) | 13 (3.3%) |
| Total | 438 (100.0%) | 397 (100.0%) |
Real Estate & Mortgages in Whitney
Real Estate and Mortgage Overview in Whitney
| Characteristic | Without Mortgage | With Mortgage |
| Housing Units | 224 | 214 |
| Median Property Value | $70,000 | $121,500 |
| Median Household Income | $47,273 | $24 |
| Monthly Housing Costs | $402 | $5 |
| Real Estate Taxes | $1,292 | $24 |
Property Value by Mortgage Status in Whitney
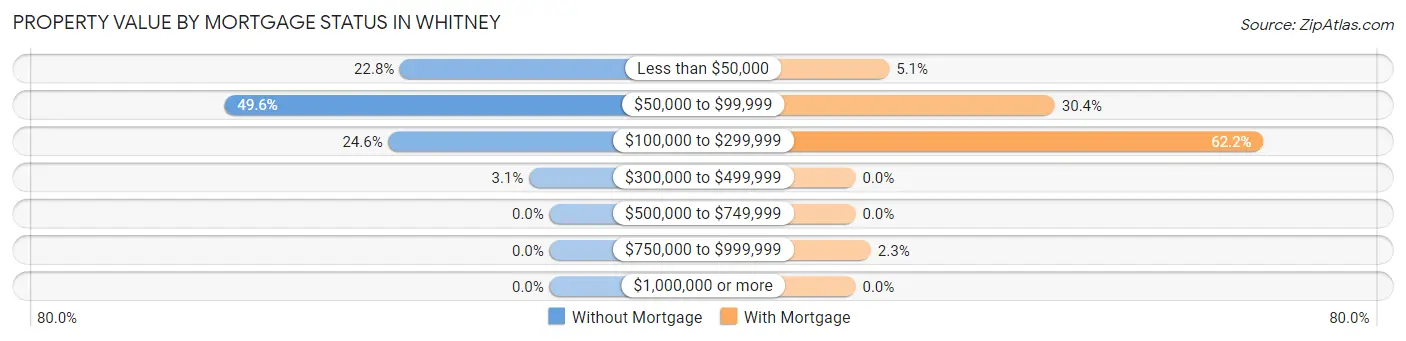
| Property Value | Without Mortgage | With Mortgage |
| Less than $50,000 | 51 (22.8%) | 11 (5.1%) |
| $50,000 to $99,999 | 111 (49.5%) | 65 (30.4%) |
| $100,000 to $299,999 | 55 (24.5%) | 133 (62.2%) |
| $300,000 to $499,999 | 7 (3.1%) | 0 (0.0%) |
| $500,000 to $749,999 | 0 (0.0%) | 0 (0.0%) |
| $750,000 to $999,999 | 0 (0.0%) | 5 (2.3%) |
| $1,000,000 or more | 0 (0.0%) | 0 (0.0%) |
| Total | 224 (100.0%) | 214 (100.0%) |
Household Income by Mortgage Status in Whitney
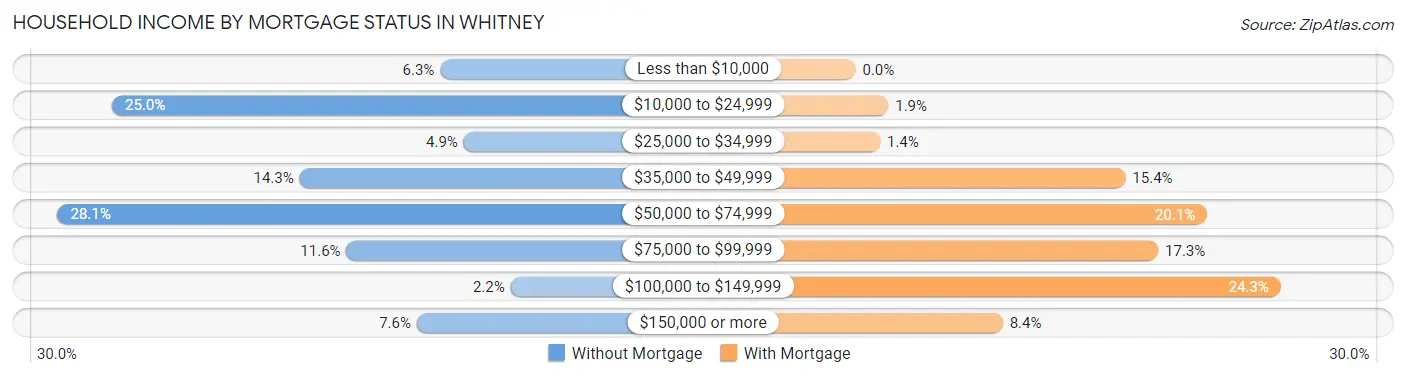
| Household Income | Without Mortgage | With Mortgage |
| Less than $10,000 | 14 (6.2%) | 0 (0.0%) |
| $10,000 to $24,999 | 56 (25.0%) | 4 (1.9%) |
| $25,000 to $34,999 | 11 (4.9%) | 3 (1.4%) |
| $35,000 to $49,999 | 32 (14.3%) | 33 (15.4%) |
| $50,000 to $74,999 | 63 (28.1%) | 43 (20.1%) |
| $75,000 to $99,999 | 26 (11.6%) | 37 (17.3%) |
| $100,000 to $149,999 | 5 (2.2%) | 52 (24.3%) |
| $150,000 or more | 17 (7.6%) | 18 (8.4%) |
| Total | 224 (100.0%) | 214 (100.0%) |
Property Value to Household Income Ratio in Whitney
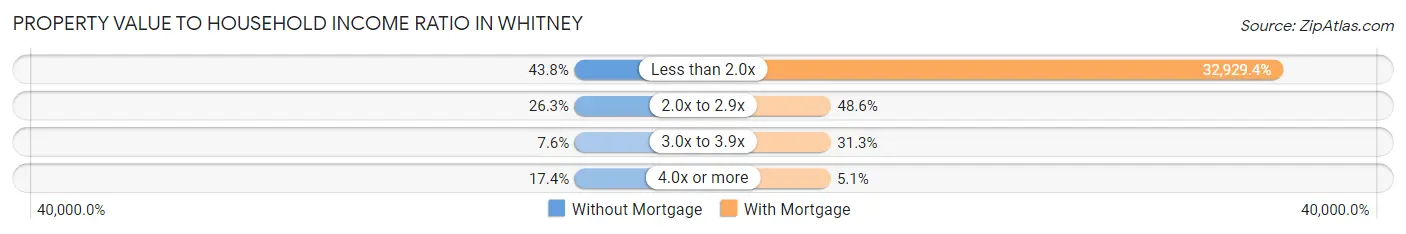
| Value-to-Income Ratio | Without Mortgage | With Mortgage |
| Less than 2.0x | 98 (43.8%) | 70,469 (32,929.4%) |
| 2.0x to 2.9x | 59 (26.3%) | 104 (48.6%) |
| 3.0x to 3.9x | 17 (7.6%) | 67 (31.3%) |
| 4.0x or more | 39 (17.4%) | 11 (5.1%) |
| Total | 224 (100.0%) | 214 (100.0%) |
Real Estate Taxes by Mortgage Status in Whitney
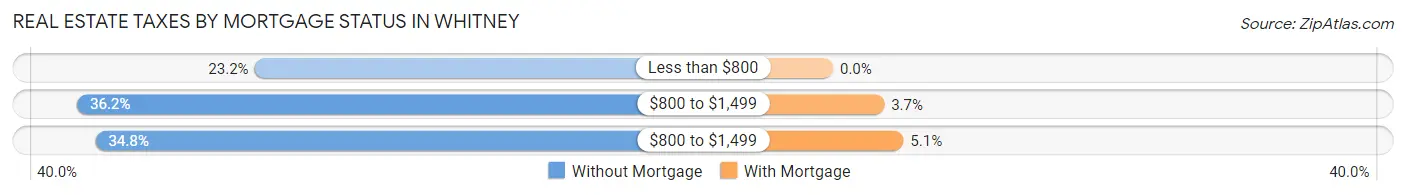
| Property Taxes | Without Mortgage | With Mortgage |
| Less than $800 | 52 (23.2%) | 0 (0.0%) |
| $800 to $1,499 | 81 (36.2%) | 8 (3.7%) |
| $800 to $1,499 | 78 (34.8%) | 11 (5.1%) |
| Total | 224 (100.0%) | 214 (100.0%) |
Health & Disability in Whitney
Health Insurance Coverage by Age in Whitney
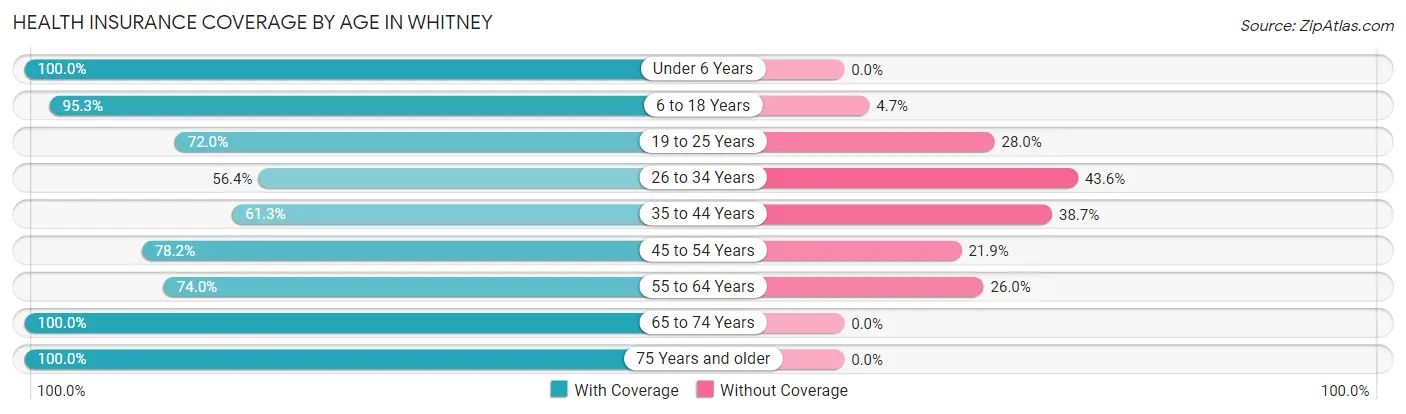
| Age Bracket | With Coverage | Without Coverage |
| Under 6 Years | 175 (100.0%) | 0 (0.0%) |
| 6 to 18 Years | 449 (95.3%) | 22 (4.7%) |
| 19 to 25 Years | 167 (72.0%) | 65 (28.0%) |
| 26 to 34 Years | 123 (56.4%) | 95 (43.6%) |
| 35 to 44 Years | 155 (61.3%) | 98 (38.7%) |
| 45 to 54 Years | 186 (78.1%) | 52 (21.8%) |
| 55 to 64 Years | 188 (74.0%) | 66 (26.0%) |
| 65 to 74 Years | 192 (100.0%) | 0 (0.0%) |
| 75 Years and older | 152 (100.0%) | 0 (0.0%) |
| Total | 1,787 (81.8%) | 398 (18.2%) |
Health Insurance Coverage by Citizenship Status in Whitney
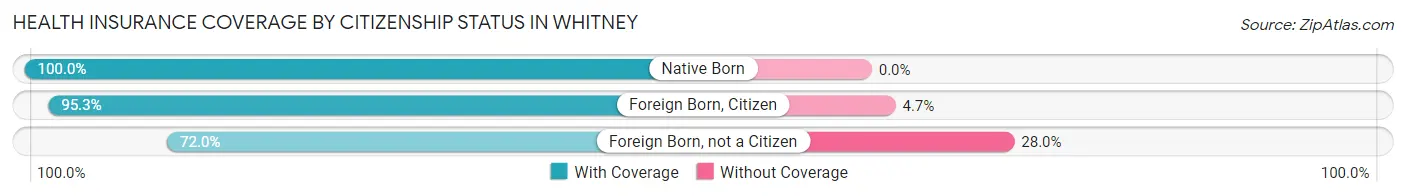
| Citizenship Status | With Coverage | Without Coverage |
| Native Born | 175 (100.0%) | 0 (0.0%) |
| Foreign Born, Citizen | 449 (95.3%) | 22 (4.7%) |
| Foreign Born, not a Citizen | 167 (72.0%) | 65 (28.0%) |
Health Insurance Coverage by Household Income in Whitney
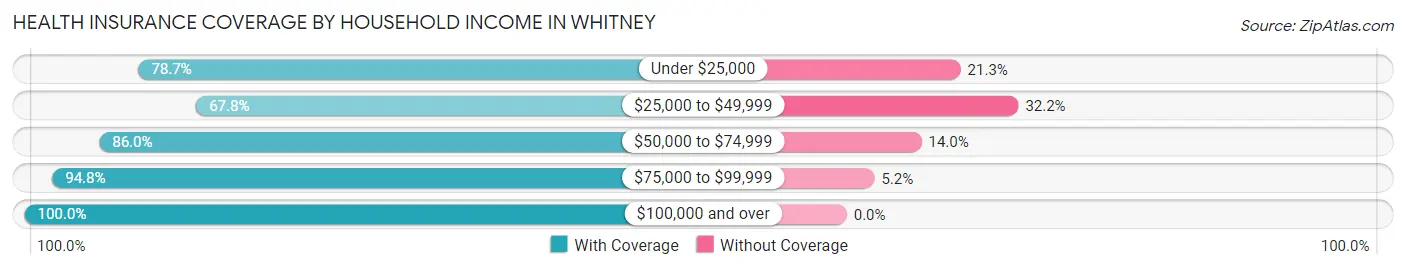
| Household Income | With Coverage | Without Coverage |
| Under $25,000 | 380 (78.7%) | 103 (21.3%) |
| $25,000 to $49,999 | 445 (67.8%) | 211 (32.2%) |
| $50,000 to $74,999 | 424 (86.0%) | 69 (14.0%) |
| $75,000 to $99,999 | 274 (94.8%) | 15 (5.2%) |
| $100,000 and over | 264 (100.0%) | 0 (0.0%) |
Public vs Private Health Insurance Coverage by Age in Whitney
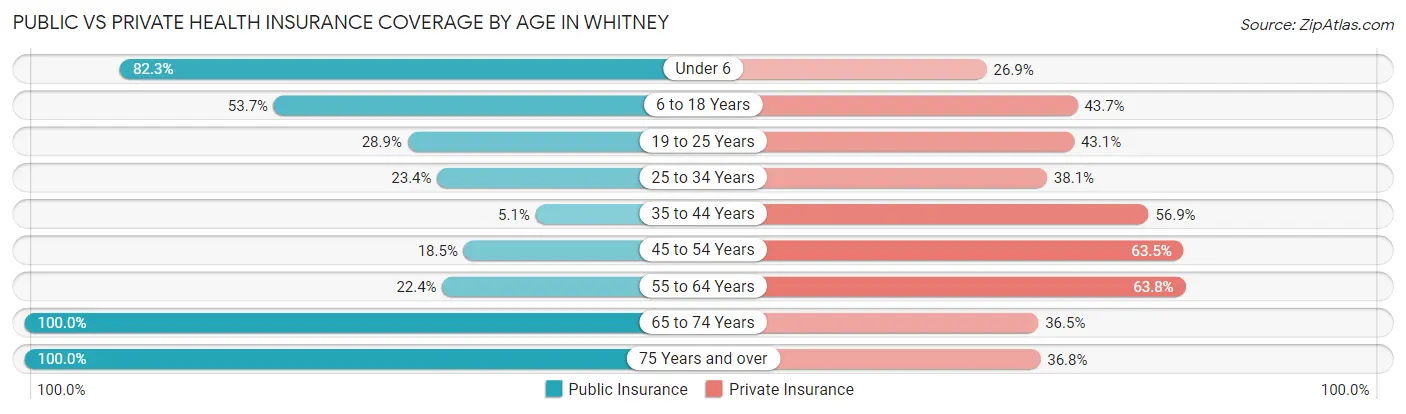
| Age Bracket | Public Insurance | Private Insurance |
| Under 6 | 144 (82.3%) | 47 (26.9%) |
| 6 to 18 Years | 253 (53.7%) | 206 (43.7%) |
| 19 to 25 Years | 67 (28.9%) | 100 (43.1%) |
| 25 to 34 Years | 51 (23.4%) | 83 (38.1%) |
| 35 to 44 Years | 13 (5.1%) | 144 (56.9%) |
| 45 to 54 Years | 44 (18.5%) | 151 (63.4%) |
| 55 to 64 Years | 57 (22.4%) | 162 (63.8%) |
| 65 to 74 Years | 192 (100.0%) | 70 (36.5%) |
| 75 Years and over | 152 (100.0%) | 56 (36.8%) |
| Total | 973 (44.5%) | 1,019 (46.6%) |
Disability Status by Sex by Age in Whitney
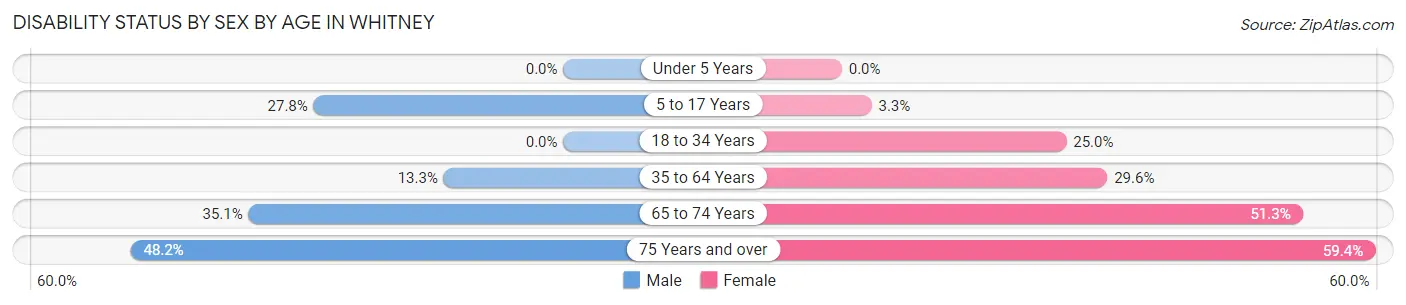
| Age Bracket | Male | Female |
| Under 5 Years | 0 (0.0%) | 0 (0.0%) |
| 5 to 17 Years | 84 (27.8%) | 6 (3.3%) |
| 18 to 34 Years | 0 (0.0%) | 63 (25.0%) |
| 35 to 64 Years | 51 (13.3%) | 107 (29.6%) |
| 65 to 74 Years | 27 (35.1%) | 59 (51.3%) |
| 75 Years and over | 27 (48.2%) | 57 (59.4%) |
Disability Class by Sex by Age in Whitney
Disability Class: Hearing Difficulty
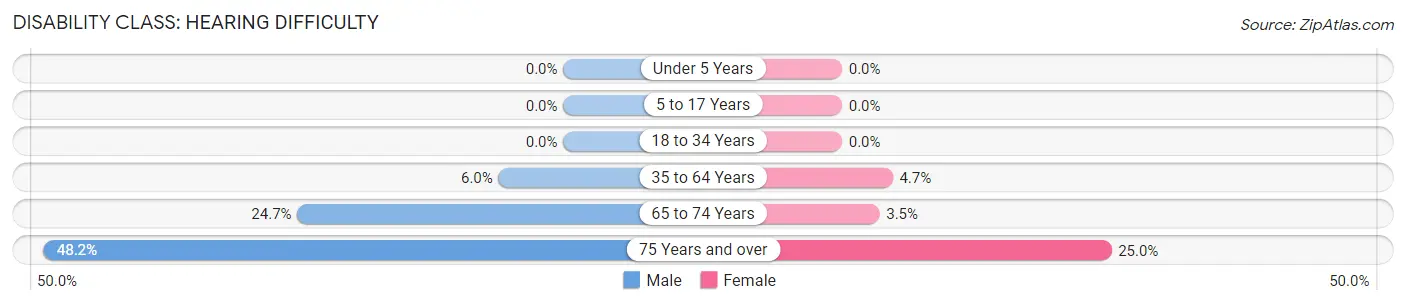
| Age Bracket | Male | Female |
| Under 5 Years | 0 (0.0%) | 0 (0.0%) |
| 5 to 17 Years | 0 (0.0%) | 0 (0.0%) |
| 18 to 34 Years | 0 (0.0%) | 0 (0.0%) |
| 35 to 64 Years | 23 (6.0%) | 17 (4.7%) |
| 65 to 74 Years | 19 (24.7%) | 4 (3.5%) |
| 75 Years and over | 27 (48.2%) | 24 (25.0%) |
Disability Class: Vision Difficulty
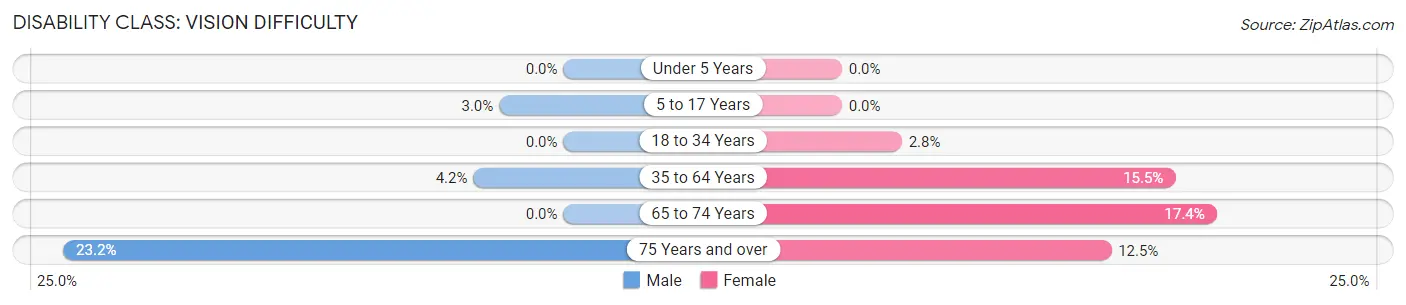
| Age Bracket | Male | Female |
| Under 5 Years | 0 (0.0%) | 0 (0.0%) |
| 5 to 17 Years | 9 (3.0%) | 0 (0.0%) |
| 18 to 34 Years | 0 (0.0%) | 7 (2.8%) |
| 35 to 64 Years | 16 (4.2%) | 56 (15.5%) |
| 65 to 74 Years | 0 (0.0%) | 20 (17.4%) |
| 75 Years and over | 13 (23.2%) | 12 (12.5%) |
Disability Class: Cognitive Difficulty
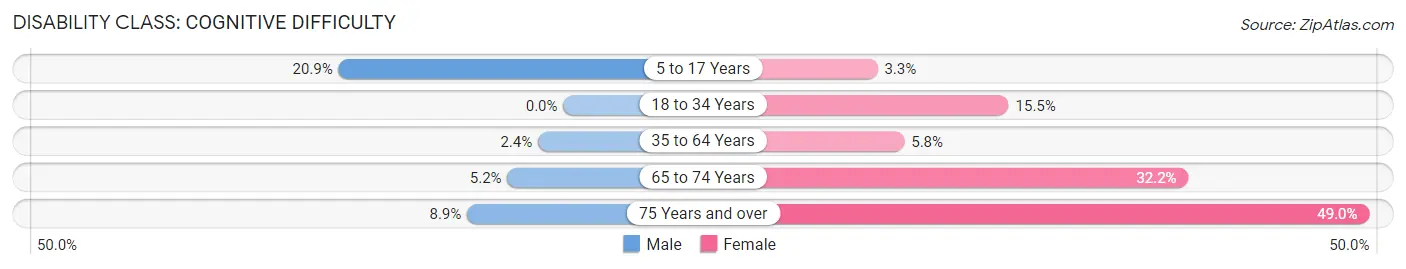
| Age Bracket | Male | Female |
| 5 to 17 Years | 63 (20.9%) | 6 (3.3%) |
| 18 to 34 Years | 0 (0.0%) | 39 (15.5%) |
| 35 to 64 Years | 9 (2.4%) | 21 (5.8%) |
| 65 to 74 Years | 4 (5.2%) | 37 (32.2%) |
| 75 Years and over | 5 (8.9%) | 47 (49.0%) |
Disability Class: Ambulatory Difficulty
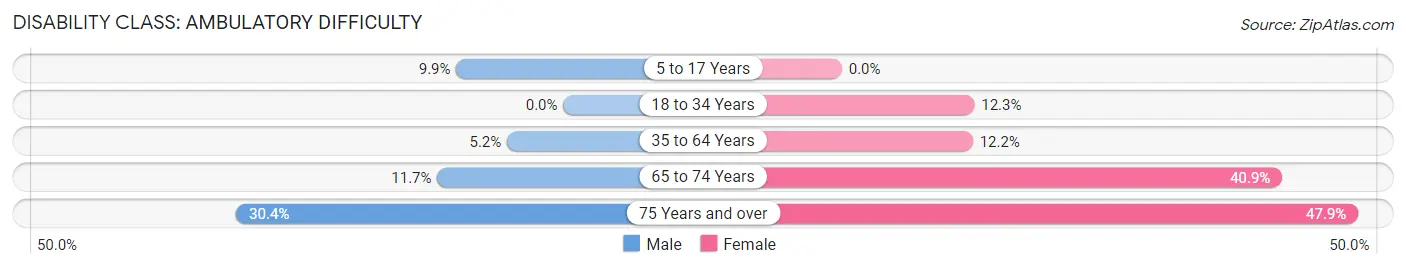
| Age Bracket | Male | Female |
| 5 to 17 Years | 30 (9.9%) | 0 (0.0%) |
| 18 to 34 Years | 0 (0.0%) | 31 (12.3%) |
| 35 to 64 Years | 20 (5.2%) | 44 (12.1%) |
| 65 to 74 Years | 9 (11.7%) | 47 (40.9%) |
| 75 Years and over | 17 (30.4%) | 46 (47.9%) |
Disability Class: Self-Care Difficulty
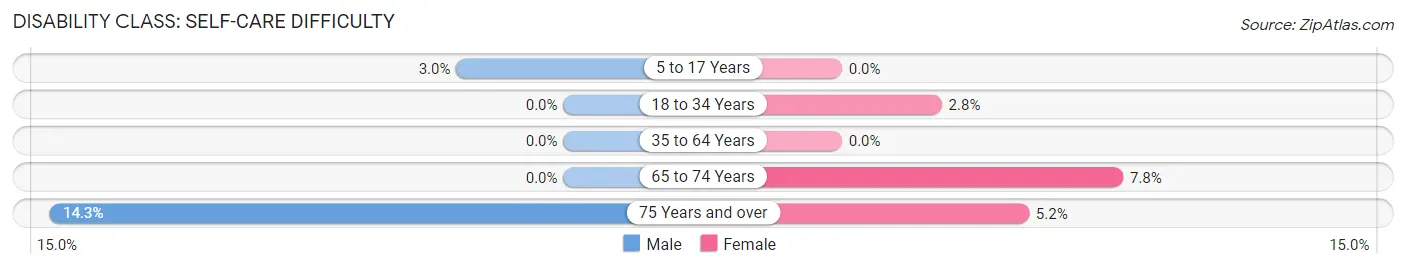
| Age Bracket | Male | Female |
| 5 to 17 Years | 9 (3.0%) | 0 (0.0%) |
| 18 to 34 Years | 0 (0.0%) | 7 (2.8%) |
| 35 to 64 Years | 0 (0.0%) | 0 (0.0%) |
| 65 to 74 Years | 0 (0.0%) | 9 (7.8%) |
| 75 Years and over | 8 (14.3%) | 5 (5.2%) |
Technology Access in Whitney
Computing Device Access in Whitney
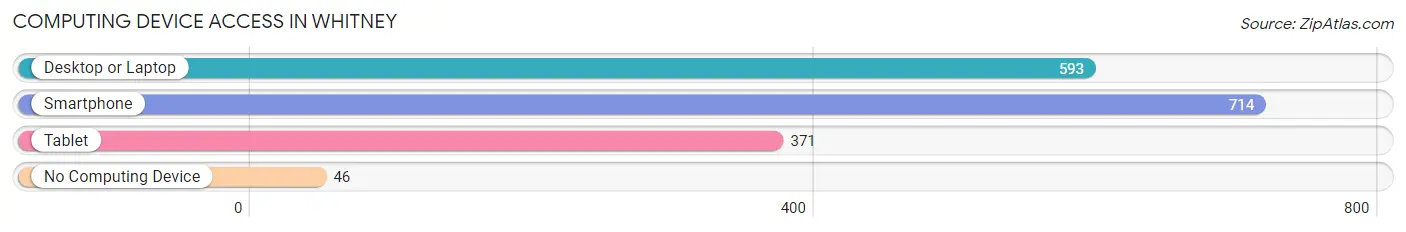
| Device Type | # Households | % Households |
| Desktop or Laptop | 593 | 71.0% |
| Smartphone | 714 | 85.5% |
| Tablet | 371 | 44.4% |
| No Computing Device | 46 | 5.5% |
| Total | 835 | 100.0% |
Internet Access in Whitney
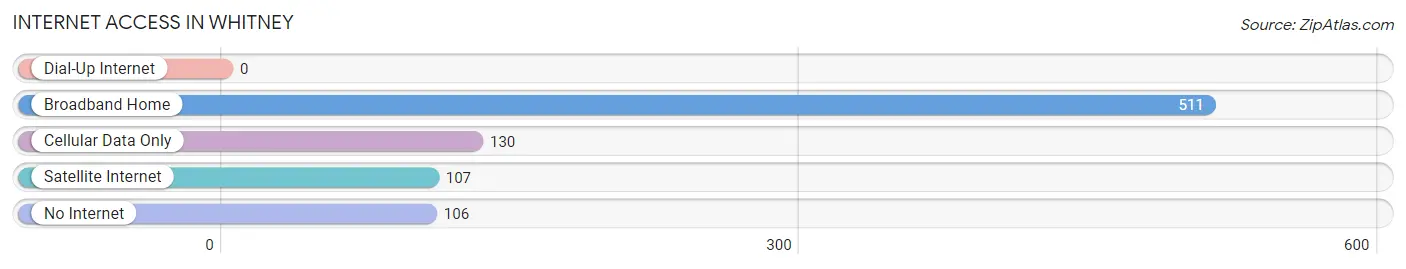
| Internet Type | # Households | % Households |
| Dial-Up Internet | 0 | 0.0% |
| Broadband Home | 511 | 61.2% |
| Cellular Data Only | 130 | 15.6% |
| Satellite Internet | 107 | 12.8% |
| No Internet | 106 | 12.7% |
| Total | 835 | 100.0% |
Whitney Summary
Whitney, Texas is a small city located in Hill County, Texas, United States. It is situated on the Brazos River, approximately 50 miles south of Dallas and 40 miles north of Waco. The city has a population of approximately 3,000 people and is the county seat of Hill County.
History
The area that is now Whitney was first settled in the early 1850s by a group of German immigrants. The town was originally named “Holland” after the first settler, John Holland. In 1872, the town was renamed “Whitney” after the first postmaster, William Whitney.
The city was officially incorporated in 1881 and quickly became a center of commerce and industry. The city was home to several cotton gins, a cottonseed oil mill, a flour mill, and a brick factory. The city also had a railroad station, which connected it to the rest of the state.
In the early 1900s, the city experienced a period of growth and prosperity. The population increased from 1,000 in 1900 to over 3,000 by 1930. During this time, the city was home to several banks, a movie theater, a hotel, and a variety of other businesses.
Geography
Whitney is located in Hill County, Texas, approximately 50 miles south of Dallas and 40 miles north of Waco. The city is situated on the Brazos River and is surrounded by rolling hills and farmland. The climate is generally mild, with temperatures ranging from the mid-50s in the winter to the mid-90s in the summer.
Economy
The economy of Whitney is largely based on agriculture and tourism. The city is home to several farms and ranches, which produce a variety of crops, including cotton, corn, wheat, and hay. The city is also home to several tourist attractions, including the Hill County Courthouse, the Hill County Museum, and the Hill County Historical Society.
Demographics
As of the 2010 census, the population of Whitney was 3,076. The racial makeup of the city was 79.3% White, 15.2% Hispanic or Latino, 2.2% African American, 0.7% Native American, 0.3% Asian, and 2.5% from other races. The median household income was $37,917, and the median family income was $45,938.
Conclusion
Whitney, Texas is a small city located in Hill County, Texas, United States. It is situated on the Brazos River, approximately 50 miles south of Dallas and 40 miles north of Waco. The city has a population of approximately 3,000 people and is the county seat of Hill County. The economy of Whitney is largely based on agriculture and tourism, and the city is home to several farms and ranches, as well as a variety of tourist attractions. The population of Whitney is largely White, with a significant Hispanic or Latino population. The median household income is $37,917, and the median family income is $45,938.
Common Questions
What is Per Capita Income in Whitney?
Per Capita income in Whitney is $22,210.
What is the Median Family Income in Whitney?
Median Family Income in Whitney is $49,808.
What is the Median Household income in Whitney?
Median Household Income in Whitney is $39,215.
What is Income or Wage Gap in Whitney?
Income or Wage Gap in Whitney is 48.0%.
Women in Whitney earn 52.0 cents for every dollar earned by a man.
What is Inequality or Gini Index in Whitney?
Inequality or Gini Index in Whitney is 0.44.
What is the Total Population of Whitney?
Total Population of Whitney is 2,336.
What is the Total Male Population of Whitney?
Total Male Population of Whitney is 1,115.
What is the Total Female Population of Whitney?
Total Female Population of Whitney is 1,221.
What is the Ratio of Males per 100 Females in Whitney?
There are 91.32 Males per 100 Females in Whitney.
What is the Ratio of Females per 100 Males in Whitney?
There are 109.51 Females per 100 Males in Whitney.
What is the Median Population Age in Whitney?
Median Population Age in Whitney is 37.9 Years.
What is the Average Family Size in Whitney
Average Family Size in Whitney is 3.2 People.
What is the Average Household Size in Whitney
Average Household Size in Whitney is 2.6 People.
How Large is the Labor Force in Whitney?
There are 1,006 People in the Labor Forcein in Whitney.
What is the Percentage of People in the Labor Force in Whitney?
55.5% of People are in the Labor Force in Whitney.
What is the Unemployment Rate in Whitney?
Unemployment Rate in Whitney is 3.2%.