Westbrook, TX Map & Demographics
Westbrook Map
Westbrook Overview
$33,215
PER CAPITA INCOME
74.1%
WAGE / INCOME GAP [ % ]
25.9¢/ $1
WAGE / INCOME GAP [ $ ]
0.37
INEQUALITY / GINI INDEX
302
TOTAL POPULATION
179
MALE POPULATION
123
FEMALE POPULATION
145.53
MALES / 100 FEMALES
68.72
FEMALES / 100 MALES
35.0
MEDIAN AGE
4.7
AVG FAMILY SIZE
4.6
AVG HOUSEHOLD SIZE
118
LABOR FORCE [ PEOPLE ]
48.4%
PERCENT IN LABOR FORCE
Westbrook Zip Codes
Income in Westbrook
Income Overview in Westbrook
| Characteristic | Number | Measure |
| Per Capita Income | 302 | $33,215 |
| Median Family Income | 64 | $0 |
| Mean Family Income | 64 | $142,673 |
| Median Household Income | 66 | $0 |
| Mean Household Income | 66 | $138,935 |
| Income Deficit | 64 | $0 |
| Wage / Income Gap (%) | 302 | 74.11% |
| Wage / Income Gap ($) | 302 | 25.89¢ per $1 |
| Gini / Inequality Index | 302 | 0.37 |
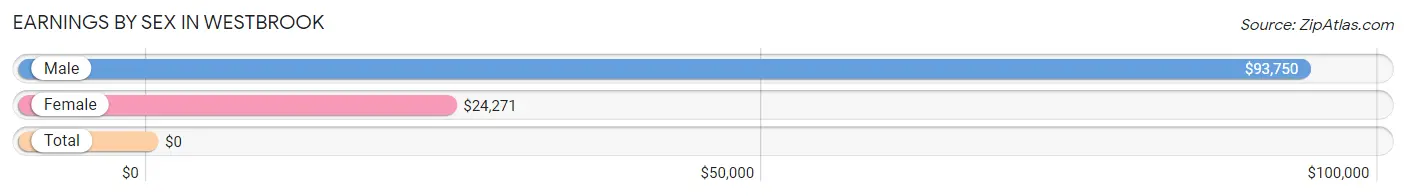
Earnings by Sex in Westbrook
| Sex | Number | Average Earnings |
| Male | 77 (62.1%) | $93,750 |
| Female | 47 (37.9%) | $24,271 |
| Total | 124 (100.0%) | $0 |
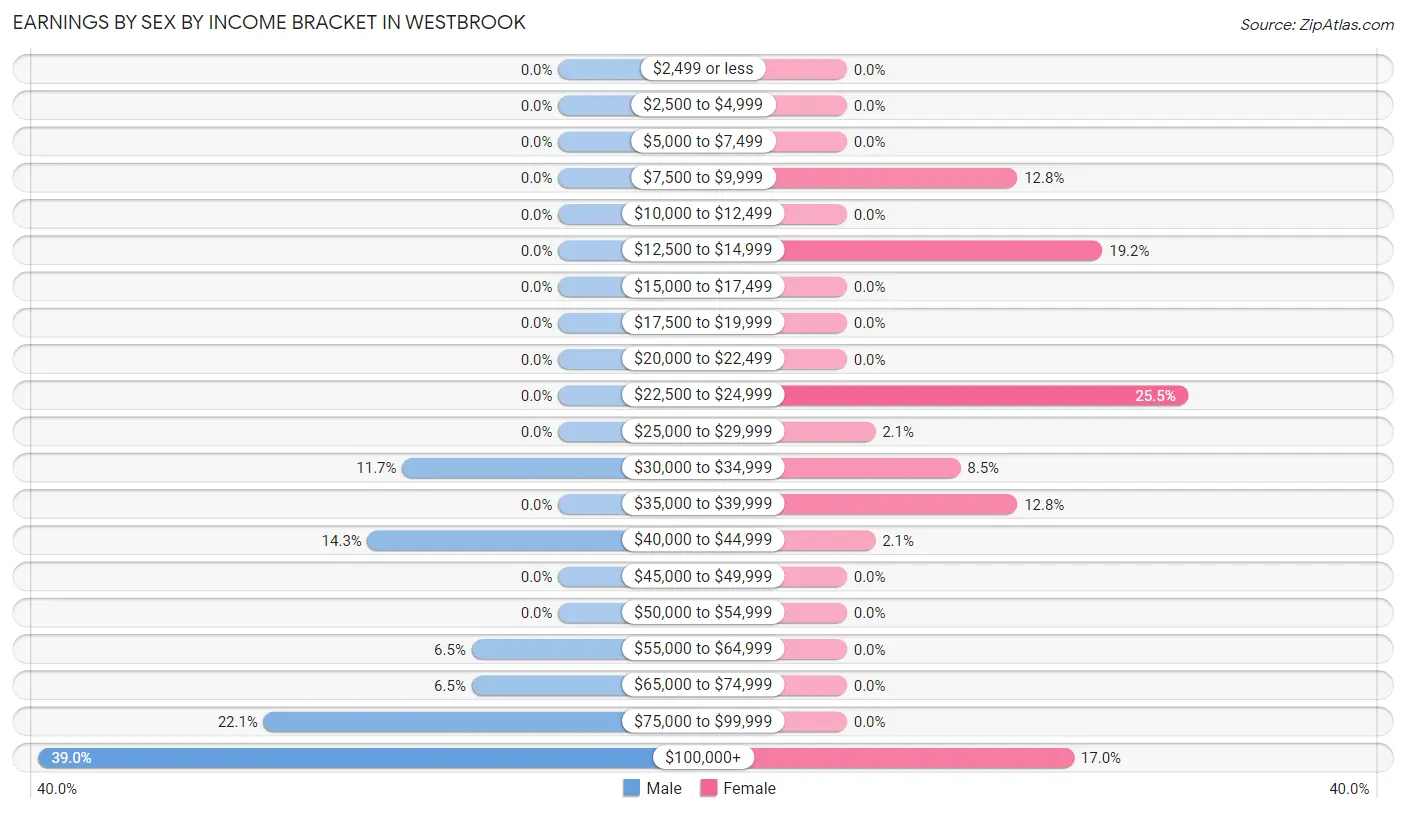
Earnings by Sex by Income Bracket in Westbrook
The most common earnings brackets in Westbrook are $100,000+ for men (30 | 39.0%) and $22,500 to $24,999 for women (12 | 25.5%).
| Income | Male | Female |
| $2,499 or less | 0 (0.0%) | 0 (0.0%) |
| $2,500 to $4,999 | 0 (0.0%) | 0 (0.0%) |
| $5,000 to $7,499 | 0 (0.0%) | 0 (0.0%) |
| $7,500 to $9,999 | 0 (0.0%) | 6 (12.8%) |
| $10,000 to $12,499 | 0 (0.0%) | 0 (0.0%) |
| $12,500 to $14,999 | 0 (0.0%) | 9 (19.2%) |
| $15,000 to $17,499 | 0 (0.0%) | 0 (0.0%) |
| $17,500 to $19,999 | 0 (0.0%) | 0 (0.0%) |
| $20,000 to $22,499 | 0 (0.0%) | 0 (0.0%) |
| $22,500 to $24,999 | 0 (0.0%) | 12 (25.5%) |
| $25,000 to $29,999 | 0 (0.0%) | 1 (2.1%) |
| $30,000 to $34,999 | 9 (11.7%) | 4 (8.5%) |
| $35,000 to $39,999 | 0 (0.0%) | 6 (12.8%) |
| $40,000 to $44,999 | 11 (14.3%) | 1 (2.1%) |
| $45,000 to $49,999 | 0 (0.0%) | 0 (0.0%) |
| $50,000 to $54,999 | 0 (0.0%) | 0 (0.0%) |
| $55,000 to $64,999 | 5 (6.5%) | 0 (0.0%) |
| $65,000 to $74,999 | 5 (6.5%) | 0 (0.0%) |
| $75,000 to $99,999 | 17 (22.1%) | 0 (0.0%) |
| $100,000+ | 30 (39.0%) | 8 (17.0%) |
| Total | 77 (100.0%) | 47 (100.0%) |
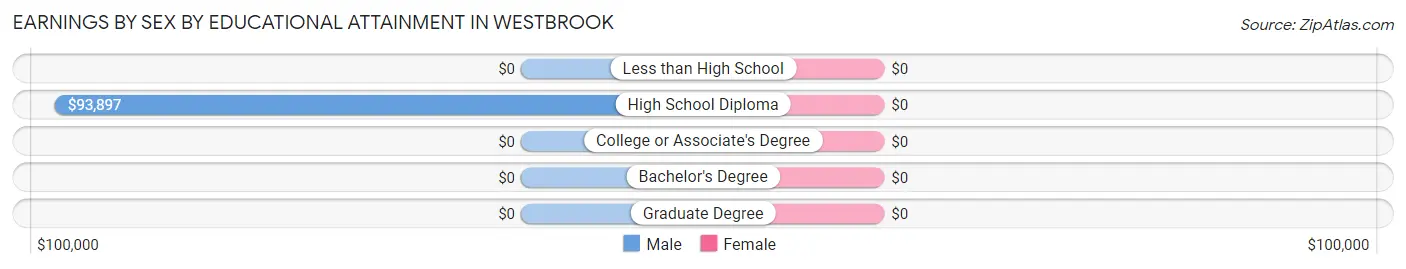
Earnings by Sex by Educational Attainment in Westbrook
| Educational Attainment | Male Income | Female Income |
| Less than High School | - | - |
| High School Diploma | $93,897 | $0 |
| College or Associate's Degree | - | - |
| Bachelor's Degree | - | - |
| Graduate Degree | - | - |
| Total | $93,750 | $0 |
Family Income in Westbrook
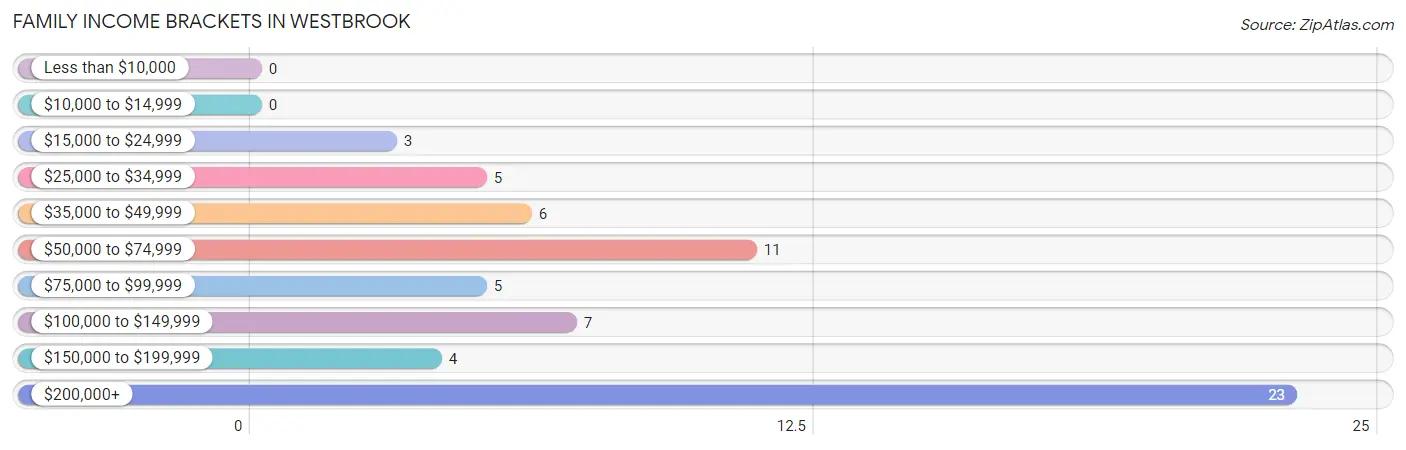
Family Income Brackets in Westbrook
According to the Westbrook family income data, there are 23 families falling into the $200,000+ income range, which is the most common income bracket and makes up 35.9% of all families.
| Income Bracket | # Families | % Families |
| Less than $10,000 | 0 | 0.0% |
| $10,000 to $14,999 | 0 | 0.0% |
| $15,000 to $24,999 | 3 | 4.7% |
| $25,000 to $34,999 | 5 | 7.8% |
| $35,000 to $49,999 | 6 | 9.4% |
| $50,000 to $74,999 | 11 | 17.2% |
| $75,000 to $99,999 | 5 | 7.8% |
| $100,000 to $149,999 | 7 | 10.9% |
| $150,000 to $199,999 | 4 | 6.3% |
| $200,000+ | 23 | 35.9% |
Family Income by Famaliy Size in Westbrook
| Income Bracket | # Families | Median Income |
| 2-Person Families | 8 (12.5%) | $0 |
| 3-Person Families | 17 (26.6%) | $0 |
| 4-Person Families | 27 (42.2%) | $0 |
| 5-Person Families | 12 (18.8%) | $0 |
| 6-Person Families | 0 (0.0%) | $0 |
| 7+ Person Families | 0 (0.0%) | $0 |
| Total | 64 (100.0%) | $0 |
Family Income by Number of Earners in Westbrook
| Number of Earners | # Families | Median Income |
| No Earners | 9 (14.1%) | $0 |
| 1 Earner | 10 (15.6%) | $0 |
| 2 Earners | 34 (53.1%) | $0 |
| 3+ Earners | 11 (17.2%) | $0 |
| Total | 64 (100.0%) | $0 |
Household Income in Westbrook
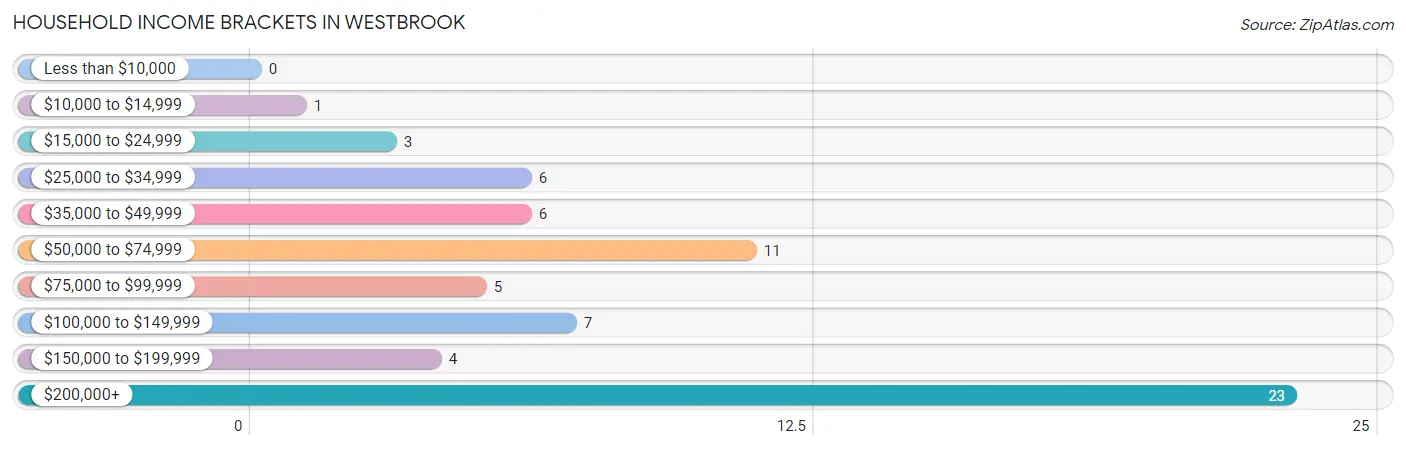
Household Income Brackets in Westbrook
With 23 households falling in the category, the $200,000+ income range is the most frequent in Westbrook, accounting for 34.8% of all households.
| Income Bracket | # Households | % Households |
| Less than $10,000 | 0 | 0.0% |
| $10,000 to $14,999 | 1 | 1.5% |
| $15,000 to $24,999 | 3 | 4.5% |
| $25,000 to $34,999 | 6 | 9.1% |
| $35,000 to $49,999 | 6 | 9.1% |
| $50,000 to $74,999 | 11 | 16.7% |
| $75,000 to $99,999 | 5 | 7.6% |
| $100,000 to $149,999 | 7 | 10.6% |
| $150,000 to $199,999 | 4 | 6.1% |
| $200,000+ | 23 | 34.8% |
Household Income by Householder Age in Westbrook
| Income Bracket | # Households | Median Income |
| 15 to 24 Years | 0 (0.0%) | $0 |
| 25 to 44 Years | 27 (40.9%) | $0 |
| 45 to 64 Years | 30 (45.5%) | $0 |
| 65+ Years | 9 (13.6%) | $0 |
| Total | 66 (100.0%) | $0 |
Poverty in Westbrook
Income Below Poverty by Sex and Age in Westbrook
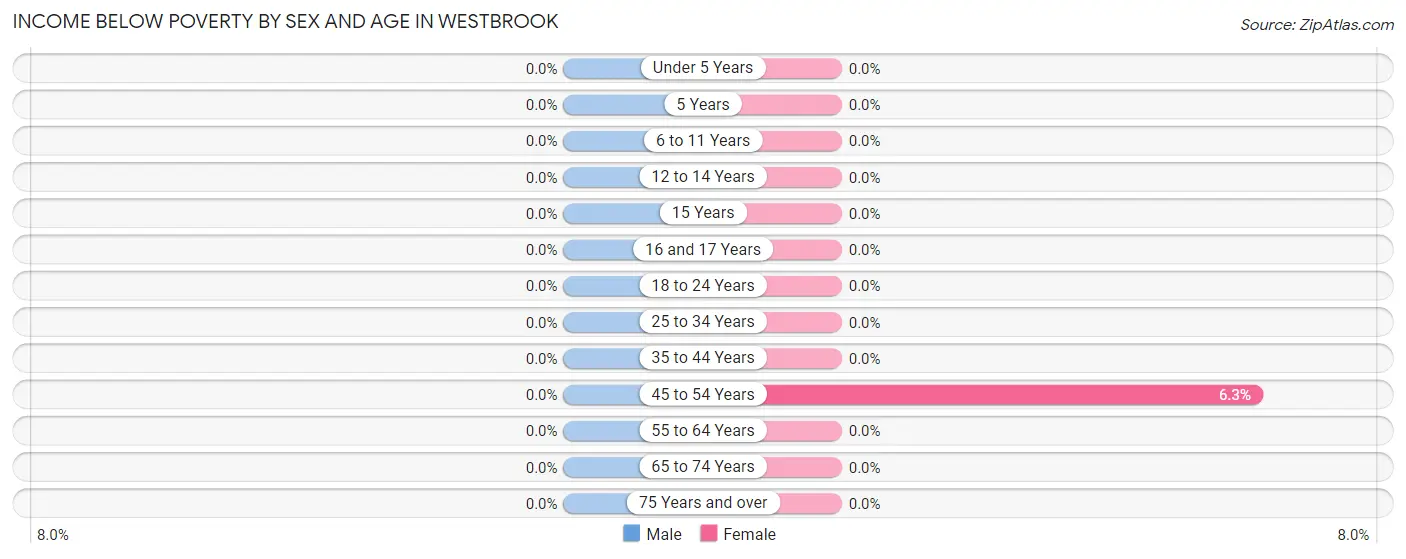
| Age Bracket | Male | Female |
| Under 5 Years | 0 (0.0%) | 0 (0.0%) |
| 5 Years | 0 (0.0%) | 0 (0.0%) |
| 6 to 11 Years | 0 (0.0%) | 0 (0.0%) |
| 12 to 14 Years | 0 (0.0%) | 0 (0.0%) |
| 15 Years | 0 (0.0%) | 0 (0.0%) |
| 16 and 17 Years | 0 (0.0%) | 0 (0.0%) |
| 18 to 24 Years | 0 (0.0%) | 0 (0.0%) |
| 25 to 34 Years | 0 (0.0%) | 0 (0.0%) |
| 35 to 44 Years | 0 (0.0%) | 0 (0.0%) |
| 45 to 54 Years | 0 (0.0%) | 1 (6.2%) |
| 55 to 64 Years | 0 (0.0%) | 0 (0.0%) |
| 65 to 74 Years | 0 (0.0%) | 0 (0.0%) |
| 75 Years and over | 0 (0.0%) | 0 (0.0%) |
| Total | 0 (0.0%) | 1 (0.8%) |
Income Above Poverty by Sex and Age in Westbrook
According to the poverty statistics in Westbrook, males aged 6 to 11 years and females aged under 5 years are the age groups that are most secure financially, with 100.0% of males and 100.0% of females in these age groups living above the poverty line.
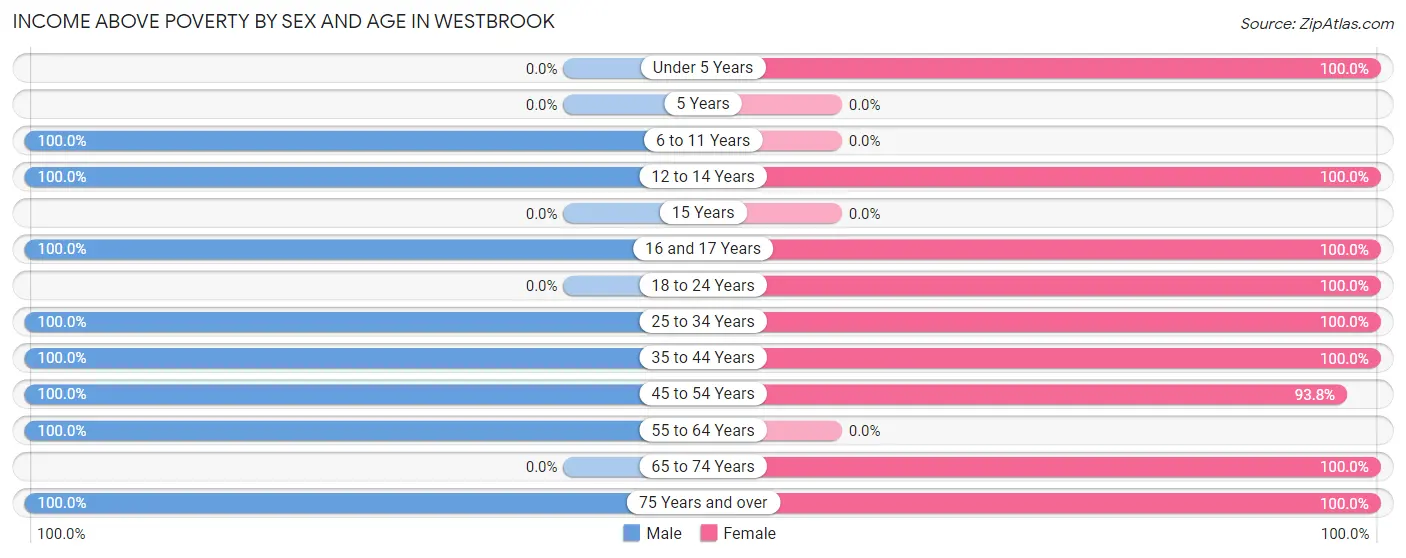
| Age Bracket | Male | Female |
| Under 5 Years | 0 (0.0%) | 5 (100.0%) |
| 5 Years | 0 (0.0%) | 0 (0.0%) |
| 6 to 11 Years | 25 (100.0%) | 0 (0.0%) |
| 12 to 14 Years | 15 (100.0%) | 13 (100.0%) |
| 15 Years | 0 (0.0%) | 0 (0.0%) |
| 16 and 17 Years | 27 (100.0%) | 15 (100.0%) |
| 18 to 24 Years | 0 (0.0%) | 29 (100.0%) |
| 25 to 34 Years | 11 (100.0%) | 11 (100.0%) |
| 35 to 44 Years | 28 (100.0%) | 23 (100.0%) |
| 45 to 54 Years | 59 (100.0%) | 15 (93.8%) |
| 55 to 64 Years | 5 (100.0%) | 0 (0.0%) |
| 65 to 74 Years | 0 (0.0%) | 10 (100.0%) |
| 75 Years and over | 9 (100.0%) | 1 (100.0%) |
| Total | 179 (100.0%) | 122 (99.2%) |
Income Below Poverty Among Married-Couple Families in Westbrook
| Children | Above Poverty | Below Poverty |
| No Children | 8 (100.0%) | 0 (0.0%) |
| 1 or 2 Children | 44 (100.0%) | 0 (0.0%) |
| 3 or 4 Children | 6 (100.0%) | 0 (0.0%) |
| 5 or more Children | 0 (0.0%) | 0 (0.0%) |
| Total | 58 (100.0%) | 0 (0.0%) |
Income Below Poverty Among Single-Parent Households in Westbrook
| Children | Single Father | Single Mother |
| No Children | 0 (0.0%) | 0 (0.0%) |
| 1 or 2 Children | 0 (0.0%) | 0 (0.0%) |
| 3 or 4 Children | 0 (0.0%) | 0 (0.0%) |
| 5 or more Children | 0 (0.0%) | 0 (0.0%) |
| Total | 0 (0.0%) | 0 (0.0%) |
Income Below Poverty Among Married-Couple vs Single-Parent Households in Westbrook
| Children | Married-Couple Families | Single-Parent Households |
| No Children | 0 (0.0%) | 0 (0.0%) |
| 1 or 2 Children | 0 (0.0%) | 0 (0.0%) |
| 3 or 4 Children | 0 (0.0%) | 0 (0.0%) |
| 5 or more Children | 0 (0.0%) | 0 (0.0%) |
| Total | 0 (0.0%) | 0 (0.0%) |
Race in Westbrook
The most populous races in Westbrook are White / Caucasian (243 | 80.5%), Hispanic or Latino (64 | 21.2%), and Two or more Races (59 | 19.5%).
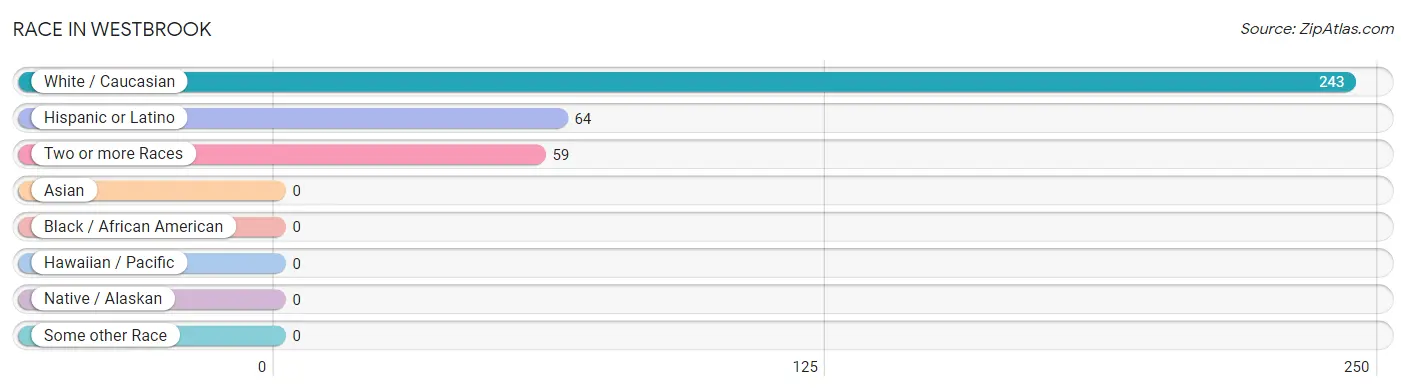
| Race | # Population | % Population |
| Asian | 0 | 0.0% |
| Black / African American | 0 | 0.0% |
| Hawaiian / Pacific | 0 | 0.0% |
| Hispanic or Latino | 64 | 21.2% |
| Native / Alaskan | 0 | 0.0% |
| White / Caucasian | 243 | 80.5% |
| Two or more Races | 59 | 19.5% |
| Some other Race | 0 | 0.0% |
| Total | 302 | 100.0% |
Ancestry in Westbrook
The most populous ancestries reported in Westbrook are German (66 | 21.8%), Mexican (64 | 21.2%), American (51 | 16.9%), Irish (31 | 10.3%), and Polish (23 | 7.6%), together accounting for 77.8% of all Westbrook residents.
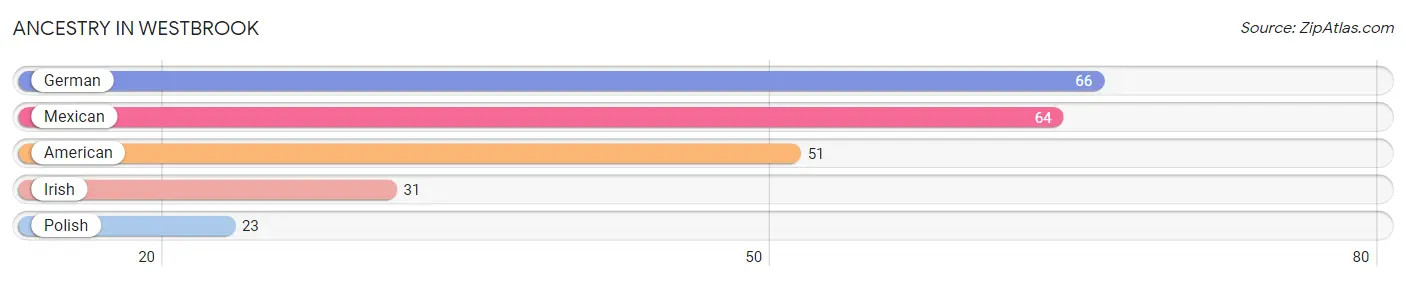
| Ancestry | # Population | % Population |
| American | 51 | 16.9% |
| German | 66 | 21.8% |
| Irish | 31 | 10.3% |
| Mexican | 64 | 21.2% |
| Polish | 23 | 7.6% | View All 5 Rows |
Immigrants in Westbrook
The most numerous immigrant groups reported in Westbrook came from Central America (6 | 2.0%), Latin America (6 | 2.0%), and Mexico (6 | 2.0%), together accounting for 6.0% of all Westbrook residents.
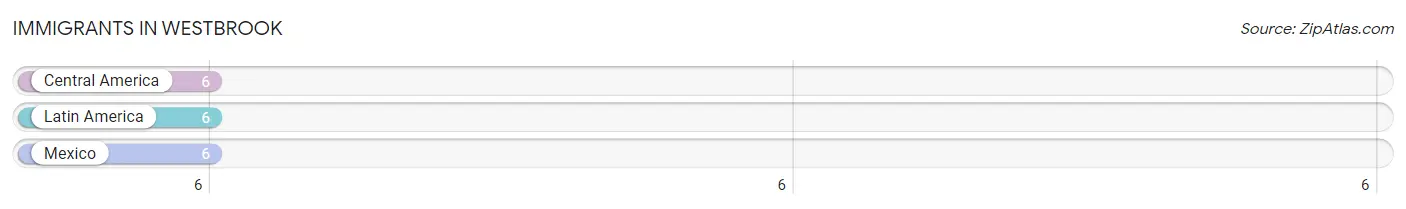
| Immigration Origin | # Population | % Population |
| Central America | 6 | 2.0% |
| Latin America | 6 | 2.0% |
| Mexico | 6 | 2.0% | View All 3 Rows |
Sex and Age in Westbrook
Sex and Age in Westbrook
The most populous age groups in Westbrook are 45 to 49 Years (59 | 33.0%) for men and 15 to 19 Years (32 | 26.0%) for women.

| Age Bracket | Male | Female |
| Under 5 Years | 0 (0.0%) | 5 (4.1%) |
| 5 to 9 Years | 17 (9.5%) | 0 (0.0%) |
| 10 to 14 Years | 23 (12.9%) | 13 (10.6%) |
| 15 to 19 Years | 27 (15.1%) | 32 (26.0%) |
| 20 to 24 Years | 0 (0.0%) | 12 (9.8%) |
| 25 to 29 Years | 0 (0.0%) | 0 (0.0%) |
| 30 to 34 Years | 11 (6.1%) | 11 (8.9%) |
| 35 to 39 Years | 9 (5.0%) | 19 (15.4%) |
| 40 to 44 Years | 19 (10.6%) | 4 (3.3%) |
| 45 to 49 Years | 59 (33.0%) | 13 (10.6%) |
| 50 to 54 Years | 0 (0.0%) | 3 (2.4%) |
| 55 to 59 Years | 0 (0.0%) | 0 (0.0%) |
| 60 to 64 Years | 5 (2.8%) | 0 (0.0%) |
| 65 to 69 Years | 0 (0.0%) | 10 (8.1%) |
| 70 to 74 Years | 0 (0.0%) | 0 (0.0%) |
| 75 to 79 Years | 6 (3.4%) | 0 (0.0%) |
| 80 to 84 Years | 3 (1.7%) | 1 (0.8%) |
| 85 Years and over | 0 (0.0%) | 0 (0.0%) |
| Total | 179 (100.0%) | 123 (100.0%) |
Families and Households in Westbrook
Median Family Size in Westbrook
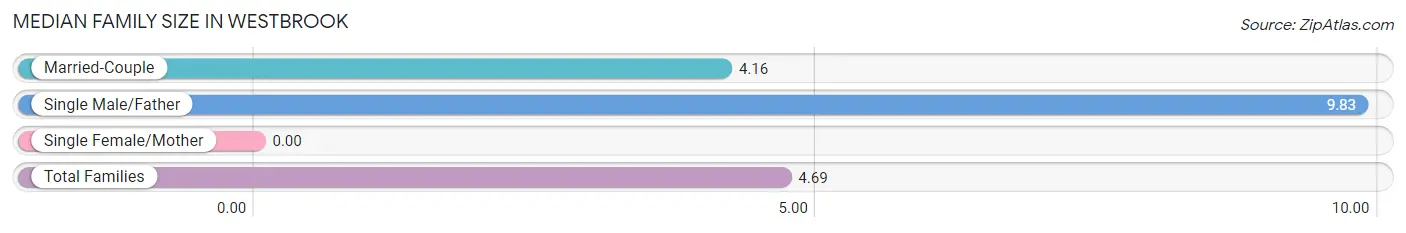
| Family Type | # Families | Family Size |
| Married-Couple | 58 (90.6%) | 4.16 |
| Single Male/Father | 6 (9.4%) | 9.83 |
| Single Female/Mother | 0 (0.0%) | - |
| Total Families | 64 (100.0%) | 4.69 |
Median Household Size in Westbrook
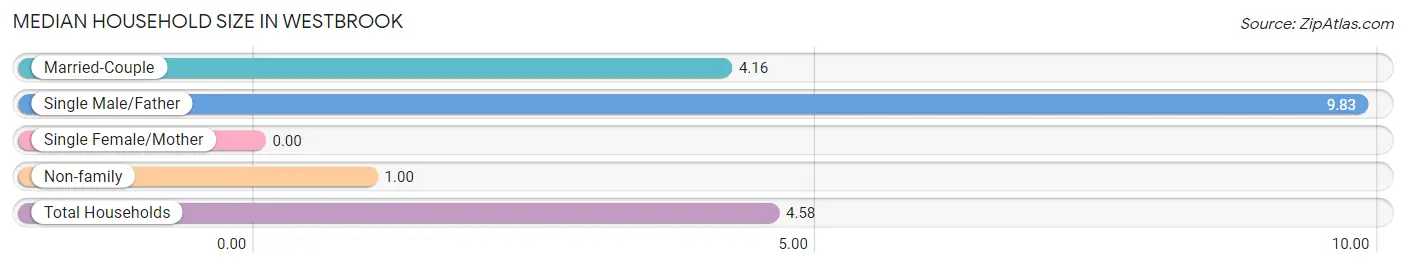
| Household Type | # Households | Household Size |
| Married-Couple | 58 (87.9%) | 4.16 |
| Single Male/Father | 6 (9.1%) | 9.83 |
| Single Female/Mother | 0 (0.0%) | - |
| Non-family | 2 (3.0%) | 1.00 |
| Total Households | 66 (100.0%) | 4.58 |
Household Size by Marriage Status in Westbrook
Out of a total of 66 households in Westbrook, 64 (97.0%) are family households, while 2 (3.0%) are nonfamily households. The most numerous type of family households are 4-person households, comprising 27, and the most common type of nonfamily households are 1-person households, comprising 2.
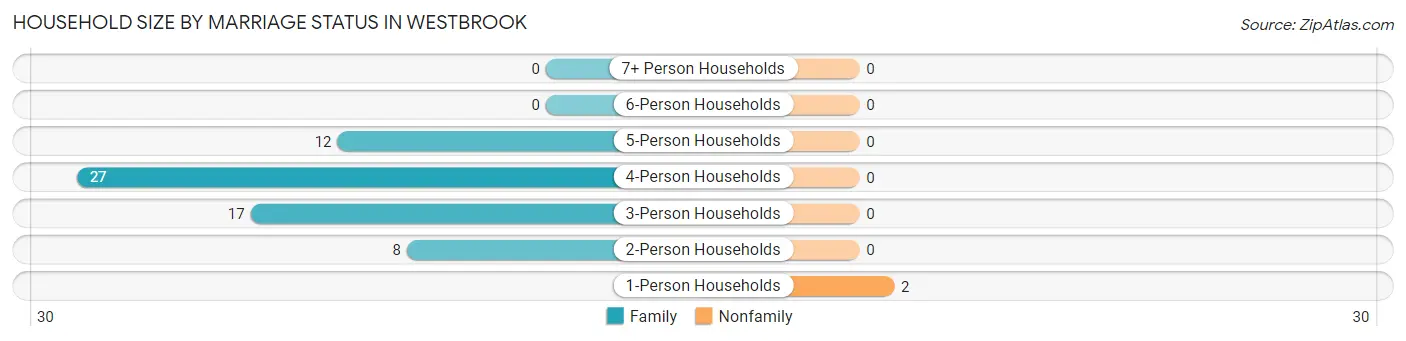
| Household Size | Family Households | Nonfamily Households |
| 1-Person Households | - | 2 (3.0%) |
| 2-Person Households | 8 (12.1%) | 0 (0.0%) |
| 3-Person Households | 17 (25.8%) | 0 (0.0%) |
| 4-Person Households | 27 (40.9%) | 0 (0.0%) |
| 5-Person Households | 12 (18.2%) | 0 (0.0%) |
| 6-Person Households | 0 (0.0%) | 0 (0.0%) |
| 7+ Person Households | 0 (0.0%) | 0 (0.0%) |
| Total | 64 (97.0%) | 2 (3.0%) |
Female Fertility in Westbrook
Fertility by Age in Westbrook
| Age Bracket | Women with Births | Births / 1,000 Women |
| 15 to 19 years | 0 (0.0%) | 0.0 |
| 20 to 34 years | 0 (0.0%) | 0.0 |
| 35 to 50 years | 0 (0.0%) | 0.0 |
| Total | 0 (0.0%) | 0.0 |
Fertility by Age by Marriage Status in Westbrook
| Age Bracket | Married | Unmarried |
| 15 to 19 years | 0 (0.0%) | 0 (0.0%) |
| 20 to 34 years | 0 (0.0%) | 0 (0.0%) |
| 35 to 50 years | 0 (0.0%) | 0 (0.0%) |
| Total | 0 (0.0%) | 0 (0.0%) |
Fertility by Education in Westbrook
| Educational Attainment | Women with Births | Births / 1,000 Women |
| Less than High School | 0 (0.0%) | 0.0 |
| High School Diploma | 0 (0.0%) | 0.0 |
| College or Associate's Degree | 0 (0.0%) | 0.0 |
| Bachelor's Degree | 0 (0.0%) | 0.0 |
| Graduate Degree | 0 (0.0%) | 0.0 |
| Total | 0 (0.0%) | 0.0 |
Fertility by Education by Marriage Status in Westbrook
| Educational Attainment | Married | Unmarried |
| Less than High School | 0 (0.0%) | 0 (0.0%) |
| High School Diploma | 0 (0.0%) | 0 (0.0%) |
| College or Associate's Degree | 0 (0.0%) | 0 (0.0%) |
| Bachelor's Degree | 0 (0.0%) | 0 (0.0%) |
| Graduate Degree | 0 (0.0%) | 0 (0.0%) |
| Total | 0 (0.0%) | 0 (0.0%) |
Employment Characteristics in Westbrook
Employment by Class of Employer in Westbrook
Among the 118 employed individuals in Westbrook, private company employees (92 | 78.0%), self-employed (not incorporated) (11 | 9.3%), and not-for-profit organizations (9 | 7.6%) make up the most common classes of employment.
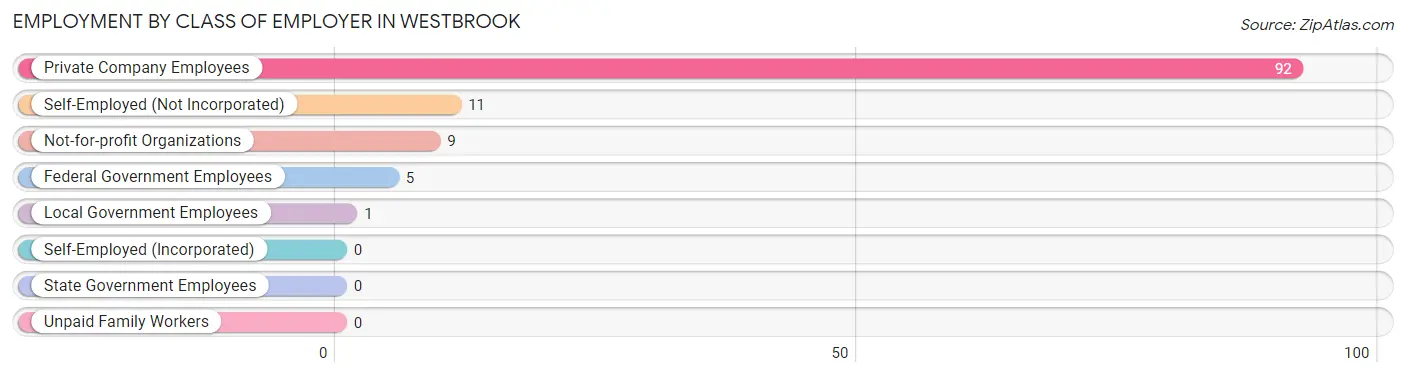
| Employer Class | # Employees | % Employees |
| Private Company Employees | 92 | 78.0% |
| Self-Employed (Incorporated) | 0 | 0.0% |
| Self-Employed (Not Incorporated) | 11 | 9.3% |
| Not-for-profit Organizations | 9 | 7.6% |
| Local Government Employees | 1 | 0.9% |
| State Government Employees | 0 | 0.0% |
| Federal Government Employees | 5 | 4.2% |
| Unpaid Family Workers | 0 | 0.0% |
| Total | 118 | 100.0% |
Employment Status by Age in Westbrook
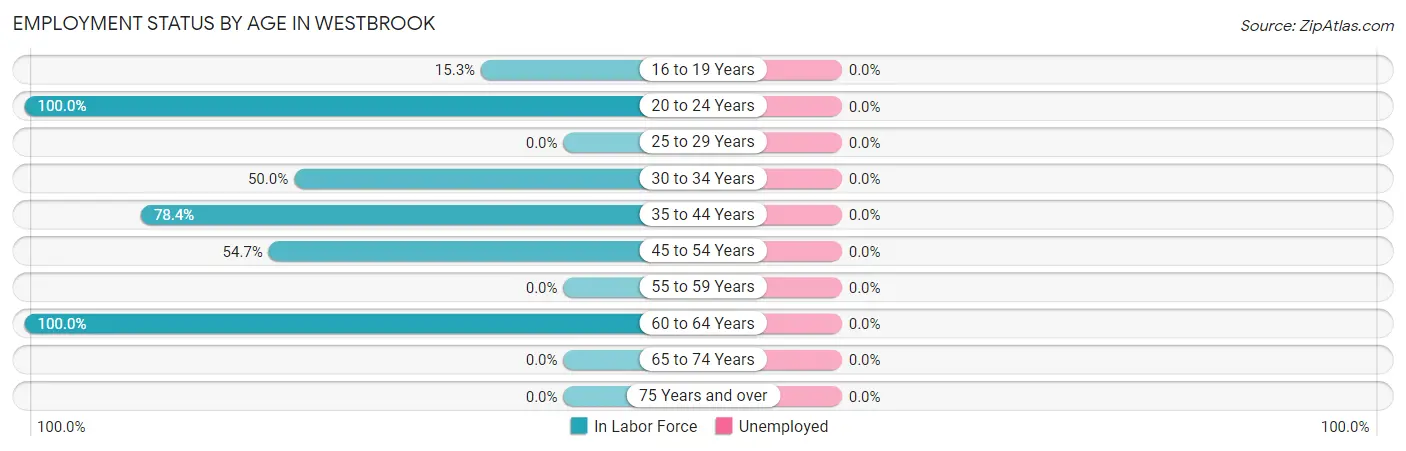
| Age Bracket | In Labor Force | Unemployed |
| 16 to 19 Years | 9 (15.3%) | 0 (0.0%) |
| 20 to 24 Years | 12 (100.0%) | 0 (0.0%) |
| 25 to 29 Years | 0 (0.0%) | 0 (0.0%) |
| 30 to 34 Years | 11 (50.0%) | 0 (0.0%) |
| 35 to 44 Years | 40 (78.4%) | 0 (0.0%) |
| 45 to 54 Years | 41 (54.7%) | 0 (0.0%) |
| 55 to 59 Years | 0 (0.0%) | 0 (0.0%) |
| 60 to 64 Years | 5 (100.0%) | 0 (0.0%) |
| 65 to 74 Years | 0 (0.0%) | 0 (0.0%) |
| 75 Years and over | 0 (0.0%) | 0 (0.0%) |
| Total | 118 (48.4%) | 0 (0.0%) |
Employment Status by Educational Attainment in Westbrook
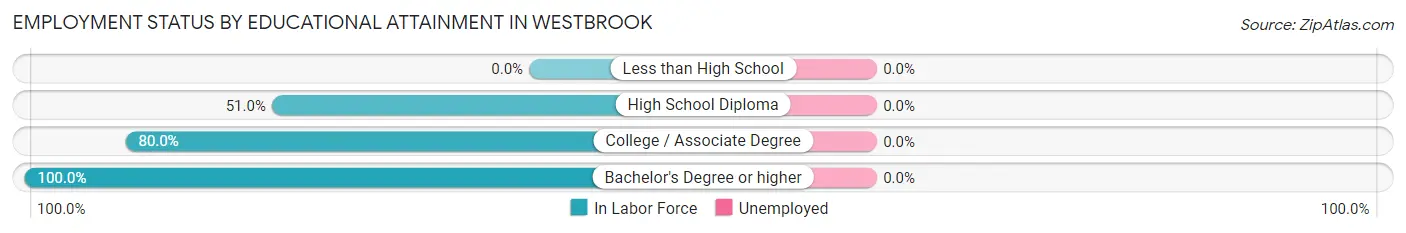
| Educational Attainment | In Labor Force | Unemployed |
| Less than High School | 0 (0.0%) | 0 (0.0%) |
| High School Diploma | 52 (51.0%) | 0 (0.0%) |
| College / Associate Degree | 24 (80.0%) | 0 (0.0%) |
| Bachelor's Degree or higher | 21 (100.0%) | 0 (0.0%) |
| Total | 97 (63.4%) | 0 (0.0%) |
Employment Occupations by Sex in Westbrook
Management, Business, Science and Arts Occupations
The most common Management, Business, Science and Arts occupations in Westbrook are Management (16 | 13.6%), Community & Social Service (9 | 7.6%), and Education, Arts & Media (9 | 7.6%).
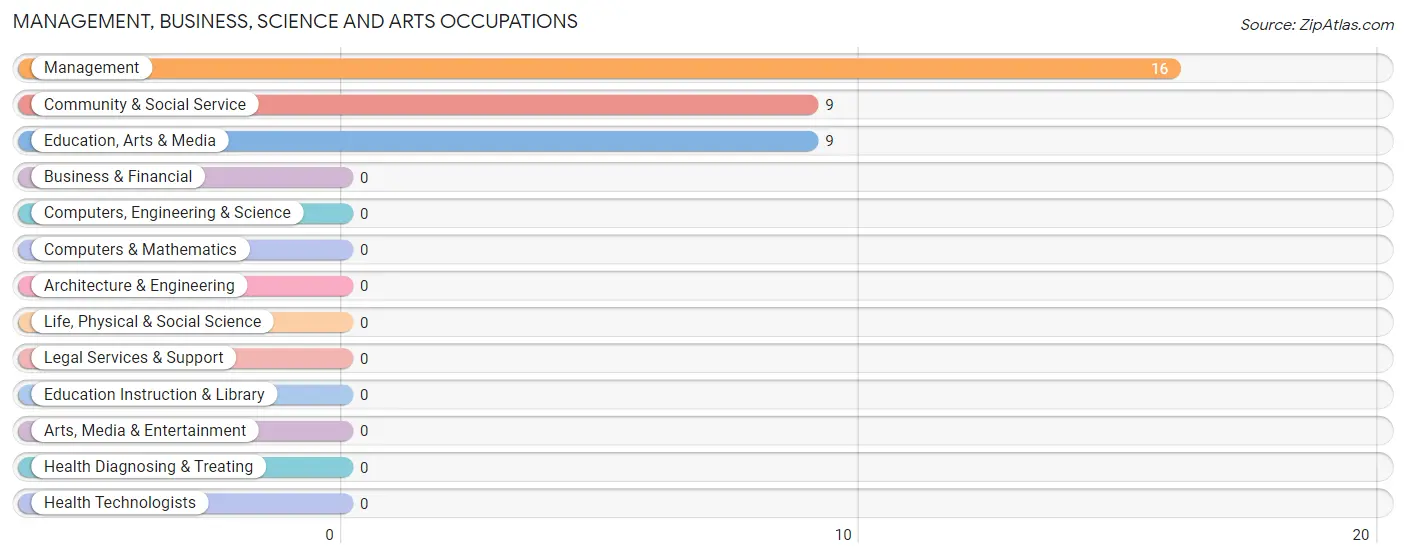
Management, Business, Science and Arts Occupations by Sex
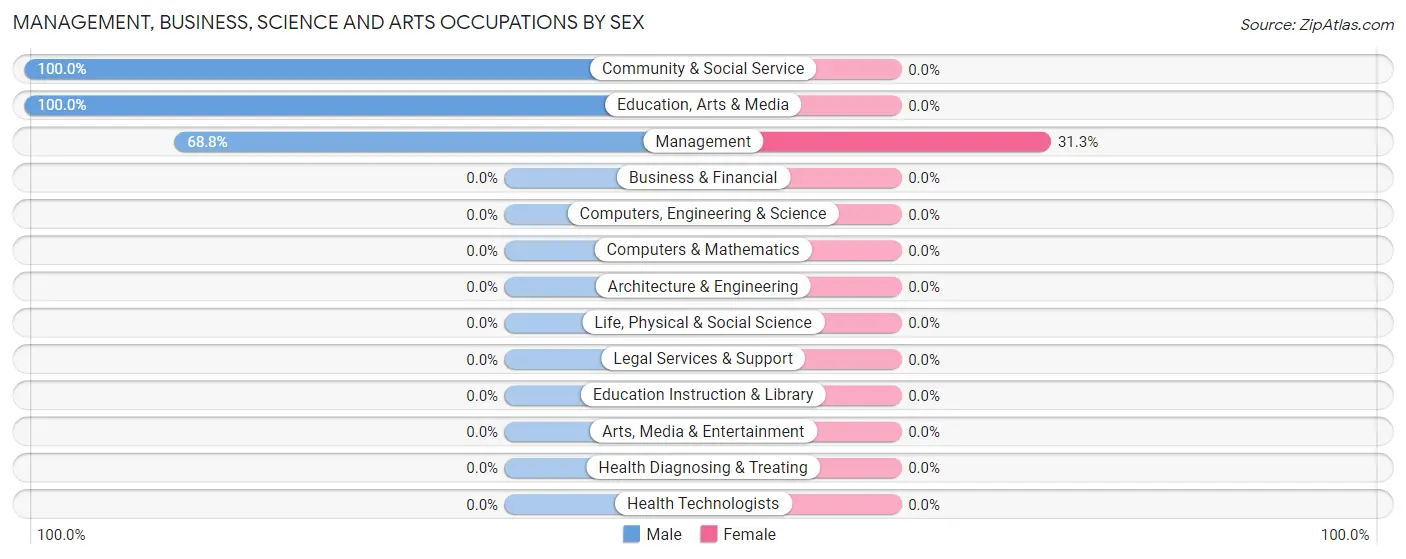
| Occupation | Male | Female |
| Management | 11 (68.8%) | 5 (31.2%) |
| Business & Financial | 0 (0.0%) | 0 (0.0%) |
| Computers, Engineering & Science | 0 (0.0%) | 0 (0.0%) |
| Computers & Mathematics | 0 (0.0%) | 0 (0.0%) |
| Architecture & Engineering | 0 (0.0%) | 0 (0.0%) |
| Life, Physical & Social Science | 0 (0.0%) | 0 (0.0%) |
| Community & Social Service | 9 (100.0%) | 0 (0.0%) |
| Education, Arts & Media | 9 (100.0%) | 0 (0.0%) |
| Legal Services & Support | 0 (0.0%) | 0 (0.0%) |
| Education Instruction & Library | 0 (0.0%) | 0 (0.0%) |
| Arts, Media & Entertainment | 0 (0.0%) | 0 (0.0%) |
| Health Diagnosing & Treating | 0 (0.0%) | 0 (0.0%) |
| Health Technologists | 0 (0.0%) | 0 (0.0%) |
| Total (Category) | 20 (80.0%) | 5 (20.0%) |
| Total (Overall) | 77 (65.2%) | 41 (34.7%) |
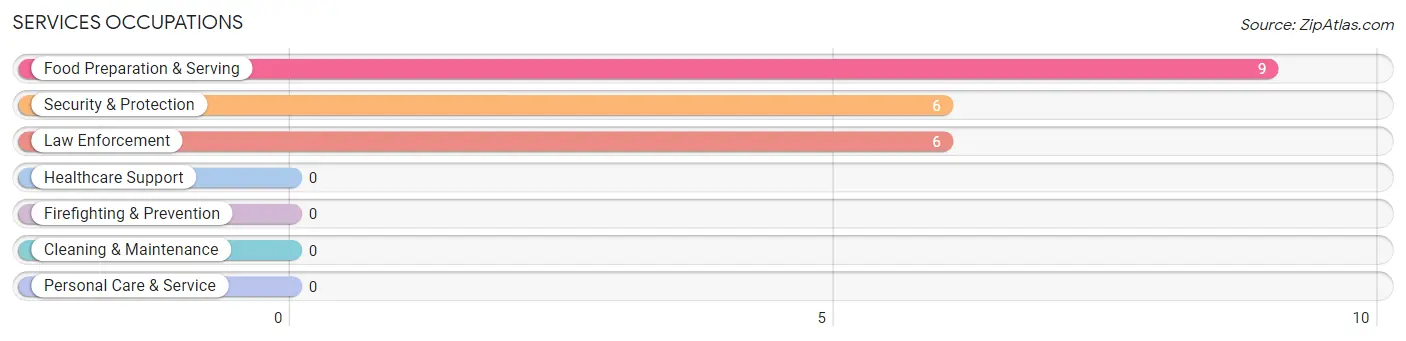
Services Occupations
The most common Services occupations in Westbrook are Food Preparation & Serving (9 | 7.6%), Security & Protection (6 | 5.1%), and Law Enforcement (6 | 5.1%).
Services Occupations by Sex
Within the Services occupations in Westbrook, the most male-oriented occupations are Security & Protection (83.3%), and Law Enforcement (83.3%), while the most female-oriented occupations are Food Preparation & Serving (100.0%), Security & Protection (16.7%), and Law Enforcement (16.7%).
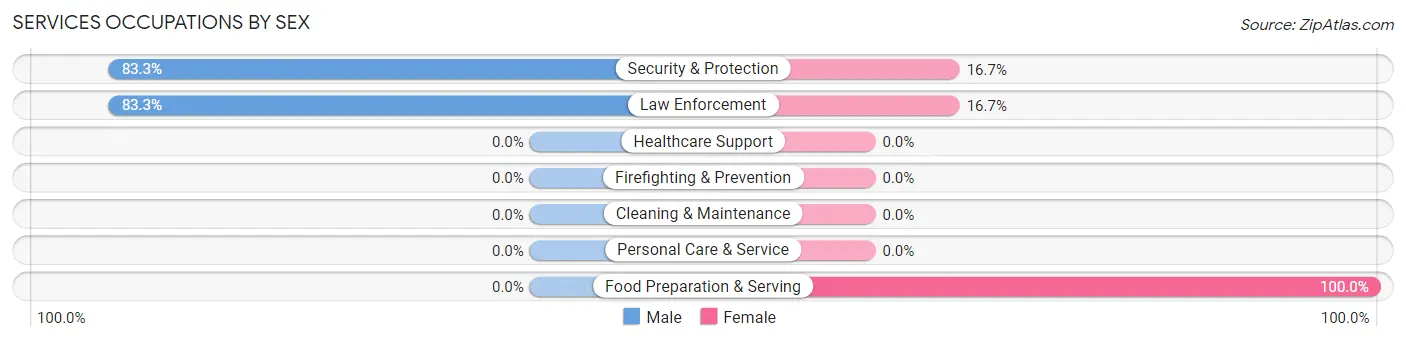
| Occupation | Male | Female |
| Healthcare Support | 0 (0.0%) | 0 (0.0%) |
| Security & Protection | 5 (83.3%) | 1 (16.7%) |
| Firefighting & Prevention | 0 (0.0%) | 0 (0.0%) |
| Law Enforcement | 5 (83.3%) | 1 (16.7%) |
| Food Preparation & Serving | 0 (0.0%) | 9 (100.0%) |
| Cleaning & Maintenance | 0 (0.0%) | 0 (0.0%) |
| Personal Care & Service | 0 (0.0%) | 0 (0.0%) |
| Total (Category) | 5 (33.3%) | 10 (66.7%) |
| Total (Overall) | 77 (65.2%) | 41 (34.7%) |
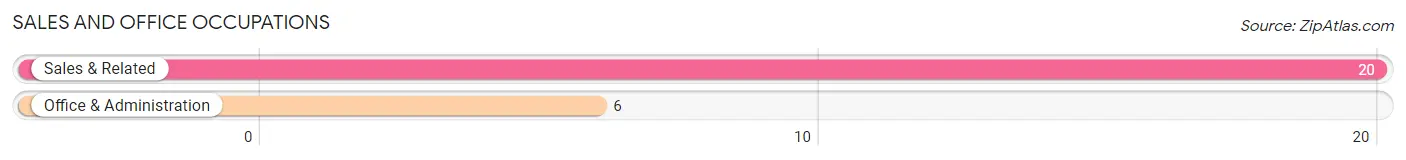
Sales and Office Occupations
The most common Sales and Office occupations in Westbrook are Sales & Related (20 | 17.0%), and Office & Administration (6 | 5.1%).
Sales and Office Occupations by Sex
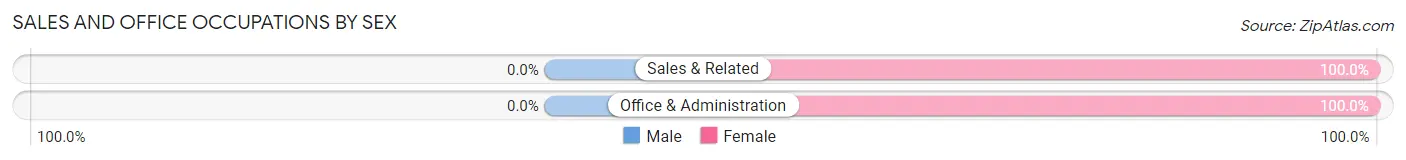
| Occupation | Male | Female |
| Sales & Related | 0 (0.0%) | 20 (100.0%) |
| Office & Administration | 0 (0.0%) | 6 (100.0%) |
| Total (Category) | 0 (0.0%) | 26 (100.0%) |
| Total (Overall) | 77 (65.2%) | 41 (34.7%) |
Natural Resources, Construction and Maintenance Occupations
The most common Natural Resources, Construction and Maintenance occupations in Westbrook are , and Installation, Maintenance & Repair (5 | 4.2%).
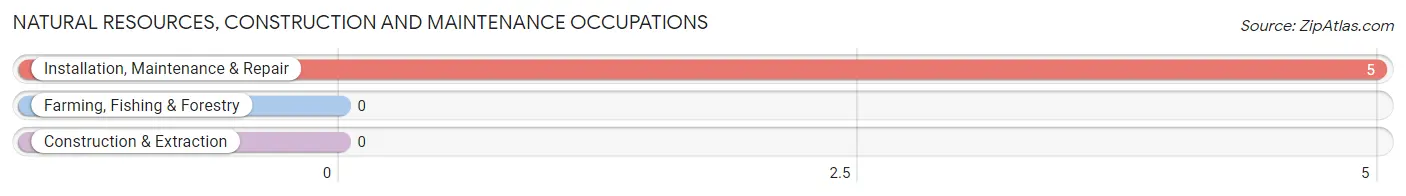
Natural Resources, Construction and Maintenance Occupations by Sex
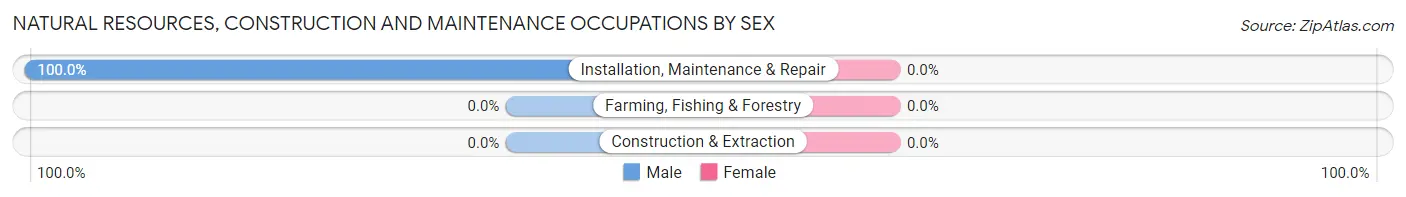
| Occupation | Male | Female |
| Farming, Fishing & Forestry | 0 (0.0%) | 0 (0.0%) |
| Construction & Extraction | 0 (0.0%) | 0 (0.0%) |
| Installation, Maintenance & Repair | 5 (100.0%) | 0 (0.0%) |
| Total (Category) | 5 (100.0%) | 0 (0.0%) |
| Total (Overall) | 77 (65.2%) | 41 (34.7%) |
Production, Transportation and Moving Occupations
The most common Production, Transportation and Moving occupations in Westbrook are , and Production (47 | 39.8%).
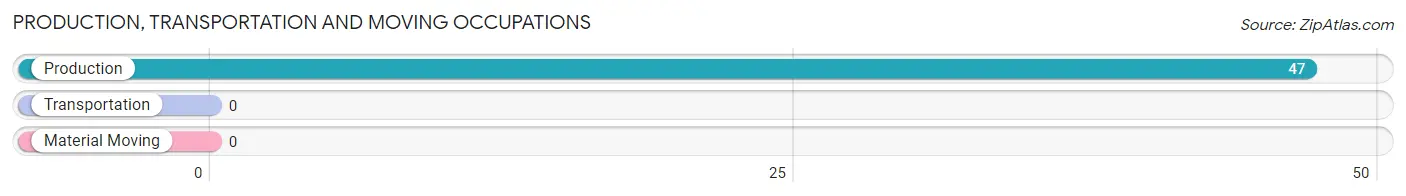
Production, Transportation and Moving Occupations by Sex
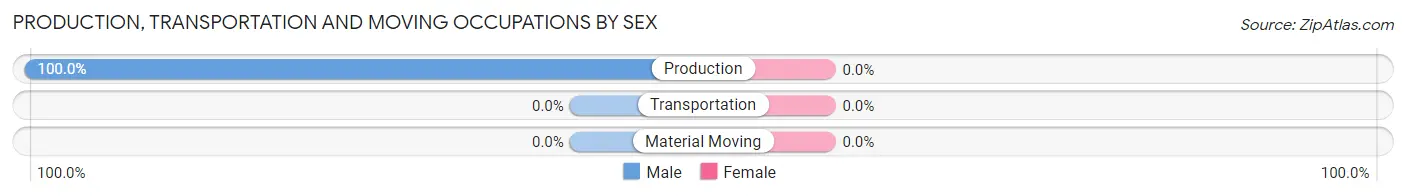
| Occupation | Male | Female |
| Production | 47 (100.0%) | 0 (0.0%) |
| Transportation | 0 (0.0%) | 0 (0.0%) |
| Material Moving | 0 (0.0%) | 0 (0.0%) |
| Total (Category) | 47 (100.0%) | 0 (0.0%) |
| Total (Overall) | 77 (65.2%) | 41 (34.7%) |
Employment Industries by Sex in Westbrook
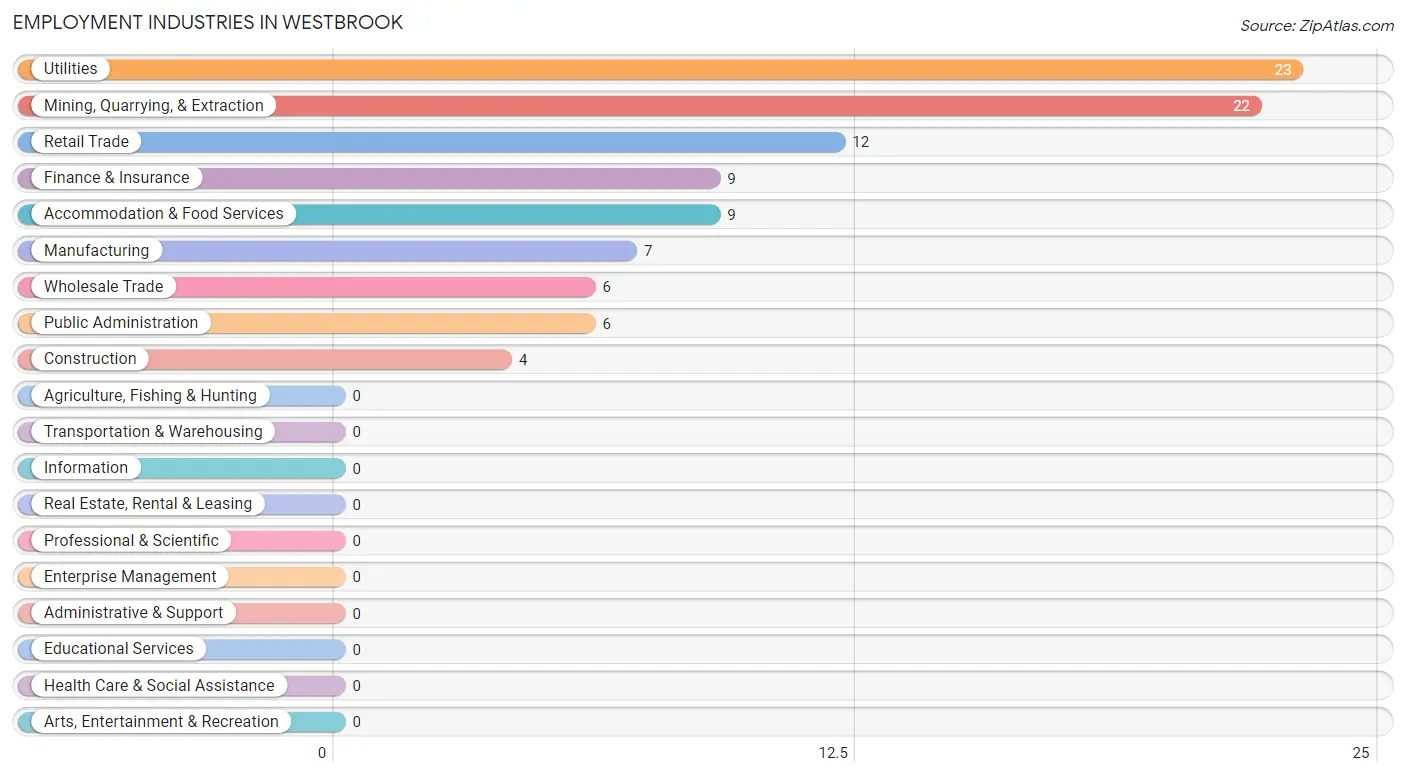
Employment Industries in Westbrook
The major employment industries in Westbrook include Utilities (23 | 19.5%), Mining, Quarrying, & Extraction (22 | 18.6%), Retail Trade (12 | 10.2%), Finance & Insurance (9 | 7.6%), and Accommodation & Food Services (9 | 7.6%).
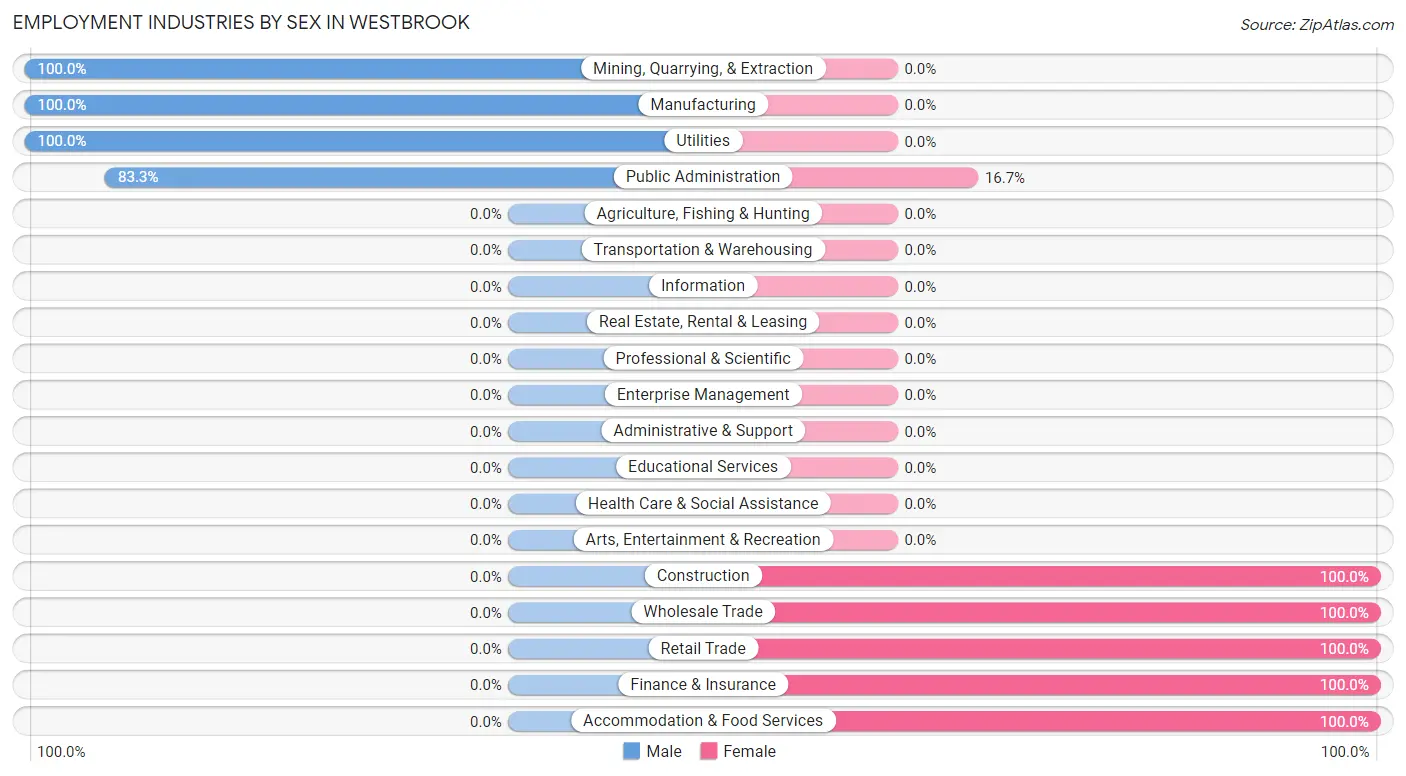
Employment Industries by Sex in Westbrook
The Westbrook industries that see more men than women are Mining, Quarrying, & Extraction (100.0%), Manufacturing (100.0%), and Utilities (100.0%), whereas the industries that tend to have a higher number of women are Construction (100.0%), Wholesale Trade (100.0%), and Retail Trade (100.0%).
| Industry | Male | Female |
| Agriculture, Fishing & Hunting | 0 (0.0%) | 0 (0.0%) |
| Mining, Quarrying, & Extraction | 22 (100.0%) | 0 (0.0%) |
| Construction | 0 (0.0%) | 4 (100.0%) |
| Manufacturing | 7 (100.0%) | 0 (0.0%) |
| Wholesale Trade | 0 (0.0%) | 6 (100.0%) |
| Retail Trade | 0 (0.0%) | 12 (100.0%) |
| Transportation & Warehousing | 0 (0.0%) | 0 (0.0%) |
| Utilities | 23 (100.0%) | 0 (0.0%) |
| Information | 0 (0.0%) | 0 (0.0%) |
| Finance & Insurance | 0 (0.0%) | 9 (100.0%) |
| Real Estate, Rental & Leasing | 0 (0.0%) | 0 (0.0%) |
| Professional & Scientific | 0 (0.0%) | 0 (0.0%) |
| Enterprise Management | 0 (0.0%) | 0 (0.0%) |
| Administrative & Support | 0 (0.0%) | 0 (0.0%) |
| Educational Services | 0 (0.0%) | 0 (0.0%) |
| Health Care & Social Assistance | 0 (0.0%) | 0 (0.0%) |
| Arts, Entertainment & Recreation | 0 (0.0%) | 0 (0.0%) |
| Accommodation & Food Services | 0 (0.0%) | 9 (100.0%) |
| Public Administration | 5 (83.3%) | 1 (16.7%) |
| Total | 77 (65.2%) | 41 (34.7%) |
Education in Westbrook
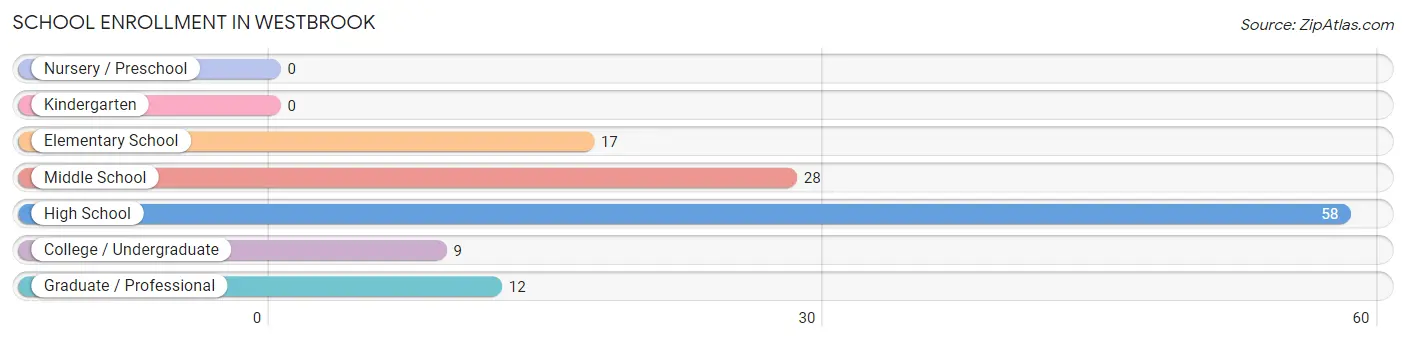
School Enrollment in Westbrook
The most common levels of schooling among the 124 students in Westbrook are high school (58 | 46.8%), middle school (28 | 22.6%), and elementary school (17 | 13.7%).
| School Level | # Students | % Students |
| Nursery / Preschool | 0 | 0.0% |
| Kindergarten | 0 | 0.0% |
| Elementary School | 17 | 13.7% |
| Middle School | 28 | 22.6% |
| High School | 58 | 46.8% |
| College / Undergraduate | 9 | 7.3% |
| Graduate / Professional | 12 | 9.7% |
| Total | 124 | 100.0% |
School Enrollment by Age by Funding Source in Westbrook
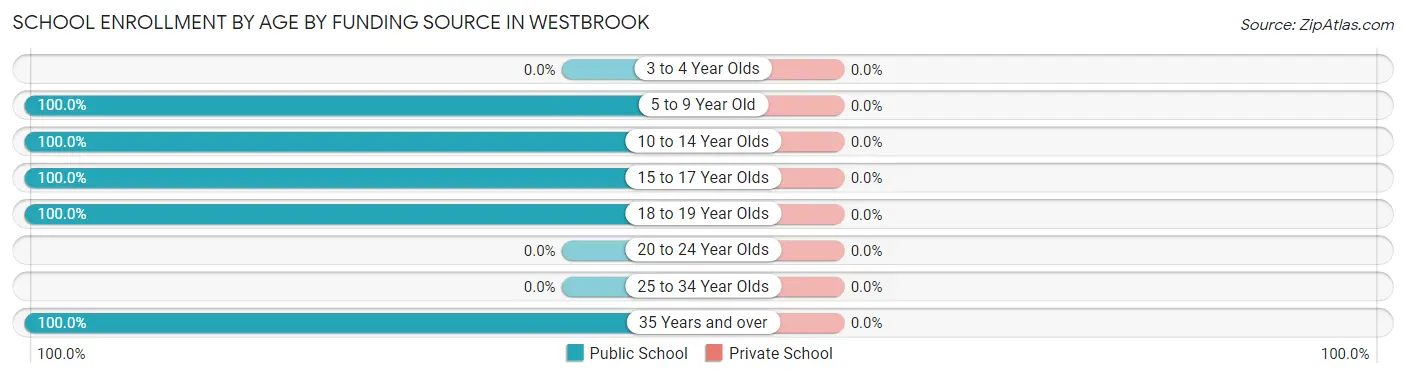
| Age Bracket | Public School | Private School |
| 3 to 4 Year Olds | 0 (0.0%) | 0 (0.0%) |
| 5 to 9 Year Old | 17 (100.0%) | 0 (0.0%) |
| 10 to 14 Year Olds | 36 (100.0%) | 0 (0.0%) |
| 15 to 17 Year Olds | 42 (100.0%) | 0 (0.0%) |
| 18 to 19 Year Olds | 17 (100.0%) | 0 (0.0%) |
| 20 to 24 Year Olds | 0 (0.0%) | 0 (0.0%) |
| 25 to 34 Year Olds | 0 (0.0%) | 0 (0.0%) |
| 35 Years and over | 12 (100.0%) | 0 (0.0%) |
| Total | 124 (100.0%) | 0 (0.0%) |
Educational Attainment by Field of Study in Westbrook
Liberal arts & history (12 | 57.1%), and arts & humanities (9 | 42.9%) are the most common fields of study among 21 individuals in Westbrook who have obtained a bachelor's degree or higher.
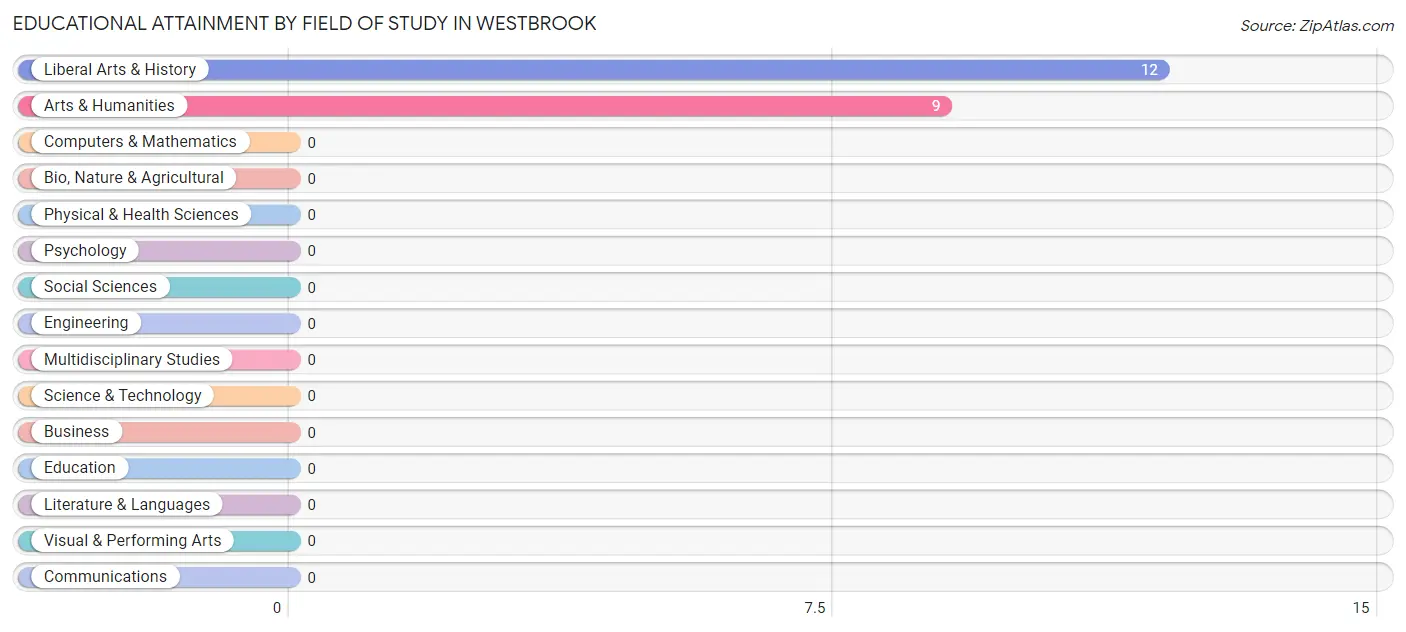
| Field of Study | # Graduates | % Graduates |
| Computers & Mathematics | 0 | 0.0% |
| Bio, Nature & Agricultural | 0 | 0.0% |
| Physical & Health Sciences | 0 | 0.0% |
| Psychology | 0 | 0.0% |
| Social Sciences | 0 | 0.0% |
| Engineering | 0 | 0.0% |
| Multidisciplinary Studies | 0 | 0.0% |
| Science & Technology | 0 | 0.0% |
| Business | 0 | 0.0% |
| Education | 0 | 0.0% |
| Literature & Languages | 0 | 0.0% |
| Liberal Arts & History | 12 | 57.1% |
| Visual & Performing Arts | 0 | 0.0% |
| Communications | 0 | 0.0% |
| Arts & Humanities | 9 | 42.9% |
| Total | 21 | 100.0% |
Transportation & Commute in Westbrook
Vehicle Availability by Sex in Westbrook
The most prevalent vehicle ownership categories in Westbrook are males with 3 vehicles (34, accounting for 44.2%) and females with 3 vehicles (21, making up 82.9%).
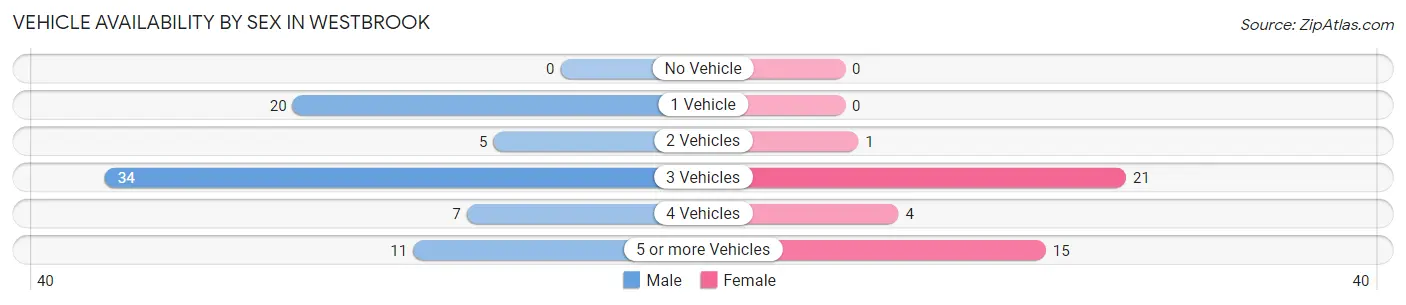
| Vehicles Available | Male | Female |
| No Vehicle | 0 (0.0%) | 0 (0.0%) |
| 1 Vehicle | 20 (26.0%) | 0 (0.0%) |
| 2 Vehicles | 5 (6.5%) | 1 (2.4%) |
| 3 Vehicles | 34 (44.2%) | 21 (51.2%) |
| 4 Vehicles | 7 (9.1%) | 4 (9.8%) |
| 5 or more Vehicles | 11 (14.3%) | 15 (36.6%) |
| Total | 77 (100.0%) | 41 (100.0%) |
Commute Time in Westbrook
The most frequently occuring commute durations in Westbrook are 15 to 19 minutes (26 commuters, 22.0%), 5 to 9 minutes (25 commuters, 21.2%), and 30 to 34 minutes (21 commuters, 17.8%).
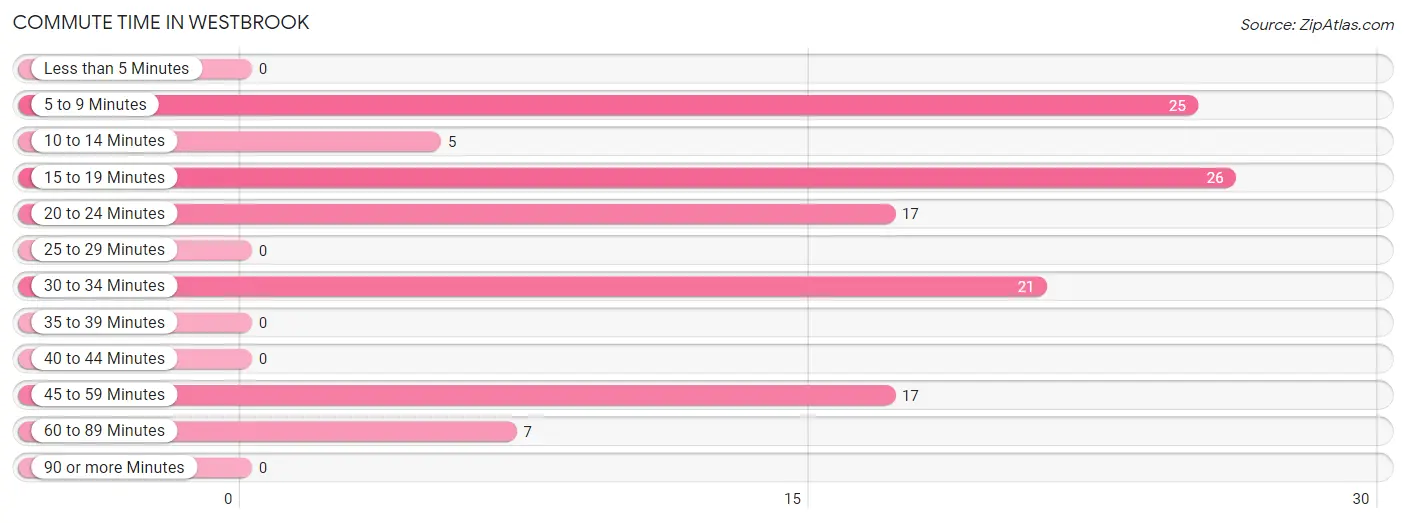
| Commute Time | # Commuters | % Commuters |
| Less than 5 Minutes | 0 | 0.0% |
| 5 to 9 Minutes | 25 | 21.2% |
| 10 to 14 Minutes | 5 | 4.2% |
| 15 to 19 Minutes | 26 | 22.0% |
| 20 to 24 Minutes | 17 | 14.4% |
| 25 to 29 Minutes | 0 | 0.0% |
| 30 to 34 Minutes | 21 | 17.8% |
| 35 to 39 Minutes | 0 | 0.0% |
| 40 to 44 Minutes | 0 | 0.0% |
| 45 to 59 Minutes | 17 | 14.4% |
| 60 to 89 Minutes | 7 | 5.9% |
| 90 or more Minutes | 0 | 0.0% |
Commute Time by Sex in Westbrook
The most common commute times in Westbrook are 5 to 9 minutes (25 commuters, 32.5%) for males and 15 to 19 minutes (21 commuters, 51.2%) for females.
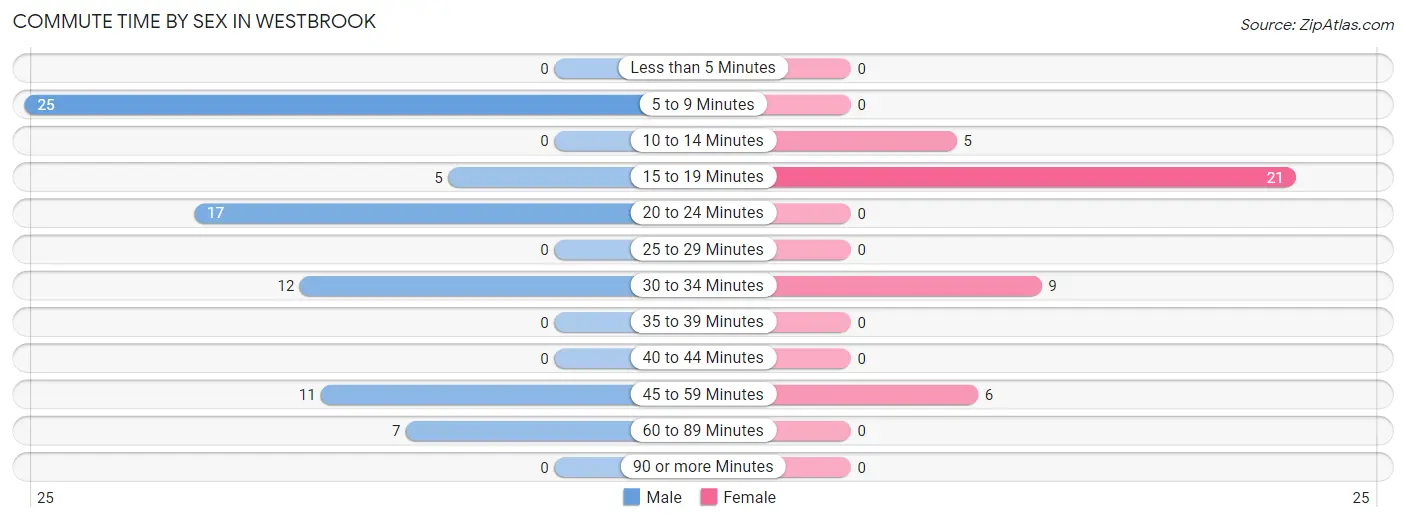
| Commute Time | Male | Female |
| Less than 5 Minutes | 0 (0.0%) | 0 (0.0%) |
| 5 to 9 Minutes | 25 (32.5%) | 0 (0.0%) |
| 10 to 14 Minutes | 0 (0.0%) | 5 (12.2%) |
| 15 to 19 Minutes | 5 (6.5%) | 21 (51.2%) |
| 20 to 24 Minutes | 17 (22.1%) | 0 (0.0%) |
| 25 to 29 Minutes | 0 (0.0%) | 0 (0.0%) |
| 30 to 34 Minutes | 12 (15.6%) | 9 (22.0%) |
| 35 to 39 Minutes | 0 (0.0%) | 0 (0.0%) |
| 40 to 44 Minutes | 0 (0.0%) | 0 (0.0%) |
| 45 to 59 Minutes | 11 (14.3%) | 6 (14.6%) |
| 60 to 89 Minutes | 7 (9.1%) | 0 (0.0%) |
| 90 or more Minutes | 0 (0.0%) | 0 (0.0%) |
Time of Departure to Work by Sex in Westbrook
The most frequent times of departure to work in Westbrook are 5:30 AM to 5:59 AM (23, 29.9%) for males and 10:00 AM to 10:59 AM (13, 31.7%) for females.
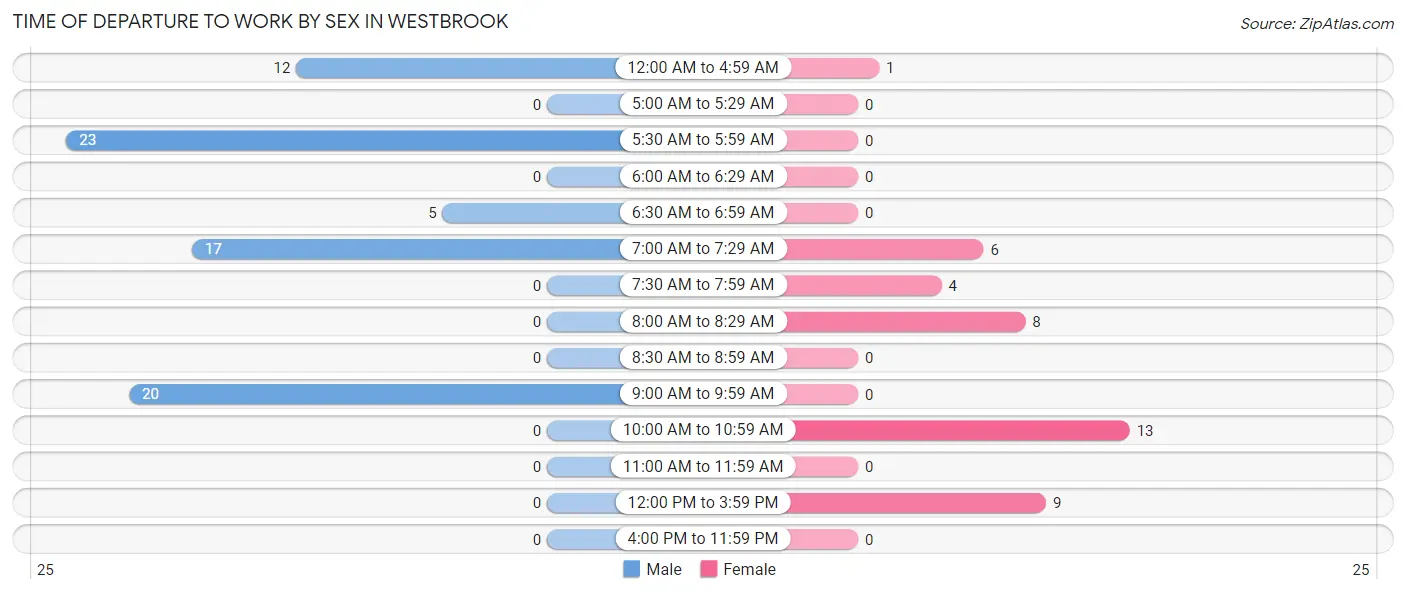
| Time of Departure | Male | Female |
| 12:00 AM to 4:59 AM | 12 (15.6%) | 1 (2.4%) |
| 5:00 AM to 5:29 AM | 0 (0.0%) | 0 (0.0%) |
| 5:30 AM to 5:59 AM | 23 (29.9%) | 0 (0.0%) |
| 6:00 AM to 6:29 AM | 0 (0.0%) | 0 (0.0%) |
| 6:30 AM to 6:59 AM | 5 (6.5%) | 0 (0.0%) |
| 7:00 AM to 7:29 AM | 17 (22.1%) | 6 (14.6%) |
| 7:30 AM to 7:59 AM | 0 (0.0%) | 4 (9.8%) |
| 8:00 AM to 8:29 AM | 0 (0.0%) | 8 (19.5%) |
| 8:30 AM to 8:59 AM | 0 (0.0%) | 0 (0.0%) |
| 9:00 AM to 9:59 AM | 20 (26.0%) | 0 (0.0%) |
| 10:00 AM to 10:59 AM | 0 (0.0%) | 13 (31.7%) |
| 11:00 AM to 11:59 AM | 0 (0.0%) | 0 (0.0%) |
| 12:00 PM to 3:59 PM | 0 (0.0%) | 9 (22.0%) |
| 4:00 PM to 11:59 PM | 0 (0.0%) | 0 (0.0%) |
| Total | 77 (100.0%) | 41 (100.0%) |
Housing Occupancy in Westbrook
Occupancy by Ownership in Westbrook
Of the total 66 dwellings in Westbrook, owner-occupied units account for 61 (92.4%), while renter-occupied units make up 5 (7.6%).
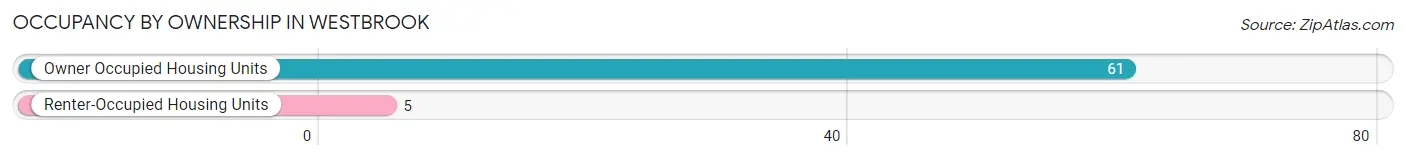
| Occupancy | # Housing Units | % Housing Units |
| Owner Occupied Housing Units | 61 | 92.4% |
| Renter-Occupied Housing Units | 5 | 7.6% |
| Total Occupied Housing Units | 66 | 100.0% |
Occupancy by Household Size in Westbrook
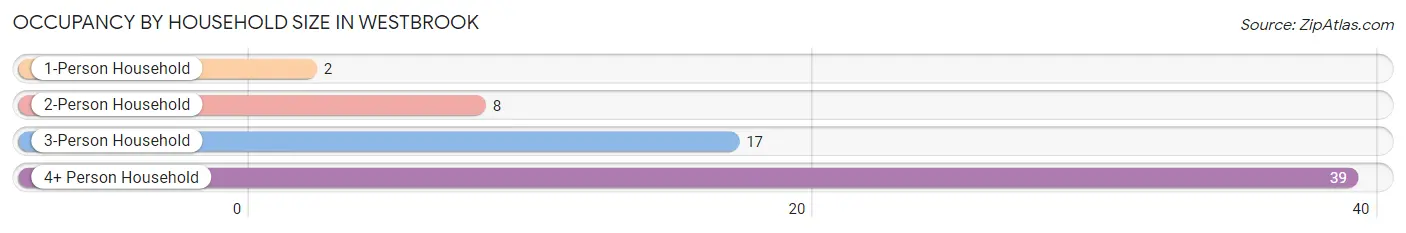
| Household Size | # Housing Units | % Housing Units |
| 1-Person Household | 2 | 3.0% |
| 2-Person Household | 8 | 12.1% |
| 3-Person Household | 17 | 25.8% |
| 4+ Person Household | 39 | 59.1% |
| Total Housing Units | 66 | 100.0% |
Occupancy by Ownership by Household Size in Westbrook
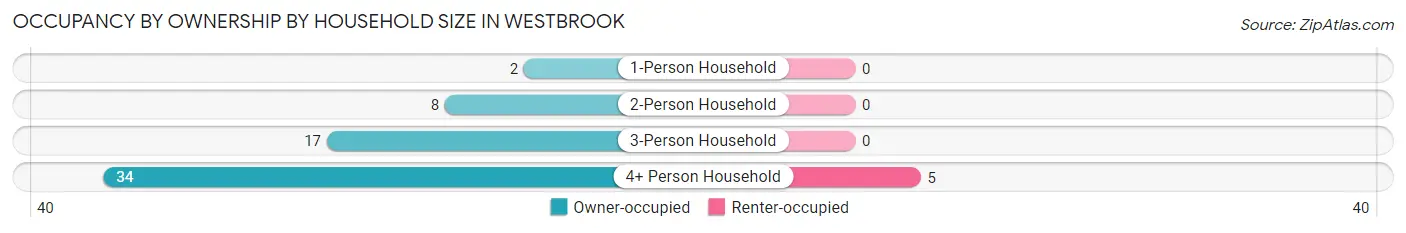
| Household Size | Owner-occupied | Renter-occupied |
| 1-Person Household | 2 (100.0%) | 0 (0.0%) |
| 2-Person Household | 8 (100.0%) | 0 (0.0%) |
| 3-Person Household | 17 (100.0%) | 0 (0.0%) |
| 4+ Person Household | 34 (87.2%) | 5 (12.8%) |
| Total Housing Units | 61 (92.4%) | 5 (7.6%) |
Occupancy by Educational Attainment in Westbrook
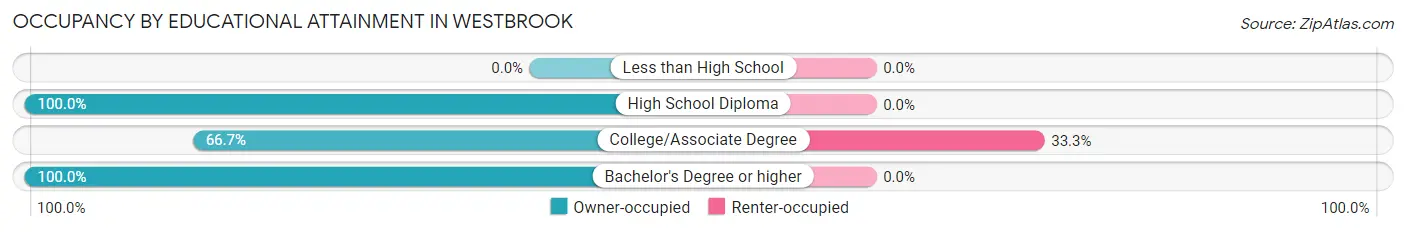
| Household Size | Owner-occupied | Renter-occupied |
| Less than High School | 0 (0.0%) | 0 (0.0%) |
| High School Diploma | 39 (100.0%) | 0 (0.0%) |
| College/Associate Degree | 10 (66.7%) | 5 (33.3%) |
| Bachelor's Degree or higher | 12 (100.0%) | 0 (0.0%) |
Occupancy by Age of Householder in Westbrook
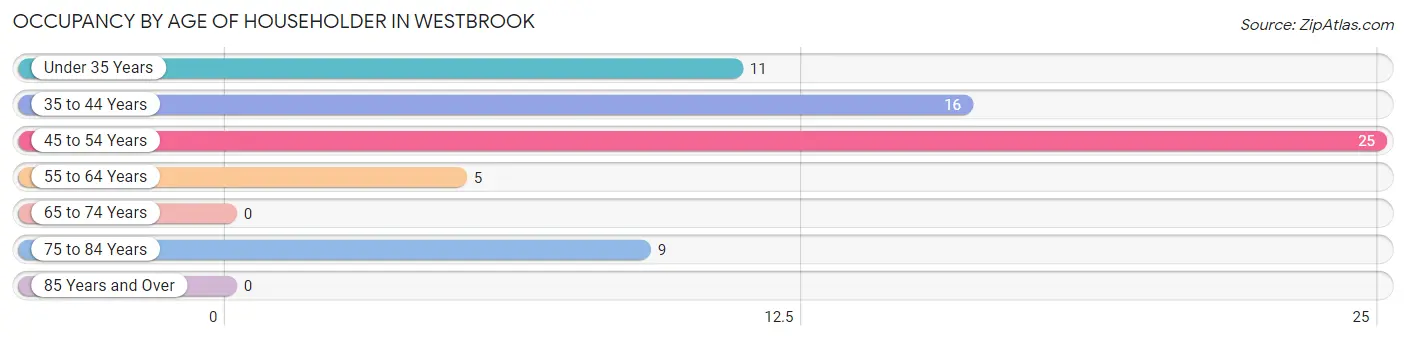
| Age Bracket | # Households | % Households |
| Under 35 Years | 11 | 16.7% |
| 35 to 44 Years | 16 | 24.2% |
| 45 to 54 Years | 25 | 37.9% |
| 55 to 64 Years | 5 | 7.6% |
| 65 to 74 Years | 0 | 0.0% |
| 75 to 84 Years | 9 | 13.6% |
| 85 Years and Over | 0 | 0.0% |
| Total | 66 | 100.0% |
Housing Finances in Westbrook
Median Income by Occupancy in Westbrook
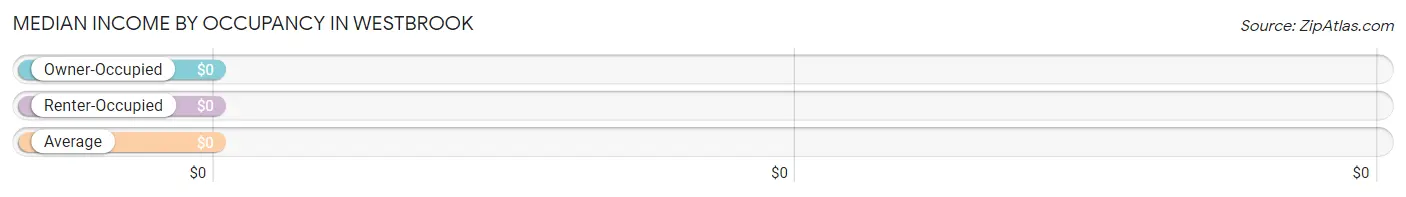
| Occupancy Type | # Households | Median Income |
| Owner-Occupied | 61 (92.4%) | $0 |
| Renter-Occupied | 5 (7.6%) | $0 |
| Average | 66 (100.0%) | $0 |
Occupancy by Householder Income Bracket in Westbrook
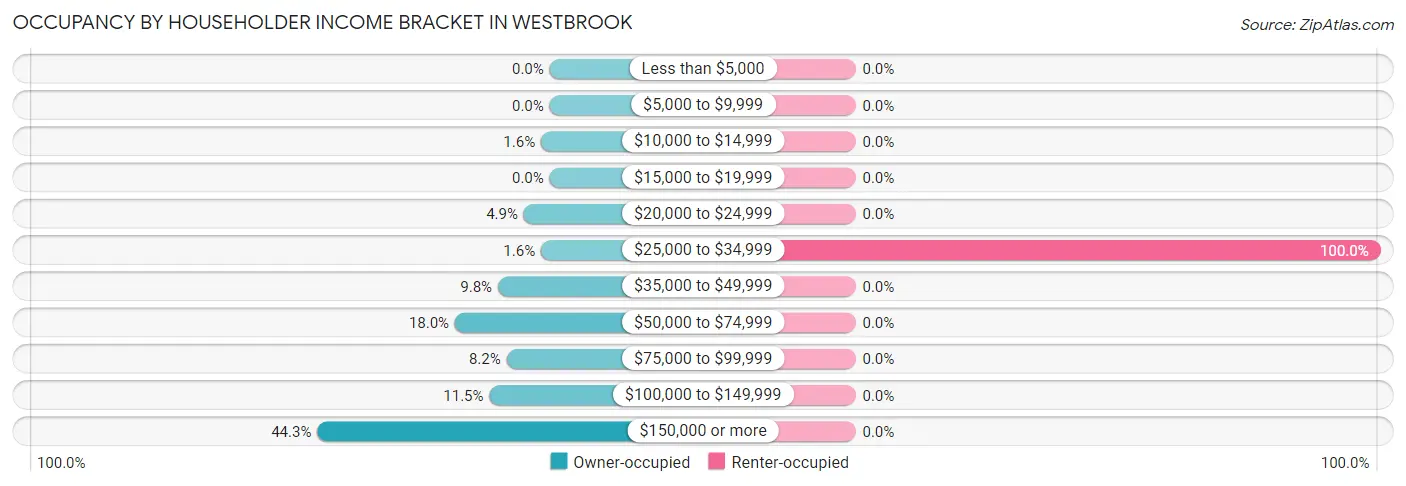
| Income Bracket | Owner-occupied | Renter-occupied |
| Less than $5,000 | 0 (0.0%) | 0 (0.0%) |
| $5,000 to $9,999 | 0 (0.0%) | 0 (0.0%) |
| $10,000 to $14,999 | 1 (1.6%) | 0 (0.0%) |
| $15,000 to $19,999 | 0 (0.0%) | 0 (0.0%) |
| $20,000 to $24,999 | 3 (4.9%) | 0 (0.0%) |
| $25,000 to $34,999 | 1 (1.6%) | 5 (100.0%) |
| $35,000 to $49,999 | 6 (9.8%) | 0 (0.0%) |
| $50,000 to $74,999 | 11 (18.0%) | 0 (0.0%) |
| $75,000 to $99,999 | 5 (8.2%) | 0 (0.0%) |
| $100,000 to $149,999 | 7 (11.5%) | 0 (0.0%) |
| $150,000 or more | 27 (44.3%) | 0 (0.0%) |
| Total | 61 (100.0%) | 5 (100.0%) |
Monthly Housing Cost Tiers in Westbrook
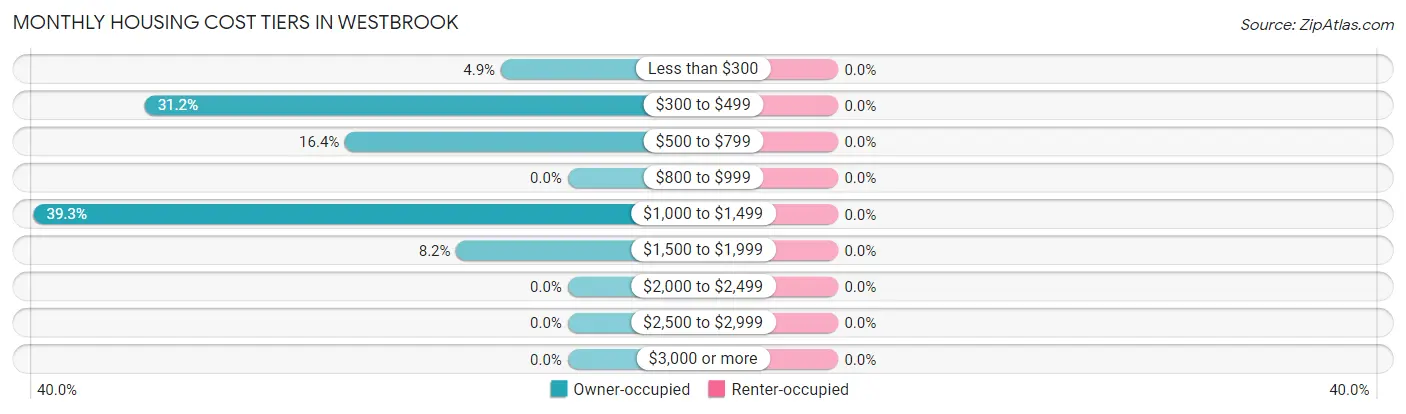
| Monthly Cost | Owner-occupied | Renter-occupied |
| Less than $300 | 3 (4.9%) | 0 (0.0%) |
| $300 to $499 | 19 (31.1%) | 0 (0.0%) |
| $500 to $799 | 10 (16.4%) | 0 (0.0%) |
| $800 to $999 | 0 (0.0%) | 0 (0.0%) |
| $1,000 to $1,499 | 24 (39.3%) | 0 (0.0%) |
| $1,500 to $1,999 | 5 (8.2%) | 0 (0.0%) |
| $2,000 to $2,499 | 0 (0.0%) | 0 (0.0%) |
| $2,500 to $2,999 | 0 (0.0%) | 0 (0.0%) |
| $3,000 or more | 0 (0.0%) | 0 (0.0%) |
| Total | 61 (100.0%) | 5 (100.0%) |
Physical Housing Characteristics in Westbrook
Housing Structures in Westbrook
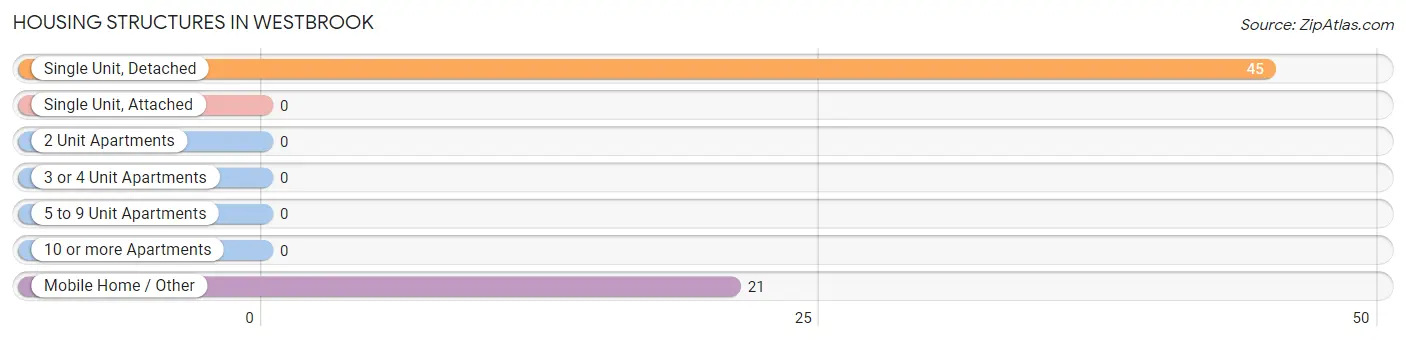
| Structure Type | # Housing Units | % Housing Units |
| Single Unit, Detached | 45 | 68.2% |
| Single Unit, Attached | 0 | 0.0% |
| 2 Unit Apartments | 0 | 0.0% |
| 3 or 4 Unit Apartments | 0 | 0.0% |
| 5 to 9 Unit Apartments | 0 | 0.0% |
| 10 or more Apartments | 0 | 0.0% |
| Mobile Home / Other | 21 | 31.8% |
| Total | 66 | 100.0% |
Housing Structures by Occupancy in Westbrook
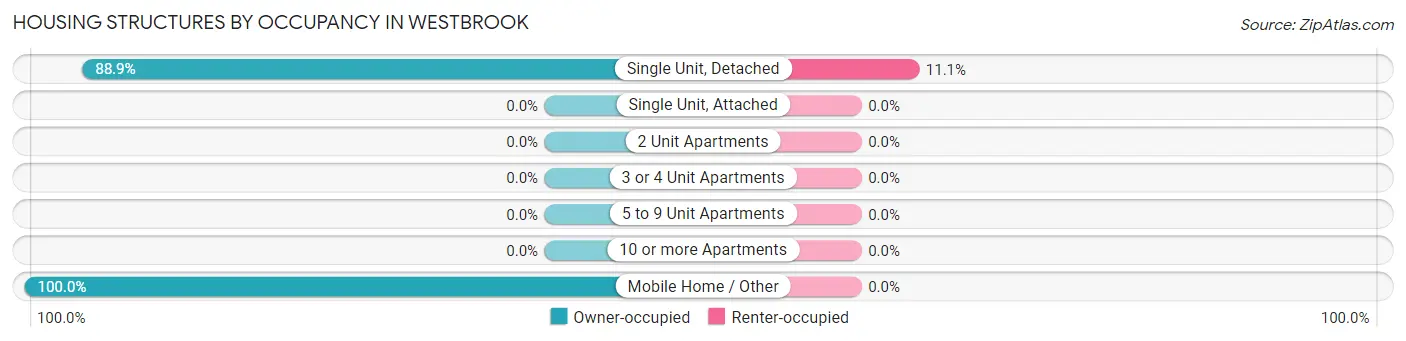
| Structure Type | Owner-occupied | Renter-occupied |
| Single Unit, Detached | 40 (88.9%) | 5 (11.1%) |
| Single Unit, Attached | 0 (0.0%) | 0 (0.0%) |
| 2 Unit Apartments | 0 (0.0%) | 0 (0.0%) |
| 3 or 4 Unit Apartments | 0 (0.0%) | 0 (0.0%) |
| 5 to 9 Unit Apartments | 0 (0.0%) | 0 (0.0%) |
| 10 or more Apartments | 0 (0.0%) | 0 (0.0%) |
| Mobile Home / Other | 21 (100.0%) | 0 (0.0%) |
| Total | 61 (92.4%) | 5 (7.6%) |
Housing Structures by Number of Rooms in Westbrook
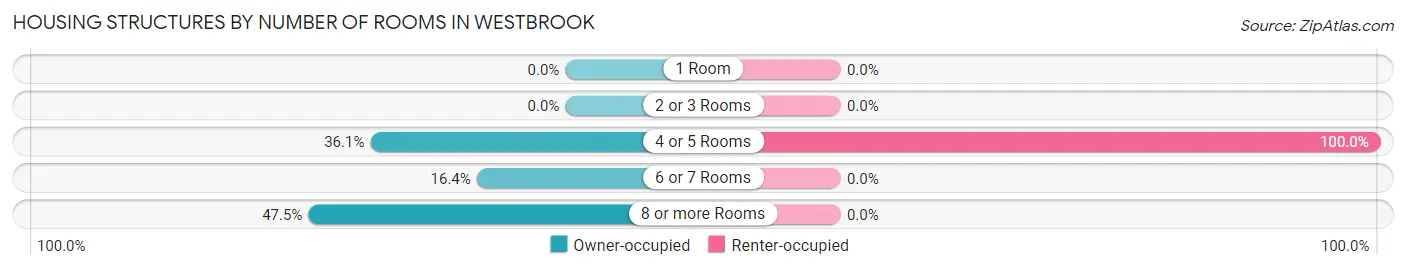
| Number of Rooms | Owner-occupied | Renter-occupied |
| 1 Room | 0 (0.0%) | 0 (0.0%) |
| 2 or 3 Rooms | 0 (0.0%) | 0 (0.0%) |
| 4 or 5 Rooms | 22 (36.1%) | 5 (100.0%) |
| 6 or 7 Rooms | 10 (16.4%) | 0 (0.0%) |
| 8 or more Rooms | 29 (47.5%) | 0 (0.0%) |
| Total | 61 (100.0%) | 5 (100.0%) |
Housing Structure by Heating Type in Westbrook
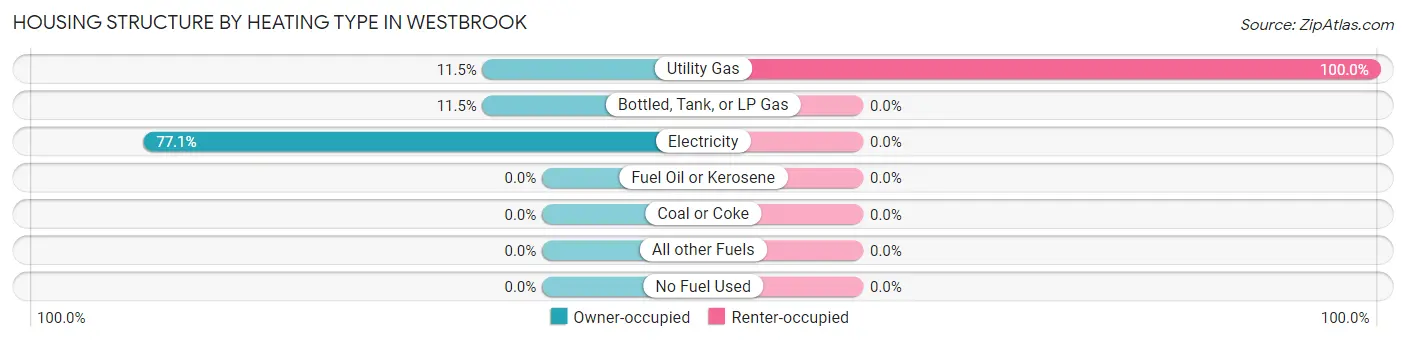
| Heating Type | Owner-occupied | Renter-occupied |
| Utility Gas | 7 (11.5%) | 5 (100.0%) |
| Bottled, Tank, or LP Gas | 7 (11.5%) | 0 (0.0%) |
| Electricity | 47 (77.0%) | 0 (0.0%) |
| Fuel Oil or Kerosene | 0 (0.0%) | 0 (0.0%) |
| Coal or Coke | 0 (0.0%) | 0 (0.0%) |
| All other Fuels | 0 (0.0%) | 0 (0.0%) |
| No Fuel Used | 0 (0.0%) | 0 (0.0%) |
| Total | 61 (100.0%) | 5 (100.0%) |
Household Vehicle Usage in Westbrook
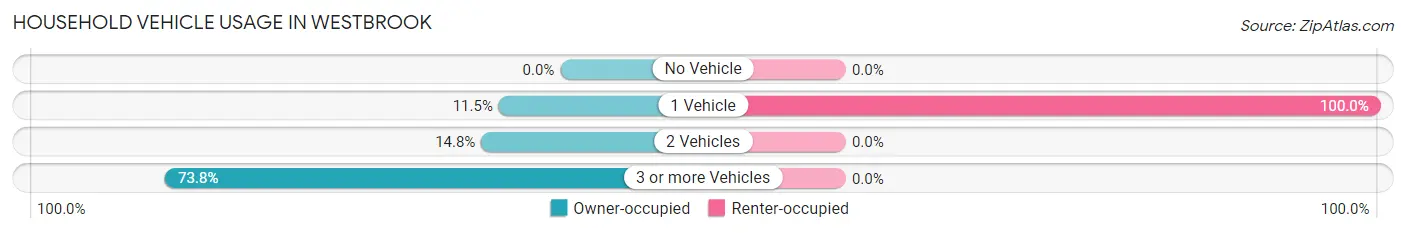
| Vehicles per Household | Owner-occupied | Renter-occupied |
| No Vehicle | 0 (0.0%) | 0 (0.0%) |
| 1 Vehicle | 7 (11.5%) | 5 (100.0%) |
| 2 Vehicles | 9 (14.7%) | 0 (0.0%) |
| 3 or more Vehicles | 45 (73.8%) | 0 (0.0%) |
| Total | 61 (100.0%) | 5 (100.0%) |
Real Estate & Mortgages in Westbrook
Real Estate and Mortgage Overview in Westbrook
| Characteristic | Without Mortgage | With Mortgage |
| Housing Units | 43 | 18 |
| Median Property Value | $85,000 | $131,300 |
| Median Household Income | $115,179 | $12 |
| Monthly Housing Costs | $493 | $0 |
| Real Estate Taxes | - | - |
Property Value by Mortgage Status in Westbrook
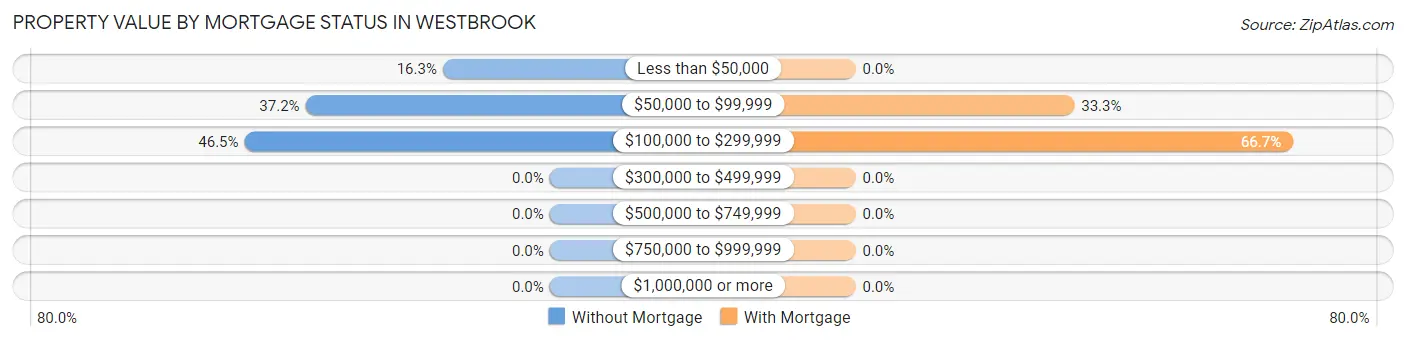
| Property Value | Without Mortgage | With Mortgage |
| Less than $50,000 | 7 (16.3%) | 0 (0.0%) |
| $50,000 to $99,999 | 16 (37.2%) | 6 (33.3%) |
| $100,000 to $299,999 | 20 (46.5%) | 12 (66.7%) |
| $300,000 to $499,999 | 0 (0.0%) | 0 (0.0%) |
| $500,000 to $749,999 | 0 (0.0%) | 0 (0.0%) |
| $750,000 to $999,999 | 0 (0.0%) | 0 (0.0%) |
| $1,000,000 or more | 0 (0.0%) | 0 (0.0%) |
| Total | 43 (100.0%) | 18 (100.0%) |
Household Income by Mortgage Status in Westbrook
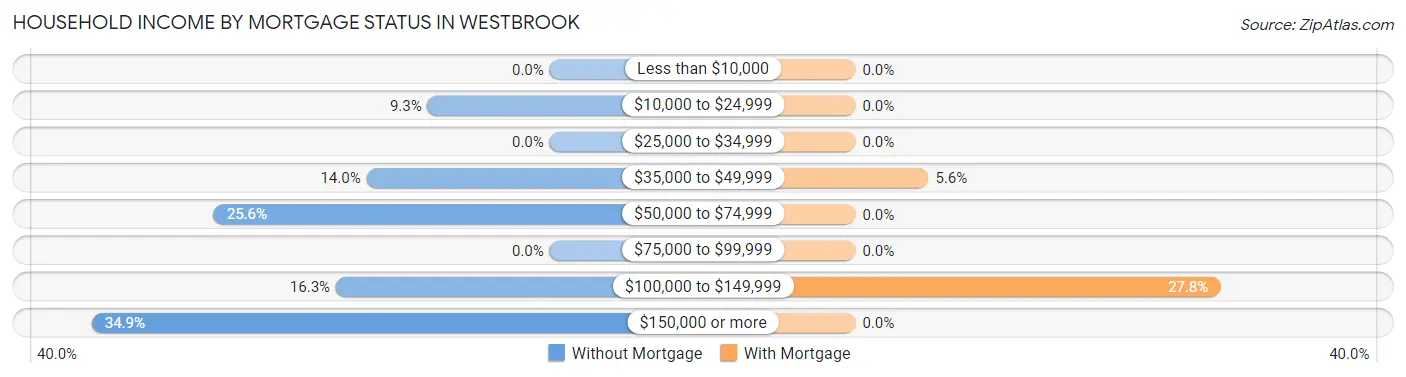
| Household Income | Without Mortgage | With Mortgage |
| Less than $10,000 | 0 (0.0%) | 0 (0.0%) |
| $10,000 to $24,999 | 4 (9.3%) | 0 (0.0%) |
| $25,000 to $34,999 | 0 (0.0%) | 0 (0.0%) |
| $35,000 to $49,999 | 6 (14.0%) | 1 (5.6%) |
| $50,000 to $74,999 | 11 (25.6%) | 0 (0.0%) |
| $75,000 to $99,999 | 0 (0.0%) | 0 (0.0%) |
| $100,000 to $149,999 | 7 (16.3%) | 5 (27.8%) |
| $150,000 or more | 15 (34.9%) | 0 (0.0%) |
| Total | 43 (100.0%) | 18 (100.0%) |
Property Value to Household Income Ratio in Westbrook
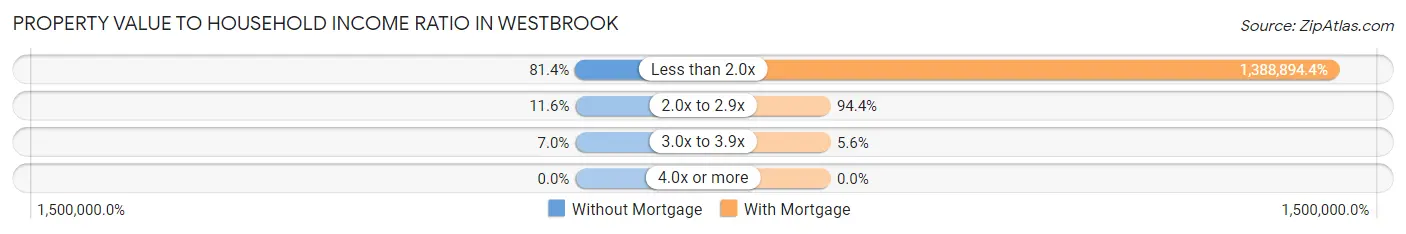
| Value-to-Income Ratio | Without Mortgage | With Mortgage |
| Less than 2.0x | 35 (81.4%) | 250,001 (1,388,894.4%) |
| 2.0x to 2.9x | 5 (11.6%) | 17 (94.4%) |
| 3.0x to 3.9x | 3 (7.0%) | 1 (5.6%) |
| 4.0x or more | 0 (0.0%) | 0 (0.0%) |
| Total | 43 (100.0%) | 18 (100.0%) |
Real Estate Taxes by Mortgage Status in Westbrook
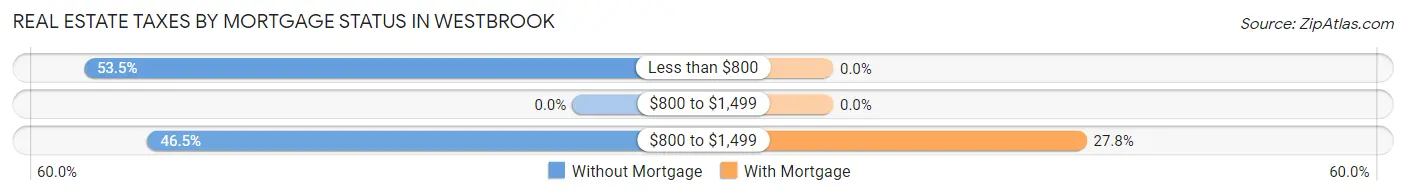
| Property Taxes | Without Mortgage | With Mortgage |
| Less than $800 | 23 (53.5%) | 0 (0.0%) |
| $800 to $1,499 | 0 (0.0%) | 0 (0.0%) |
| $800 to $1,499 | 20 (46.5%) | 5 (27.8%) |
| Total | 43 (100.0%) | 18 (100.0%) |
Health & Disability in Westbrook
Health Insurance Coverage by Age in Westbrook
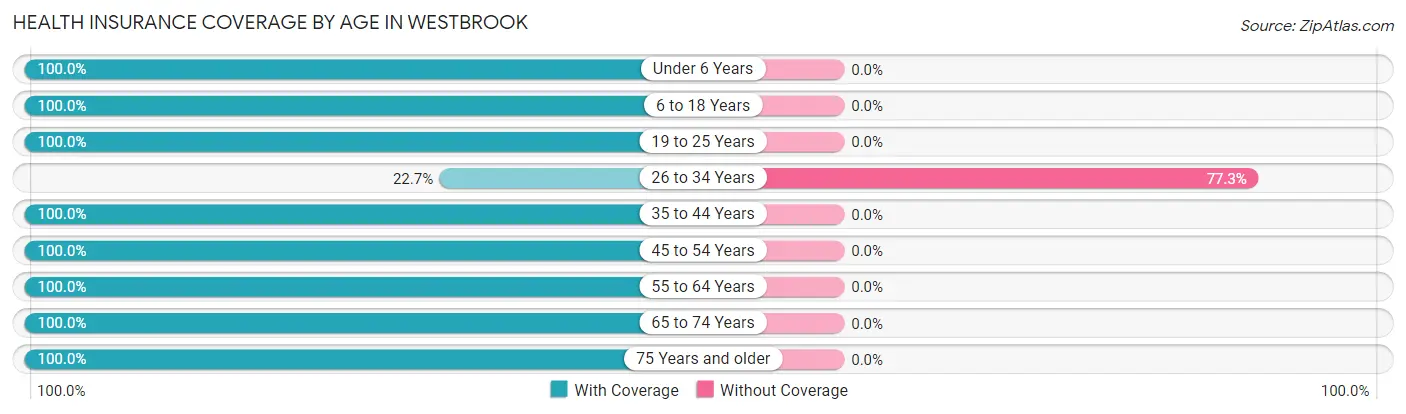
| Age Bracket | With Coverage | Without Coverage |
| Under 6 Years | 5 (100.0%) | 0 (0.0%) |
| 6 to 18 Years | 103 (100.0%) | 0 (0.0%) |
| 19 to 25 Years | 21 (100.0%) | 0 (0.0%) |
| 26 to 34 Years | 5 (22.7%) | 17 (77.3%) |
| 35 to 44 Years | 51 (100.0%) | 0 (0.0%) |
| 45 to 54 Years | 75 (100.0%) | 0 (0.0%) |
| 55 to 64 Years | 5 (100.0%) | 0 (0.0%) |
| 65 to 74 Years | 10 (100.0%) | 0 (0.0%) |
| 75 Years and older | 10 (100.0%) | 0 (0.0%) |
| Total | 285 (94.4%) | 17 (5.6%) |
Health Insurance Coverage by Citizenship Status in Westbrook
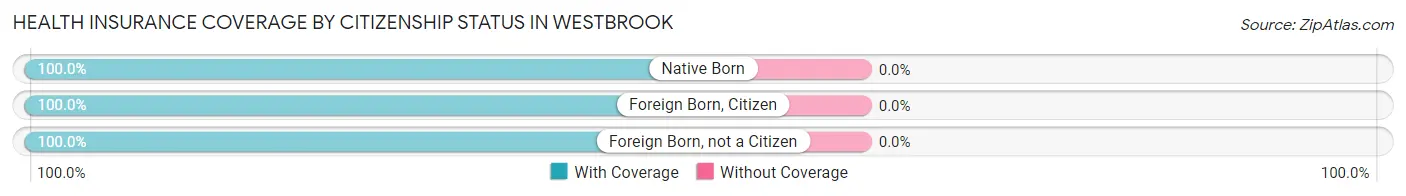
| Citizenship Status | With Coverage | Without Coverage |
| Native Born | 5 (100.0%) | 0 (0.0%) |
| Foreign Born, Citizen | 103 (100.0%) | 0 (0.0%) |
| Foreign Born, not a Citizen | 21 (100.0%) | 0 (0.0%) |
Health Insurance Coverage by Household Income in Westbrook
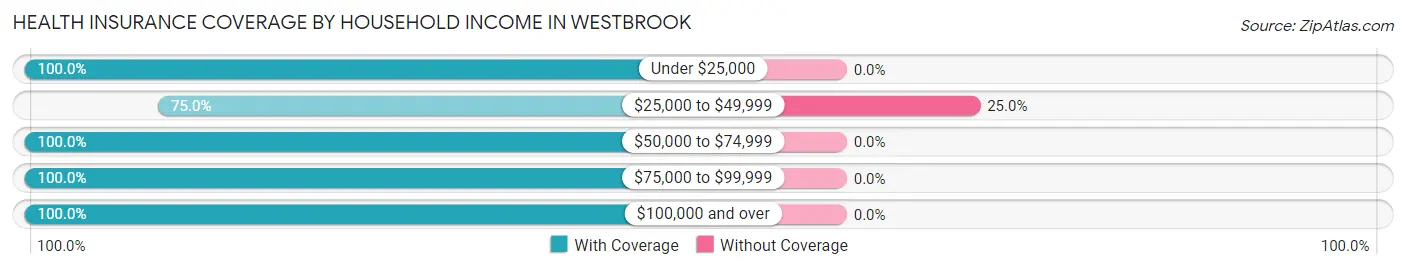
| Household Income | With Coverage | Without Coverage |
| Under $25,000 | 5 (100.0%) | 0 (0.0%) |
| $25,000 to $49,999 | 51 (75.0%) | 17 (25.0%) |
| $50,000 to $74,999 | 74 (100.0%) | 0 (0.0%) |
| $75,000 to $99,999 | 11 (100.0%) | 0 (0.0%) |
| $100,000 and over | 144 (100.0%) | 0 (0.0%) |
Public vs Private Health Insurance Coverage by Age in Westbrook
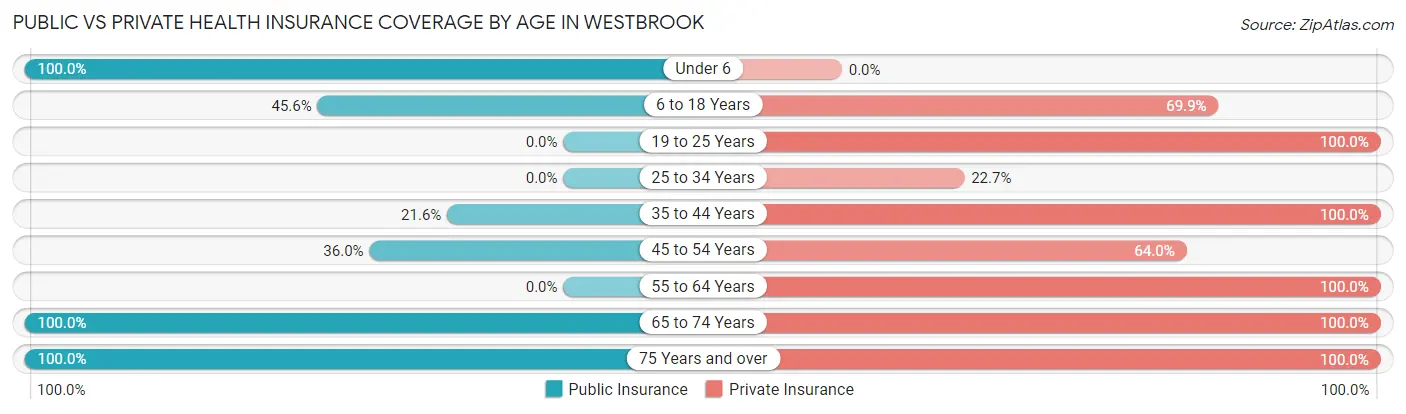
| Age Bracket | Public Insurance | Private Insurance |
| Under 6 | 5 (100.0%) | 0 (0.0%) |
| 6 to 18 Years | 47 (45.6%) | 72 (69.9%) |
| 19 to 25 Years | 0 (0.0%) | 21 (100.0%) |
| 25 to 34 Years | 0 (0.0%) | 5 (22.7%) |
| 35 to 44 Years | 11 (21.6%) | 51 (100.0%) |
| 45 to 54 Years | 27 (36.0%) | 48 (64.0%) |
| 55 to 64 Years | 0 (0.0%) | 5 (100.0%) |
| 65 to 74 Years | 10 (100.0%) | 10 (100.0%) |
| 75 Years and over | 10 (100.0%) | 10 (100.0%) |
| Total | 110 (36.4%) | 222 (73.5%) |
Disability Status by Sex by Age in Westbrook
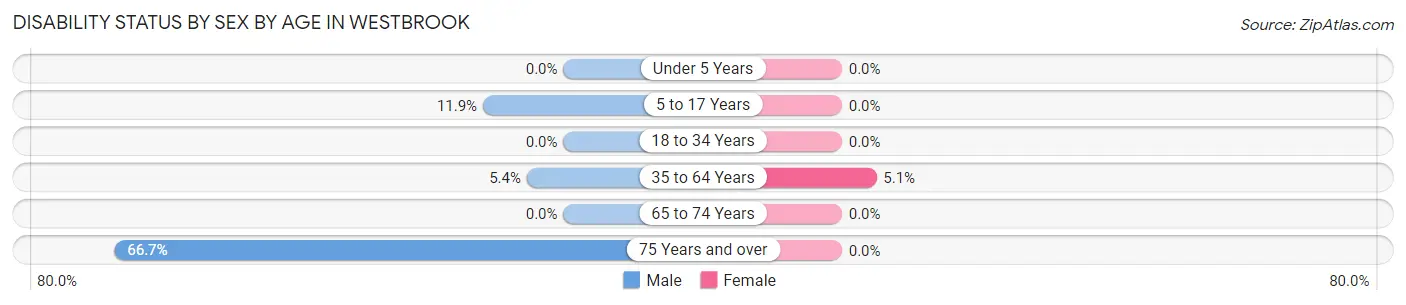
| Age Bracket | Male | Female |
| Under 5 Years | 0 (0.0%) | 0 (0.0%) |
| 5 to 17 Years | 8 (11.9%) | 0 (0.0%) |
| 18 to 34 Years | 0 (0.0%) | 0 (0.0%) |
| 35 to 64 Years | 5 (5.4%) | 2 (5.1%) |
| 65 to 74 Years | 0 (0.0%) | 0 (0.0%) |
| 75 Years and over | 6 (66.7%) | 0 (0.0%) |
Disability Class by Sex by Age in Westbrook
Disability Class: Hearing Difficulty

| Age Bracket | Male | Female |
| Under 5 Years | 0 (0.0%) | 0 (0.0%) |
| 5 to 17 Years | 0 (0.0%) | 0 (0.0%) |
| 18 to 34 Years | 0 (0.0%) | 0 (0.0%) |
| 35 to 64 Years | 0 (0.0%) | 1 (2.6%) |
| 65 to 74 Years | 0 (0.0%) | 0 (0.0%) |
| 75 Years and over | 6 (66.7%) | 0 (0.0%) |
Disability Class: Vision Difficulty
| Age Bracket | Male | Female |
| Under 5 Years | 0 (0.0%) | 0 (0.0%) |
| 5 to 17 Years | 0 (0.0%) | 0 (0.0%) |
| 18 to 34 Years | 0 (0.0%) | 0 (0.0%) |
| 35 to 64 Years | 0 (0.0%) | 0 (0.0%) |
| 65 to 74 Years | 0 (0.0%) | 0 (0.0%) |
| 75 Years and over | 0 (0.0%) | 0 (0.0%) |
Disability Class: Cognitive Difficulty
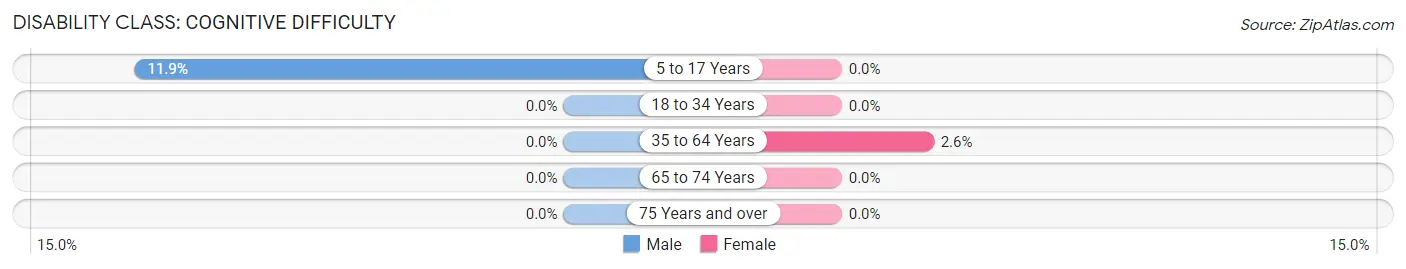
| Age Bracket | Male | Female |
| 5 to 17 Years | 8 (11.9%) | 0 (0.0%) |
| 18 to 34 Years | 0 (0.0%) | 0 (0.0%) |
| 35 to 64 Years | 0 (0.0%) | 1 (2.6%) |
| 65 to 74 Years | 0 (0.0%) | 0 (0.0%) |
| 75 Years and over | 0 (0.0%) | 0 (0.0%) |
Disability Class: Ambulatory Difficulty
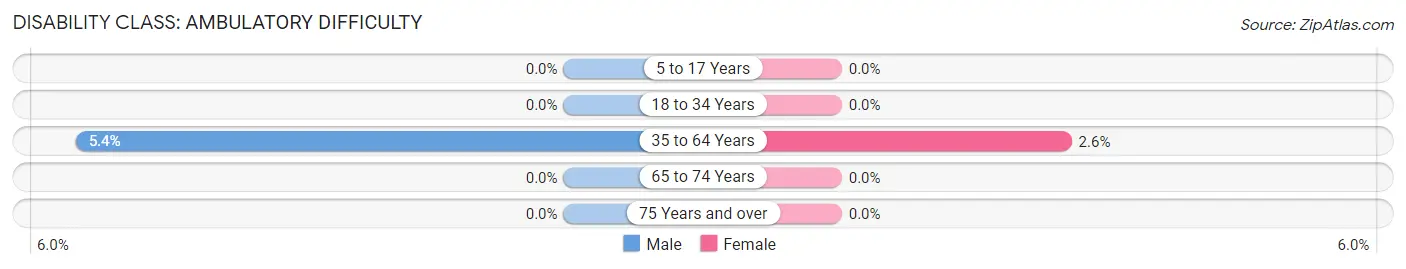
| Age Bracket | Male | Female |
| 5 to 17 Years | 0 (0.0%) | 0 (0.0%) |
| 18 to 34 Years | 0 (0.0%) | 0 (0.0%) |
| 35 to 64 Years | 5 (5.4%) | 1 (2.6%) |
| 65 to 74 Years | 0 (0.0%) | 0 (0.0%) |
| 75 Years and over | 0 (0.0%) | 0 (0.0%) |
Disability Class: Self-Care Difficulty
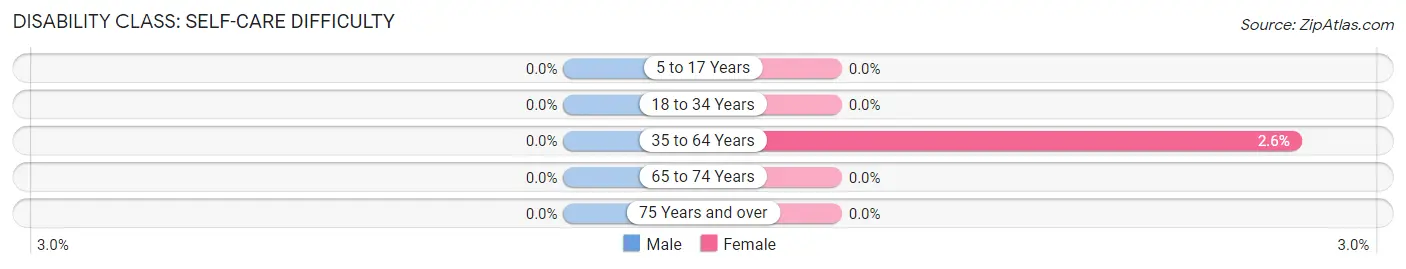
| Age Bracket | Male | Female |
| 5 to 17 Years | 0 (0.0%) | 0 (0.0%) |
| 18 to 34 Years | 0 (0.0%) | 0 (0.0%) |
| 35 to 64 Years | 0 (0.0%) | 1 (2.6%) |
| 65 to 74 Years | 0 (0.0%) | 0 (0.0%) |
| 75 Years and over | 0 (0.0%) | 0 (0.0%) |
Technology Access in Westbrook
Computing Device Access in Westbrook
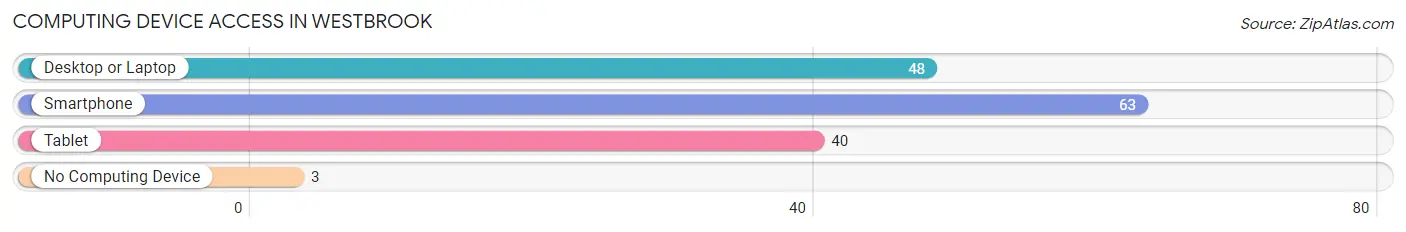
| Device Type | # Households | % Households |
| Desktop or Laptop | 48 | 72.7% |
| Smartphone | 63 | 95.5% |
| Tablet | 40 | 60.6% |
| No Computing Device | 3 | 4.5% |
| Total | 66 | 100.0% |
Internet Access in Westbrook
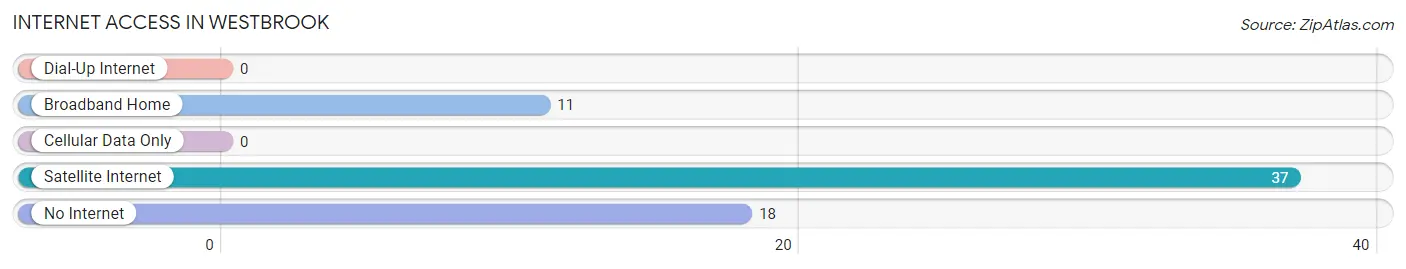
| Internet Type | # Households | % Households |
| Dial-Up Internet | 0 | 0.0% |
| Broadband Home | 11 | 16.7% |
| Cellular Data Only | 0 | 0.0% |
| Satellite Internet | 37 | 56.1% |
| No Internet | 18 | 27.3% |
| Total | 66 | 100.0% |
Westbrook Summary
Westbrook, Texas is a small town located in Mitchell County, Texas. It is situated in the rolling hills of the Texas Hill Country, about 25 miles northwest of San Angelo. The town was founded in 1881 and has a population of approximately 500 people.
History
Westbrook was founded in 1881 by a group of settlers from the nearby town of Paint Rock. The settlers were looking for a place to settle and start a new life. The town was named after a local rancher, William Westbrook, who owned a large ranch in the area. The town was officially incorporated in 1883.
In the early days, the town was a small farming and ranching community. The main crops grown were cotton, corn, and wheat. The town also had a few small businesses, such as a general store, a blacksmith shop, and a saloon.
In the late 1800s, the town began to grow and prosper. The railroad came to town in 1891, bringing with it new opportunities for growth. The town also had a post office, a bank, and a hotel.
In the early 1900s, the town continued to grow and prosper. The population increased to over 500 people by 1910. The town had several churches, a school, and a newspaper.
In the 1920s, the town began to decline. The Great Depression hit the town hard and many of the businesses closed. The population decreased to around 300 people by 1940.
In the 1950s, the town began to recover. The population increased to over 500 people by 1960. The town had several businesses, including a grocery store, a hardware store, and a cafe.
Geography
Westbrook is located in the rolling hills of the Texas Hill Country. The town is situated on the banks of the Colorado River, about 25 miles northwest of San Angelo. The town is surrounded by farmland and ranches.
The climate in Westbrook is semi-arid, with hot summers and mild winters. The average temperature in the summer is around 90 degrees Fahrenheit, and the average temperature in the winter is around 50 degrees Fahrenheit.
Economy
The economy of Westbrook is largely based on agriculture and ranching. The town is home to several farms and ranches, which produce cotton, corn, wheat, and other crops. The town also has a few small businesses, such as a grocery store, a hardware store, and a cafe.
Demographics
As of the 2010 census, the population of Westbrook was 514 people. The racial makeup of the town was 94.3% White, 0.4% African American, 0.4% Native American, 0.2% Asian, 0.2% Pacific Islander, 3.3% from other races, and 1.4% from two or more races. Hispanic or Latino of any race were 6.3% of the population.
The median income for a household in Westbrook was $30,000, and the median income for a family was $35,000. The per capita income for the town was $14,000. About 16.7% of the population was below the poverty line.
Common Questions
What is Per Capita Income in Westbrook?
Per Capita income in Westbrook is $33,215.
What is Income or Wage Gap in Westbrook?
Income or Wage Gap in Westbrook is 74.1%.
Women in Westbrook earn 25.9 cents for every dollar earned by a man.
What is Inequality or Gini Index in Westbrook?
Inequality or Gini Index in Westbrook is 0.37.
What is the Total Population of Westbrook?
Total Population of Westbrook is 302.
What is the Total Male Population of Westbrook?
Total Male Population of Westbrook is 179.
What is the Total Female Population of Westbrook?
Total Female Population of Westbrook is 123.
What is the Ratio of Males per 100 Females in Westbrook?
There are 145.53 Males per 100 Females in Westbrook.
What is the Ratio of Females per 100 Males in Westbrook?
There are 68.72 Females per 100 Males in Westbrook.
What is the Median Population Age in Westbrook?
Median Population Age in Westbrook is 35.0 Years.
What is the Average Family Size in Westbrook
Average Family Size in Westbrook is 4.7 People.
What is the Average Household Size in Westbrook
Average Household Size in Westbrook is 4.6 People.
How Large is the Labor Force in Westbrook?
There are 118 People in the Labor Forcein in Westbrook.
What is the Percentage of People in the Labor Force in Westbrook?
48.4% of People are in the Labor Force in Westbrook.