West, TX Map & Demographics
West Map
West Overview
$23,771
PER CAPITA INCOME
$63,750
AVG FAMILY INCOME
$51,875
AVG HOUSEHOLD INCOME
19.2%
WAGE / INCOME GAP [ % ]
80.8¢/ $1
WAGE / INCOME GAP [ $ ]
0.43
INEQUALITY / GINI INDEX
2,577
TOTAL POPULATION
1,047
MALE POPULATION
1,530
FEMALE POPULATION
68.43
MALES / 100 FEMALES
146.13
FEMALES / 100 MALES
34.3
MEDIAN AGE
3.5
AVG FAMILY SIZE
2.7
AVG HOUSEHOLD SIZE
1,082
LABOR FORCE [ PEOPLE ]
56.0%
PERCENT IN LABOR FORCE
2.1%
UNEMPLOYMENT RATE
West Zip Codes
West Area Codes
Income in West
Income Overview in West
Per Capita Income in West is $23,771, while median incomes of families and households are $63,750 and $51,875 respectively.
| Characteristic | Number | Measure |
| Per Capita Income | 2,577 | $23,771 |
| Median Family Income | 540 | $63,750 |
| Mean Family Income | 540 | $81,962 |
| Median Household Income | 898 | $51,875 |
| Mean Household Income | 898 | $64,795 |
| Income Deficit | 540 | $0 |
| Wage / Income Gap (%) | 2,577 | 19.22% |
| Wage / Income Gap ($) | 2,577 | 80.78¢ per $1 |
| Gini / Inequality Index | 2,577 | 0.43 |
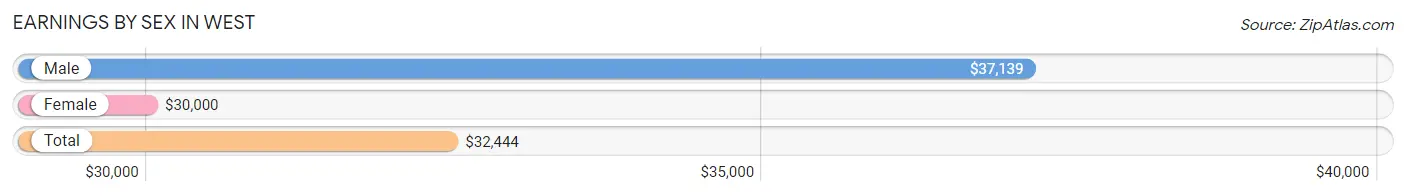
Earnings by Sex in West
Average Earnings in West are $32,444, $37,139 for men and $30,000 for women, a difference of 19.2%.
| Sex | Number | Average Earnings |
| Male | 523 (47.3%) | $37,139 |
| Female | 582 (52.7%) | $30,000 |
| Total | 1,105 (100.0%) | $32,444 |
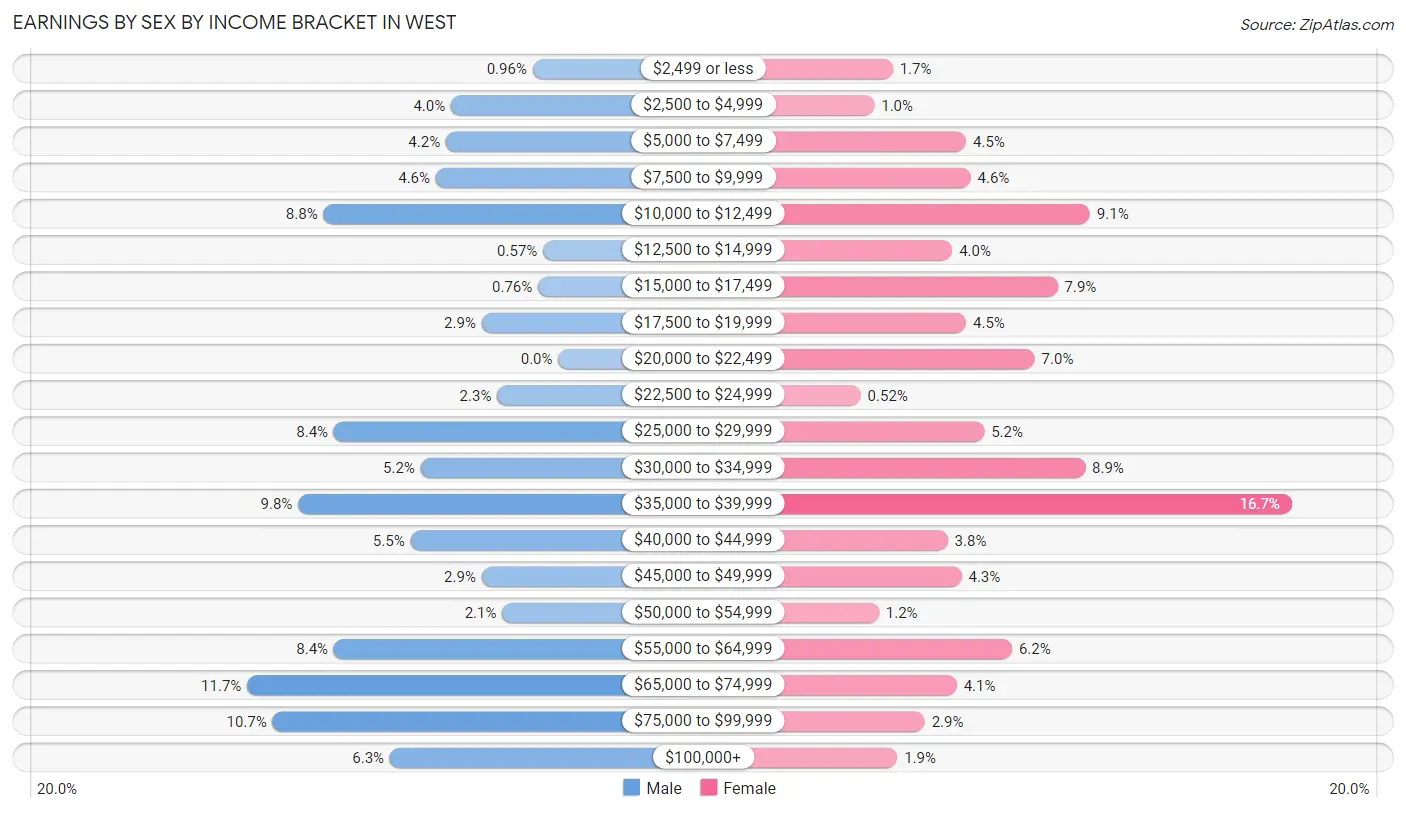
Earnings by Sex by Income Bracket in West
The most common earnings brackets in West are $65,000 to $74,999 for men (61 | 11.7%) and $35,000 to $39,999 for women (97 | 16.7%).
| Income | Male | Female |
| $2,499 or less | 5 (1.0%) | 10 (1.7%) |
| $2,500 to $4,999 | 21 (4.0%) | 6 (1.0%) |
| $5,000 to $7,499 | 22 (4.2%) | 26 (4.5%) |
| $7,500 to $9,999 | 24 (4.6%) | 27 (4.6%) |
| $10,000 to $12,499 | 46 (8.8%) | 53 (9.1%) |
| $12,500 to $14,999 | 3 (0.6%) | 23 (4.0%) |
| $15,000 to $17,499 | 4 (0.8%) | 46 (7.9%) |
| $17,500 to $19,999 | 15 (2.9%) | 26 (4.5%) |
| $20,000 to $22,499 | 0 (0.0%) | 41 (7.0%) |
| $22,500 to $24,999 | 12 (2.3%) | 3 (0.5%) |
| $25,000 to $29,999 | 44 (8.4%) | 30 (5.1%) |
| $30,000 to $34,999 | 27 (5.2%) | 52 (8.9%) |
| $35,000 to $39,999 | 51 (9.8%) | 97 (16.7%) |
| $40,000 to $44,999 | 29 (5.5%) | 22 (3.8%) |
| $45,000 to $49,999 | 15 (2.9%) | 25 (4.3%) |
| $50,000 to $54,999 | 11 (2.1%) | 7 (1.2%) |
| $55,000 to $64,999 | 44 (8.4%) | 36 (6.2%) |
| $65,000 to $74,999 | 61 (11.7%) | 24 (4.1%) |
| $75,000 to $99,999 | 56 (10.7%) | 17 (2.9%) |
| $100,000+ | 33 (6.3%) | 11 (1.9%) |
| Total | 523 (100.0%) | 582 (100.0%) |
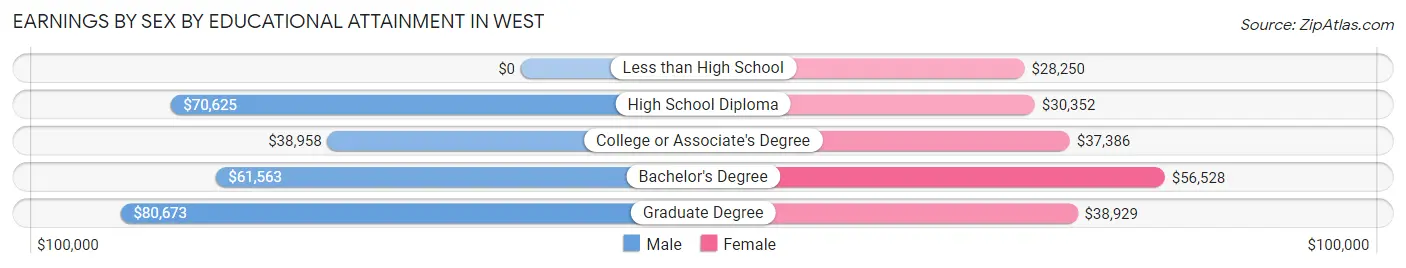
Earnings by Sex by Educational Attainment in West
Average earnings in West are $43,636 for men and $37,500 for women, a difference of 14.1%. Men with an educational attainment of graduate degree enjoy the highest average annual earnings of $80,673, while those with college or associate's degree education earn the least with $38,958. Women with an educational attainment of bachelor's degree earn the most with the average annual earnings of $56,528, while those with less than high school education have the smallest earnings of $28,250.
| Educational Attainment | Male Income | Female Income |
| Less than High School | - | - |
| High School Diploma | $70,625 | $30,352 |
| College or Associate's Degree | $38,958 | $37,386 |
| Bachelor's Degree | $61,563 | $56,528 |
| Graduate Degree | $80,673 | $38,929 |
| Total | $43,636 | $37,500 |
Family Income in West
Family Income Brackets in West
According to the West family income data, there are 144 families falling into the $100,000 to $149,999 income range, which is the most common income bracket and makes up 26.7% of all families. Conversely, the $10,000 to $14,999 income bracket is the least frequent group with only 3 families (0.6%) belonging to this category.
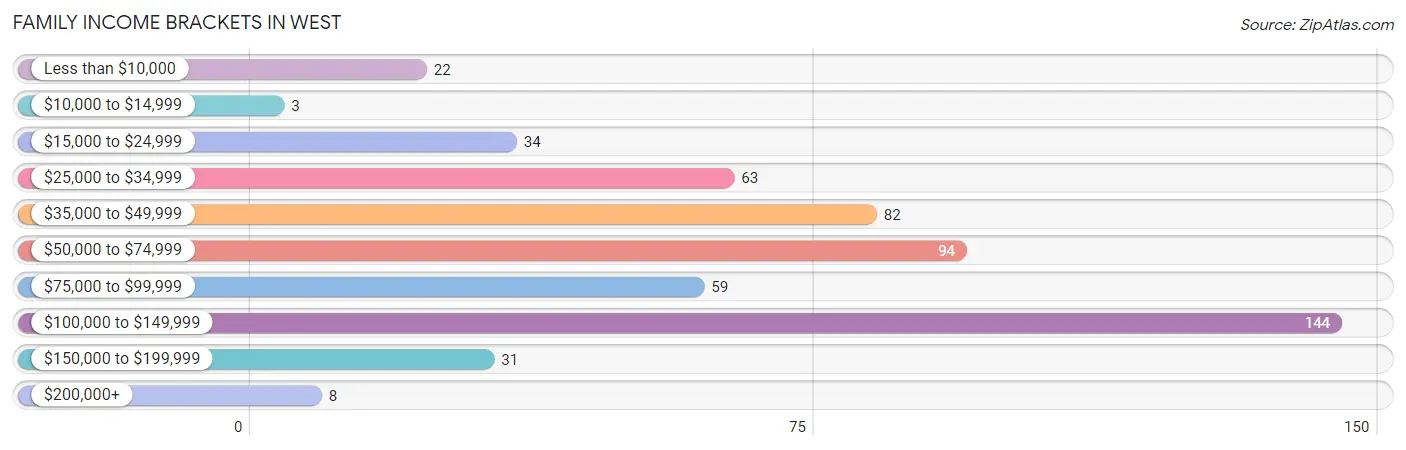
| Income Bracket | # Families | % Families |
| Less than $10,000 | 22 | 4.1% |
| $10,000 to $14,999 | 3 | 0.6% |
| $15,000 to $24,999 | 34 | 6.3% |
| $25,000 to $34,999 | 63 | 11.7% |
| $35,000 to $49,999 | 82 | 15.2% |
| $50,000 to $74,999 | 94 | 17.4% |
| $75,000 to $99,999 | 59 | 10.9% |
| $100,000 to $149,999 | 144 | 26.7% |
| $150,000 to $199,999 | 31 | 5.7% |
| $200,000+ | 8 | 1.5% |
Family Income by Famaliy Size in West
4-person families (79 | 14.6%) account for the highest median family income in West with $132,708 per family, while 4-person families (79 | 14.6%) have the highest median income of $33,177 per family member.
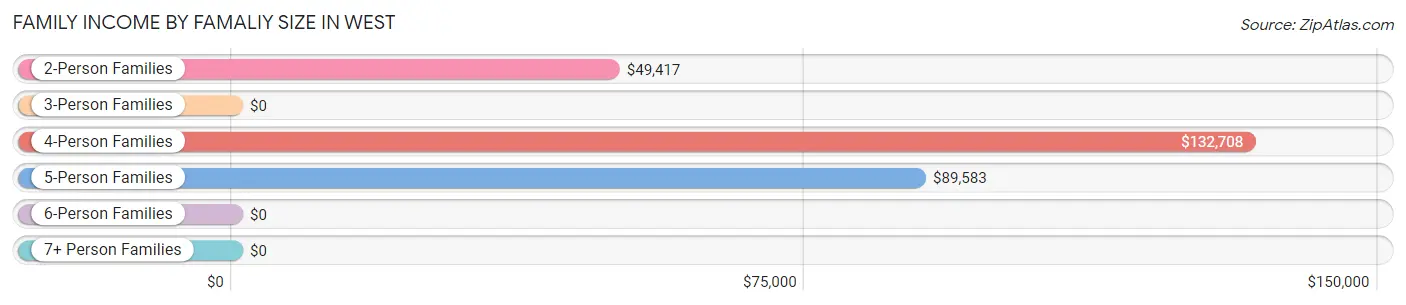
| Income Bracket | # Families | Median Income |
| 2-Person Families | 233 (43.1%) | $49,417 |
| 3-Person Families | 124 (23.0%) | $0 |
| 4-Person Families | 79 (14.6%) | $132,708 |
| 5-Person Families | 42 (7.8%) | $89,583 |
| 6-Person Families | 0 (0.0%) | $0 |
| 7+ Person Families | 62 (11.5%) | $0 |
| Total | 540 (100.0%) | $63,750 |
Family Income by Number of Earners in West
The median family income in West is $63,750, with families comprising 3+ earners (67) having the highest median family income of $143,125, while families with no earners (85) have the lowest median family income of $42,250, accounting for 12.4% and 15.7% of families, respectively.
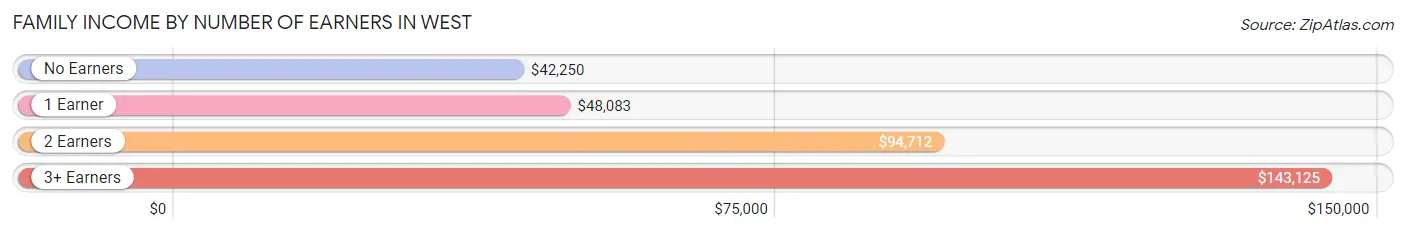
| Number of Earners | # Families | Median Income |
| No Earners | 85 (15.7%) | $42,250 |
| 1 Earner | 215 (39.8%) | $48,083 |
| 2 Earners | 173 (32.0%) | $94,712 |
| 3+ Earners | 67 (12.4%) | $143,125 |
| Total | 540 (100.0%) | $63,750 |
Household Income in West
Household Income Brackets in West
With 164 households falling in the category, the $50,000 to $74,999 income range is the most frequent in West, accounting for 18.3% of all households. In contrast, only 8 households (0.9%) fall into the $200,000+ income bracket, making it the least populous group.
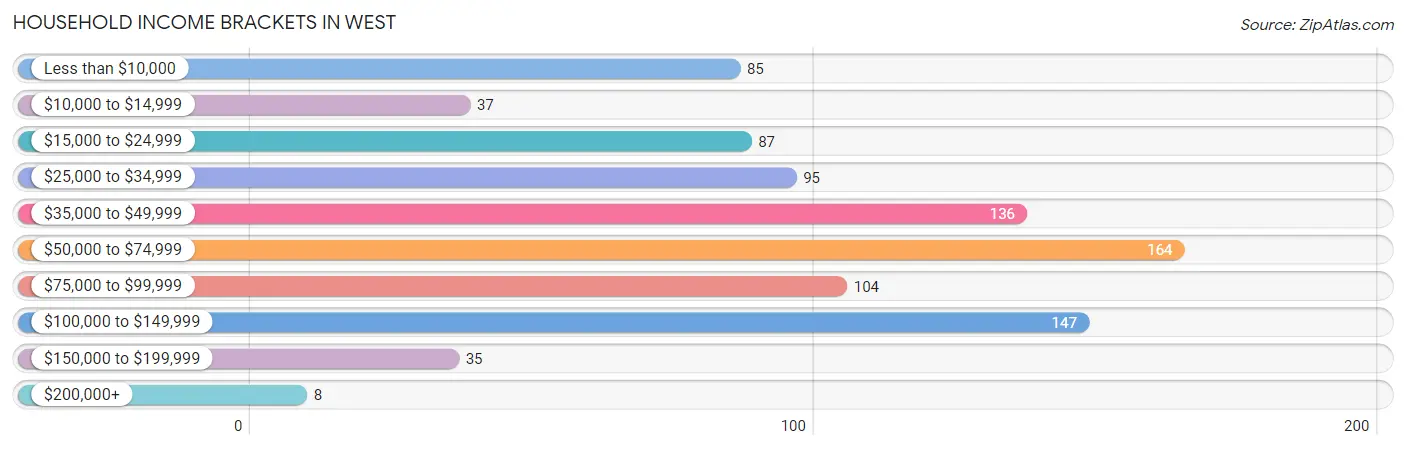
| Income Bracket | # Households | % Households |
| Less than $10,000 | 85 | 9.5% |
| $10,000 to $14,999 | 37 | 4.1% |
| $15,000 to $24,999 | 87 | 9.7% |
| $25,000 to $34,999 | 95 | 10.6% |
| $35,000 to $49,999 | 136 | 15.1% |
| $50,000 to $74,999 | 164 | 18.3% |
| $75,000 to $99,999 | 104 | 11.6% |
| $100,000 to $149,999 | 147 | 16.4% |
| $150,000 to $199,999 | 35 | 3.9% |
| $200,000+ | 8 | 0.9% |
Household Income by Householder Age in West
The median household income in West is $51,875, with the highest median household income of $70,833 found in the 45 to 64 years age bracket for the primary householder. A total of 246 households (27.4%) fall into this category. Meanwhile, the 15 to 24 years age bracket for the primary householder has the lowest median household income of $0, with 58 households (6.5%) in this group.
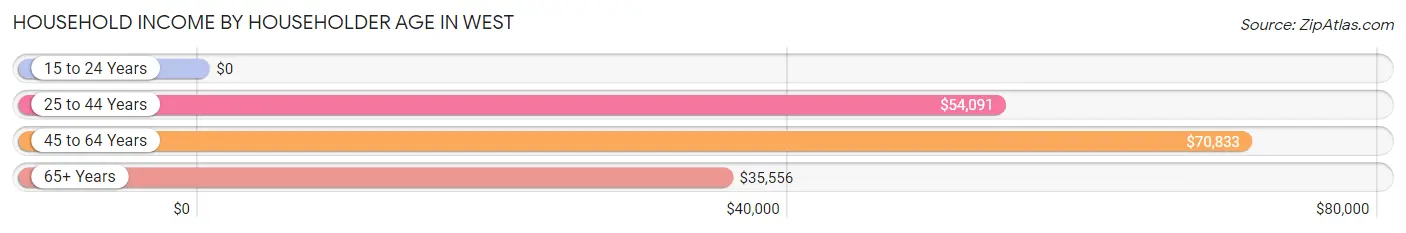
| Income Bracket | # Households | Median Income |
| 15 to 24 Years | 58 (6.5%) | $0 |
| 25 to 44 Years | 292 (32.5%) | $54,091 |
| 45 to 64 Years | 246 (27.4%) | $70,833 |
| 65+ Years | 302 (33.6%) | $35,556 |
| Total | 898 (100.0%) | $51,875 |
Poverty in West
Income Below Poverty by Sex and Age in West
With 18.6% poverty level for males and 13.4% for females among the residents of West, 5 year old males and 18 to 24 year old females are the most vulnerable to poverty, with 13 males (52.0%) and 69 females (30.7%) in their respective age groups living below the poverty level.
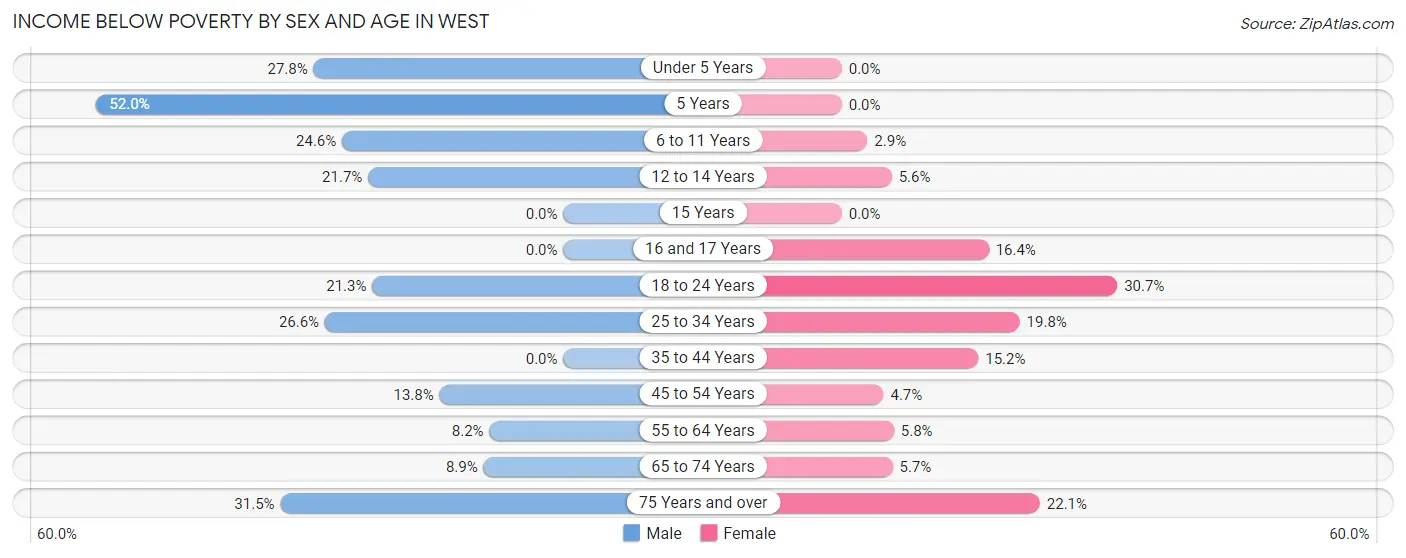
| Age Bracket | Male | Female |
| Under 5 Years | 37 (27.8%) | 0 (0.0%) |
| 5 Years | 13 (52.0%) | 0 (0.0%) |
| 6 to 11 Years | 17 (24.6%) | 7 (2.9%) |
| 12 to 14 Years | 5 (21.7%) | 4 (5.6%) |
| 15 Years | 0 (0.0%) | 0 (0.0%) |
| 16 and 17 Years | 0 (0.0%) | 9 (16.4%) |
| 18 to 24 Years | 20 (21.3%) | 69 (30.7%) |
| 25 to 34 Years | 47 (26.6%) | 21 (19.8%) |
| 35 to 44 Years | 0 (0.0%) | 26 (15.2%) |
| 45 to 54 Years | 8 (13.8%) | 4 (4.6%) |
| 55 to 64 Years | 13 (8.2%) | 8 (5.8%) |
| 65 to 74 Years | 4 (8.9%) | 7 (5.7%) |
| 75 Years and over | 23 (31.5%) | 30 (22.1%) |
| Total | 187 (18.6%) | 185 (13.4%) |
Income Above Poverty by Sex and Age in West
According to the poverty statistics in West, males aged 15 years and females aged under 5 years are the age groups that are most secure financially, with 100.0% of males and 100.0% of females in these age groups living above the poverty line.
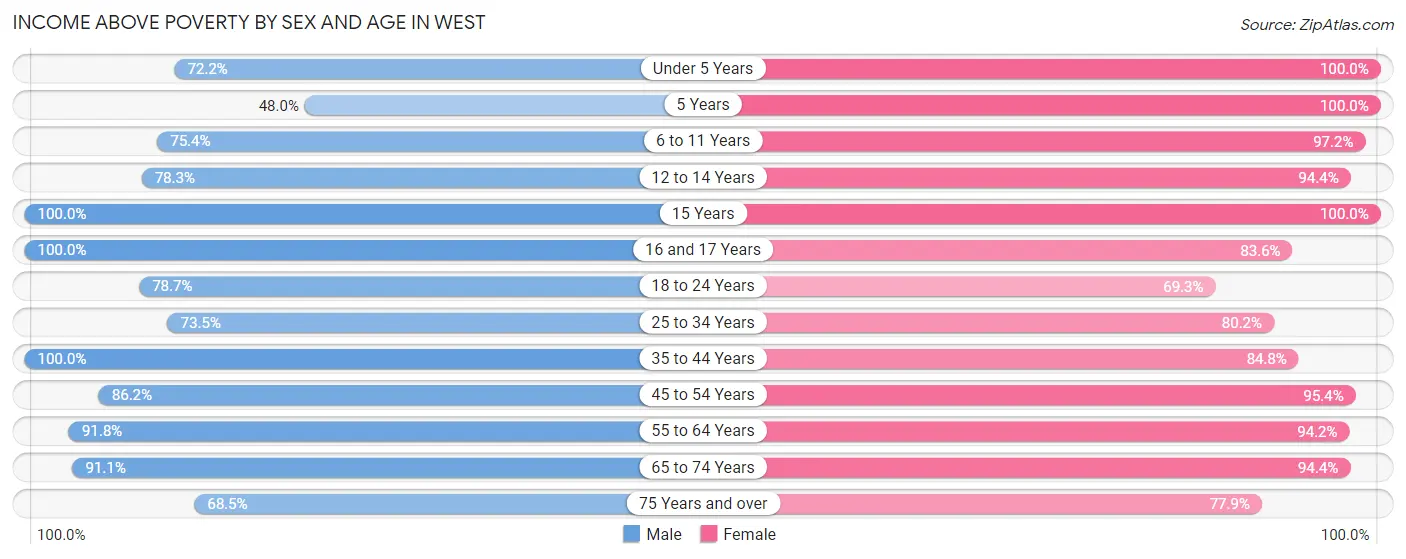
| Age Bracket | Male | Female |
| Under 5 Years | 96 (72.2%) | 16 (100.0%) |
| 5 Years | 12 (48.0%) | 4 (100.0%) |
| 6 to 11 Years | 52 (75.4%) | 239 (97.2%) |
| 12 to 14 Years | 18 (78.3%) | 68 (94.4%) |
| 15 Years | 14 (100.0%) | 7 (100.0%) |
| 16 and 17 Years | 5 (100.0%) | 46 (83.6%) |
| 18 to 24 Years | 74 (78.7%) | 156 (69.3%) |
| 25 to 34 Years | 130 (73.5%) | 85 (80.2%) |
| 35 to 44 Years | 130 (100.0%) | 145 (84.8%) |
| 45 to 54 Years | 50 (86.2%) | 82 (95.4%) |
| 55 to 64 Years | 145 (91.8%) | 130 (94.2%) |
| 65 to 74 Years | 41 (91.1%) | 117 (94.4%) |
| 75 Years and over | 50 (68.5%) | 106 (77.9%) |
| Total | 817 (81.4%) | 1,201 (86.7%) |
Income Below Poverty Among Married-Couple Families in West
The poverty statistics for married-couple families in West show that 6.8% or 24 of the total 354 families live below the poverty line. Families with 1 or 2 children have the highest poverty rate of 17.6%, comprising of 21 families. On the other hand, families with 3 or 4 children have the lowest poverty rate of 0.0%, which includes 0 families.
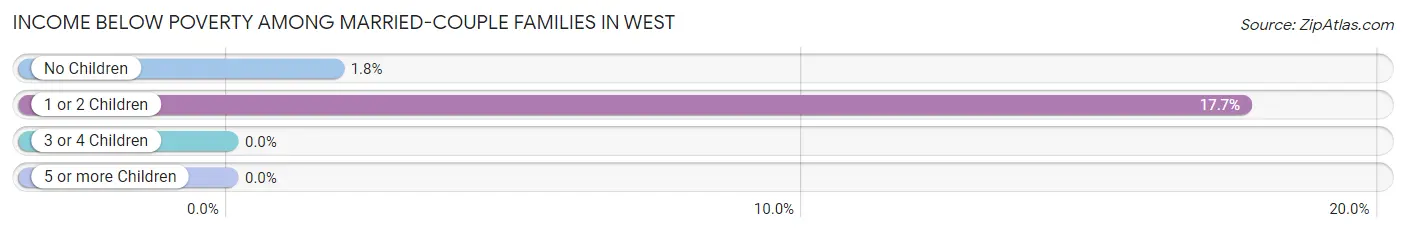
| Children | Above Poverty | Below Poverty |
| No Children | 160 (98.2%) | 3 (1.8%) |
| 1 or 2 Children | 98 (82.4%) | 21 (17.6%) |
| 3 or 4 Children | 10 (100.0%) | 0 (0.0%) |
| 5 or more Children | 62 (100.0%) | 0 (0.0%) |
| Total | 330 (93.2%) | 24 (6.8%) |
Income Below Poverty Among Single-Parent Households in West
According to the poverty data in West, 12.1% or 7 single-father households and 30.5% or 39 single-mother households are living below the poverty line. Among single-father households, those with 1 or 2 children have the highest poverty rate, with 7 households (70.0%) experiencing poverty. Likewise, among single-mother households, those with 1 or 2 children have the highest poverty rate, with 39 households (60.0%) falling below the poverty line.
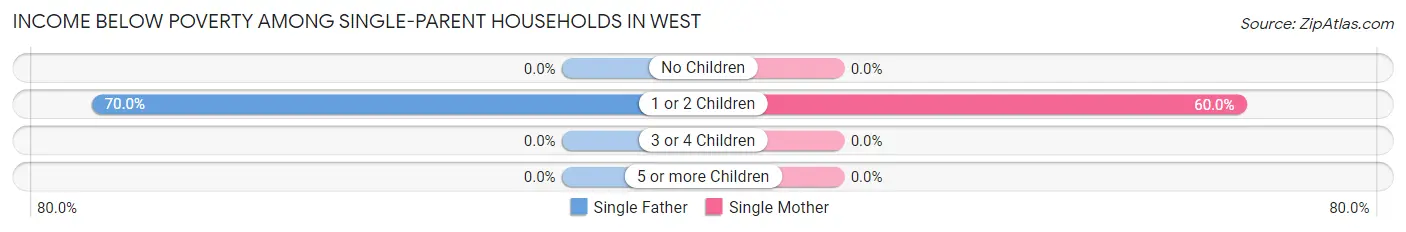
| Children | Single Father | Single Mother |
| No Children | 0 (0.0%) | 0 (0.0%) |
| 1 or 2 Children | 7 (70.0%) | 39 (60.0%) |
| 3 or 4 Children | 0 (0.0%) | 0 (0.0%) |
| 5 or more Children | 0 (0.0%) | 0 (0.0%) |
| Total | 7 (12.1%) | 39 (30.5%) |
Income Below Poverty Among Married-Couple vs Single-Parent Households in West
The poverty data for West shows that 24 of the married-couple family households (6.8%) and 46 of the single-parent households (24.7%) are living below the poverty level. Within the married-couple family households, those with 1 or 2 children have the highest poverty rate, with 21 households (17.6%) falling below the poverty line. Among the single-parent households, those with 1 or 2 children have the highest poverty rate, with 46 household (61.3%) living below poverty.
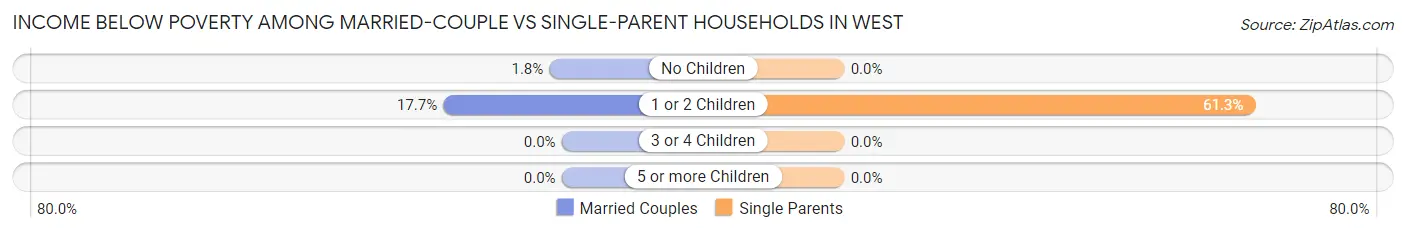
| Children | Married-Couple Families | Single-Parent Households |
| No Children | 3 (1.8%) | 0 (0.0%) |
| 1 or 2 Children | 21 (17.6%) | 46 (61.3%) |
| 3 or 4 Children | 0 (0.0%) | 0 (0.0%) |
| 5 or more Children | 0 (0.0%) | 0 (0.0%) |
| Total | 24 (6.8%) | 46 (24.7%) |
Race in West
The most populous races in West are White / Caucasian (1,836 | 71.3%), Hispanic or Latino (612 | 23.7%), and Two or more Races (570 | 22.1%).
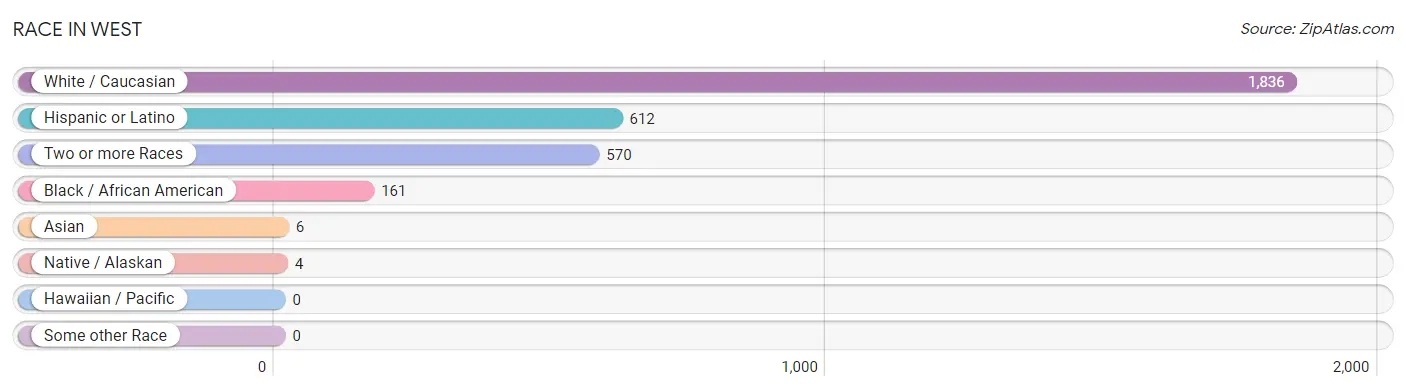
| Race | # Population | % Population |
| Asian | 6 | 0.2% |
| Black / African American | 161 | 6.2% |
| Hawaiian / Pacific | 0 | 0.0% |
| Hispanic or Latino | 612 | 23.7% |
| Native / Alaskan | 4 | 0.2% |
| White / Caucasian | 1,836 | 71.3% |
| Two or more Races | 570 | 22.1% |
| Some other Race | 0 | 0.0% |
| Total | 2,577 | 100.0% |
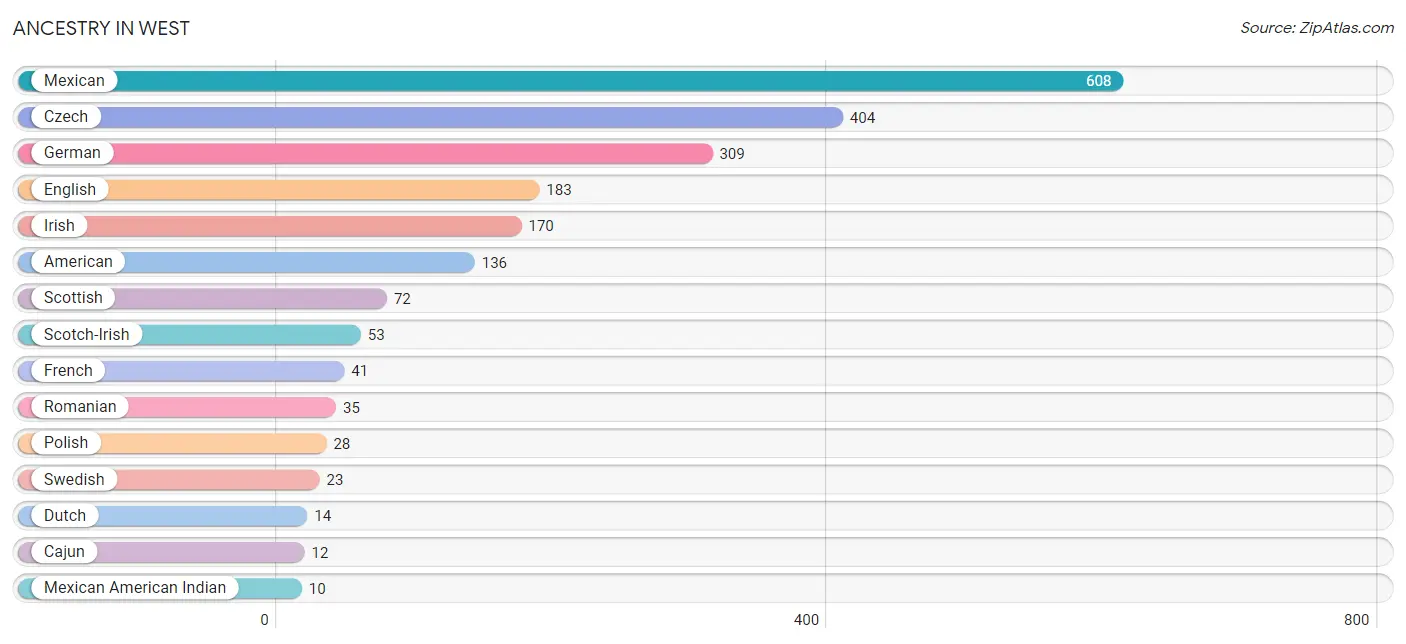
Ancestry in West
The most populous ancestries reported in West are Mexican (608 | 23.6%), Czech (404 | 15.7%), German (309 | 12.0%), English (183 | 7.1%), and Irish (170 | 6.6%), together accounting for 65.0% of all West residents.
| Ancestry | # Population | % Population |
| African | 7 | 0.3% |
| American | 136 | 5.3% |
| British | 3 | 0.1% |
| Cajun | 12 | 0.5% |
| Czech | 404 | 15.7% |
| Czechoslovakian | 8 | 0.3% |
| Dutch | 14 | 0.5% |
| English | 183 | 7.1% |
| European | 3 | 0.1% |
| French | 41 | 1.6% |
| German | 309 | 12.0% |
| Irish | 170 | 6.6% |
| Korean | 6 | 0.2% |
| Mexican | 608 | 23.6% |
| Mexican American Indian | 10 | 0.4% |
| Polish | 28 | 1.1% |
| Puerto Rican | 4 | 0.2% |
| Romanian | 35 | 1.4% |
| Scotch-Irish | 53 | 2.1% |
| Scottish | 72 | 2.8% |
| Subsaharan African | 7 | 0.3% |
| Swedish | 23 | 0.9% |
| Swiss | 5 | 0.2% | View All 23 Rows |
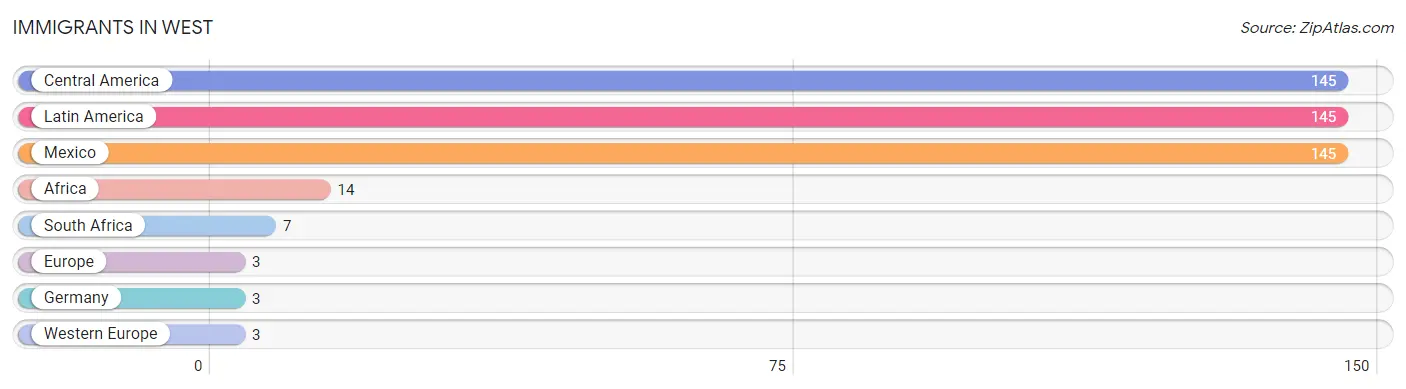
Immigrants in West
The most numerous immigrant groups reported in West came from Central America (145 | 5.6%), Latin America (145 | 5.6%), Mexico (145 | 5.6%), Africa (14 | 0.5%), and South Africa (7 | 0.3%), together accounting for 17.7% of all West residents.
| Immigration Origin | # Population | % Population |
| Africa | 14 | 0.5% |
| Central America | 145 | 5.6% |
| Europe | 3 | 0.1% |
| Germany | 3 | 0.1% |
| Latin America | 145 | 5.6% |
| Mexico | 145 | 5.6% |
| South Africa | 7 | 0.3% |
| Western Europe | 3 | 0.1% | View All 8 Rows |
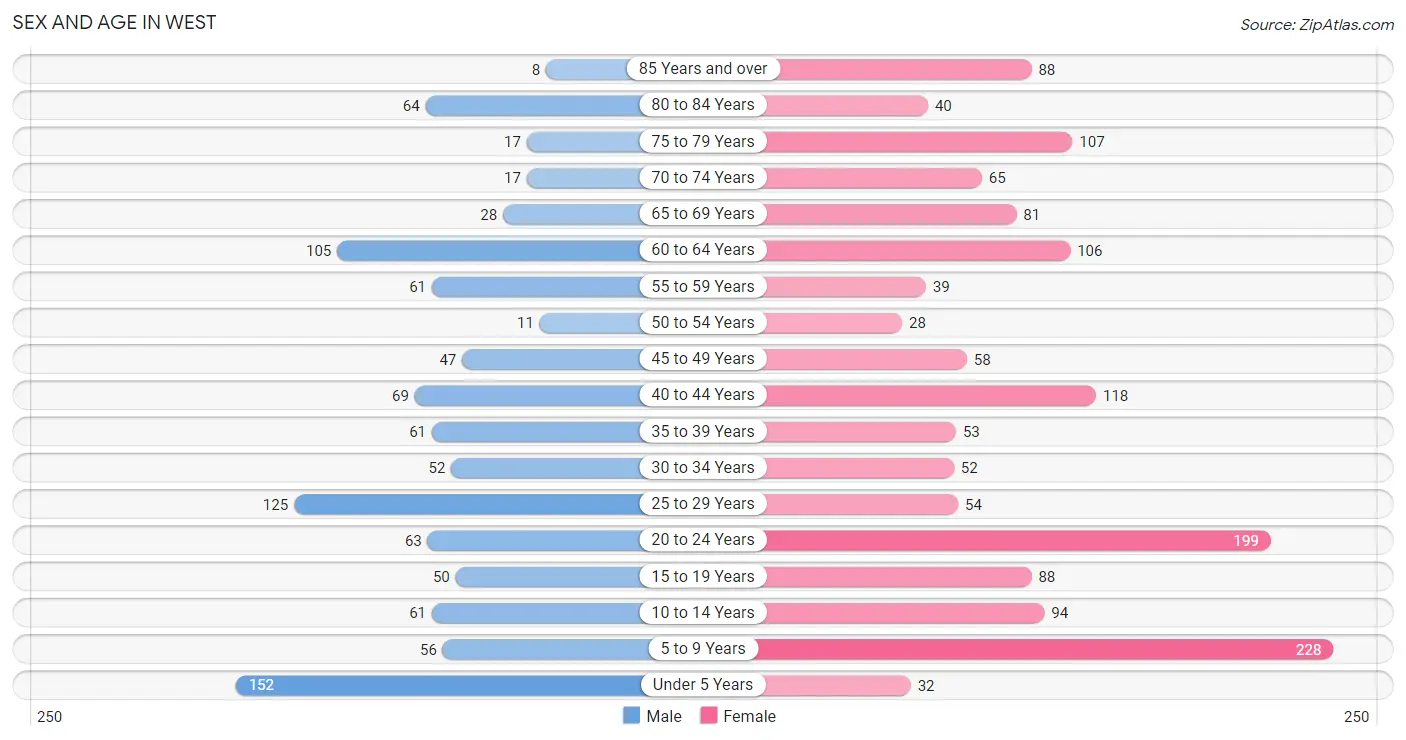
Sex and Age in West
Sex and Age in West
The most populous age groups in West are Under 5 Years (152 | 14.5%) for men and 5 to 9 Years (228 | 14.9%) for women.
| Age Bracket | Male | Female |
| Under 5 Years | 152 (14.5%) | 32 (2.1%) |
| 5 to 9 Years | 56 (5.3%) | 228 (14.9%) |
| 10 to 14 Years | 61 (5.8%) | 94 (6.1%) |
| 15 to 19 Years | 50 (4.8%) | 88 (5.8%) |
| 20 to 24 Years | 63 (6.0%) | 199 (13.0%) |
| 25 to 29 Years | 125 (11.9%) | 54 (3.5%) |
| 30 to 34 Years | 52 (5.0%) | 52 (3.4%) |
| 35 to 39 Years | 61 (5.8%) | 53 (3.5%) |
| 40 to 44 Years | 69 (6.6%) | 118 (7.7%) |
| 45 to 49 Years | 47 (4.5%) | 58 (3.8%) |
| 50 to 54 Years | 11 (1.1%) | 28 (1.8%) |
| 55 to 59 Years | 61 (5.8%) | 39 (2.5%) |
| 60 to 64 Years | 105 (10.0%) | 106 (6.9%) |
| 65 to 69 Years | 28 (2.7%) | 81 (5.3%) |
| 70 to 74 Years | 17 (1.6%) | 65 (4.3%) |
| 75 to 79 Years | 17 (1.6%) | 107 (7.0%) |
| 80 to 84 Years | 64 (6.1%) | 40 (2.6%) |
| 85 Years and over | 8 (0.8%) | 88 (5.8%) |
| Total | 1,047 (100.0%) | 1,530 (100.0%) |
Families and Households in West
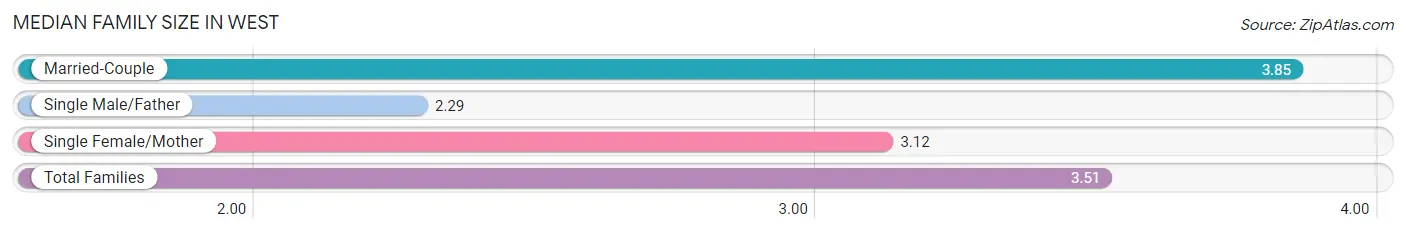
Median Family Size in West
The median family size in West is 3.51 persons per family, with married-couple families (354 | 65.6%) accounting for the largest median family size of 3.85 persons per family. On the other hand, single male/father families (58 | 10.7%) represent the smallest median family size with 2.29 persons per family.
| Family Type | # Families | Family Size |
| Married-Couple | 354 (65.6%) | 3.85 |
| Single Male/Father | 58 (10.7%) | 2.29 |
| Single Female/Mother | 128 (23.7%) | 3.12 |
| Total Families | 540 (100.0%) | 3.51 |
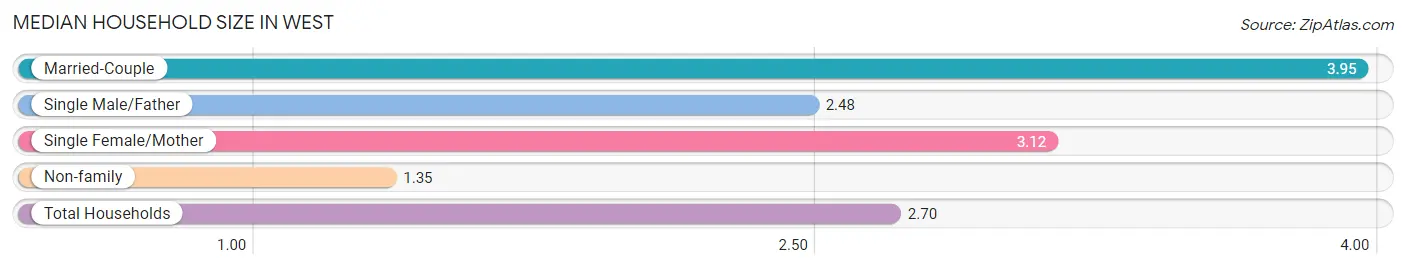
Median Household Size in West
The median household size in West is 2.70 persons per household, with married-couple households (354 | 39.4%) accounting for the largest median household size of 3.95 persons per household. non-family households (358 | 39.9%) represent the smallest median household size with 1.35 persons per household.
| Household Type | # Households | Household Size |
| Married-Couple | 354 (39.4%) | 3.95 |
| Single Male/Father | 58 (6.5%) | 2.48 |
| Single Female/Mother | 128 (14.2%) | 3.12 |
| Non-family | 358 (39.9%) | 1.35 |
| Total Households | 898 (100.0%) | 2.70 |
Household Size by Marriage Status in West
Out of a total of 898 households in West, 540 (60.1%) are family households, while 358 (39.9%) are nonfamily households. The most numerous type of family households are 2-person households, comprising 230, and the most common type of nonfamily households are 1-person households, comprising 283.
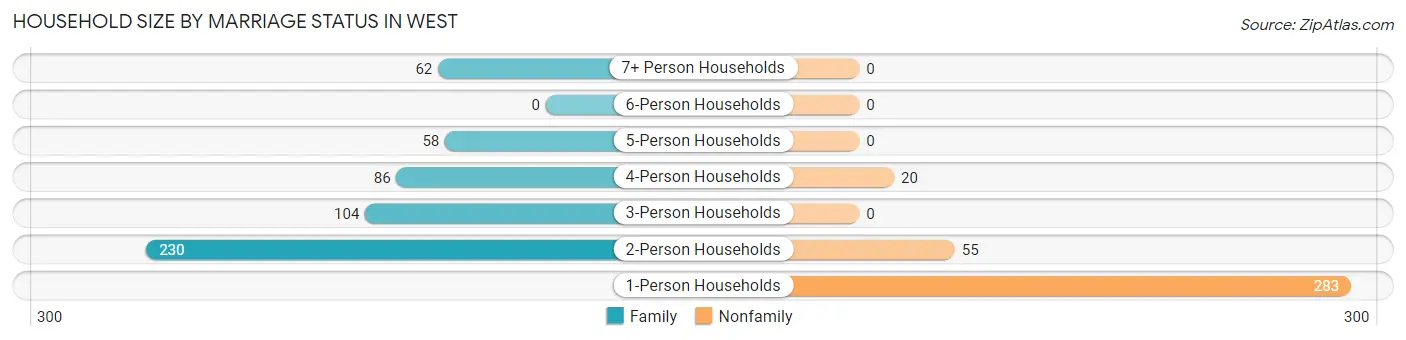
| Household Size | Family Households | Nonfamily Households |
| 1-Person Households | - | 283 (31.5%) |
| 2-Person Households | 230 (25.6%) | 55 (6.1%) |
| 3-Person Households | 104 (11.6%) | 0 (0.0%) |
| 4-Person Households | 86 (9.6%) | 20 (2.2%) |
| 5-Person Households | 58 (6.5%) | 0 (0.0%) |
| 6-Person Households | 0 (0.0%) | 0 (0.0%) |
| 7+ Person Households | 62 (6.9%) | 0 (0.0%) |
| Total | 540 (60.1%) | 358 (39.9%) |
Female Fertility in West
Fertility by Age in West
Average fertility rate in West is 75.0 births per 1,000 women. Women in the age bracket of 15 to 19 years have the highest fertility rate with 170.0 births per 1,000 women. Women in the age bracket of 20 to 34 years acount for 53.2% of all women with births.
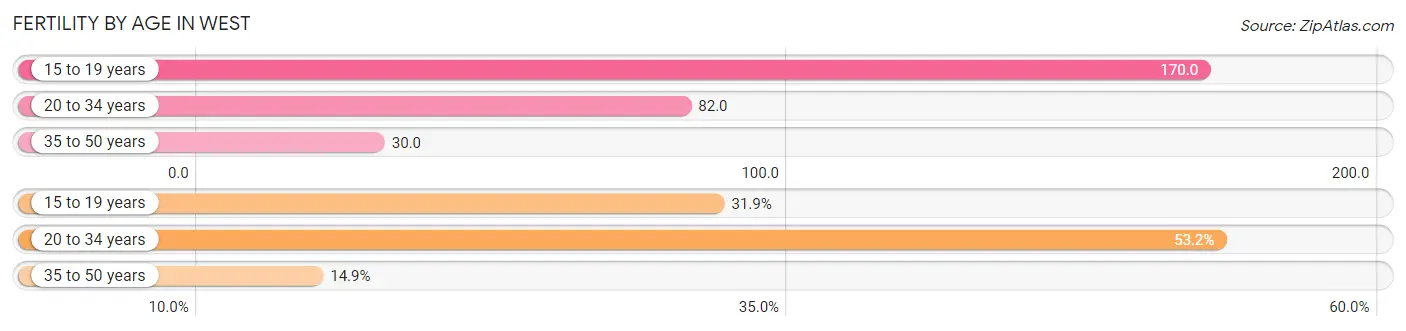
| Age Bracket | Women with Births | Births / 1,000 Women |
| 15 to 19 years | 15 (31.9%) | 170.0 |
| 20 to 34 years | 25 (53.2%) | 82.0 |
| 35 to 50 years | 7 (14.9%) | 30.0 |
| Total | 47 (100.0%) | 75.0 |
Fertility by Age by Marriage Status in West
53.2% of women with births (47) in West are married. The highest percentage of unmarried women with births falls into 15 to 19 years age bracket with 100.0% of them unmarried at the time of birth, while the lowest percentage of unmarried women with births belong to 20 to 34 years age bracket with 0.0% of them unmarried.
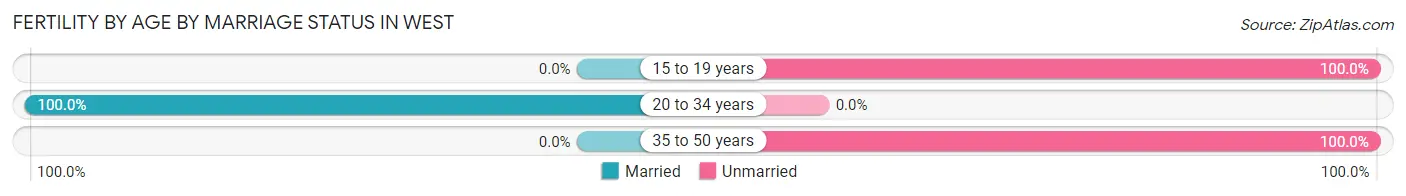
| Age Bracket | Married | Unmarried |
| 15 to 19 years | 0 (0.0%) | 15 (100.0%) |
| 20 to 34 years | 25 (100.0%) | 0 (0.0%) |
| 35 to 50 years | 0 (0.0%) | 7 (100.0%) |
| Total | 25 (53.2%) | 22 (46.8%) |
Fertility by Education in West
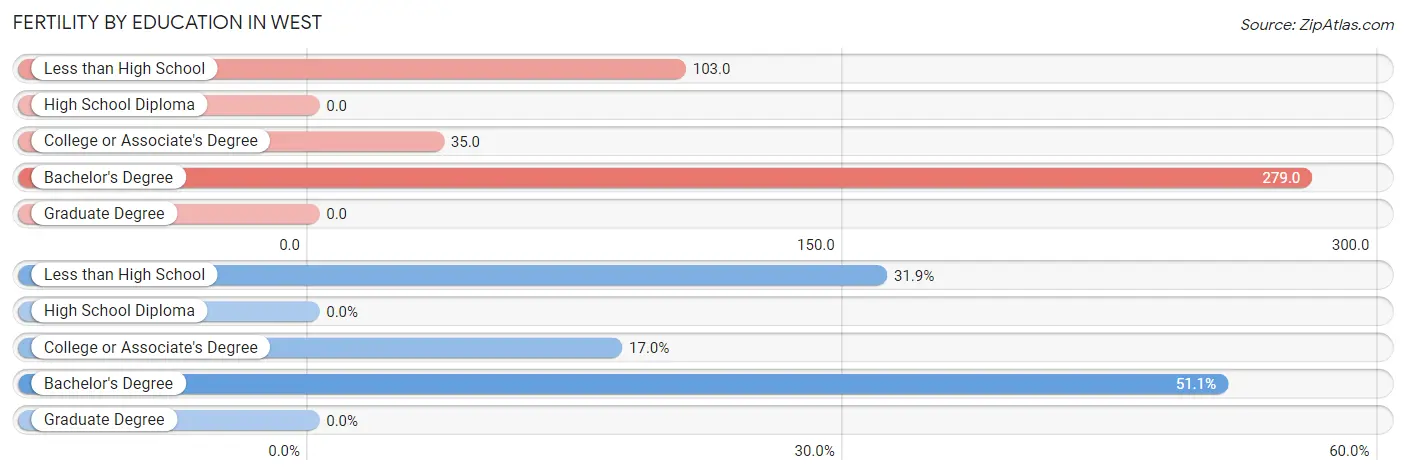
| Educational Attainment | Women with Births | Births / 1,000 Women |
| Less than High School | 15 (31.9%) | 103.0 |
| High School Diploma | 0 (0.0%) | 0.0 |
| College or Associate's Degree | 8 (17.0%) | 35.0 |
| Bachelor's Degree | 24 (51.1%) | 279.0 |
| Graduate Degree | 0 (0.0%) | 0.0 |
| Total | 47 (100.0%) | 75.0 |
Fertility by Education by Marriage Status in West
46.8% of women with births in West are unmarried. Women with the educational attainment of bachelor's degree are most likely to be married with 83.3% of them married at childbirth, while women with the educational attainment of less than high school are least likely to be married with 100.0% of them unmarried at childbirth.
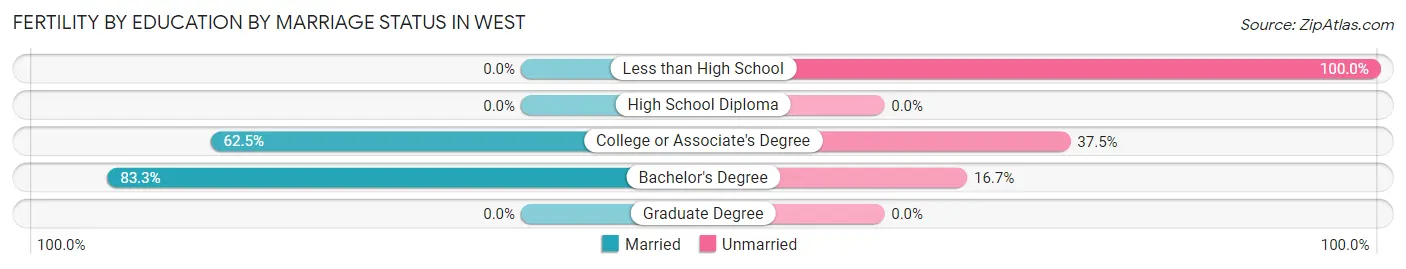
| Educational Attainment | Married | Unmarried |
| Less than High School | 0 (0.0%) | 15 (100.0%) |
| High School Diploma | 0 (0.0%) | 0 (0.0%) |
| College or Associate's Degree | 5 (62.5%) | 3 (37.5%) |
| Bachelor's Degree | 20 (83.3%) | 4 (16.7%) |
| Graduate Degree | 0 (0.0%) | 0 (0.0%) |
| Total | 25 (53.2%) | 22 (46.8%) |
Employment Characteristics in West
Employment by Class of Employer in West
Among the 1,045 employed individuals in West, private company employees (748 | 71.6%), not-for-profit organizations (154 | 14.7%), and local government employees (60 | 5.7%) make up the most common classes of employment.
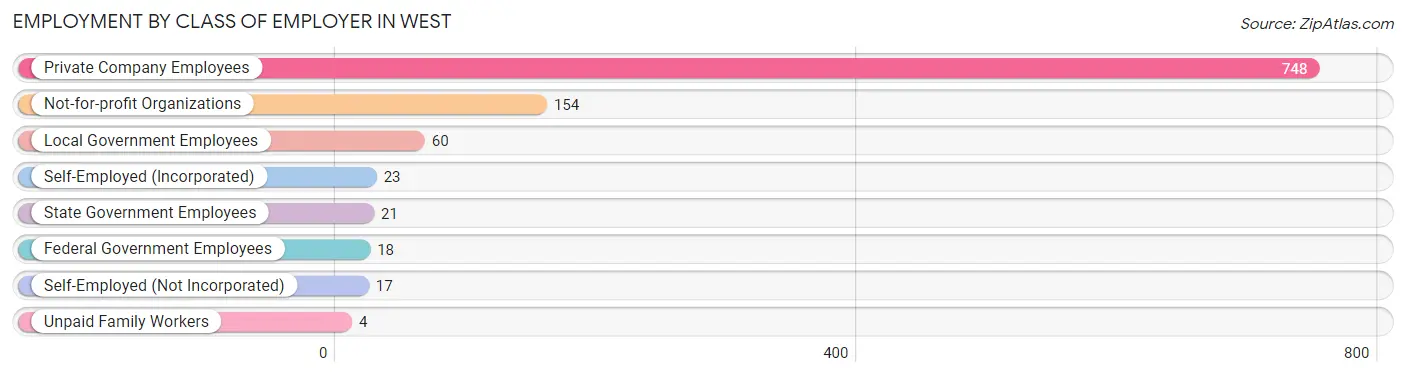
| Employer Class | # Employees | % Employees |
| Private Company Employees | 748 | 71.6% |
| Self-Employed (Incorporated) | 23 | 2.2% |
| Self-Employed (Not Incorporated) | 17 | 1.6% |
| Not-for-profit Organizations | 154 | 14.7% |
| Local Government Employees | 60 | 5.7% |
| State Government Employees | 21 | 2.0% |
| Federal Government Employees | 18 | 1.7% |
| Unpaid Family Workers | 4 | 0.4% |
| Total | 1,045 | 100.0% |
Employment Status by Age in West
According to the labor force statistics for West, out of the total population over 16 years of age (1,933), 56.0% or 1,082 individuals are in the labor force, with 2.1% or 23 of them unemployed. The age group with the highest labor force participation rate is 30 to 34 years, with 91.3% or 95 individuals in the labor force. Within the labor force, the 45 to 54 years age range has the highest percentage of unemployed individuals, with 11.3% or 12 of them being unemployed.
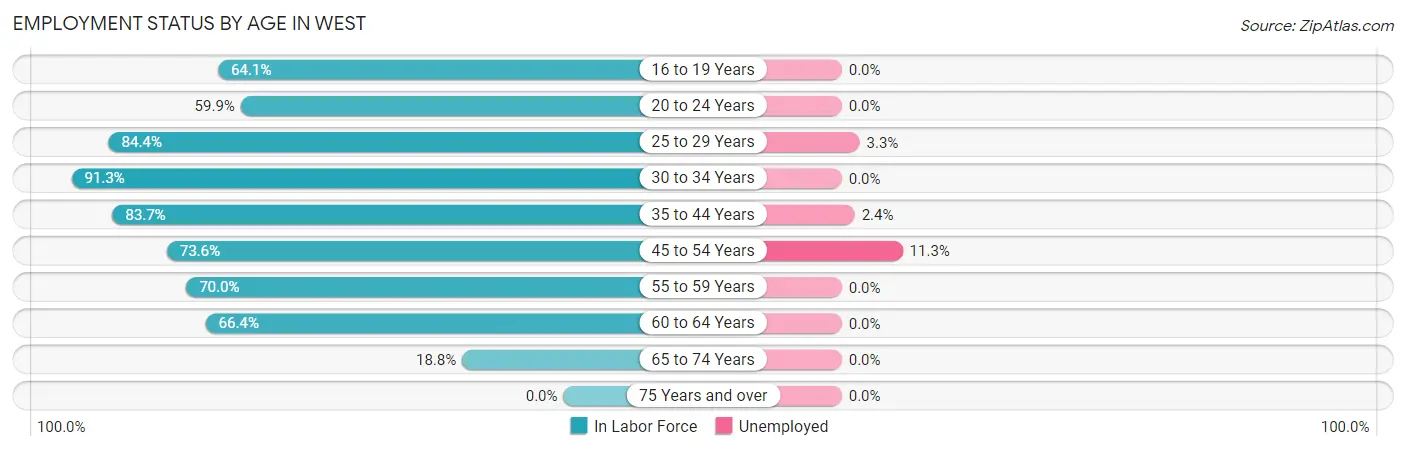
| Age Bracket | In Labor Force | Unemployed |
| 16 to 19 Years | 75 (64.1%) | 0 (0.0%) |
| 20 to 24 Years | 157 (59.9%) | 0 (0.0%) |
| 25 to 29 Years | 151 (84.4%) | 5 (3.3%) |
| 30 to 34 Years | 95 (91.3%) | 0 (0.0%) |
| 35 to 44 Years | 252 (83.7%) | 6 (2.4%) |
| 45 to 54 Years | 106 (73.6%) | 12 (11.3%) |
| 55 to 59 Years | 70 (70.0%) | 0 (0.0%) |
| 60 to 64 Years | 140 (66.4%) | 0 (0.0%) |
| 65 to 74 Years | 36 (18.8%) | 0 (0.0%) |
| 75 Years and over | 0 (0.0%) | 0 (0.0%) |
| Total | 1,082 (56.0%) | 23 (2.1%) |
Employment Status by Educational Attainment in West
According to labor force statistics for West, 78.3% of individuals (814) out of the total population between 25 and 64 years of age (1,039) are in the labor force, with 2.9% or 24 of them being unemployed. The group with the highest labor force participation rate are those with the educational attainment of college / associate degree, with 84.9% or 270 individuals in the labor force. Within the labor force, individuals with less than high school education have the highest percentage of unemployment, with 7.1% or 12 of them being unemployed.
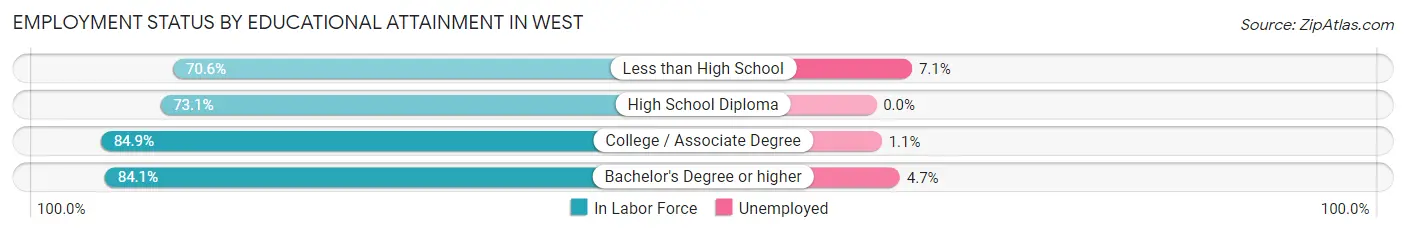
| Educational Attainment | In Labor Force | Unemployed |
| Less than High School | 168 (70.6%) | 17 (7.1%) |
| High School Diploma | 201 (73.1%) | 0 (0.0%) |
| College / Associate Degree | 270 (84.9%) | 3 (1.1%) |
| Bachelor's Degree or higher | 175 (84.1%) | 10 (4.7%) |
| Total | 814 (78.3%) | 30 (2.9%) |
Employment Occupations by Sex in West
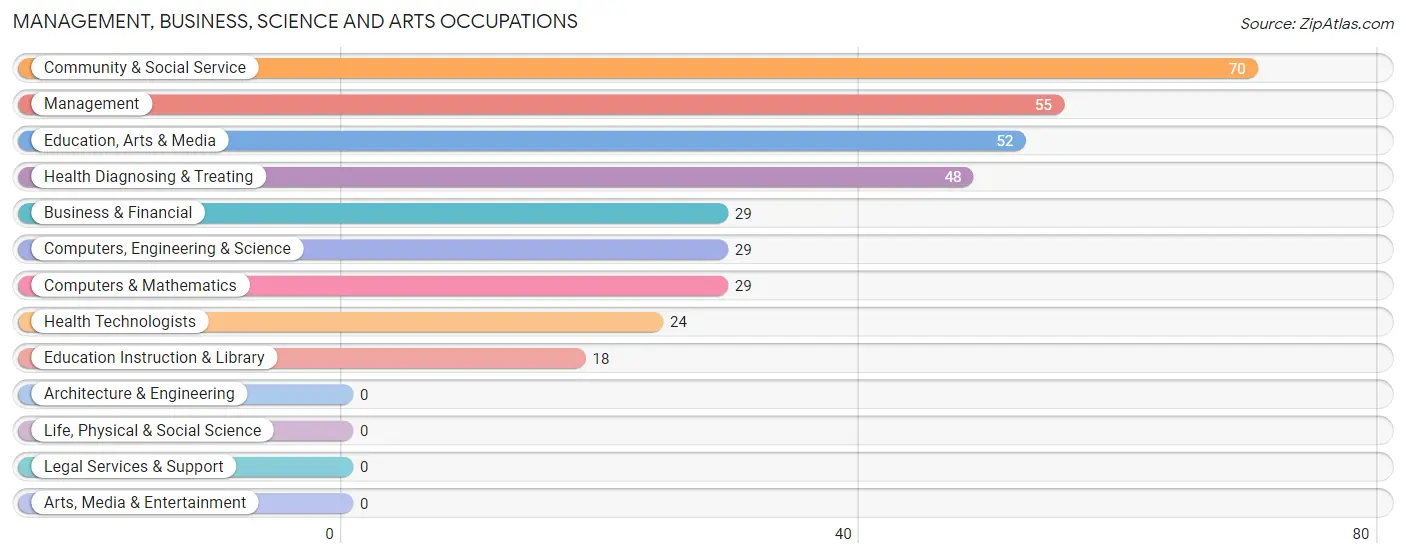
Management, Business, Science and Arts Occupations
The most common Management, Business, Science and Arts occupations in West are Community & Social Service (70 | 6.7%), Management (55 | 5.2%), Education, Arts & Media (52 | 4.9%), Health Diagnosing & Treating (48 | 4.6%), and Business & Financial (29 | 2.8%).
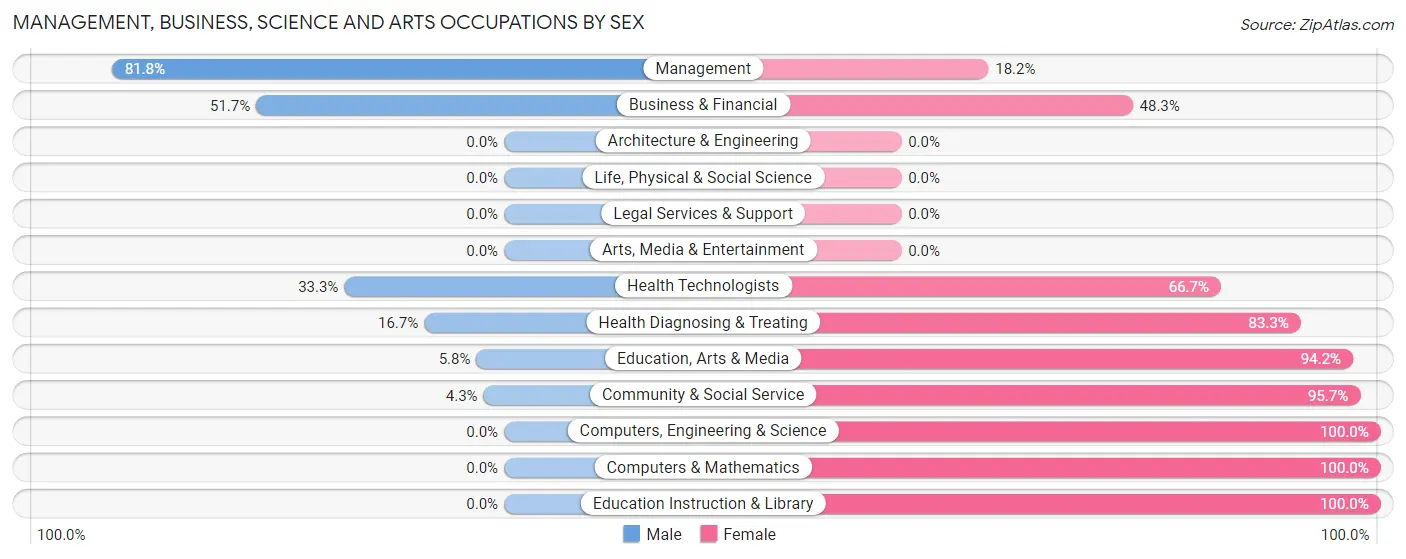
Management, Business, Science and Arts Occupations by Sex
Within the Management, Business, Science and Arts occupations in West, the most male-oriented occupations are Management (81.8%), Business & Financial (51.7%), and Health Technologists (33.3%), while the most female-oriented occupations are Computers, Engineering & Science (100.0%), Computers & Mathematics (100.0%), and Education Instruction & Library (100.0%).
| Occupation | Male | Female |
| Management | 45 (81.8%) | 10 (18.2%) |
| Business & Financial | 15 (51.7%) | 14 (48.3%) |
| Computers, Engineering & Science | 0 (0.0%) | 29 (100.0%) |
| Computers & Mathematics | 0 (0.0%) | 29 (100.0%) |
| Architecture & Engineering | 0 (0.0%) | 0 (0.0%) |
| Life, Physical & Social Science | 0 (0.0%) | 0 (0.0%) |
| Community & Social Service | 3 (4.3%) | 67 (95.7%) |
| Education, Arts & Media | 3 (5.8%) | 49 (94.2%) |
| Legal Services & Support | 0 (0.0%) | 0 (0.0%) |
| Education Instruction & Library | 0 (0.0%) | 18 (100.0%) |
| Arts, Media & Entertainment | 0 (0.0%) | 0 (0.0%) |
| Health Diagnosing & Treating | 8 (16.7%) | 40 (83.3%) |
| Health Technologists | 8 (33.3%) | 16 (66.7%) |
| Total (Category) | 71 (30.7%) | 160 (69.3%) |
| Total (Overall) | 497 (47.2%) | 555 (52.8%) |
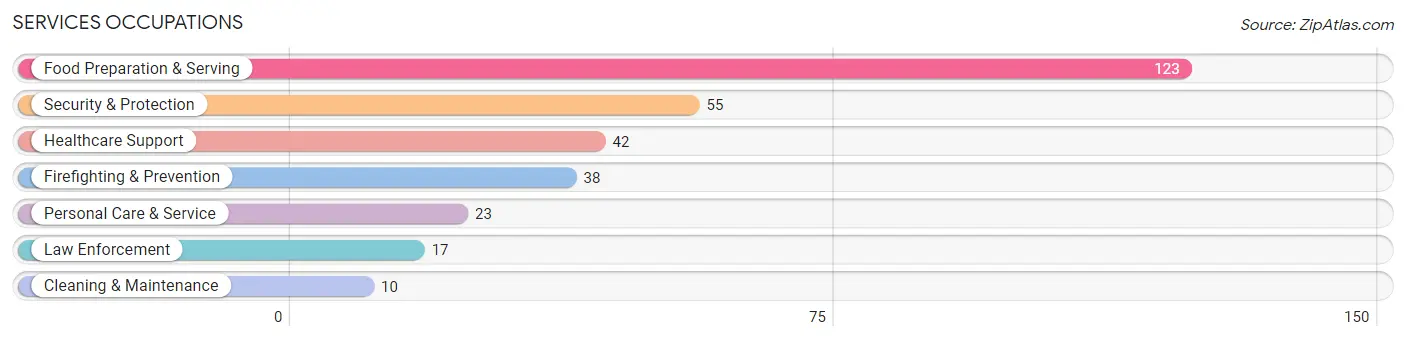
Services Occupations
The most common Services occupations in West are Food Preparation & Serving (123 | 11.7%), Security & Protection (55 | 5.2%), Healthcare Support (42 | 4.0%), Firefighting & Prevention (38 | 3.6%), and Personal Care & Service (23 | 2.2%).
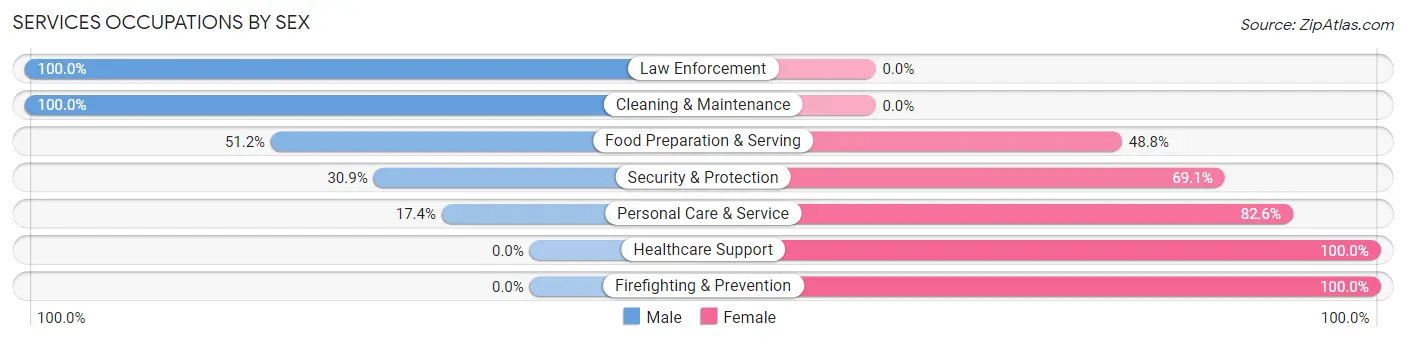
Services Occupations by Sex
Within the Services occupations in West, the most male-oriented occupations are Law Enforcement (100.0%), Cleaning & Maintenance (100.0%), and Food Preparation & Serving (51.2%), while the most female-oriented occupations are Healthcare Support (100.0%), Firefighting & Prevention (100.0%), and Personal Care & Service (82.6%).
| Occupation | Male | Female |
| Healthcare Support | 0 (0.0%) | 42 (100.0%) |
| Security & Protection | 17 (30.9%) | 38 (69.1%) |
| Firefighting & Prevention | 0 (0.0%) | 38 (100.0%) |
| Law Enforcement | 17 (100.0%) | 0 (0.0%) |
| Food Preparation & Serving | 63 (51.2%) | 60 (48.8%) |
| Cleaning & Maintenance | 10 (100.0%) | 0 (0.0%) |
| Personal Care & Service | 4 (17.4%) | 19 (82.6%) |
| Total (Category) | 94 (37.1%) | 159 (62.8%) |
| Total (Overall) | 497 (47.2%) | 555 (52.8%) |
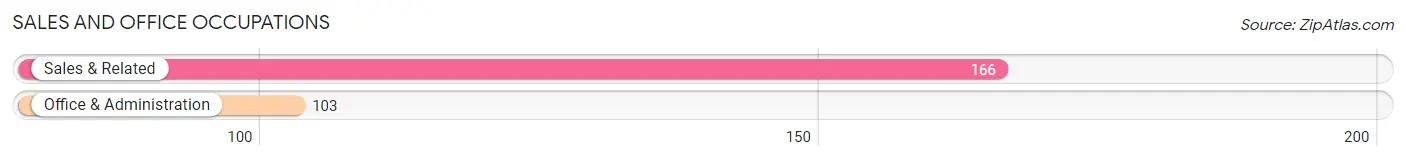
Sales and Office Occupations
The most common Sales and Office occupations in West are Sales & Related (166 | 15.8%), and Office & Administration (103 | 9.8%).
Sales and Office Occupations by Sex
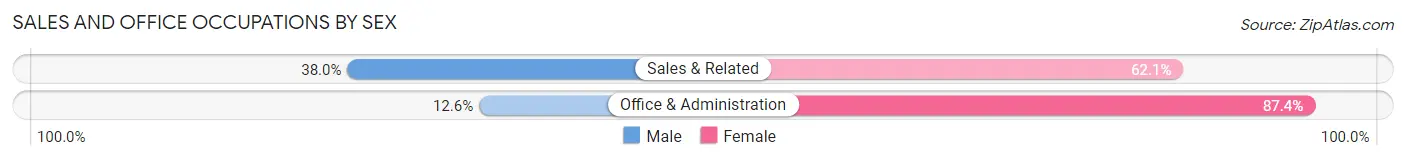
| Occupation | Male | Female |
| Sales & Related | 63 (38.0%) | 103 (62.1%) |
| Office & Administration | 13 (12.6%) | 90 (87.4%) |
| Total (Category) | 76 (28.2%) | 193 (71.8%) |
| Total (Overall) | 497 (47.2%) | 555 (52.8%) |
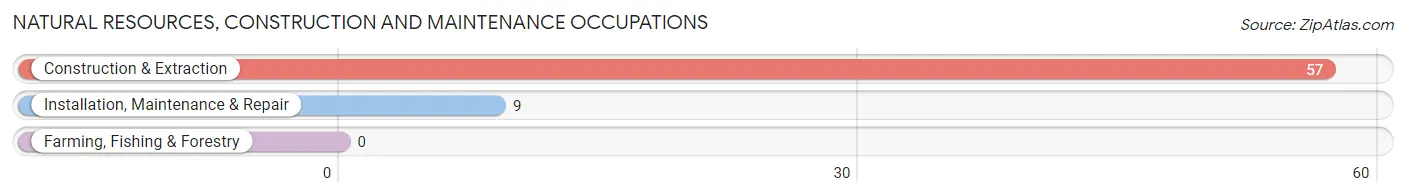
Natural Resources, Construction and Maintenance Occupations
The most common Natural Resources, Construction and Maintenance occupations in West are Construction & Extraction (57 | 5.4%), and Installation, Maintenance & Repair (9 | 0.9%).
Natural Resources, Construction and Maintenance Occupations by Sex
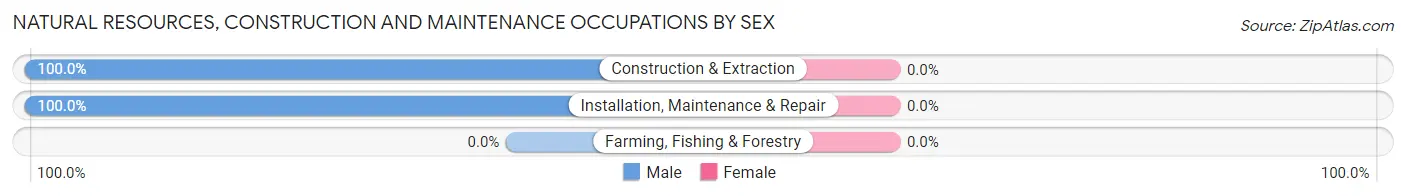
| Occupation | Male | Female |
| Farming, Fishing & Forestry | 0 (0.0%) | 0 (0.0%) |
| Construction & Extraction | 57 (100.0%) | 0 (0.0%) |
| Installation, Maintenance & Repair | 9 (100.0%) | 0 (0.0%) |
| Total (Category) | 66 (100.0%) | 0 (0.0%) |
| Total (Overall) | 497 (47.2%) | 555 (52.8%) |
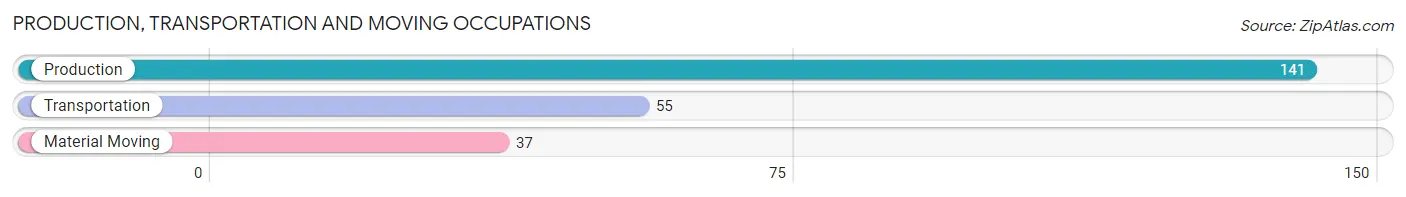
Production, Transportation and Moving Occupations
The most common Production, Transportation and Moving occupations in West are Production (141 | 13.4%), Transportation (55 | 5.2%), and Material Moving (37 | 3.5%).
Production, Transportation and Moving Occupations by Sex
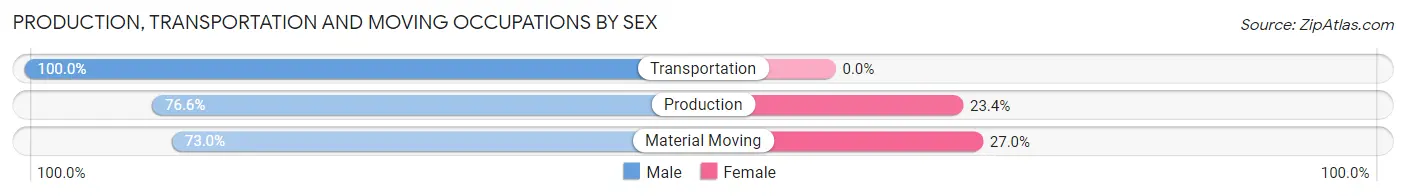
| Occupation | Male | Female |
| Production | 108 (76.6%) | 33 (23.4%) |
| Transportation | 55 (100.0%) | 0 (0.0%) |
| Material Moving | 27 (73.0%) | 10 (27.0%) |
| Total (Category) | 190 (81.6%) | 43 (18.4%) |
| Total (Overall) | 497 (47.2%) | 555 (52.8%) |
Employment Industries by Sex in West
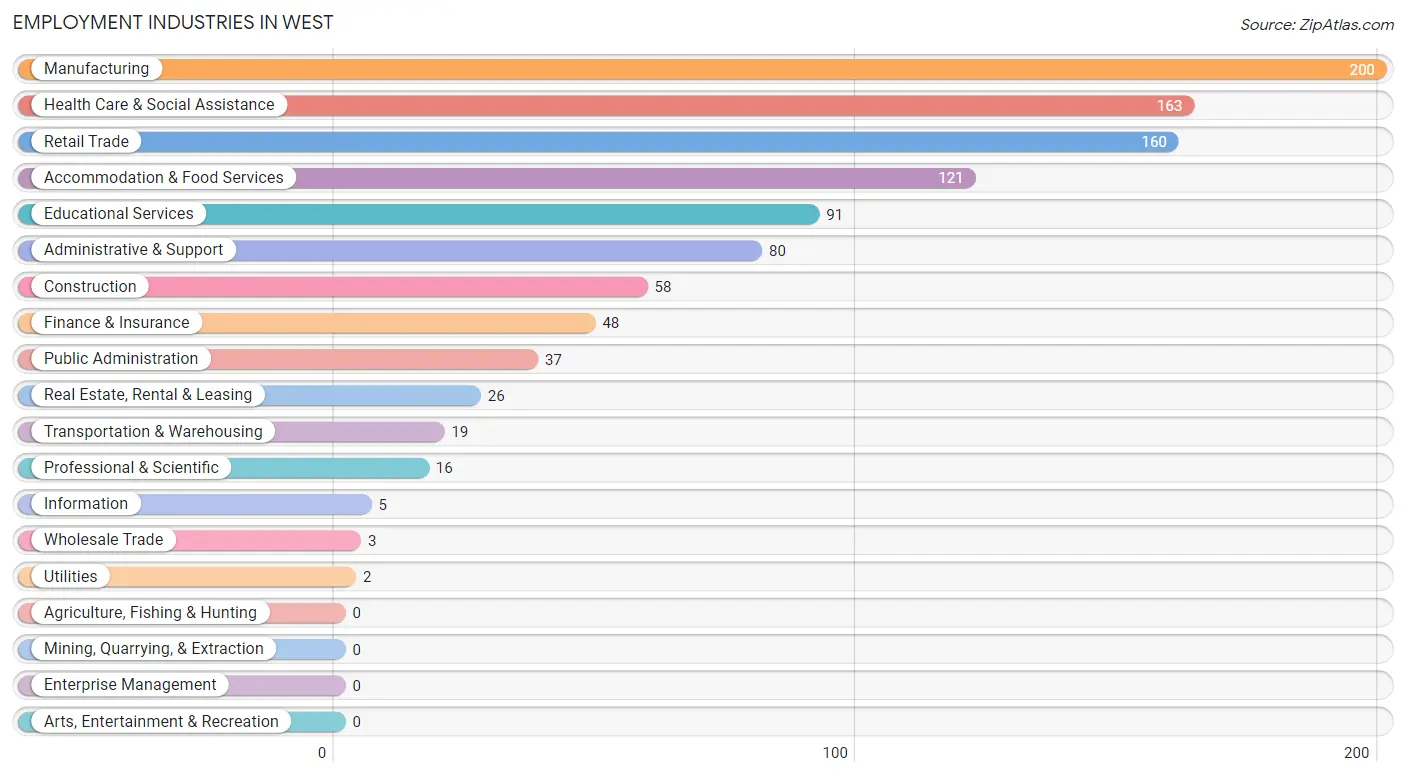
Employment Industries in West
The major employment industries in West include Manufacturing (200 | 19.0%), Health Care & Social Assistance (163 | 15.5%), Retail Trade (160 | 15.2%), Accommodation & Food Services (121 | 11.5%), and Educational Services (91 | 8.6%).
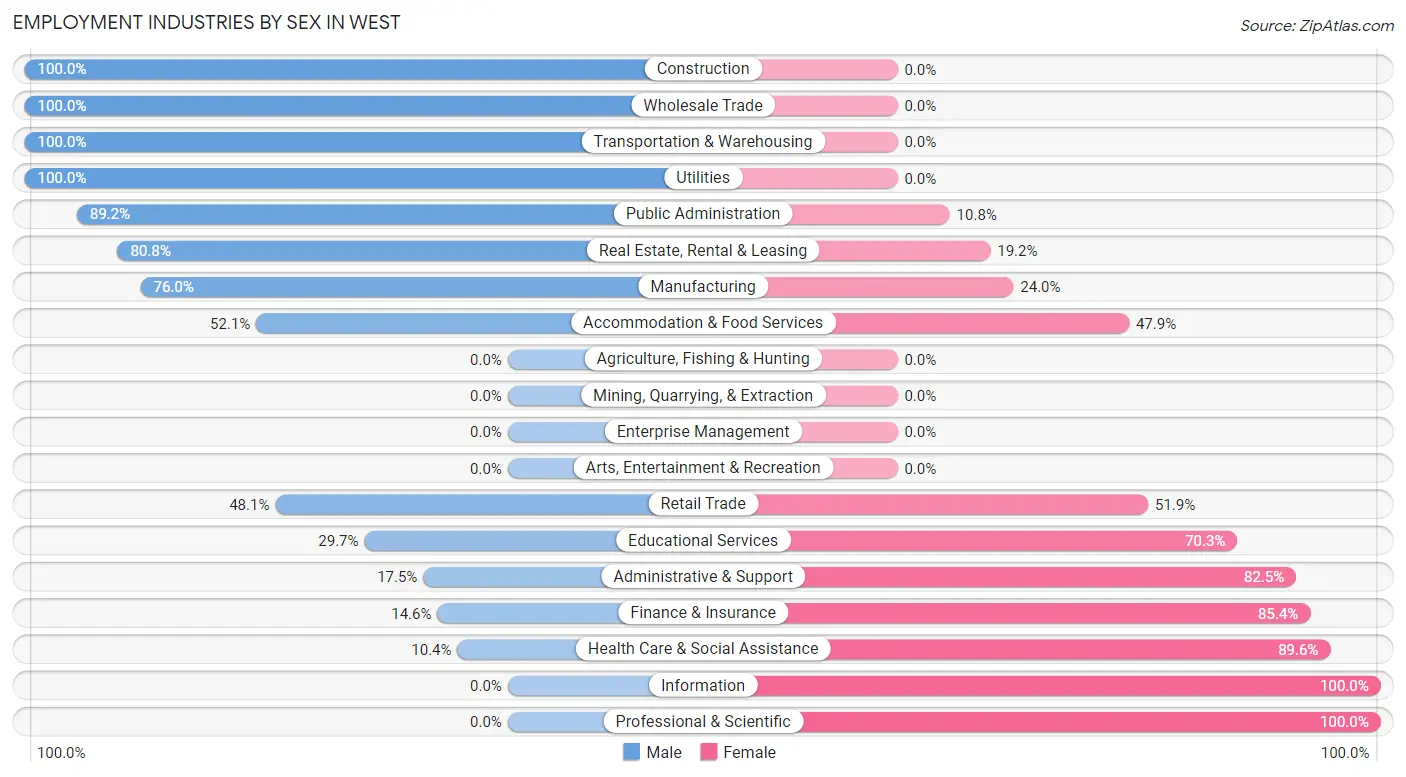
Employment Industries by Sex in West
The West industries that see more men than women are Construction (100.0%), Wholesale Trade (100.0%), and Transportation & Warehousing (100.0%), whereas the industries that tend to have a higher number of women are Information (100.0%), Professional & Scientific (100.0%), and Health Care & Social Assistance (89.6%).
| Industry | Male | Female |
| Agriculture, Fishing & Hunting | 0 (0.0%) | 0 (0.0%) |
| Mining, Quarrying, & Extraction | 0 (0.0%) | 0 (0.0%) |
| Construction | 58 (100.0%) | 0 (0.0%) |
| Manufacturing | 152 (76.0%) | 48 (24.0%) |
| Wholesale Trade | 3 (100.0%) | 0 (0.0%) |
| Retail Trade | 77 (48.1%) | 83 (51.9%) |
| Transportation & Warehousing | 19 (100.0%) | 0 (0.0%) |
| Utilities | 2 (100.0%) | 0 (0.0%) |
| Information | 0 (0.0%) | 5 (100.0%) |
| Finance & Insurance | 7 (14.6%) | 41 (85.4%) |
| Real Estate, Rental & Leasing | 21 (80.8%) | 5 (19.2%) |
| Professional & Scientific | 0 (0.0%) | 16 (100.0%) |
| Enterprise Management | 0 (0.0%) | 0 (0.0%) |
| Administrative & Support | 14 (17.5%) | 66 (82.5%) |
| Educational Services | 27 (29.7%) | 64 (70.3%) |
| Health Care & Social Assistance | 17 (10.4%) | 146 (89.6%) |
| Arts, Entertainment & Recreation | 0 (0.0%) | 0 (0.0%) |
| Accommodation & Food Services | 63 (52.1%) | 58 (47.9%) |
| Public Administration | 33 (89.2%) | 4 (10.8%) |
| Total | 497 (47.2%) | 555 (52.8%) |
Education in West
School Enrollment in West
The most common levels of schooling among the 672 students in West are elementary school (245 | 36.5%), college / undergraduate (145 | 21.6%), and middle school (122 | 18.1%).
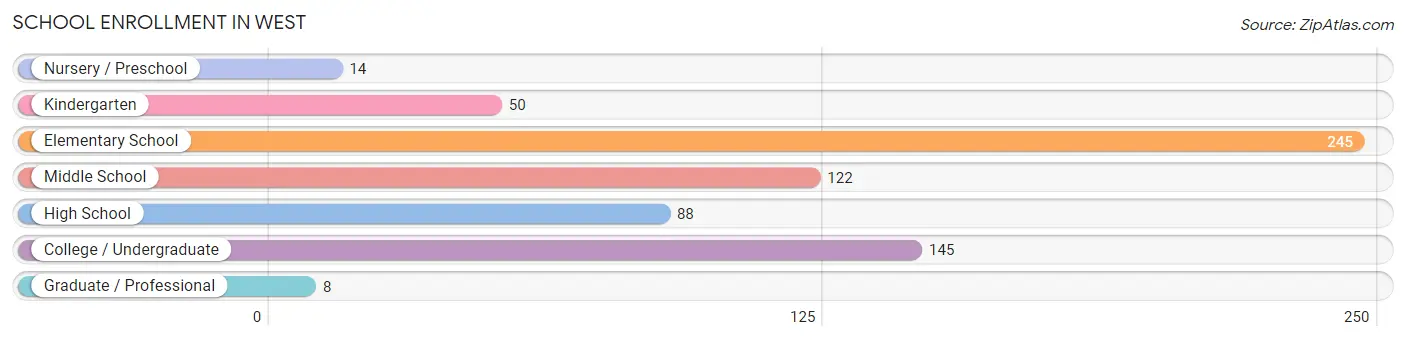
| School Level | # Students | % Students |
| Nursery / Preschool | 14 | 2.1% |
| Kindergarten | 50 | 7.4% |
| Elementary School | 245 | 36.5% |
| Middle School | 122 | 18.1% |
| High School | 88 | 13.1% |
| College / Undergraduate | 145 | 21.6% |
| Graduate / Professional | 8 | 1.2% |
| Total | 672 | 100.0% |
School Enrollment by Age by Funding Source in West
Out of a total of 672 students who are enrolled in schools in West, 88 (13.1%) attend a private institution, while the remaining 584 (86.9%) are enrolled in public schools. The age group of 35 years and over has the highest likelihood of being enrolled in private schools, with 18 (81.8% in the age bracket) enrolled. Conversely, the age group of 3 to 4 year olds has the lowest likelihood of being enrolled in a private school, with 14 (100.0% in the age bracket) attending a public institution.
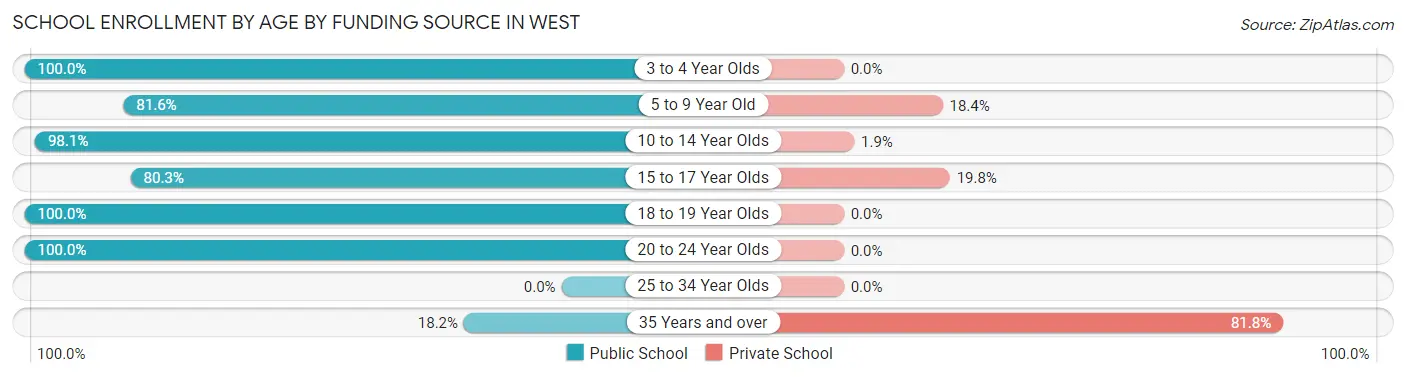
| Age Bracket | Public School | Private School |
| 3 to 4 Year Olds | 14 (100.0%) | 0 (0.0%) |
| 5 to 9 Year Old | 226 (81.6%) | 51 (18.4%) |
| 10 to 14 Year Olds | 152 (98.1%) | 3 (1.9%) |
| 15 to 17 Year Olds | 65 (80.2%) | 16 (19.8%) |
| 18 to 19 Year Olds | 37 (100.0%) | 0 (0.0%) |
| 20 to 24 Year Olds | 86 (100.0%) | 0 (0.0%) |
| 25 to 34 Year Olds | 0 (0.0%) | 0 (0.0%) |
| 35 Years and over | 4 (18.2%) | 18 (81.8%) |
| Total | 584 (86.9%) | 88 (13.1%) |
Educational Attainment by Field of Study in West
Education (54 | 18.9%), business (52 | 18.2%), visual & performing arts (49 | 17.1%), bio, nature & agricultural (25 | 8.7%), and science & technology (24 | 8.4%) are the most common fields of study among 286 individuals in West who have obtained a bachelor's degree or higher.
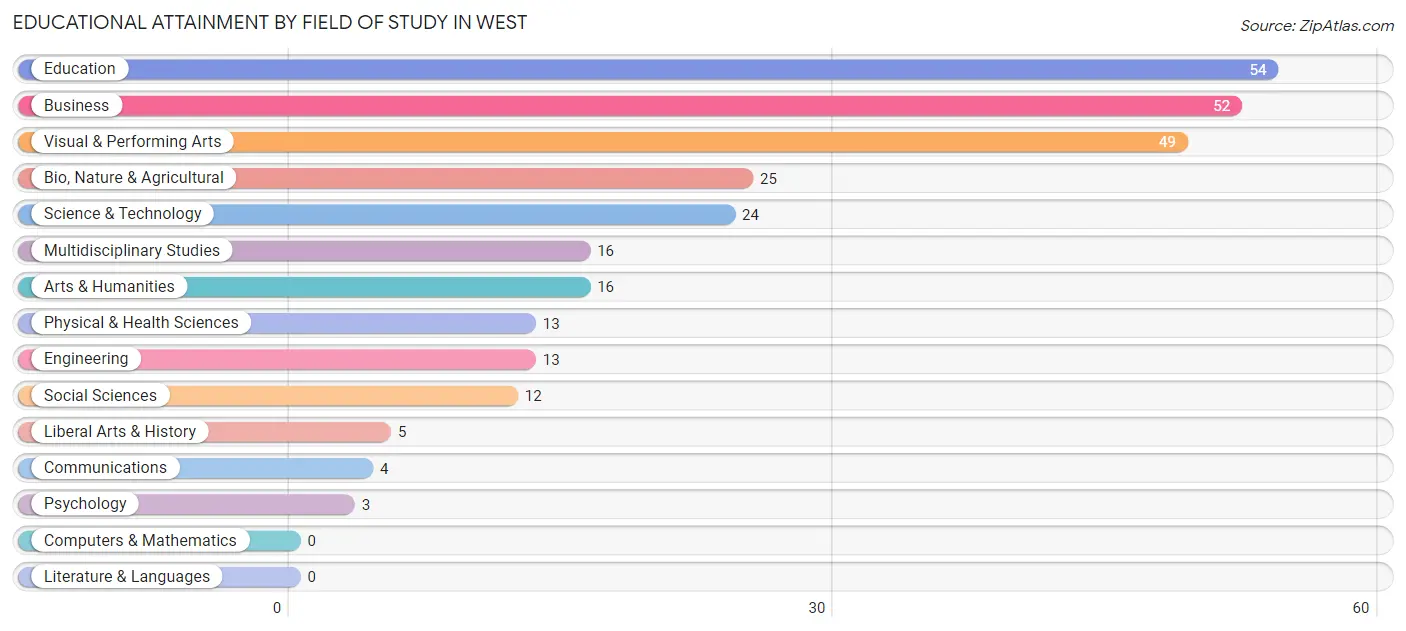
| Field of Study | # Graduates | % Graduates |
| Computers & Mathematics | 0 | 0.0% |
| Bio, Nature & Agricultural | 25 | 8.7% |
| Physical & Health Sciences | 13 | 4.5% |
| Psychology | 3 | 1.1% |
| Social Sciences | 12 | 4.2% |
| Engineering | 13 | 4.5% |
| Multidisciplinary Studies | 16 | 5.6% |
| Science & Technology | 24 | 8.4% |
| Business | 52 | 18.2% |
| Education | 54 | 18.9% |
| Literature & Languages | 0 | 0.0% |
| Liberal Arts & History | 5 | 1.8% |
| Visual & Performing Arts | 49 | 17.1% |
| Communications | 4 | 1.4% |
| Arts & Humanities | 16 | 5.6% |
| Total | 286 | 100.0% |
Transportation & Commute in West
Vehicle Availability by Sex in West
The most prevalent vehicle ownership categories in West are males with 2 vehicles (234, accounting for 46.8%) and females with 2 vehicles (236, making up 42.9%).
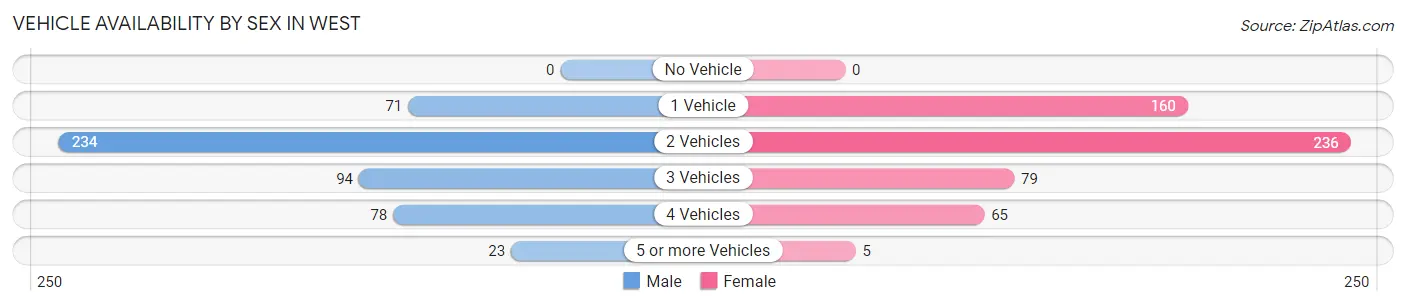
| Vehicles Available | Male | Female |
| No Vehicle | 0 (0.0%) | 0 (0.0%) |
| 1 Vehicle | 71 (14.2%) | 160 (29.4%) |
| 2 Vehicles | 234 (46.8%) | 236 (43.3%) |
| 3 Vehicles | 94 (18.8%) | 79 (14.5%) |
| 4 Vehicles | 78 (15.6%) | 65 (11.9%) |
| 5 or more Vehicles | 23 (4.6%) | 5 (0.9%) |
| Total | 500 (100.0%) | 545 (100.0%) |
Commute Time in West
The most frequently occuring commute durations in West are 30 to 34 minutes (202 commuters, 21.0%), 5 to 9 minutes (148 commuters, 15.4%), and 20 to 24 minutes (126 commuters, 13.1%).
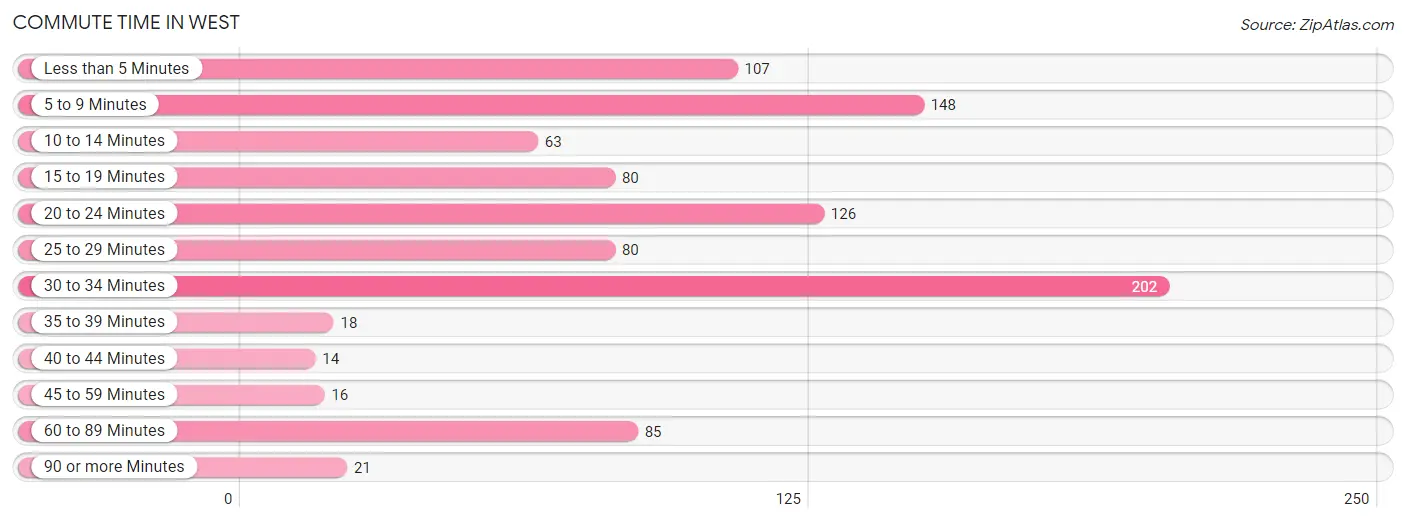
| Commute Time | # Commuters | % Commuters |
| Less than 5 Minutes | 107 | 11.2% |
| 5 to 9 Minutes | 148 | 15.4% |
| 10 to 14 Minutes | 63 | 6.6% |
| 15 to 19 Minutes | 80 | 8.3% |
| 20 to 24 Minutes | 126 | 13.1% |
| 25 to 29 Minutes | 80 | 8.3% |
| 30 to 34 Minutes | 202 | 21.0% |
| 35 to 39 Minutes | 18 | 1.9% |
| 40 to 44 Minutes | 14 | 1.5% |
| 45 to 59 Minutes | 16 | 1.7% |
| 60 to 89 Minutes | 85 | 8.8% |
| 90 or more Minutes | 21 | 2.2% |
Commute Time by Sex in West
The most common commute times in West are 30 to 34 minutes (82 commuters, 17.2%) for males and 30 to 34 minutes (120 commuters, 24.8%) for females.
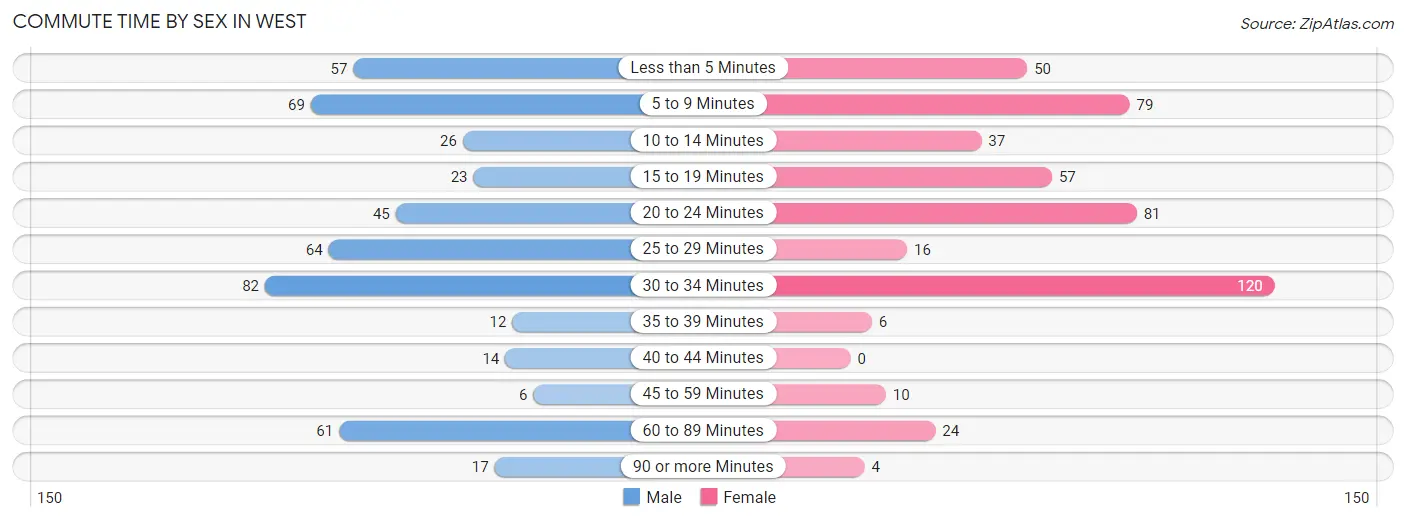
| Commute Time | Male | Female |
| Less than 5 Minutes | 57 (12.0%) | 50 (10.3%) |
| 5 to 9 Minutes | 69 (14.5%) | 79 (16.3%) |
| 10 to 14 Minutes | 26 (5.5%) | 37 (7.6%) |
| 15 to 19 Minutes | 23 (4.8%) | 57 (11.8%) |
| 20 to 24 Minutes | 45 (9.5%) | 81 (16.7%) |
| 25 to 29 Minutes | 64 (13.5%) | 16 (3.3%) |
| 30 to 34 Minutes | 82 (17.2%) | 120 (24.8%) |
| 35 to 39 Minutes | 12 (2.5%) | 6 (1.2%) |
| 40 to 44 Minutes | 14 (2.9%) | 0 (0.0%) |
| 45 to 59 Minutes | 6 (1.3%) | 10 (2.1%) |
| 60 to 89 Minutes | 61 (12.8%) | 24 (5.0%) |
| 90 or more Minutes | 17 (3.6%) | 4 (0.8%) |
Time of Departure to Work by Sex in West
The most frequent times of departure to work in West are 7:00 AM to 7:29 AM (99, 20.8%) for males and 7:30 AM to 7:59 AM (88, 18.2%) for females.
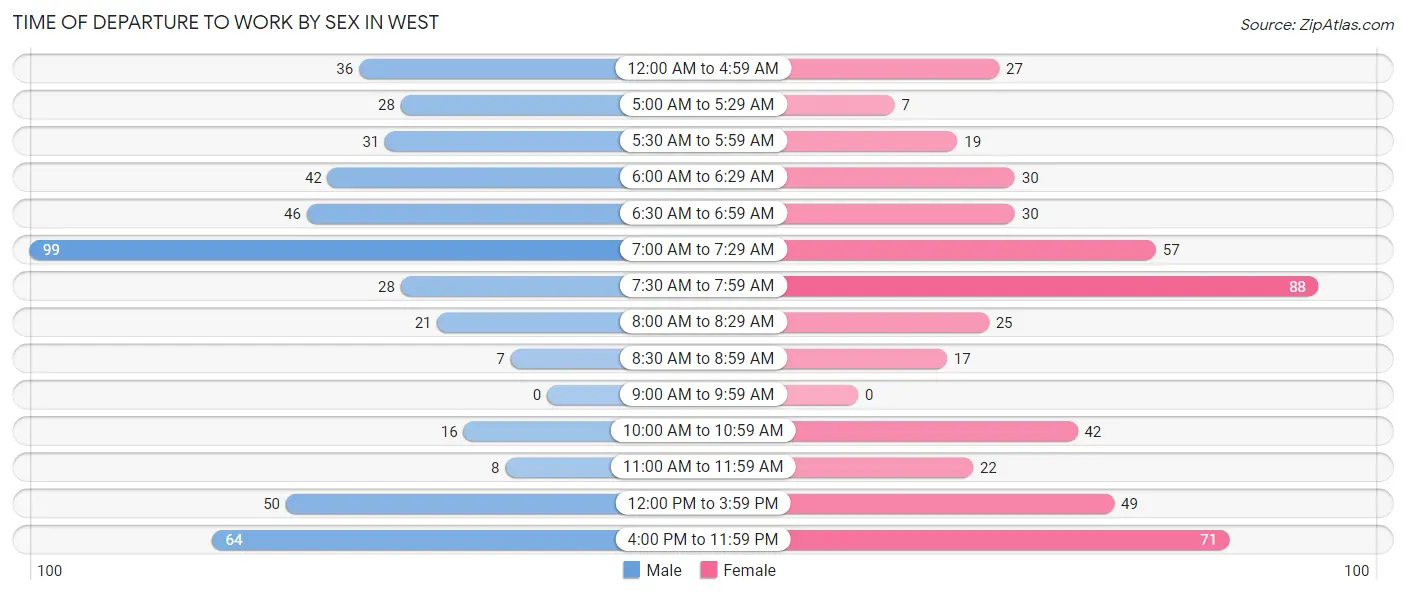
| Time of Departure | Male | Female |
| 12:00 AM to 4:59 AM | 36 (7.6%) | 27 (5.6%) |
| 5:00 AM to 5:29 AM | 28 (5.9%) | 7 (1.5%) |
| 5:30 AM to 5:59 AM | 31 (6.5%) | 19 (3.9%) |
| 6:00 AM to 6:29 AM | 42 (8.8%) | 30 (6.2%) |
| 6:30 AM to 6:59 AM | 46 (9.7%) | 30 (6.2%) |
| 7:00 AM to 7:29 AM | 99 (20.8%) | 57 (11.8%) |
| 7:30 AM to 7:59 AM | 28 (5.9%) | 88 (18.2%) |
| 8:00 AM to 8:29 AM | 21 (4.4%) | 25 (5.2%) |
| 8:30 AM to 8:59 AM | 7 (1.5%) | 17 (3.5%) |
| 9:00 AM to 9:59 AM | 0 (0.0%) | 0 (0.0%) |
| 10:00 AM to 10:59 AM | 16 (3.4%) | 42 (8.7%) |
| 11:00 AM to 11:59 AM | 8 (1.7%) | 22 (4.5%) |
| 12:00 PM to 3:59 PM | 50 (10.5%) | 49 (10.1%) |
| 4:00 PM to 11:59 PM | 64 (13.5%) | 71 (14.7%) |
| Total | 476 (100.0%) | 484 (100.0%) |
Housing Occupancy in West
Occupancy by Ownership in West
Of the total 898 dwellings in West, owner-occupied units account for 542 (60.4%), while renter-occupied units make up 356 (39.6%).
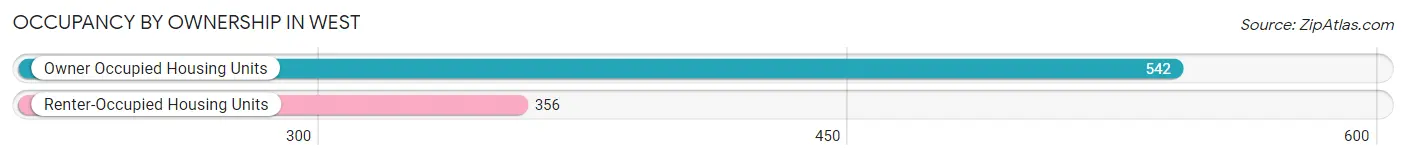
| Occupancy | # Housing Units | % Housing Units |
| Owner Occupied Housing Units | 542 | 60.4% |
| Renter-Occupied Housing Units | 356 | 39.6% |
| Total Occupied Housing Units | 898 | 100.0% |
Occupancy by Household Size in West
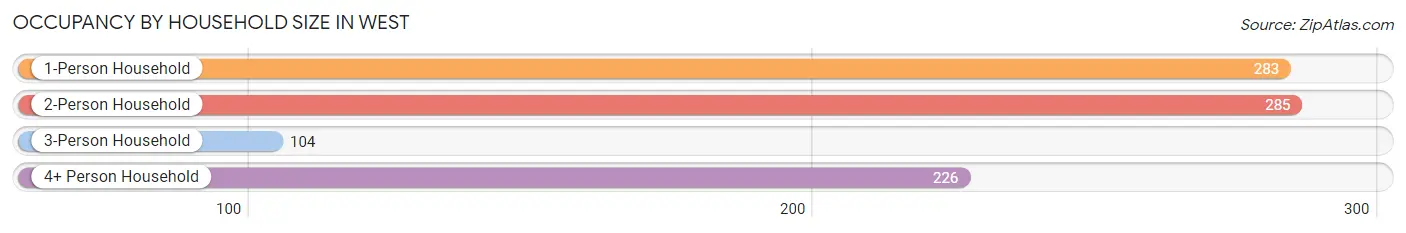
| Household Size | # Housing Units | % Housing Units |
| 1-Person Household | 283 | 31.5% |
| 2-Person Household | 285 | 31.7% |
| 3-Person Household | 104 | 11.6% |
| 4+ Person Household | 226 | 25.2% |
| Total Housing Units | 898 | 100.0% |
Occupancy by Ownership by Household Size in West
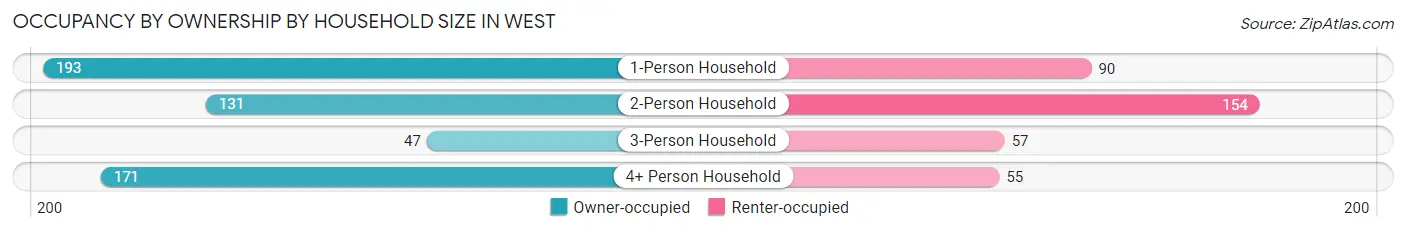
| Household Size | Owner-occupied | Renter-occupied |
| 1-Person Household | 193 (68.2%) | 90 (31.8%) |
| 2-Person Household | 131 (46.0%) | 154 (54.0%) |
| 3-Person Household | 47 (45.2%) | 57 (54.8%) |
| 4+ Person Household | 171 (75.7%) | 55 (24.3%) |
| Total Housing Units | 542 (60.4%) | 356 (39.6%) |
Occupancy by Educational Attainment in West
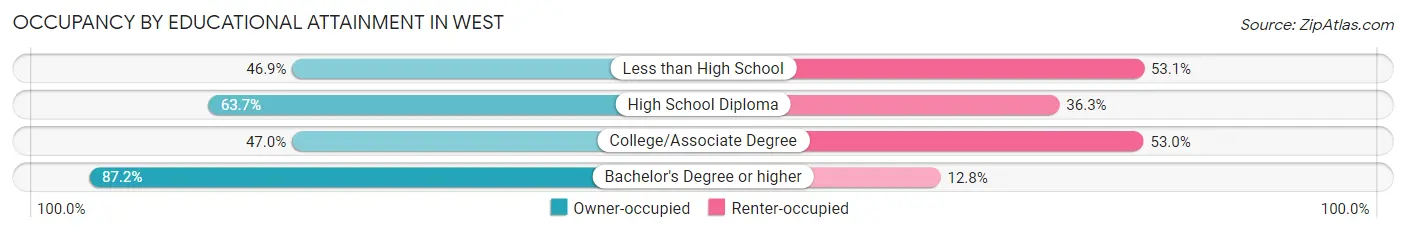
| Household Size | Owner-occupied | Renter-occupied |
| Less than High School | 91 (46.9%) | 103 (53.1%) |
| High School Diploma | 170 (63.7%) | 97 (36.3%) |
| College/Associate Degree | 117 (47.0%) | 132 (53.0%) |
| Bachelor's Degree or higher | 164 (87.2%) | 24 (12.8%) |
Occupancy by Age of Householder in West
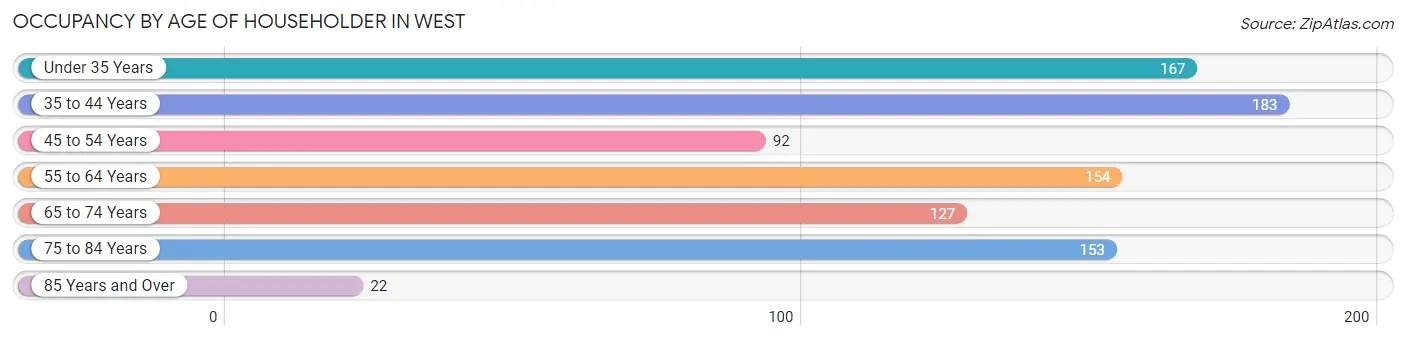
| Age Bracket | # Households | % Households |
| Under 35 Years | 167 | 18.6% |
| 35 to 44 Years | 183 | 20.4% |
| 45 to 54 Years | 92 | 10.2% |
| 55 to 64 Years | 154 | 17.2% |
| 65 to 74 Years | 127 | 14.1% |
| 75 to 84 Years | 153 | 17.0% |
| 85 Years and Over | 22 | 2.5% |
| Total | 898 | 100.0% |
Housing Finances in West
Median Income by Occupancy in West
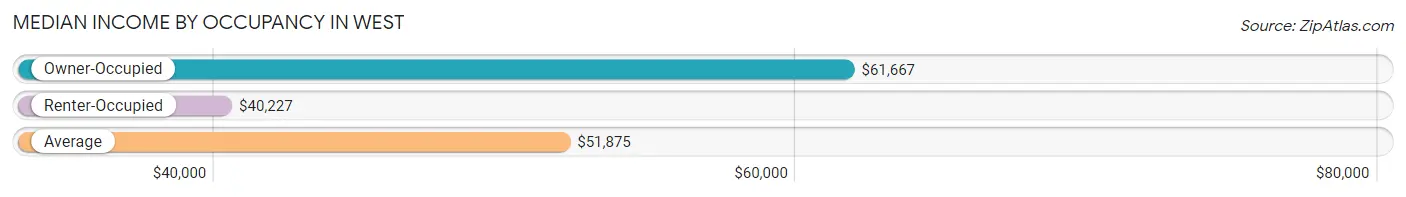
| Occupancy Type | # Households | Median Income |
| Owner-Occupied | 542 (60.4%) | $61,667 |
| Renter-Occupied | 356 (39.6%) | $40,227 |
| Average | 898 (100.0%) | $51,875 |
Occupancy by Householder Income Bracket in West
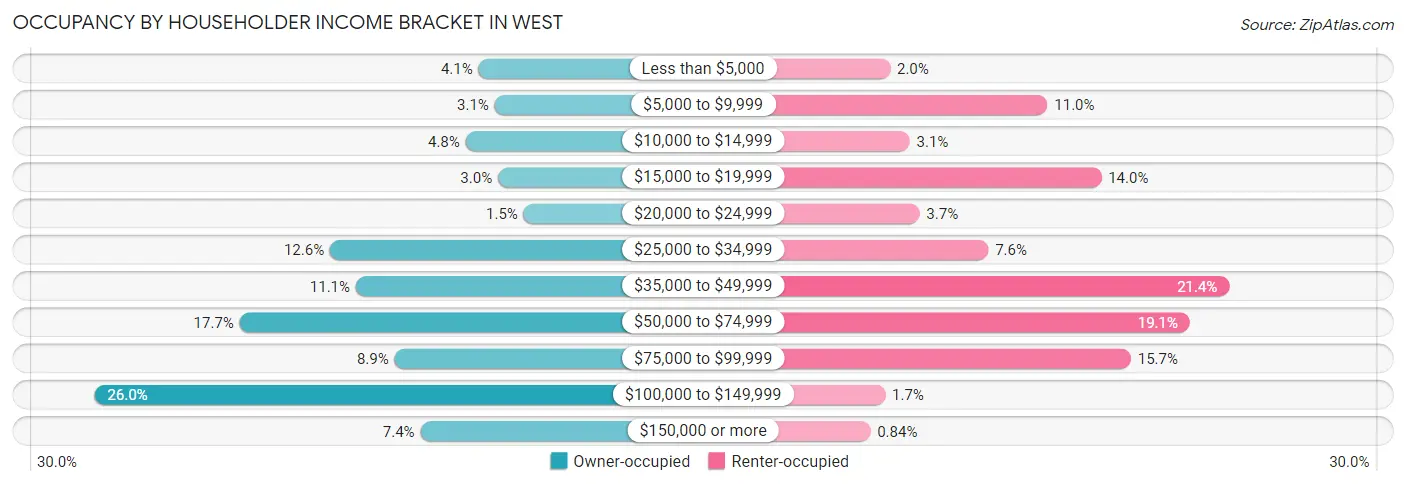
| Income Bracket | Owner-occupied | Renter-occupied |
| Less than $5,000 | 22 (4.1%) | 7 (2.0%) |
| $5,000 to $9,999 | 17 (3.1%) | 39 (11.0%) |
| $10,000 to $14,999 | 26 (4.8%) | 11 (3.1%) |
| $15,000 to $19,999 | 16 (2.9%) | 50 (14.0%) |
| $20,000 to $24,999 | 8 (1.5%) | 13 (3.6%) |
| $25,000 to $34,999 | 68 (12.6%) | 27 (7.6%) |
| $35,000 to $49,999 | 60 (11.1%) | 76 (21.3%) |
| $50,000 to $74,999 | 96 (17.7%) | 68 (19.1%) |
| $75,000 to $99,999 | 48 (8.9%) | 56 (15.7%) |
| $100,000 to $149,999 | 141 (26.0%) | 6 (1.7%) |
| $150,000 or more | 40 (7.4%) | 3 (0.8%) |
| Total | 542 (100.0%) | 356 (100.0%) |
Monthly Housing Cost Tiers in West
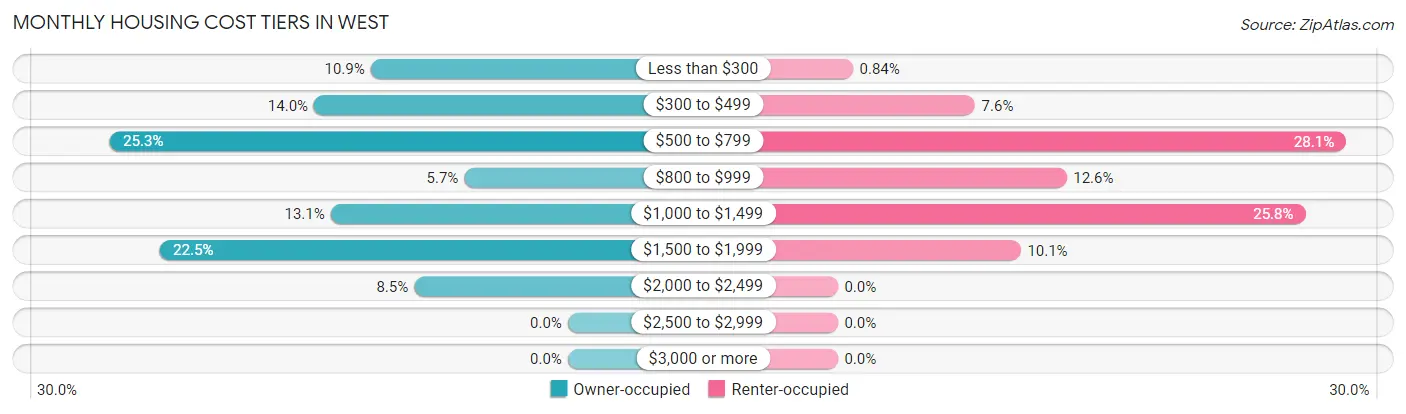
| Monthly Cost | Owner-occupied | Renter-occupied |
| Less than $300 | 59 (10.9%) | 3 (0.8%) |
| $300 to $499 | 76 (14.0%) | 27 (7.6%) |
| $500 to $799 | 137 (25.3%) | 100 (28.1%) |
| $800 to $999 | 31 (5.7%) | 45 (12.6%) |
| $1,000 to $1,499 | 71 (13.1%) | 92 (25.8%) |
| $1,500 to $1,999 | 122 (22.5%) | 36 (10.1%) |
| $2,000 to $2,499 | 46 (8.5%) | 0 (0.0%) |
| $2,500 to $2,999 | 0 (0.0%) | 0 (0.0%) |
| $3,000 or more | 0 (0.0%) | 0 (0.0%) |
| Total | 542 (100.0%) | 356 (100.0%) |
Physical Housing Characteristics in West
Housing Structures in West
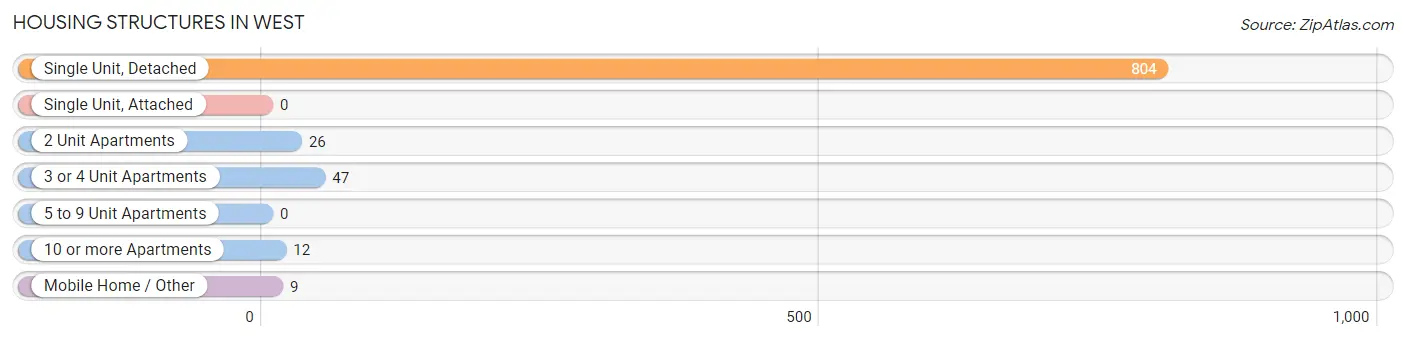
| Structure Type | # Housing Units | % Housing Units |
| Single Unit, Detached | 804 | 89.5% |
| Single Unit, Attached | 0 | 0.0% |
| 2 Unit Apartments | 26 | 2.9% |
| 3 or 4 Unit Apartments | 47 | 5.2% |
| 5 to 9 Unit Apartments | 0 | 0.0% |
| 10 or more Apartments | 12 | 1.3% |
| Mobile Home / Other | 9 | 1.0% |
| Total | 898 | 100.0% |
Housing Structures by Occupancy in West
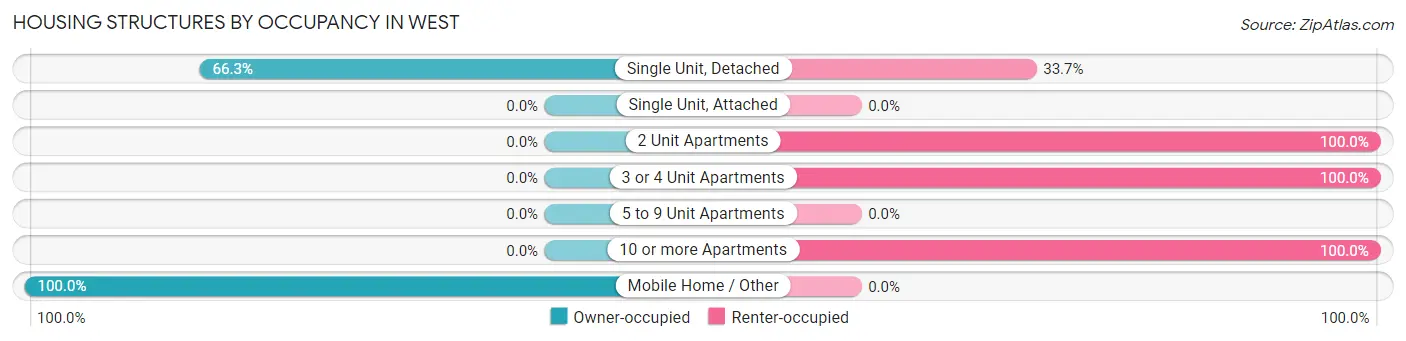
| Structure Type | Owner-occupied | Renter-occupied |
| Single Unit, Detached | 533 (66.3%) | 271 (33.7%) |
| Single Unit, Attached | 0 (0.0%) | 0 (0.0%) |
| 2 Unit Apartments | 0 (0.0%) | 26 (100.0%) |
| 3 or 4 Unit Apartments | 0 (0.0%) | 47 (100.0%) |
| 5 to 9 Unit Apartments | 0 (0.0%) | 0 (0.0%) |
| 10 or more Apartments | 0 (0.0%) | 12 (100.0%) |
| Mobile Home / Other | 9 (100.0%) | 0 (0.0%) |
| Total | 542 (60.4%) | 356 (39.6%) |
Housing Structures by Number of Rooms in West
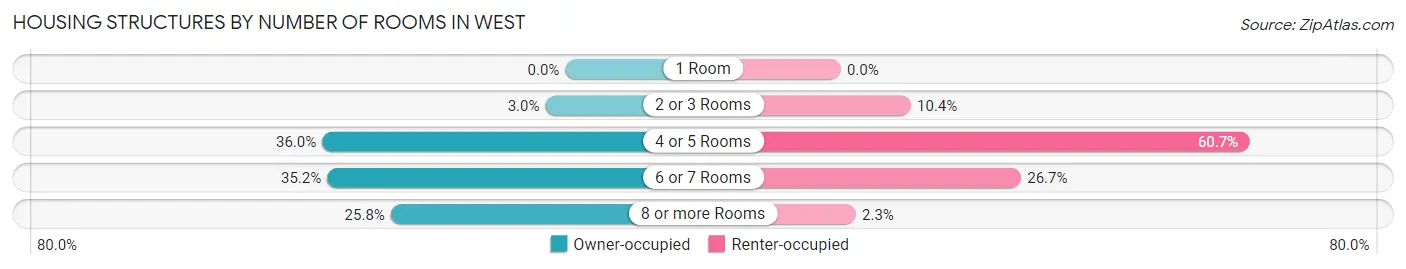
| Number of Rooms | Owner-occupied | Renter-occupied |
| 1 Room | 0 (0.0%) | 0 (0.0%) |
| 2 or 3 Rooms | 16 (2.9%) | 37 (10.4%) |
| 4 or 5 Rooms | 195 (36.0%) | 216 (60.7%) |
| 6 or 7 Rooms | 191 (35.2%) | 95 (26.7%) |
| 8 or more Rooms | 140 (25.8%) | 8 (2.2%) |
| Total | 542 (100.0%) | 356 (100.0%) |
Housing Structure by Heating Type in West
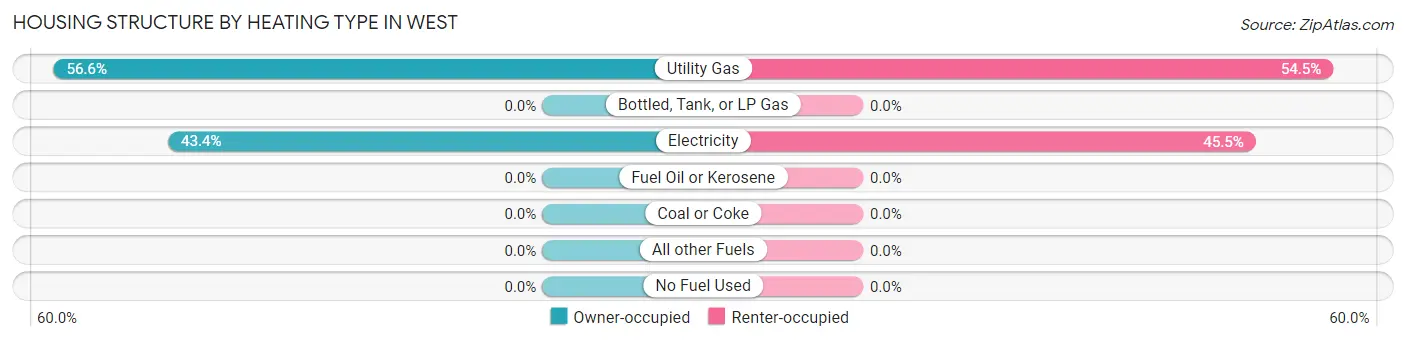
| Heating Type | Owner-occupied | Renter-occupied |
| Utility Gas | 307 (56.6%) | 194 (54.5%) |
| Bottled, Tank, or LP Gas | 0 (0.0%) | 0 (0.0%) |
| Electricity | 235 (43.4%) | 162 (45.5%) |
| Fuel Oil or Kerosene | 0 (0.0%) | 0 (0.0%) |
| Coal or Coke | 0 (0.0%) | 0 (0.0%) |
| All other Fuels | 0 (0.0%) | 0 (0.0%) |
| No Fuel Used | 0 (0.0%) | 0 (0.0%) |
| Total | 542 (100.0%) | 356 (100.0%) |
Household Vehicle Usage in West
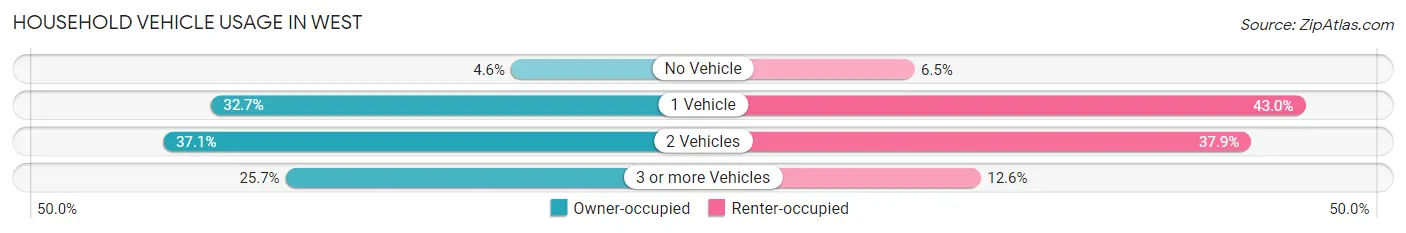
| Vehicles per Household | Owner-occupied | Renter-occupied |
| No Vehicle | 25 (4.6%) | 23 (6.5%) |
| 1 Vehicle | 177 (32.7%) | 153 (43.0%) |
| 2 Vehicles | 201 (37.1%) | 135 (37.9%) |
| 3 or more Vehicles | 139 (25.7%) | 45 (12.6%) |
| Total | 542 (100.0%) | 356 (100.0%) |
Real Estate & Mortgages in West
Real Estate and Mortgage Overview in West
| Characteristic | Without Mortgage | With Mortgage |
| Housing Units | 289 | 253 |
| Median Property Value | $130,200 | $171,100 |
| Median Household Income | $42,917 | $20 |
| Monthly Housing Costs | $515 | $0 |
| Real Estate Taxes | $1,943 | $0 |
Property Value by Mortgage Status in West
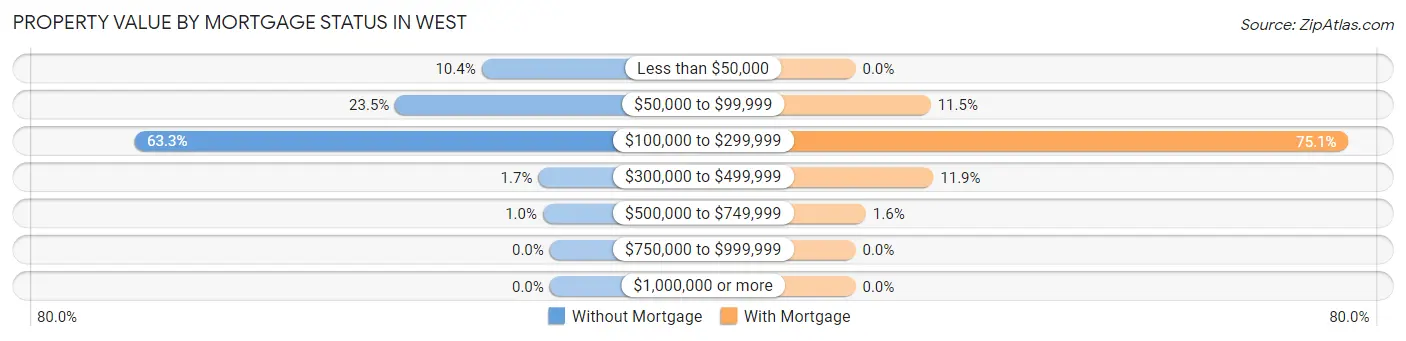
| Property Value | Without Mortgage | With Mortgage |
| Less than $50,000 | 30 (10.4%) | 0 (0.0%) |
| $50,000 to $99,999 | 68 (23.5%) | 29 (11.5%) |
| $100,000 to $299,999 | 183 (63.3%) | 190 (75.1%) |
| $300,000 to $499,999 | 5 (1.7%) | 30 (11.9%) |
| $500,000 to $749,999 | 3 (1.0%) | 4 (1.6%) |
| $750,000 to $999,999 | 0 (0.0%) | 0 (0.0%) |
| $1,000,000 or more | 0 (0.0%) | 0 (0.0%) |
| Total | 289 (100.0%) | 253 (100.0%) |
Household Income by Mortgage Status in West
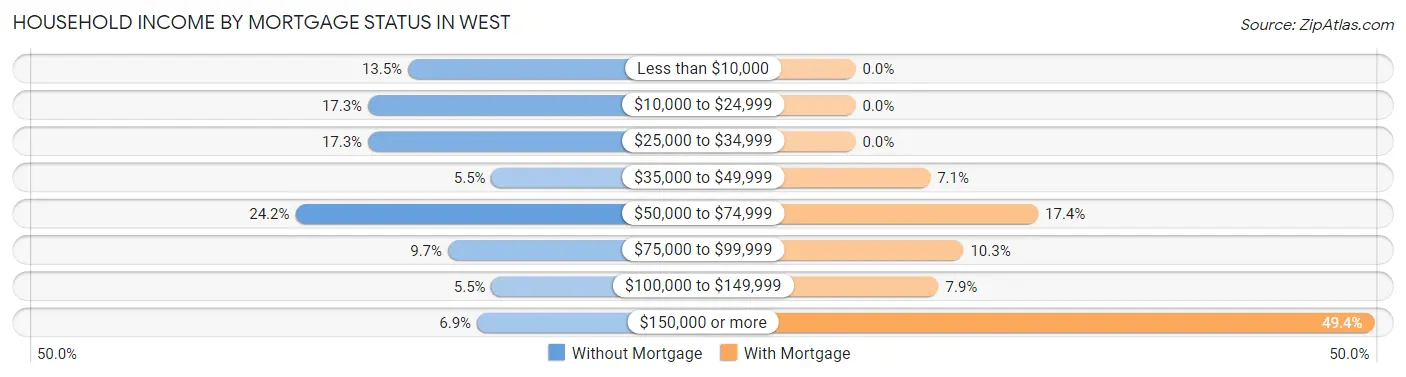
| Household Income | Without Mortgage | With Mortgage |
| Less than $10,000 | 39 (13.5%) | 0 (0.0%) |
| $10,000 to $24,999 | 50 (17.3%) | 0 (0.0%) |
| $25,000 to $34,999 | 50 (17.3%) | 0 (0.0%) |
| $35,000 to $49,999 | 16 (5.5%) | 18 (7.1%) |
| $50,000 to $74,999 | 70 (24.2%) | 44 (17.4%) |
| $75,000 to $99,999 | 28 (9.7%) | 26 (10.3%) |
| $100,000 to $149,999 | 16 (5.5%) | 20 (7.9%) |
| $150,000 or more | 20 (6.9%) | 125 (49.4%) |
| Total | 289 (100.0%) | 253 (100.0%) |
Property Value to Household Income Ratio in West
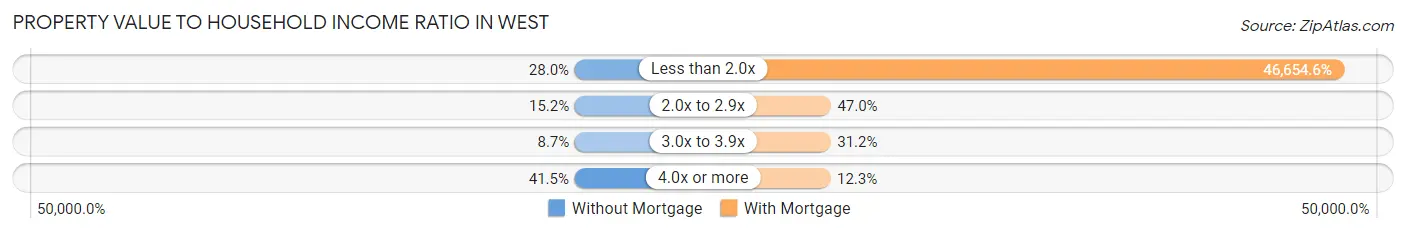
| Value-to-Income Ratio | Without Mortgage | With Mortgage |
| Less than 2.0x | 81 (28.0%) | 118,036 (46,654.6%) |
| 2.0x to 2.9x | 44 (15.2%) | 119 (47.0%) |
| 3.0x to 3.9x | 25 (8.6%) | 79 (31.2%) |
| 4.0x or more | 120 (41.5%) | 31 (12.2%) |
| Total | 289 (100.0%) | 253 (100.0%) |
Real Estate Taxes by Mortgage Status in West
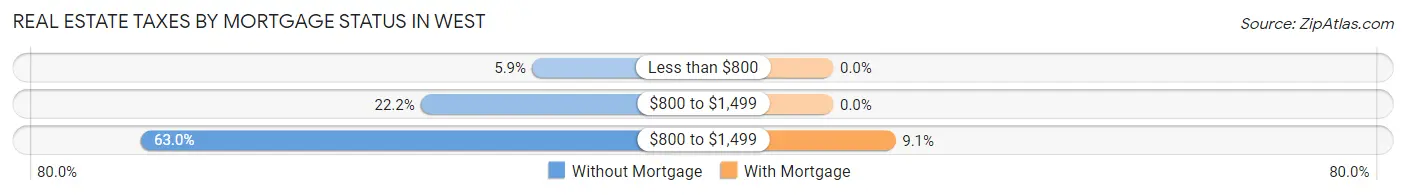
| Property Taxes | Without Mortgage | With Mortgage |
| Less than $800 | 17 (5.9%) | 0 (0.0%) |
| $800 to $1,499 | 64 (22.2%) | 0 (0.0%) |
| $800 to $1,499 | 182 (63.0%) | 23 (9.1%) |
| Total | 289 (100.0%) | 253 (100.0%) |
Health & Disability in West
Health Insurance Coverage by Age in West
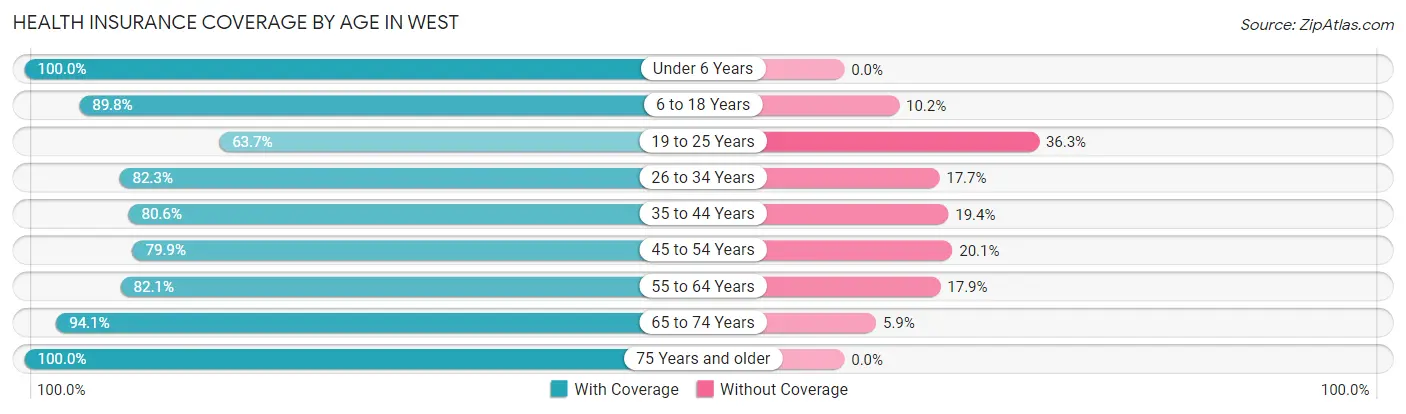
| Age Bracket | With Coverage | Without Coverage |
| Under 6 Years | 213 (100.0%) | 0 (0.0%) |
| 6 to 18 Years | 466 (89.8%) | 53 (10.2%) |
| 19 to 25 Years | 193 (63.7%) | 110 (36.3%) |
| 26 to 34 Years | 223 (82.3%) | 48 (17.7%) |
| 35 to 44 Years | 237 (80.6%) | 57 (19.4%) |
| 45 to 54 Years | 115 (79.9%) | 29 (20.1%) |
| 55 to 64 Years | 243 (82.1%) | 53 (17.9%) |
| 65 to 74 Years | 159 (94.1%) | 10 (5.9%) |
| 75 Years and older | 209 (100.0%) | 0 (0.0%) |
| Total | 2,058 (85.1%) | 360 (14.9%) |
Health Insurance Coverage by Citizenship Status in West
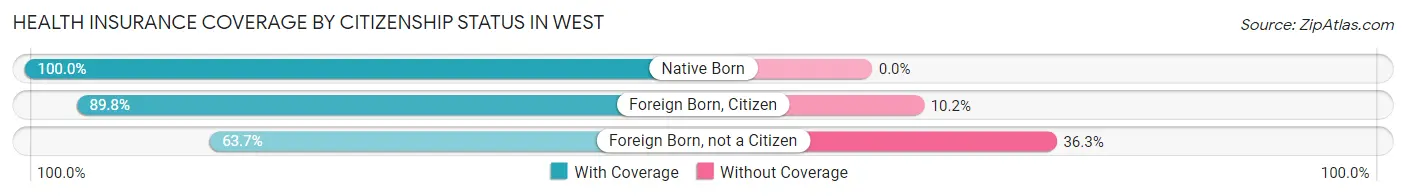
| Citizenship Status | With Coverage | Without Coverage |
| Native Born | 213 (100.0%) | 0 (0.0%) |
| Foreign Born, Citizen | 466 (89.8%) | 53 (10.2%) |
| Foreign Born, not a Citizen | 193 (63.7%) | 110 (36.3%) |
Health Insurance Coverage by Household Income in West
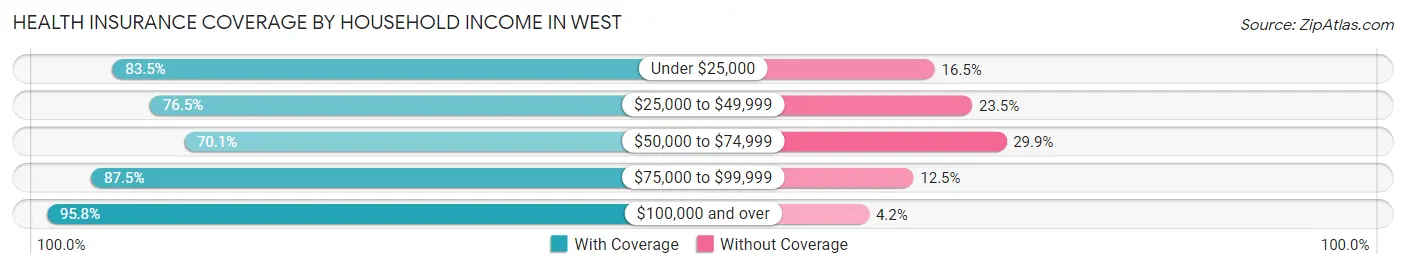
| Household Income | With Coverage | Without Coverage |
| Under $25,000 | 264 (83.5%) | 52 (16.5%) |
| $25,000 to $49,999 | 378 (76.5%) | 116 (23.5%) |
| $50,000 to $74,999 | 256 (70.1%) | 109 (29.9%) |
| $75,000 to $99,999 | 330 (87.5%) | 47 (12.5%) |
| $100,000 and over | 830 (95.8%) | 36 (4.2%) |
Public vs Private Health Insurance Coverage by Age in West
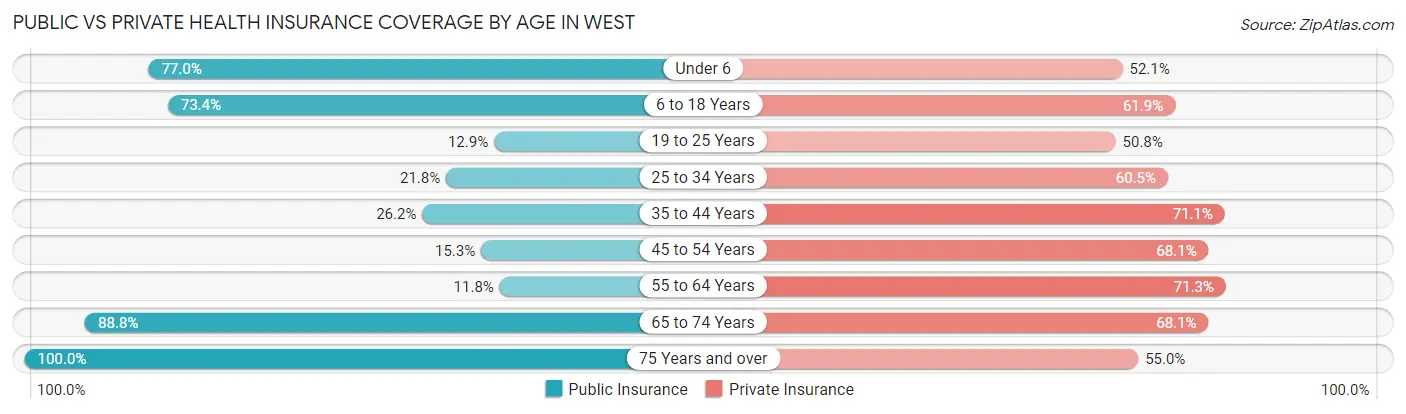
| Age Bracket | Public Insurance | Private Insurance |
| Under 6 | 164 (77.0%) | 111 (52.1%) |
| 6 to 18 Years | 381 (73.4%) | 321 (61.9%) |
| 19 to 25 Years | 39 (12.9%) | 154 (50.8%) |
| 25 to 34 Years | 59 (21.8%) | 164 (60.5%) |
| 35 to 44 Years | 77 (26.2%) | 209 (71.1%) |
| 45 to 54 Years | 22 (15.3%) | 98 (68.1%) |
| 55 to 64 Years | 35 (11.8%) | 211 (71.3%) |
| 65 to 74 Years | 150 (88.8%) | 115 (68.0%) |
| 75 Years and over | 209 (100.0%) | 115 (55.0%) |
| Total | 1,136 (47.0%) | 1,498 (62.0%) |
Disability Status by Sex by Age in West
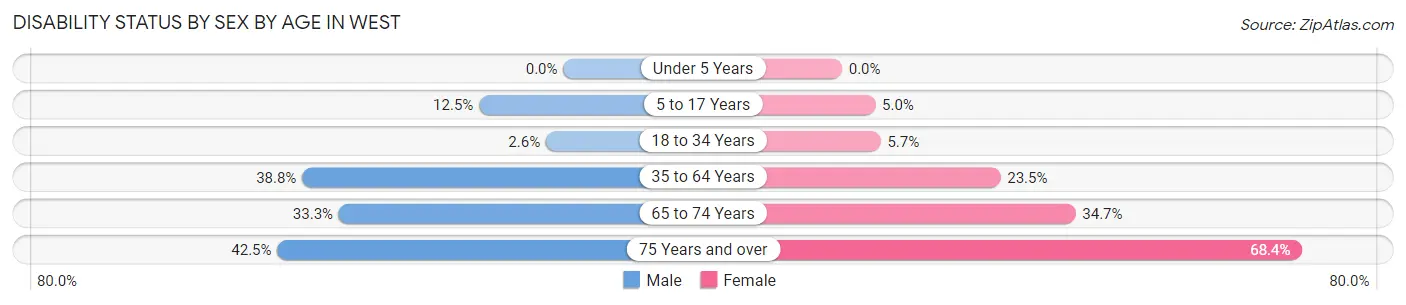
| Age Bracket | Male | Female |
| Under 5 Years | 0 (0.0%) | 0 (0.0%) |
| 5 to 17 Years | 17 (12.5%) | 19 (5.0%) |
| 18 to 34 Years | 7 (2.6%) | 19 (5.7%) |
| 35 to 64 Years | 133 (38.8%) | 92 (23.5%) |
| 65 to 74 Years | 15 (33.3%) | 43 (34.7%) |
| 75 Years and over | 31 (42.5%) | 93 (68.4%) |
Disability Class by Sex by Age in West
Disability Class: Hearing Difficulty
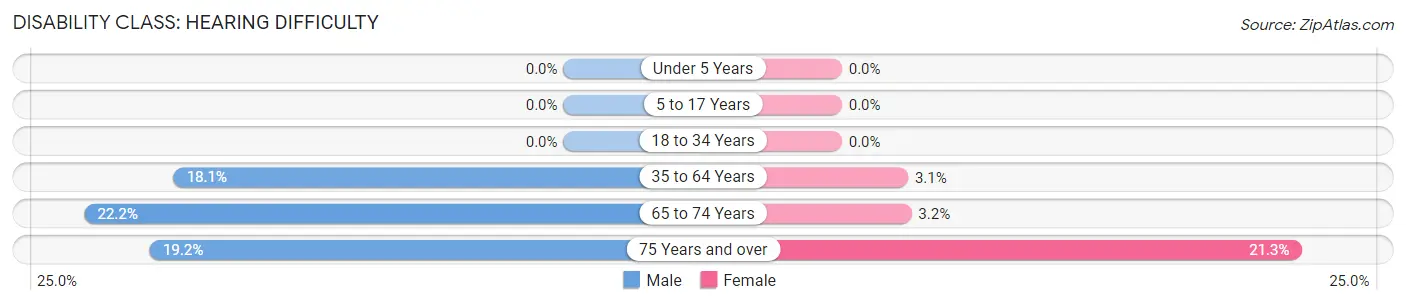
| Age Bracket | Male | Female |
| Under 5 Years | 0 (0.0%) | 0 (0.0%) |
| 5 to 17 Years | 0 (0.0%) | 0 (0.0%) |
| 18 to 34 Years | 0 (0.0%) | 0 (0.0%) |
| 35 to 64 Years | 62 (18.1%) | 12 (3.1%) |
| 65 to 74 Years | 10 (22.2%) | 4 (3.2%) |
| 75 Years and over | 14 (19.2%) | 29 (21.3%) |
Disability Class: Vision Difficulty
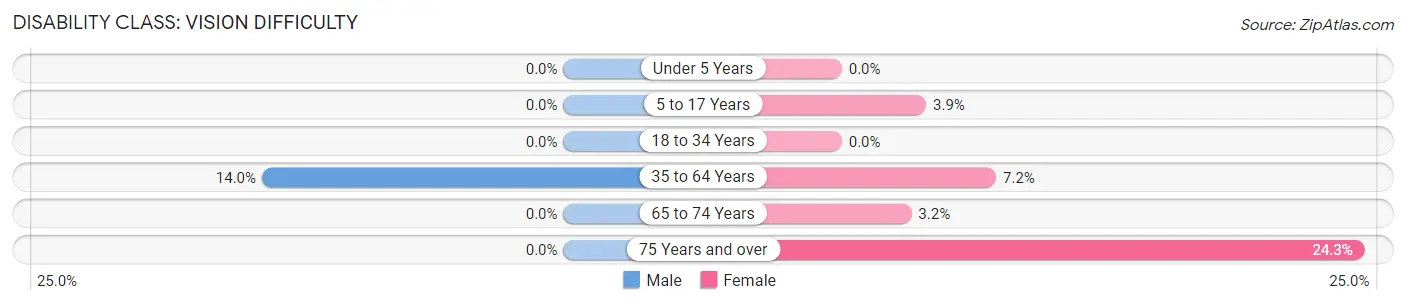
| Age Bracket | Male | Female |
| Under 5 Years | 0 (0.0%) | 0 (0.0%) |
| 5 to 17 Years | 0 (0.0%) | 15 (3.9%) |
| 18 to 34 Years | 0 (0.0%) | 0 (0.0%) |
| 35 to 64 Years | 48 (14.0%) | 28 (7.2%) |
| 65 to 74 Years | 0 (0.0%) | 4 (3.2%) |
| 75 Years and over | 0 (0.0%) | 33 (24.3%) |
Disability Class: Cognitive Difficulty
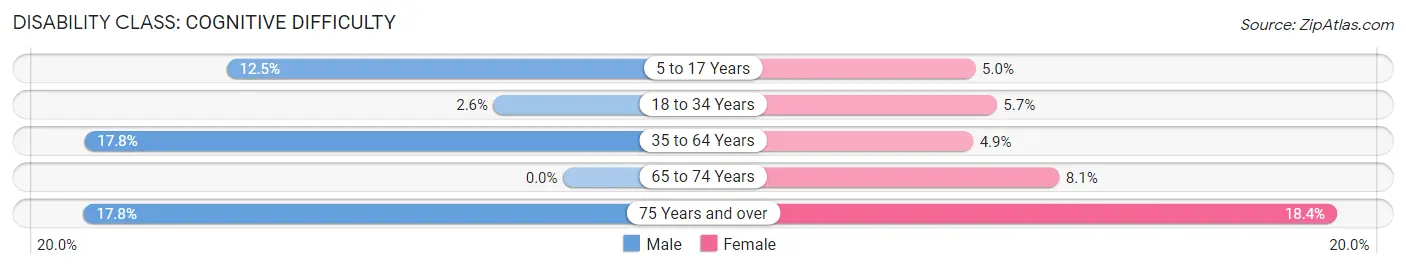
| Age Bracket | Male | Female |
| 5 to 17 Years | 17 (12.5%) | 19 (5.0%) |
| 18 to 34 Years | 7 (2.6%) | 19 (5.7%) |
| 35 to 64 Years | 61 (17.8%) | 19 (4.9%) |
| 65 to 74 Years | 0 (0.0%) | 10 (8.1%) |
| 75 Years and over | 13 (17.8%) | 25 (18.4%) |
Disability Class: Ambulatory Difficulty
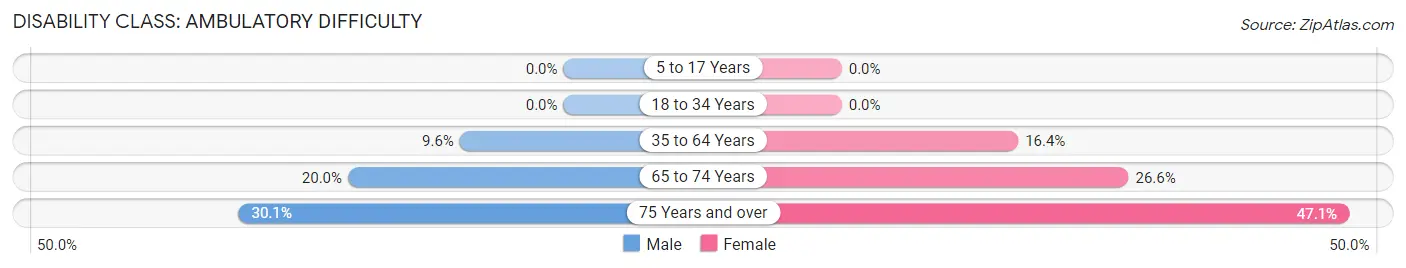
| Age Bracket | Male | Female |
| 5 to 17 Years | 0 (0.0%) | 0 (0.0%) |
| 18 to 34 Years | 0 (0.0%) | 0 (0.0%) |
| 35 to 64 Years | 33 (9.6%) | 64 (16.4%) |
| 65 to 74 Years | 9 (20.0%) | 33 (26.6%) |
| 75 Years and over | 22 (30.1%) | 64 (47.1%) |
Disability Class: Self-Care Difficulty
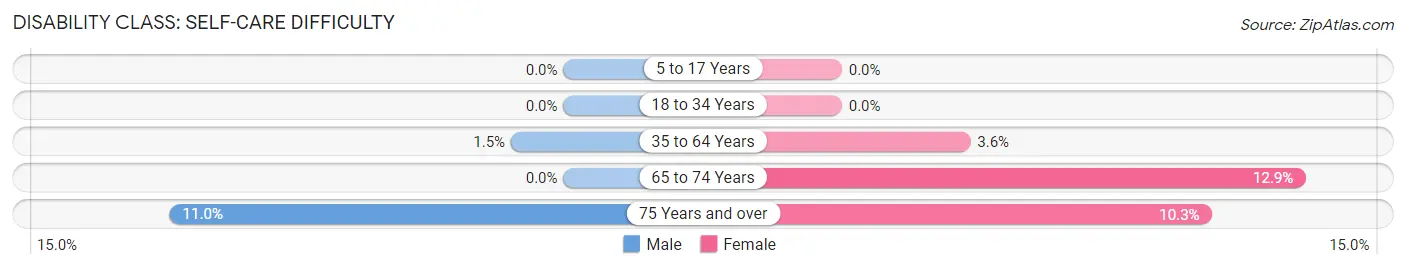
| Age Bracket | Male | Female |
| 5 to 17 Years | 0 (0.0%) | 0 (0.0%) |
| 18 to 34 Years | 0 (0.0%) | 0 (0.0%) |
| 35 to 64 Years | 5 (1.5%) | 14 (3.6%) |
| 65 to 74 Years | 0 (0.0%) | 16 (12.9%) |
| 75 Years and over | 8 (11.0%) | 14 (10.3%) |
Technology Access in West
Computing Device Access in West
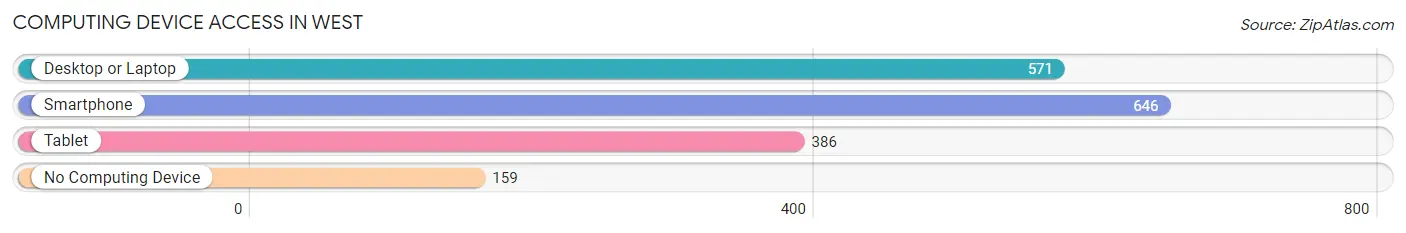
| Device Type | # Households | % Households |
| Desktop or Laptop | 571 | 63.6% |
| Smartphone | 646 | 71.9% |
| Tablet | 386 | 43.0% |
| No Computing Device | 159 | 17.7% |
| Total | 898 | 100.0% |
Internet Access in West
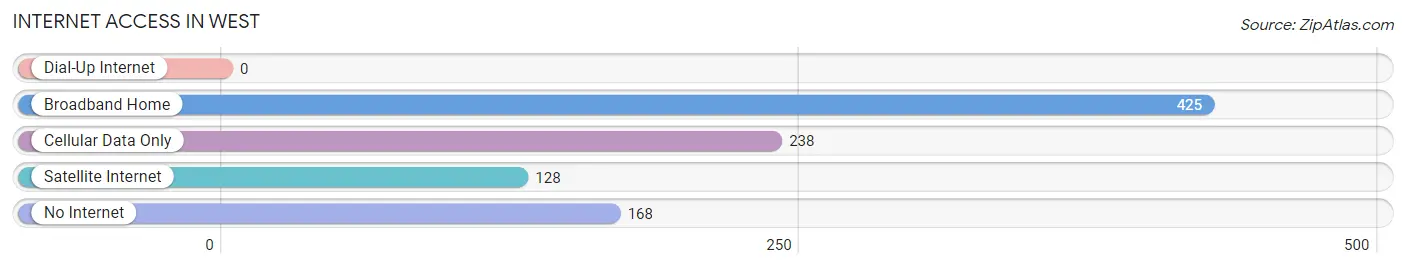
| Internet Type | # Households | % Households |
| Dial-Up Internet | 0 | 0.0% |
| Broadband Home | 425 | 47.3% |
| Cellular Data Only | 238 | 26.5% |
| Satellite Internet | 128 | 14.2% |
| No Internet | 168 | 18.7% |
| Total | 898 | 100.0% |
West Summary
West, Texas is a small town located in McLennan County, Texas, United States. It is situated approximately 20 miles north of Waco and is part of the Waco Metropolitan Statistical Area. The town was founded in 1881 and has a population of 2,807 as of the 2010 census.
History
West, Texas was founded in 1881 by a group of German immigrants who had settled in the area. The town was named after a local rancher, Thomas West. The town was incorporated in 1882 and the first mayor was elected in 1883.
The town grew rapidly in the late 19th century and early 20th century due to the booming cotton industry. The town was home to several cotton gins and a cottonseed oil mill. The town also had a number of businesses, including a bank, a hotel, a drug store, a blacksmith shop, and a livery stable.
In the early 20th century, the town began to decline as the cotton industry declined. The town was hit hard by the Great Depression and many businesses closed. The town was further impacted by the Dust Bowl of the 1930s.
In the 1950s, the town began to experience a resurgence as the oil and gas industry began to boom in the area. The town was also home to a number of manufacturing plants, including a cement plant and a fertilizer plant.
Geography
West, Texas is located in McLennan County, Texas, approximately 20 miles north of Waco. The town is situated at the intersection of Interstate 35 and State Highway 6. The town is located in the Central Texas region and is part of the Waco Metropolitan Statistical Area.
The town has a total area of 2.2 square miles, all of which is land. The town is located in a flat, open area and is surrounded by farmland. The town is located near the Bosque River, which flows through the area.
Economy
West, Texas is a small, rural town and the economy is largely based on agriculture and oil and gas production. The town is home to several oil and gas companies, including Chevron, ExxonMobil, and ConocoPhillips. The town is also home to a number of manufacturing plants, including a cement plant and a fertilizer plant.
The town is also home to a number of small businesses, including restaurants, retail stores, and service providers. The town is also home to a number of churches and schools.
Demographics
As of the 2010 census, West, Texas had a population of 2,807. The racial makeup of the town was 79.3% White, 15.2% Hispanic or Latino, 1.7% African American, 0.7% Native American, 0.3% Asian, and 2.9% from other races.
The median household income in West, Texas was $37,917 and the median family income was $45,938. The per capita income was $19,945. The town had a poverty rate of 17.3%.
Conclusion
West, Texas is a small town located in McLennan County, Texas, United States. The town was founded in 1881 and has a population of 2,807 as of the 2010 census. The town is largely based on agriculture and oil and gas production. The town is home to several oil and gas companies, manufacturing plants, and small businesses. The town has a population that is 79.3% White, 15.2% Hispanic or Latino, 1.7% African American, 0.7% Native American, 0.3% Asian, and 2.9% from other races. The median household income in West, Texas was $37,917 and the median family income was $45,938. The per capita income was $19,945. The town had a poverty rate of 17.3%.
Common Questions
What is Per Capita Income in West?
Per Capita income in West is $23,771.
What is the Median Family Income in West?
Median Family Income in West is $63,750.
What is the Median Household income in West?
Median Household Income in West is $51,875.
What is Income or Wage Gap in West?
Income or Wage Gap in West is 19.2%.
Women in West earn 80.8 cents for every dollar earned by a man.
What is Inequality or Gini Index in West?
Inequality or Gini Index in West is 0.43.
What is the Total Population of West?
Total Population of West is 2,577.
What is the Total Male Population of West?
Total Male Population of West is 1,047.
What is the Total Female Population of West?
Total Female Population of West is 1,530.
What is the Ratio of Males per 100 Females in West?
There are 68.43 Males per 100 Females in West.
What is the Ratio of Females per 100 Males in West?
There are 146.13 Females per 100 Males in West.
What is the Median Population Age in West?
Median Population Age in West is 34.3 Years.
What is the Average Family Size in West
Average Family Size in West is 3.5 People.
What is the Average Household Size in West
Average Household Size in West is 2.7 People.
How Large is the Labor Force in West?
There are 1,082 People in the Labor Forcein in West.
What is the Percentage of People in the Labor Force in West?
56.0% of People are in the Labor Force in West.
What is the Unemployment Rate in West?
Unemployment Rate in West is 2.1%.