Trinity, TX Map & Demographics
Trinity Map
Trinity Overview
$20,995
PER CAPITA INCOME
$48,919
AVG FAMILY INCOME
$35,905
AVG HOUSEHOLD INCOME
32.7%
WAGE / INCOME GAP [ % ]
67.3¢/ $1
WAGE / INCOME GAP [ $ ]
0.48
INEQUALITY / GINI INDEX
2,493
TOTAL POPULATION
1,367
MALE POPULATION
1,126
FEMALE POPULATION
121.40
MALES / 100 FEMALES
82.37
FEMALES / 100 MALES
47.6
MEDIAN AGE
2.8
AVG FAMILY SIZE
2.3
AVG HOUSEHOLD SIZE
1,264
LABOR FORCE [ PEOPLE ]
62.5%
PERCENT IN LABOR FORCE
7.3%
UNEMPLOYMENT RATE
Trinity Zip Codes
Trinity Area Codes
Income in Trinity
Income Overview in Trinity
Per Capita Income in Trinity is $20,995, while median incomes of families and households are $48,919 and $35,905 respectively.
| Characteristic | Number | Measure |
| Per Capita Income | 2,493 | $20,995 |
| Median Family Income | 700 | $48,919 |
| Mean Family Income | 700 | $55,939 |
| Median Household Income | 1,031 | $35,905 |
| Mean Household Income | 1,031 | $48,835 |
| Income Deficit | 700 | $0 |
| Wage / Income Gap (%) | 2,493 | 32.70% |
| Wage / Income Gap ($) | 2,493 | 67.30¢ per $1 |
| Gini / Inequality Index | 2,493 | 0.48 |
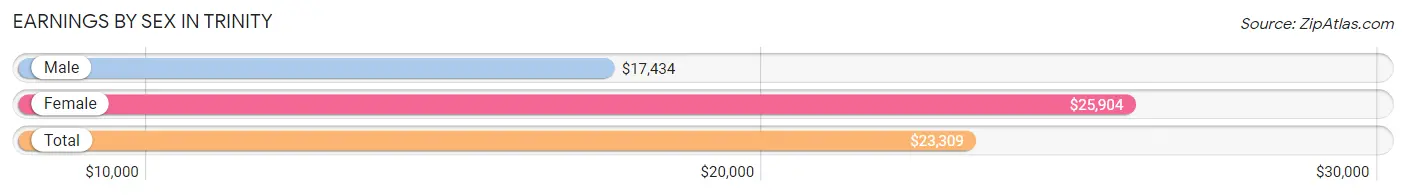
Earnings by Sex in Trinity
Average Earnings in Trinity are $23,309, $17,434 for men and $25,904 for women, a difference of 32.7%.
| Sex | Number | Average Earnings |
| Male | 771 (58.8%) | $17,434 |
| Female | 541 (41.2%) | $25,904 |
| Total | 1,312 (100.0%) | $23,309 |
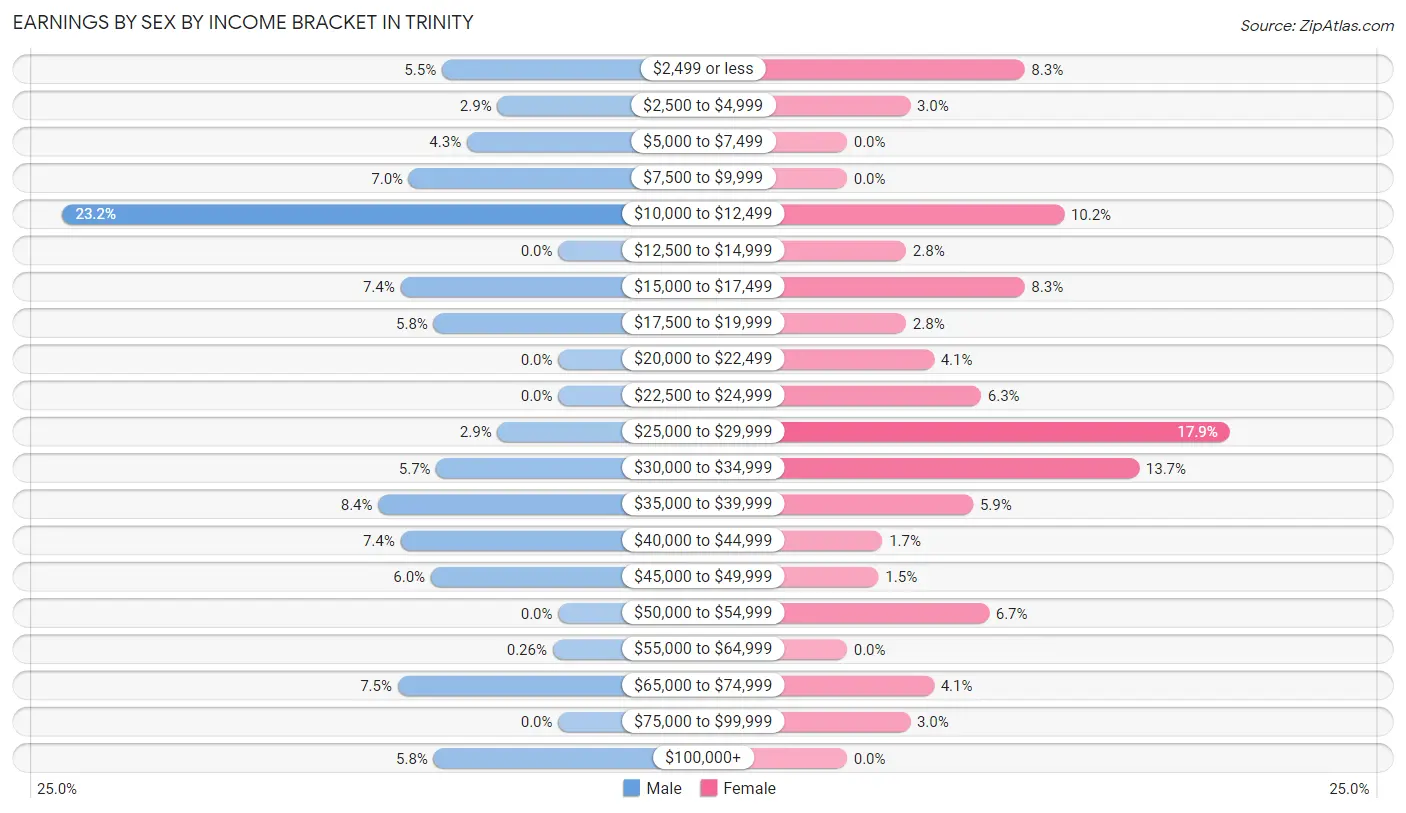
Earnings by Sex by Income Bracket in Trinity
The most common earnings brackets in Trinity are $10,000 to $12,499 for men (179 | 23.2%) and $25,000 to $29,999 for women (97 | 17.9%).
| Income | Male | Female |
| $2,499 or less | 42 (5.4%) | 45 (8.3%) |
| $2,500 to $4,999 | 22 (2.9%) | 16 (3.0%) |
| $5,000 to $7,499 | 33 (4.3%) | 0 (0.0%) |
| $7,500 to $9,999 | 54 (7.0%) | 0 (0.0%) |
| $10,000 to $12,499 | 179 (23.2%) | 55 (10.2%) |
| $12,500 to $14,999 | 0 (0.0%) | 15 (2.8%) |
| $15,000 to $17,499 | 57 (7.4%) | 45 (8.3%) |
| $17,500 to $19,999 | 45 (5.8%) | 15 (2.8%) |
| $20,000 to $22,499 | 0 (0.0%) | 22 (4.1%) |
| $22,500 to $24,999 | 0 (0.0%) | 34 (6.3%) |
| $25,000 to $29,999 | 22 (2.9%) | 97 (17.9%) |
| $30,000 to $34,999 | 44 (5.7%) | 74 (13.7%) |
| $35,000 to $39,999 | 65 (8.4%) | 32 (5.9%) |
| $40,000 to $44,999 | 57 (7.4%) | 9 (1.7%) |
| $45,000 to $49,999 | 46 (6.0%) | 8 (1.5%) |
| $50,000 to $54,999 | 0 (0.0%) | 36 (6.7%) |
| $55,000 to $64,999 | 2 (0.3%) | 0 (0.0%) |
| $65,000 to $74,999 | 58 (7.5%) | 22 (4.1%) |
| $75,000 to $99,999 | 0 (0.0%) | 16 (3.0%) |
| $100,000+ | 45 (5.8%) | 0 (0.0%) |
| Total | 771 (100.0%) | 541 (100.0%) |
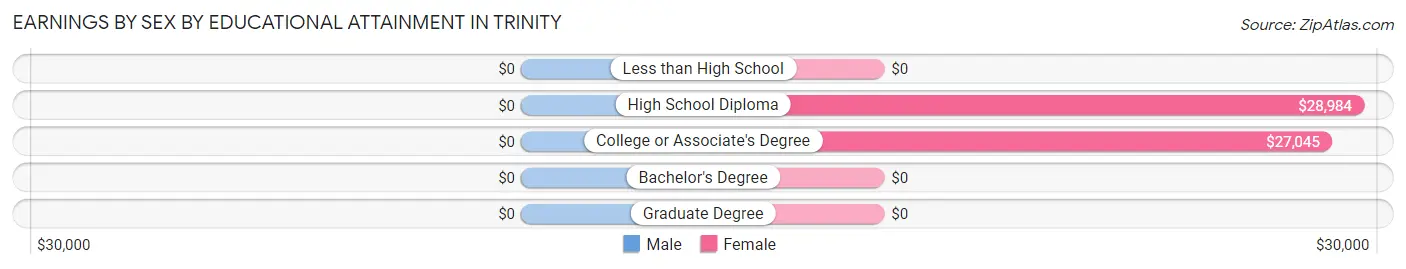
Earnings by Sex by Educational Attainment in Trinity
| Educational Attainment | Male Income | Female Income |
| Less than High School | - | - |
| High School Diploma | - | - |
| College or Associate's Degree | - | - |
| Bachelor's Degree | - | - |
| Graduate Degree | - | - |
| Total | $32,017 | $27,130 |
Family Income in Trinity
Family Income Brackets in Trinity
According to the Trinity family income data, there are 179 families falling into the $50,000 to $74,999 income range, which is the most common income bracket and makes up 25.6% of all families.
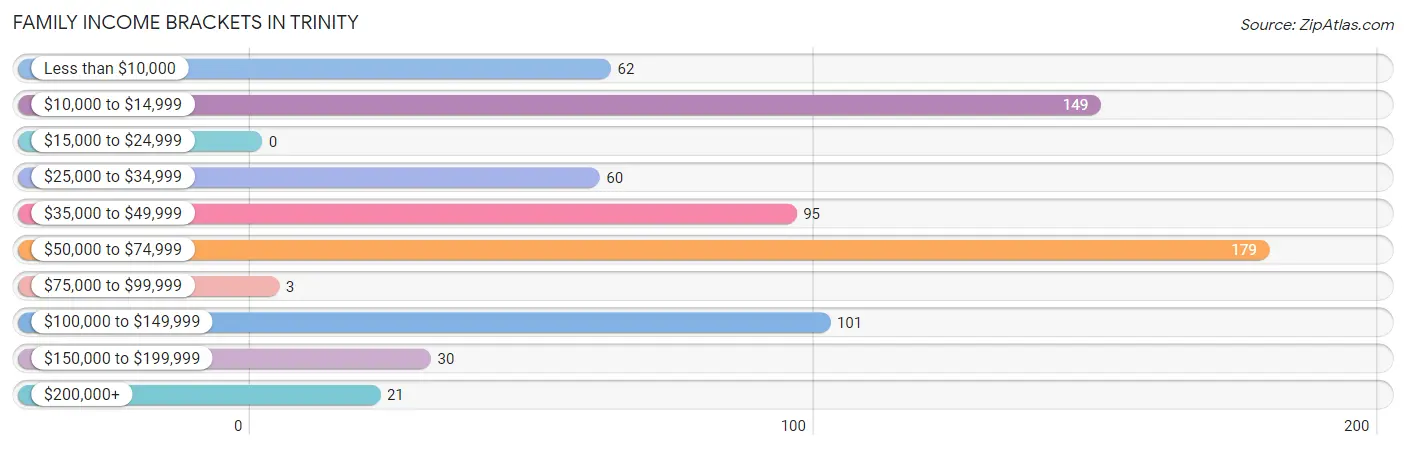
| Income Bracket | # Families | % Families |
| Less than $10,000 | 62 | 8.9% |
| $10,000 to $14,999 | 149 | 21.3% |
| $15,000 to $24,999 | 0 | 0.0% |
| $25,000 to $34,999 | 60 | 8.6% |
| $35,000 to $49,999 | 95 | 13.6% |
| $50,000 to $74,999 | 179 | 25.6% |
| $75,000 to $99,999 | 3 | 0.4% |
| $100,000 to $149,999 | 101 | 14.4% |
| $150,000 to $199,999 | 30 | 4.3% |
| $200,000+ | 21 | 3.0% |
Family Income by Famaliy Size in Trinity
2-person families (156 | 22.3%) account for the highest median family income in Trinity with $59,821 per family, while 2-person families (156 | 22.3%) have the highest median income of $29,910 per family member.
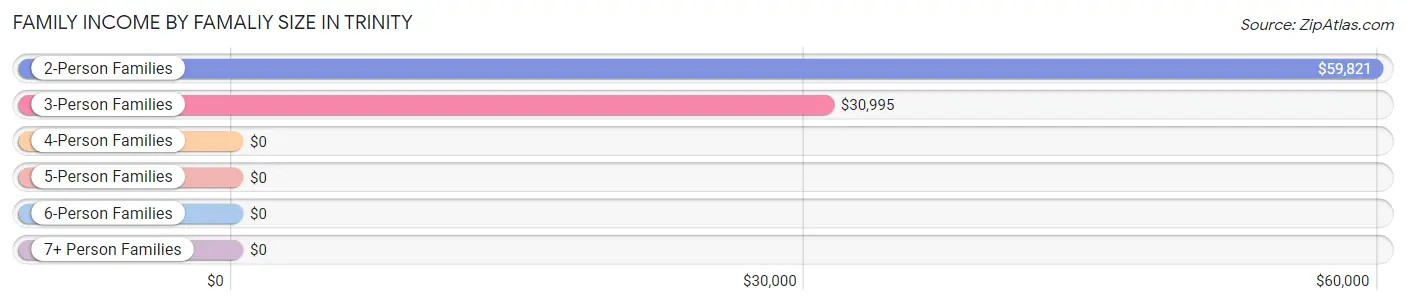
| Income Bracket | # Families | Median Income |
| 2-Person Families | 156 (22.3%) | $59,821 |
| 3-Person Families | 341 (48.7%) | $30,995 |
| 4-Person Families | 172 (24.6%) | $0 |
| 5-Person Families | 31 (4.4%) | $0 |
| 6-Person Families | 0 (0.0%) | $0 |
| 7+ Person Families | 0 (0.0%) | $0 |
| Total | 700 (100.0%) | $48,919 |
Family Income by Number of Earners in Trinity
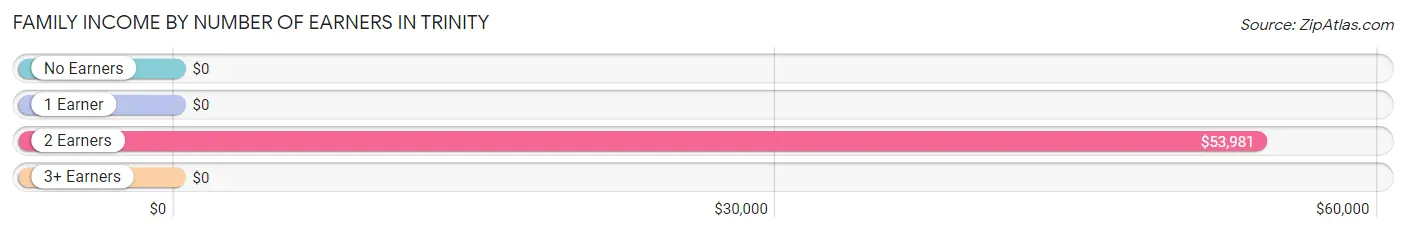
| Number of Earners | # Families | Median Income |
| No Earners | 44 (6.3%) | $0 |
| 1 Earner | 309 (44.1%) | $0 |
| 2 Earners | 298 (42.6%) | $53,981 |
| 3+ Earners | 49 (7.0%) | $0 |
| Total | 700 (100.0%) | $48,919 |
Household Income in Trinity
Household Income Brackets in Trinity
With 238 households falling in the category, the $50,000 to $74,999 income range is the most frequent in Trinity, accounting for 23.1% of all households. In contrast, only 16 households (1.5%) fall into the $75,000 to $99,999 income bracket, making it the least populous group.
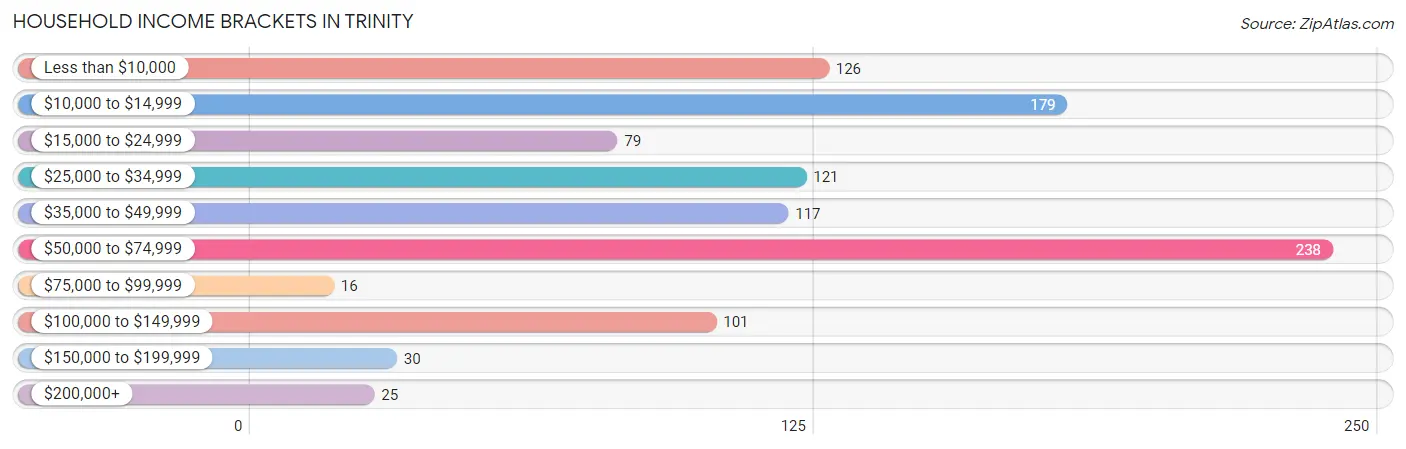
| Income Bracket | # Households | % Households |
| Less than $10,000 | 126 | 12.2% |
| $10,000 to $14,999 | 179 | 17.4% |
| $15,000 to $24,999 | 79 | 7.7% |
| $25,000 to $34,999 | 121 | 11.7% |
| $35,000 to $49,999 | 117 | 11.3% |
| $50,000 to $74,999 | 238 | 23.1% |
| $75,000 to $99,999 | 16 | 1.6% |
| $100,000 to $149,999 | 101 | 9.8% |
| $150,000 to $199,999 | 30 | 2.9% |
| $200,000+ | 25 | 2.4% |
Household Income by Householder Age in Trinity
The median household income in Trinity is $35,905, with the highest median household income of $42,279 found in the 45 to 64 years age bracket for the primary householder. A total of 681 households (66.0%) fall into this category. Meanwhile, the 25 to 44 years age bracket for the primary householder has the lowest median household income of $0, with 87 households (8.4%) in this group.
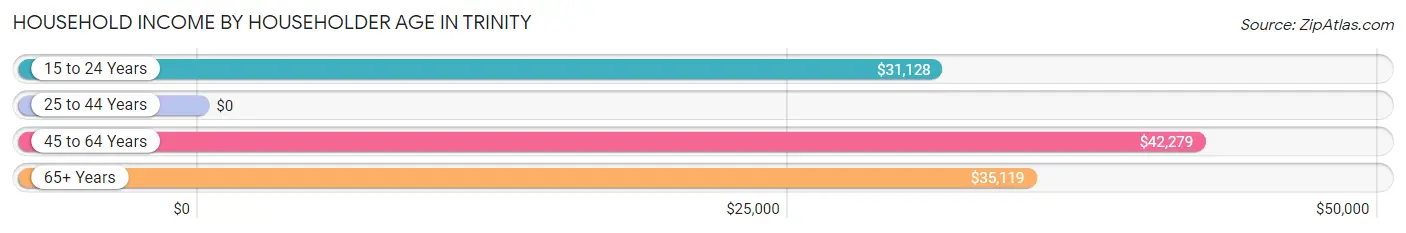
| Income Bracket | # Households | Median Income |
| 15 to 24 Years | 109 (10.6%) | $31,128 |
| 25 to 44 Years | 87 (8.4%) | $0 |
| 45 to 64 Years | 681 (66.0%) | $42,279 |
| 65+ Years | 154 (14.9%) | $35,119 |
| Total | 1,031 (100.0%) | $35,905 |
Poverty in Trinity
Income Below Poverty by Sex and Age in Trinity
With 32.9% poverty level for males and 23.3% for females among the residents of Trinity, under 5 year old males and 12 to 14 year old females are the most vulnerable to poverty, with 22 males (100.0%) and 65 females (95.6%) in their respective age groups living below the poverty level.
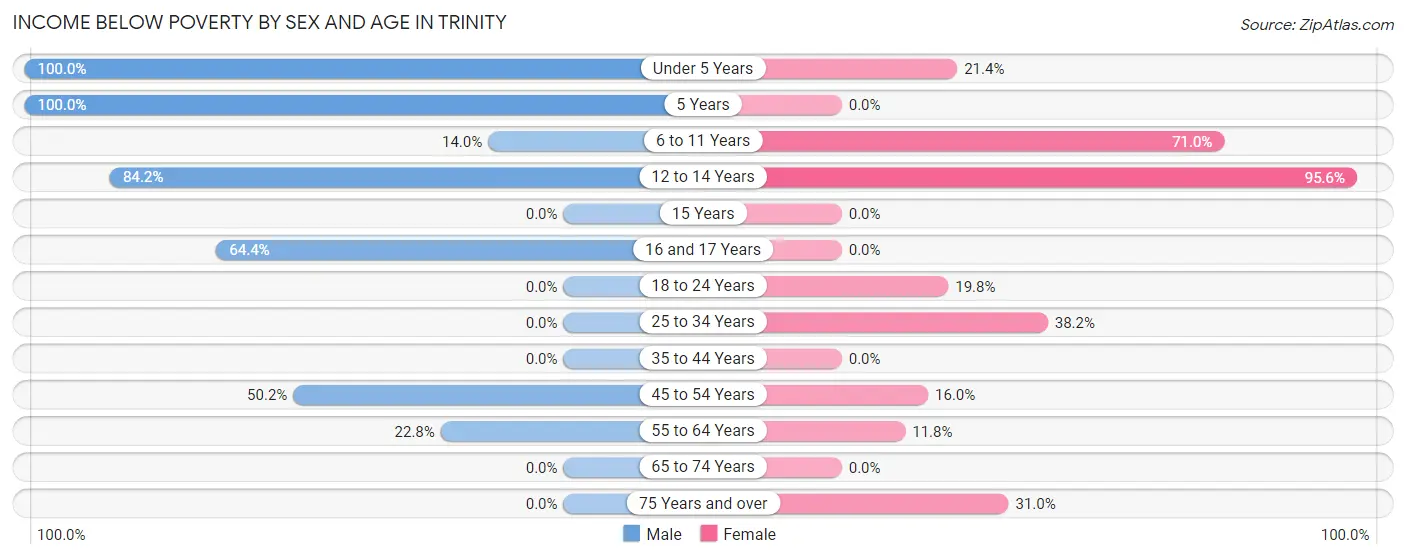
| Age Bracket | Male | Female |
| Under 5 Years | 22 (100.0%) | 21 (21.4%) |
| 5 Years | 23 (100.0%) | 0 (0.0%) |
| 6 to 11 Years | 13 (14.0%) | 22 (71.0%) |
| 12 to 14 Years | 69 (84.2%) | 65 (95.6%) |
| 15 Years | 0 (0.0%) | 0 (0.0%) |
| 16 and 17 Years | 85 (64.4%) | 0 (0.0%) |
| 18 to 24 Years | 0 (0.0%) | 34 (19.8%) |
| 25 to 34 Years | 0 (0.0%) | 39 (38.2%) |
| 35 to 44 Years | 0 (0.0%) | 0 (0.0%) |
| 45 to 54 Years | 162 (50.1%) | 29 (16.0%) |
| 55 to 64 Years | 59 (22.8%) | 27 (11.8%) |
| 65 to 74 Years | 0 (0.0%) | 0 (0.0%) |
| 75 Years and over | 0 (0.0%) | 13 (30.9%) |
| Total | 433 (32.9%) | 250 (23.3%) |
Income Above Poverty by Sex and Age in Trinity
According to the poverty statistics in Trinity, males aged 15 years and females aged 16 and 17 years are the age groups that are most secure financially, with 100.0% of males and 100.0% of females in these age groups living above the poverty line.
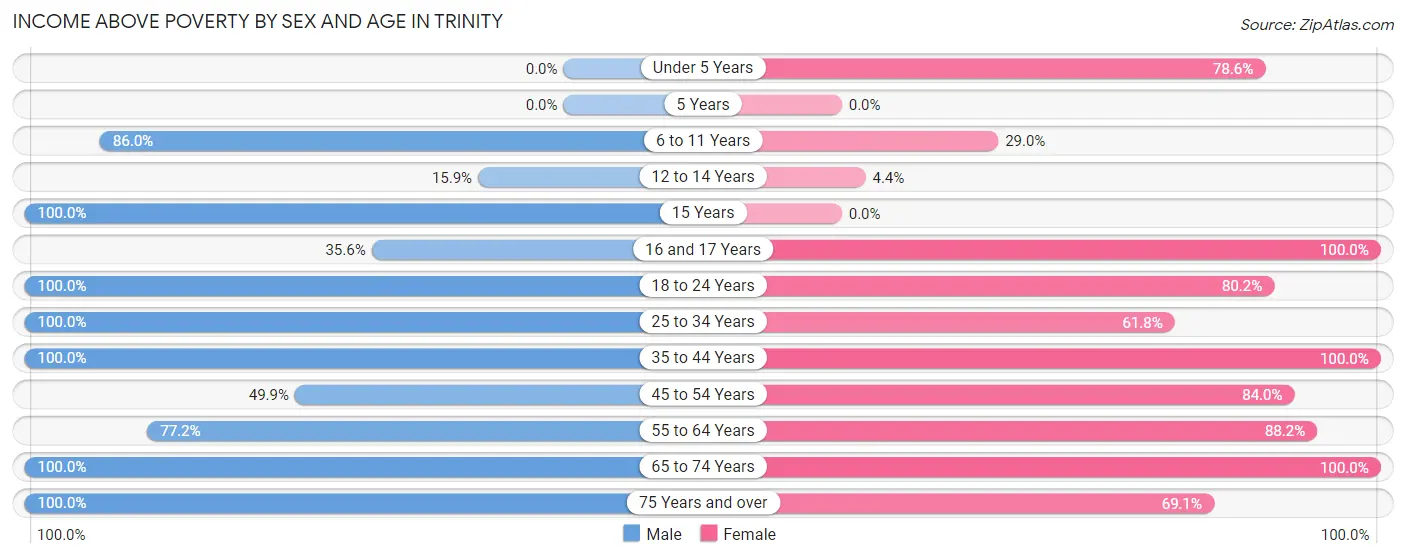
| Age Bracket | Male | Female |
| Under 5 Years | 0 (0.0%) | 77 (78.6%) |
| 5 Years | 0 (0.0%) | 0 (0.0%) |
| 6 to 11 Years | 80 (86.0%) | 9 (29.0%) |
| 12 to 14 Years | 13 (15.9%) | 3 (4.4%) |
| 15 Years | 32 (100.0%) | 0 (0.0%) |
| 16 and 17 Years | 47 (35.6%) | 11 (100.0%) |
| 18 to 24 Years | 222 (100.0%) | 138 (80.2%) |
| 25 to 34 Years | 63 (100.0%) | 63 (61.8%) |
| 35 to 44 Years | 19 (100.0%) | 40 (100.0%) |
| 45 to 54 Years | 161 (49.8%) | 152 (84.0%) |
| 55 to 64 Years | 200 (77.2%) | 202 (88.2%) |
| 65 to 74 Years | 30 (100.0%) | 100 (100.0%) |
| 75 Years and over | 18 (100.0%) | 29 (69.1%) |
| Total | 885 (67.1%) | 824 (76.7%) |
Income Below Poverty Among Married-Couple Families in Trinity
The poverty statistics for married-couple families in Trinity show that 3.1% or 8 of the total 257 families live below the poverty line. Families with no children have the highest poverty rate of 5.8%, comprising of 8 families. On the other hand, families with 1 or 2 children have the lowest poverty rate of 0.0%, which includes 0 families.
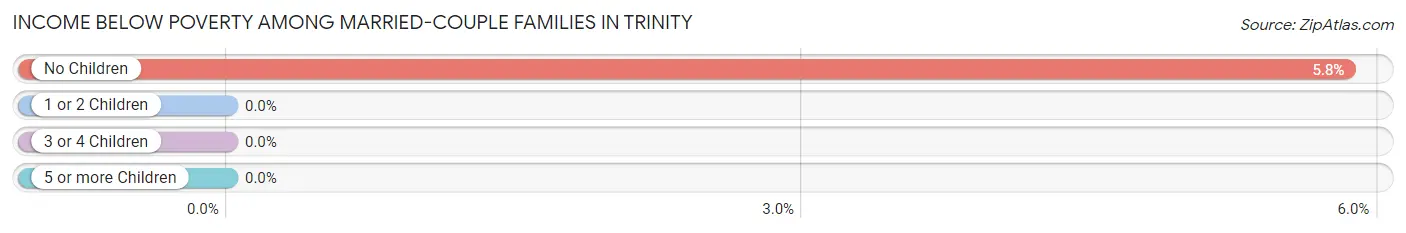
| Children | Above Poverty | Below Poverty |
| No Children | 129 (94.2%) | 8 (5.8%) |
| 1 or 2 Children | 113 (100.0%) | 0 (0.0%) |
| 3 or 4 Children | 7 (100.0%) | 0 (0.0%) |
| 5 or more Children | 0 (0.0%) | 0 (0.0%) |
| Total | 249 (96.9%) | 8 (3.1%) |
Income Below Poverty Among Single-Parent Households in Trinity
According to the poverty data in Trinity, 74.6% or 164 single-father households and 17.5% or 39 single-mother households are living below the poverty line. Among single-father households, those with 3 or 4 children have the highest poverty rate, with 30 households (100.0%) experiencing poverty. Likewise, among single-mother households, those with 3 or 4 children have the highest poverty rate, with 24 households (100.0%) falling below the poverty line.
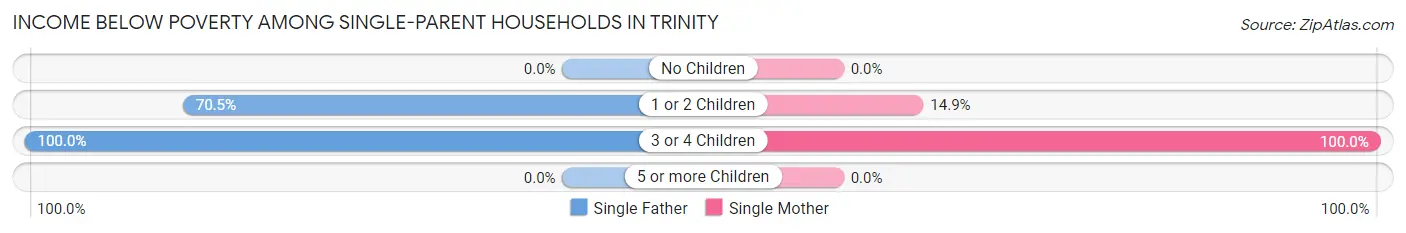
| Children | Single Father | Single Mother |
| No Children | 0 (0.0%) | 0 (0.0%) |
| 1 or 2 Children | 134 (70.5%) | 15 (14.8%) |
| 3 or 4 Children | 30 (100.0%) | 24 (100.0%) |
| 5 or more Children | 0 (0.0%) | 0 (0.0%) |
| Total | 164 (74.6%) | 39 (17.5%) |
Income Below Poverty Among Married-Couple vs Single-Parent Households in Trinity
The poverty data for Trinity shows that 8 of the married-couple family households (3.1%) and 203 of the single-parent households (45.8%) are living below the poverty level. Within the married-couple family households, those with no children have the highest poverty rate, with 8 households (5.8%) falling below the poverty line. Among the single-parent households, those with 3 or 4 children have the highest poverty rate, with 54 household (100.0%) living below poverty.
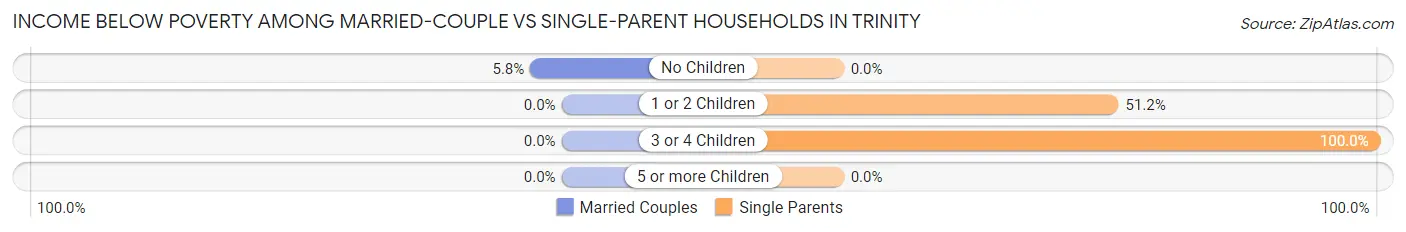
| Children | Married-Couple Families | Single-Parent Households |
| No Children | 8 (5.8%) | 0 (0.0%) |
| 1 or 2 Children | 0 (0.0%) | 149 (51.2%) |
| 3 or 4 Children | 0 (0.0%) | 54 (100.0%) |
| 5 or more Children | 0 (0.0%) | 0 (0.0%) |
| Total | 8 (3.1%) | 203 (45.8%) |
Race in Trinity
The most populous races in Trinity are White / Caucasian (1,072 | 43.0%), Black / African American (820 | 32.9%), and Hispanic or Latino (679 | 27.2%).
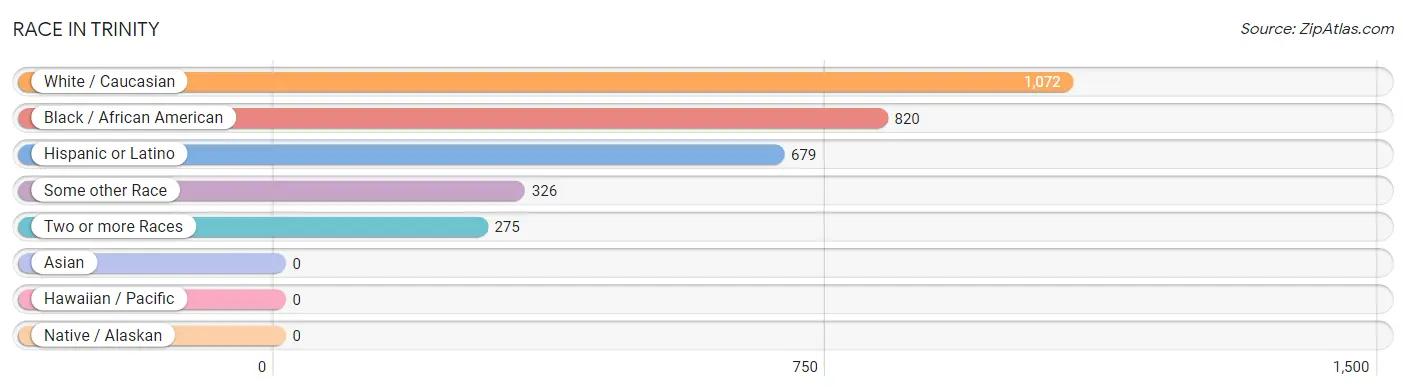
| Race | # Population | % Population |
| Asian | 0 | 0.0% |
| Black / African American | 820 | 32.9% |
| Hawaiian / Pacific | 0 | 0.0% |
| Hispanic or Latino | 679 | 27.2% |
| Native / Alaskan | 0 | 0.0% |
| White / Caucasian | 1,072 | 43.0% |
| Two or more Races | 275 | 11.0% |
| Some other Race | 326 | 13.1% |
| Total | 2,493 | 100.0% |
Ancestry in Trinity
The most populous ancestries reported in Trinity are Mexican (601 | 24.1%), Irish (211 | 8.5%), English (199 | 8.0%), American (124 | 5.0%), and German (115 | 4.6%), together accounting for 50.1% of all Trinity residents.
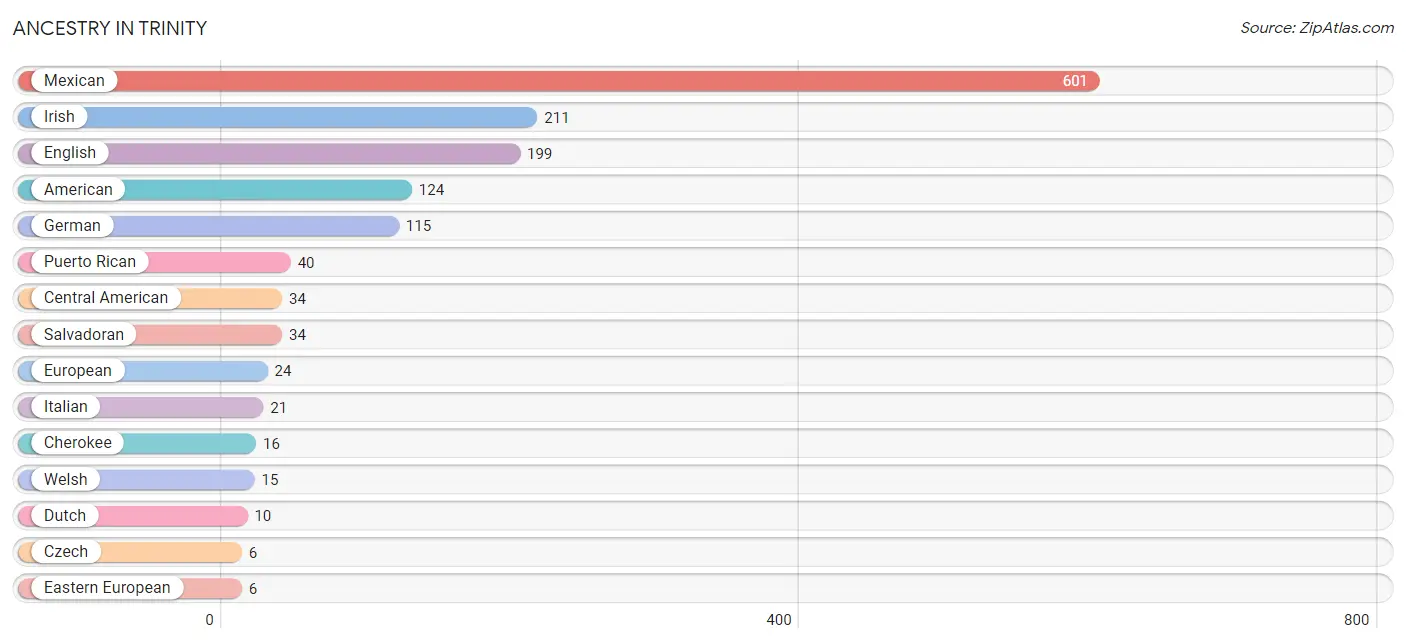
| Ancestry | # Population | % Population |
| American | 124 | 5.0% |
| Central American | 34 | 1.4% |
| Cherokee | 16 | 0.6% |
| Czech | 6 | 0.2% |
| Dutch | 10 | 0.4% |
| Eastern European | 6 | 0.2% |
| English | 199 | 8.0% |
| European | 24 | 1.0% |
| German | 115 | 4.6% |
| Irish | 211 | 8.5% |
| Italian | 21 | 0.8% |
| Lithuanian | 5 | 0.2% |
| Mexican | 601 | 24.1% |
| Polish | 5 | 0.2% |
| Puerto Rican | 40 | 1.6% |
| Salvadoran | 34 | 1.4% |
| Scotch-Irish | 6 | 0.2% |
| Welsh | 15 | 0.6% | View All 18 Rows |
Immigrants in Trinity
The most numerous immigrant groups reported in Trinity came from Central America (223 | 8.9%), Latin America (223 | 8.9%), Mexico (189 | 7.6%), El Salvador (34 | 1.4%), and Africa (21 | 0.8%), together accounting for 27.7% of all Trinity residents.
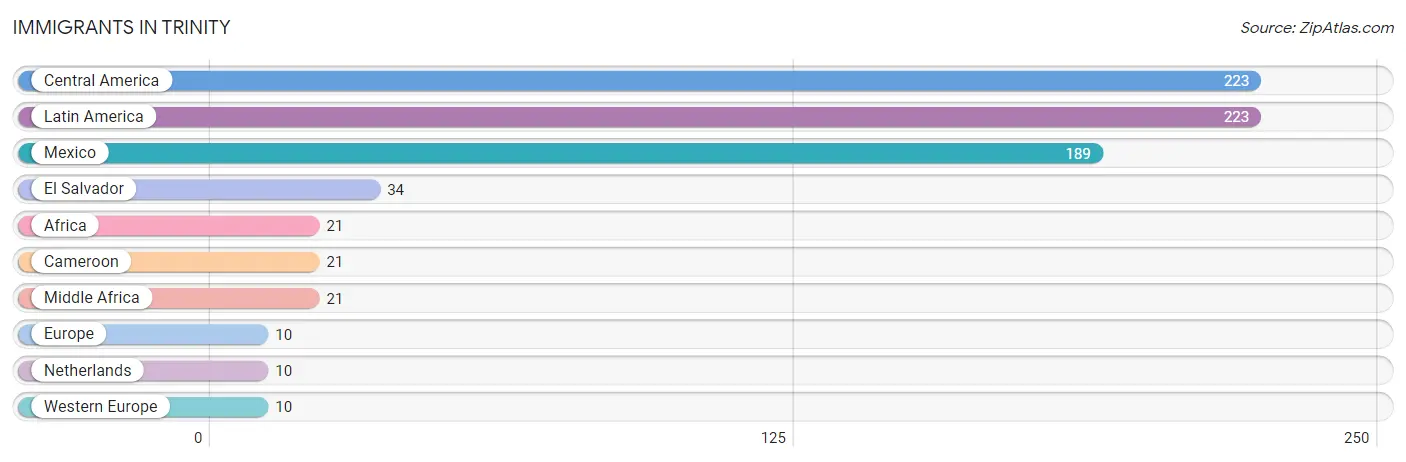
| Immigration Origin | # Population | % Population |
| Africa | 21 | 0.8% |
| Cameroon | 21 | 0.8% |
| Central America | 223 | 8.9% |
| El Salvador | 34 | 1.4% |
| Europe | 10 | 0.4% |
| Latin America | 223 | 8.9% |
| Mexico | 189 | 7.6% |
| Middle Africa | 21 | 0.8% |
| Netherlands | 10 | 0.4% |
| Western Europe | 10 | 0.4% | View All 10 Rows |
Sex and Age in Trinity
Sex and Age in Trinity
The most populous age groups in Trinity are 50 to 54 Years (248 | 18.1%) for men and 50 to 54 Years (186 | 16.5%) for women.
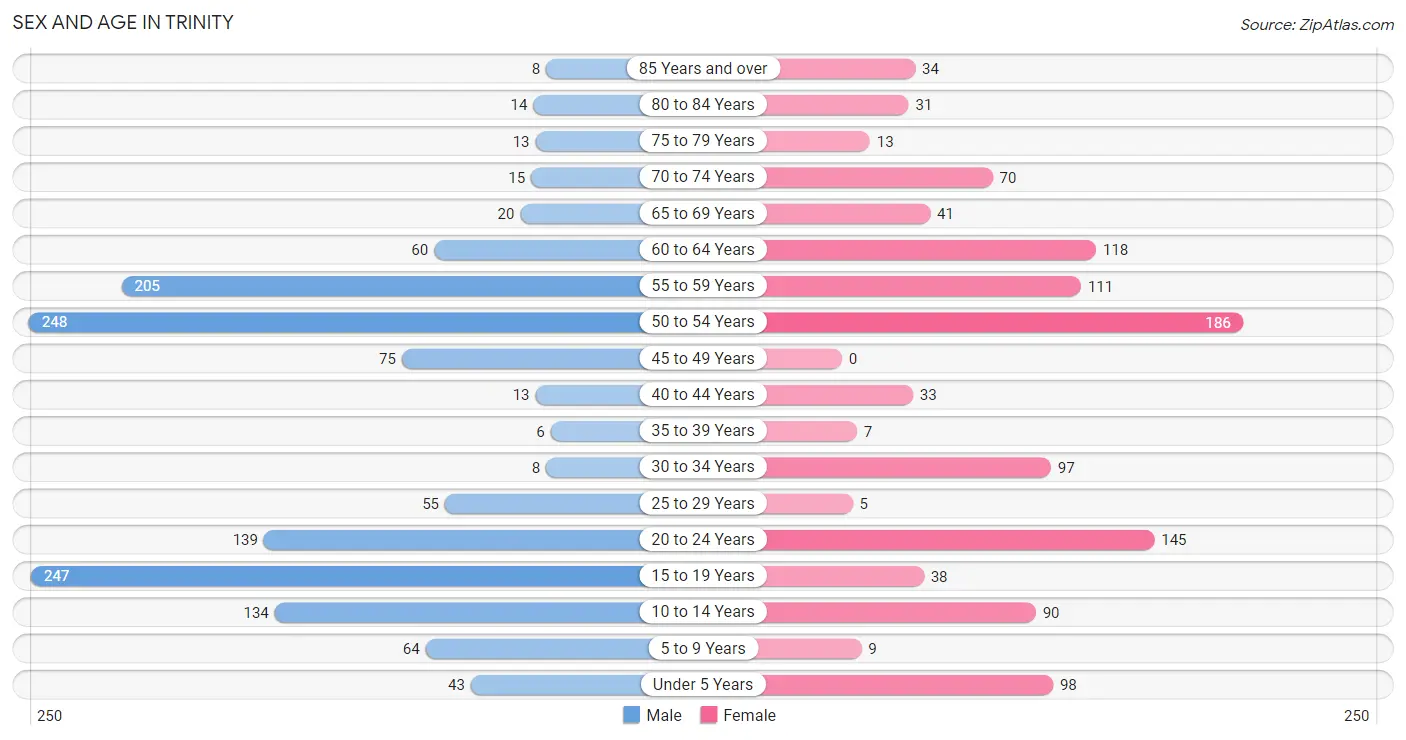
| Age Bracket | Male | Female |
| Under 5 Years | 43 (3.2%) | 98 (8.7%) |
| 5 to 9 Years | 64 (4.7%) | 9 (0.8%) |
| 10 to 14 Years | 134 (9.8%) | 90 (8.0%) |
| 15 to 19 Years | 247 (18.1%) | 38 (3.4%) |
| 20 to 24 Years | 139 (10.2%) | 145 (12.9%) |
| 25 to 29 Years | 55 (4.0%) | 5 (0.4%) |
| 30 to 34 Years | 8 (0.6%) | 97 (8.6%) |
| 35 to 39 Years | 6 (0.4%) | 7 (0.6%) |
| 40 to 44 Years | 13 (0.9%) | 33 (2.9%) |
| 45 to 49 Years | 75 (5.5%) | 0 (0.0%) |
| 50 to 54 Years | 248 (18.1%) | 186 (16.5%) |
| 55 to 59 Years | 205 (15.0%) | 111 (9.9%) |
| 60 to 64 Years | 60 (4.4%) | 118 (10.5%) |
| 65 to 69 Years | 20 (1.5%) | 41 (3.6%) |
| 70 to 74 Years | 15 (1.1%) | 70 (6.2%) |
| 75 to 79 Years | 13 (0.9%) | 13 (1.1%) |
| 80 to 84 Years | 14 (1.0%) | 31 (2.8%) |
| 85 Years and over | 8 (0.6%) | 34 (3.0%) |
| Total | 1,367 (100.0%) | 1,126 (100.0%) |
Families and Households in Trinity
Median Family Size in Trinity
The median family size in Trinity is 2.84 persons per family, with married-couple families (257 | 36.7%) accounting for the largest median family size of 3.11 persons per family. On the other hand, single male/father families (220 | 31.4%) represent the smallest median family size with 2.40 persons per family.
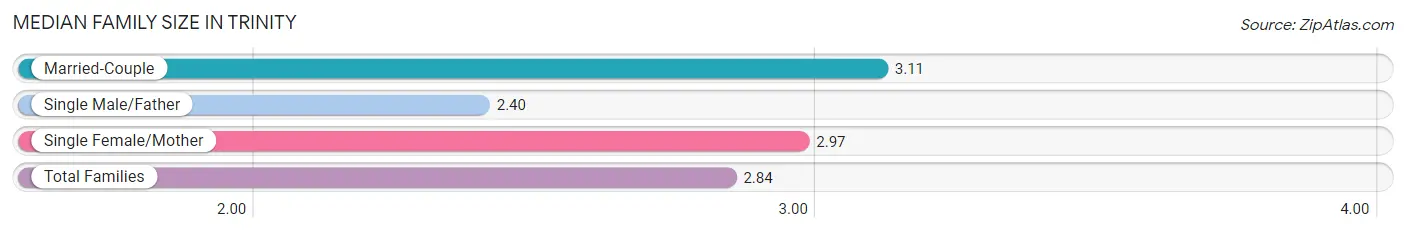
| Family Type | # Families | Family Size |
| Married-Couple | 257 (36.7%) | 3.11 |
| Single Male/Father | 220 (31.4%) | 2.40 |
| Single Female/Mother | 223 (31.9%) | 2.97 |
| Total Families | 700 (100.0%) | 2.84 |
Median Household Size in Trinity
The median household size in Trinity is 2.34 persons per household, with single female/mother households (223 | 21.6%) accounting for the largest median household size of 3.14 persons per household. non-family households (331 | 32.1%) represent the smallest median household size with 1.17 persons per household.
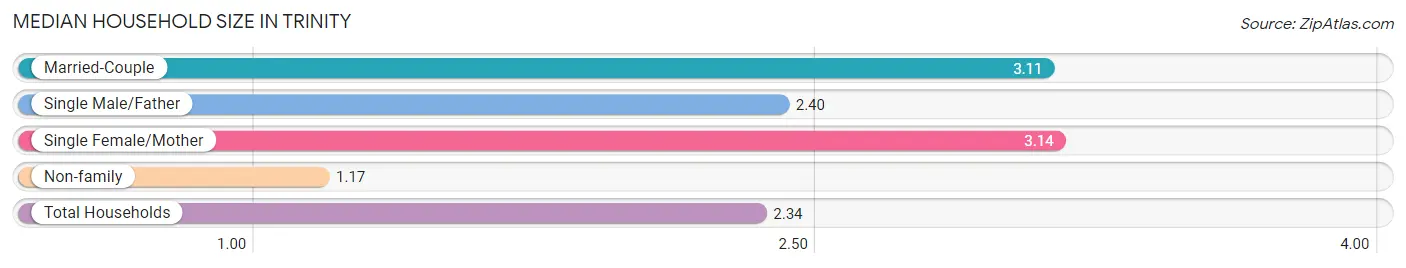
| Household Type | # Households | Household Size |
| Married-Couple | 257 (24.9%) | 3.11 |
| Single Male/Father | 220 (21.3%) | 2.40 |
| Single Female/Mother | 223 (21.6%) | 3.14 |
| Non-family | 331 (32.1%) | 1.17 |
| Total Households | 1,031 (100.0%) | 2.34 |
Household Size by Marriage Status in Trinity
Out of a total of 1,031 households in Trinity, 700 (67.9%) are family households, while 331 (32.1%) are nonfamily households. The most numerous type of family households are 3-person households, comprising 325, and the most common type of nonfamily households are 1-person households, comprising 281.
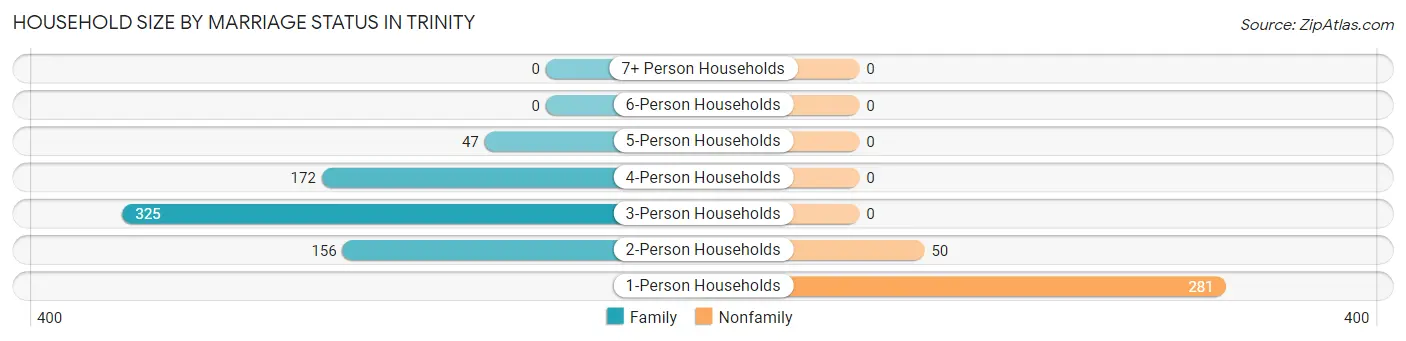
| Household Size | Family Households | Nonfamily Households |
| 1-Person Households | - | 281 (27.3%) |
| 2-Person Households | 156 (15.1%) | 50 (4.9%) |
| 3-Person Households | 325 (31.5%) | 0 (0.0%) |
| 4-Person Households | 172 (16.7%) | 0 (0.0%) |
| 5-Person Households | 47 (4.6%) | 0 (0.0%) |
| 6-Person Households | 0 (0.0%) | 0 (0.0%) |
| 7+ Person Households | 0 (0.0%) | 0 (0.0%) |
| Total | 700 (67.9%) | 331 (32.1%) |
Female Fertility in Trinity
Fertility by Age in Trinity
Average fertility rate in Trinity is 120.0 births per 1,000 women. Women in the age bracket of 20 to 34 years have the highest fertility rate with 166.0 births per 1,000 women. Women in the age bracket of 20 to 34 years acount for 100.0% of all women with births.
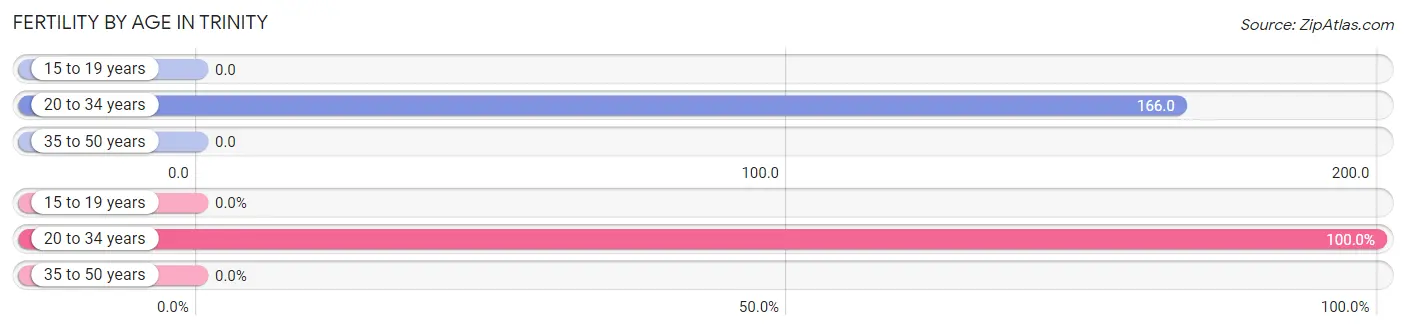
| Age Bracket | Women with Births | Births / 1,000 Women |
| 15 to 19 years | 0 (0.0%) | 0.0 |
| 20 to 34 years | 41 (100.0%) | 166.0 |
| 35 to 50 years | 0 (0.0%) | 0.0 |
| Total | 41 (100.0%) | 120.0 |
Fertility by Age by Marriage Status in Trinity
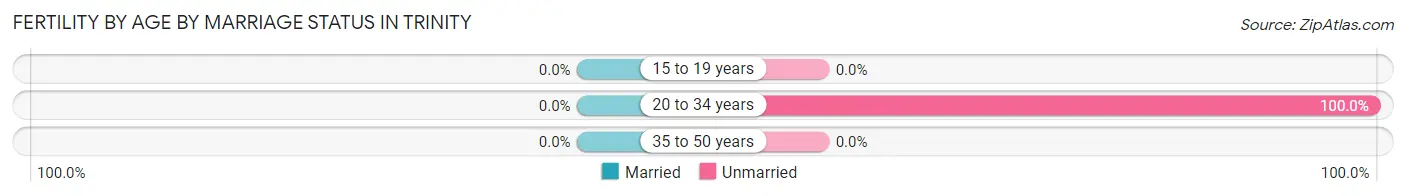
| Age Bracket | Married | Unmarried |
| 15 to 19 years | 0 (0.0%) | 0 (0.0%) |
| 20 to 34 years | 0 (0.0%) | 41 (100.0%) |
| 35 to 50 years | 0 (0.0%) | 0 (0.0%) |
| Total | 0 (0.0%) | 41 (100.0%) |
Fertility by Education in Trinity
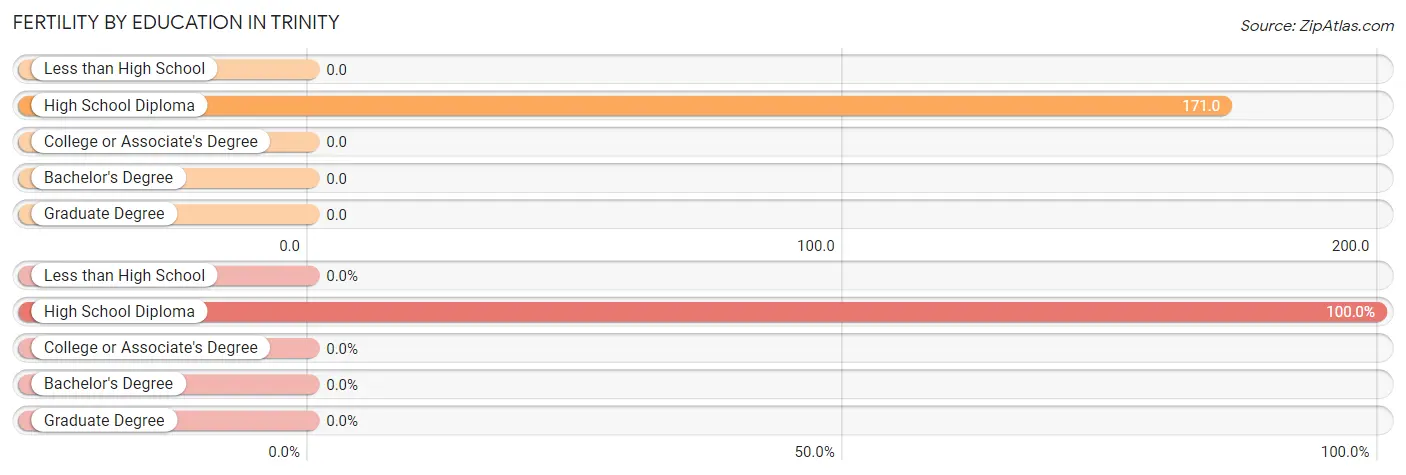
| Educational Attainment | Women with Births | Births / 1,000 Women |
| Less than High School | 0 (0.0%) | 0.0 |
| High School Diploma | 41 (100.0%) | 171.0 |
| College or Associate's Degree | 0 (0.0%) | 0.0 |
| Bachelor's Degree | 0 (0.0%) | 0.0 |
| Graduate Degree | 0 (0.0%) | 0.0 |
| Total | 41 (100.0%) | 120.0 |
Fertility by Education by Marriage Status in Trinity
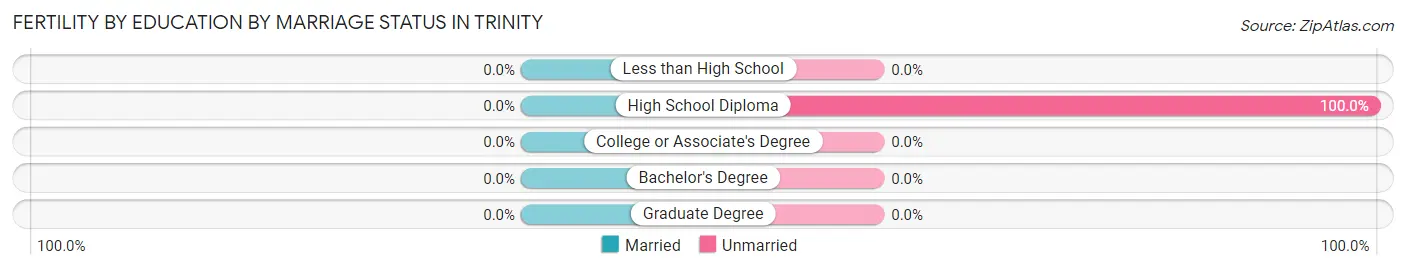
| Educational Attainment | Married | Unmarried |
| Less than High School | 0 (0.0%) | 0 (0.0%) |
| High School Diploma | 0 (0.0%) | 41 (100.0%) |
| College or Associate's Degree | 0 (0.0%) | 0 (0.0%) |
| Bachelor's Degree | 0 (0.0%) | 0 (0.0%) |
| Graduate Degree | 0 (0.0%) | 0 (0.0%) |
| Total | 0 (0.0%) | 41 (100.0%) |
Employment Characteristics in Trinity
Employment by Class of Employer in Trinity
Among the 1,087 employed individuals in Trinity, private company employees (758 | 69.7%), state government employees (219 | 20.2%), and not-for-profit organizations (50 | 4.6%) make up the most common classes of employment.
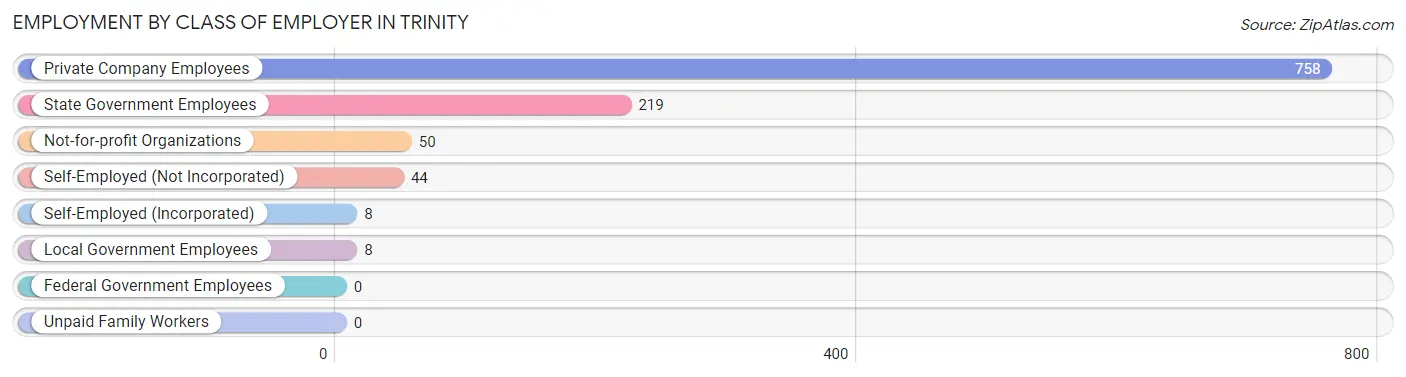
| Employer Class | # Employees | % Employees |
| Private Company Employees | 758 | 69.7% |
| Self-Employed (Incorporated) | 8 | 0.7% |
| Self-Employed (Not Incorporated) | 44 | 4.1% |
| Not-for-profit Organizations | 50 | 4.6% |
| Local Government Employees | 8 | 0.7% |
| State Government Employees | 219 | 20.2% |
| Federal Government Employees | 0 | 0.0% |
| Unpaid Family Workers | 0 | 0.0% |
| Total | 1,087 | 100.0% |
Employment Status by Age in Trinity
According to the labor force statistics for Trinity, out of the total population over 16 years of age (2,023), 62.5% or 1,264 individuals are in the labor force, with 7.3% or 92 of them unemployed. The age group with the highest labor force participation rate is 35 to 44 years, with 100.0% or 59 individuals in the labor force. Within the labor force, the 25 to 29 years age range has the highest percentage of unemployed individuals, with 87.2% or 34 of them being unemployed.
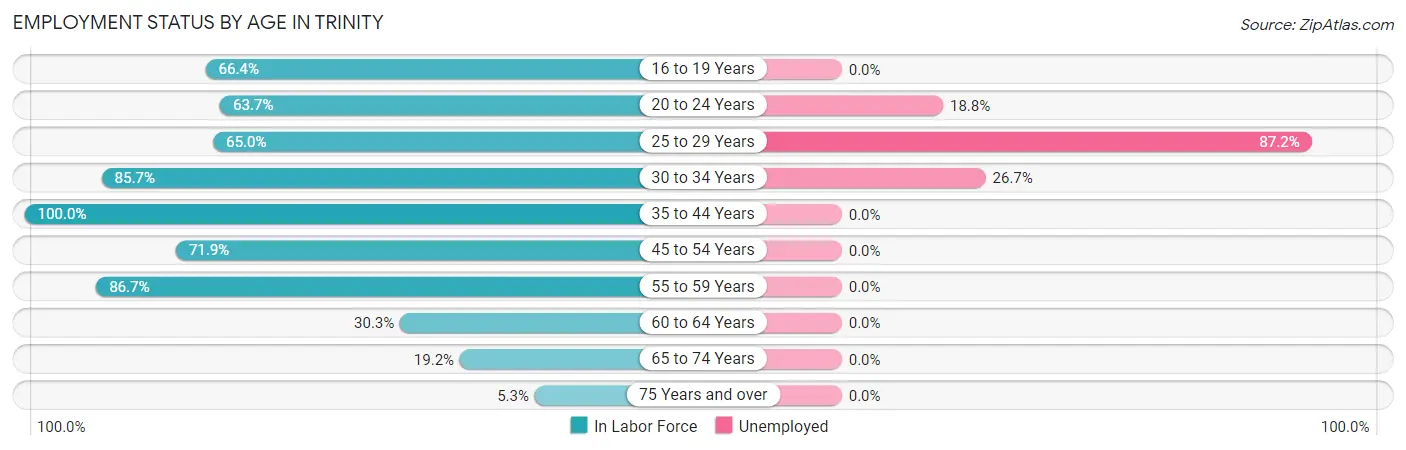
| Age Bracket | In Labor Force | Unemployed |
| 16 to 19 Years | 168 (66.4%) | 0 (0.0%) |
| 20 to 24 Years | 181 (63.7%) | 34 (18.8%) |
| 25 to 29 Years | 39 (65.0%) | 34 (87.2%) |
| 30 to 34 Years | 90 (85.7%) | 24 (26.7%) |
| 35 to 44 Years | 59 (100.0%) | 0 (0.0%) |
| 45 to 54 Years | 366 (71.9%) | 0 (0.0%) |
| 55 to 59 Years | 274 (86.7%) | 0 (0.0%) |
| 60 to 64 Years | 54 (30.3%) | 0 (0.0%) |
| 65 to 74 Years | 28 (19.2%) | 0 (0.0%) |
| 75 Years and over | 6 (5.3%) | 0 (0.0%) |
| Total | 1,264 (62.5%) | 92 (7.3%) |
Employment Status by Educational Attainment in Trinity
According to labor force statistics for Trinity, 71.9% of individuals (882) out of the total population between 25 and 64 years of age (1,227) are in the labor force, with 6.6% or 58 of them being unemployed. The group with the highest labor force participation rate are those with the educational attainment of bachelor's degree or higher, with 89.7% or 131 individuals in the labor force. Within the labor force, individuals with bachelor's degree or higher education have the highest percentage of unemployment, with 26.0% or 34 of them being unemployed.
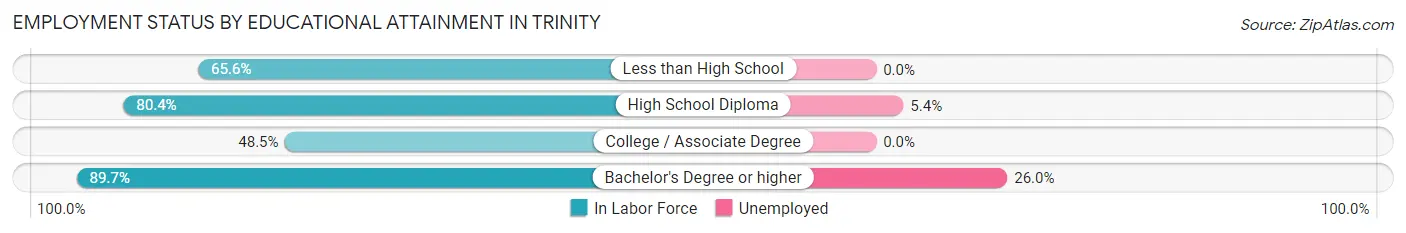
| Educational Attainment | In Labor Force | Unemployed |
| Less than High School | 191 (65.6%) | 0 (0.0%) |
| High School Diploma | 446 (80.4%) | 30 (5.4%) |
| College / Associate Degree | 114 (48.5%) | 0 (0.0%) |
| Bachelor's Degree or higher | 131 (89.7%) | 38 (26.0%) |
| Total | 882 (71.9%) | 81 (6.6%) |
Employment Occupations by Sex in Trinity
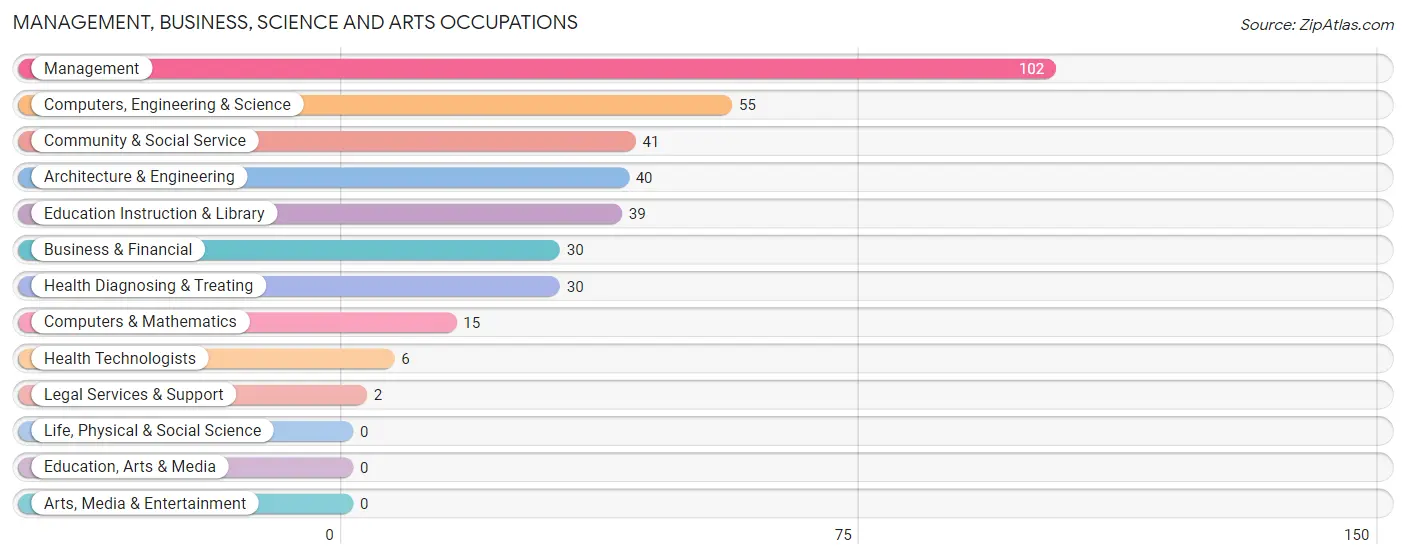
Management, Business, Science and Arts Occupations
The most common Management, Business, Science and Arts occupations in Trinity are Management (102 | 8.7%), Computers, Engineering & Science (55 | 4.7%), Community & Social Service (41 | 3.5%), Architecture & Engineering (40 | 3.4%), and Education Instruction & Library (39 | 3.3%).
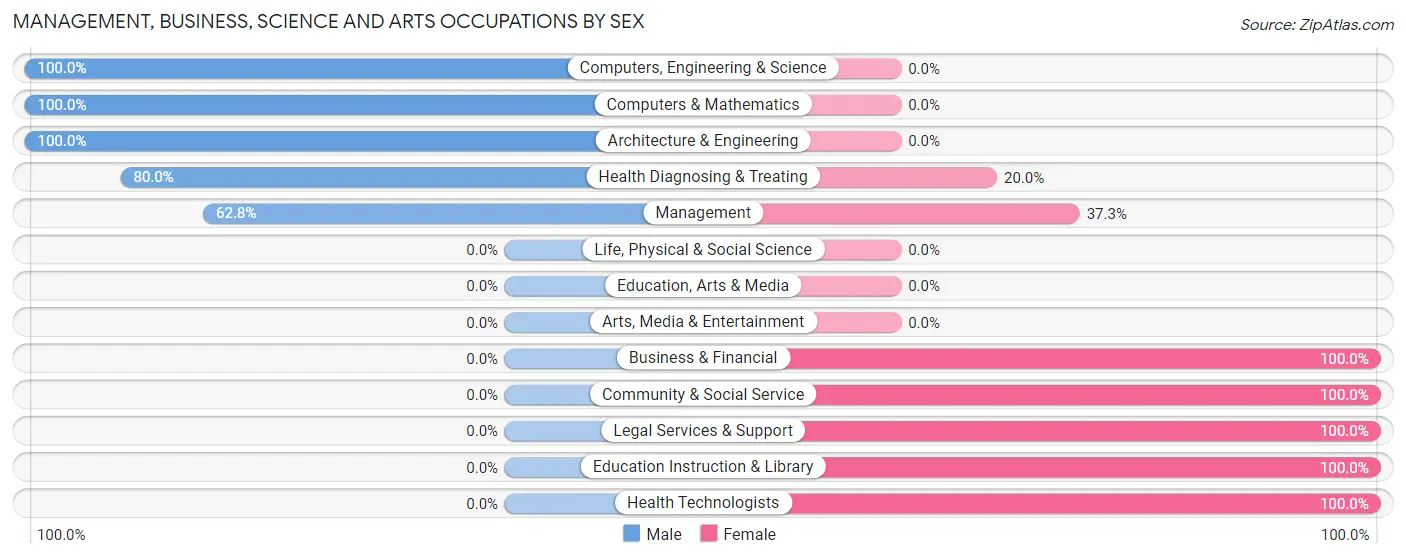
Management, Business, Science and Arts Occupations by Sex
Within the Management, Business, Science and Arts occupations in Trinity, the most male-oriented occupations are Computers, Engineering & Science (100.0%), Computers & Mathematics (100.0%), and Architecture & Engineering (100.0%), while the most female-oriented occupations are Business & Financial (100.0%), Community & Social Service (100.0%), and Legal Services & Support (100.0%).
| Occupation | Male | Female |
| Management | 64 (62.7%) | 38 (37.2%) |
| Business & Financial | 0 (0.0%) | 30 (100.0%) |
| Computers, Engineering & Science | 55 (100.0%) | 0 (0.0%) |
| Computers & Mathematics | 15 (100.0%) | 0 (0.0%) |
| Architecture & Engineering | 40 (100.0%) | 0 (0.0%) |
| Life, Physical & Social Science | 0 (0.0%) | 0 (0.0%) |
| Community & Social Service | 0 (0.0%) | 41 (100.0%) |
| Education, Arts & Media | 0 (0.0%) | 0 (0.0%) |
| Legal Services & Support | 0 (0.0%) | 2 (100.0%) |
| Education Instruction & Library | 0 (0.0%) | 39 (100.0%) |
| Arts, Media & Entertainment | 0 (0.0%) | 0 (0.0%) |
| Health Diagnosing & Treating | 24 (80.0%) | 6 (20.0%) |
| Health Technologists | 0 (0.0%) | 6 (100.0%) |
| Total (Category) | 143 (55.4%) | 115 (44.6%) |
| Total (Overall) | 718 (61.2%) | 455 (38.8%) |
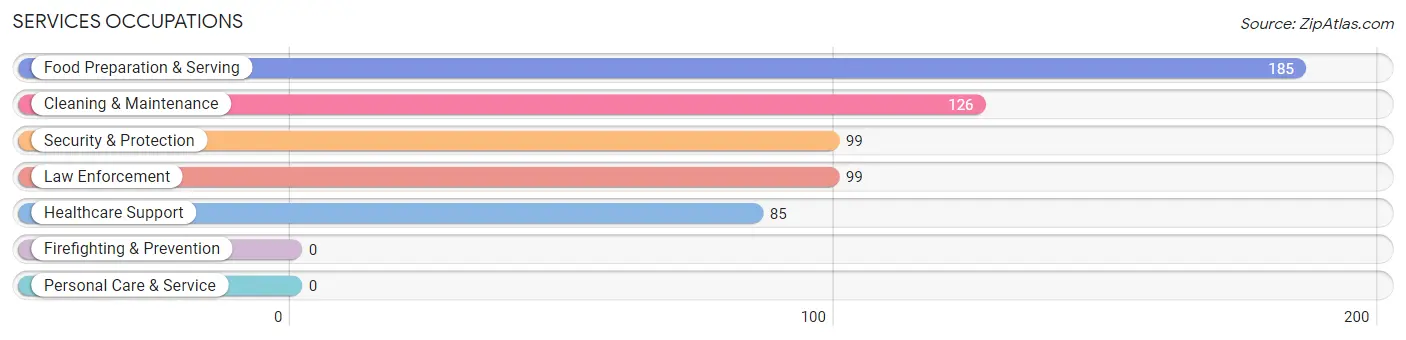
Services Occupations
The most common Services occupations in Trinity are Food Preparation & Serving (185 | 15.8%), Cleaning & Maintenance (126 | 10.7%), Security & Protection (99 | 8.4%), Law Enforcement (99 | 8.4%), and Healthcare Support (85 | 7.2%).
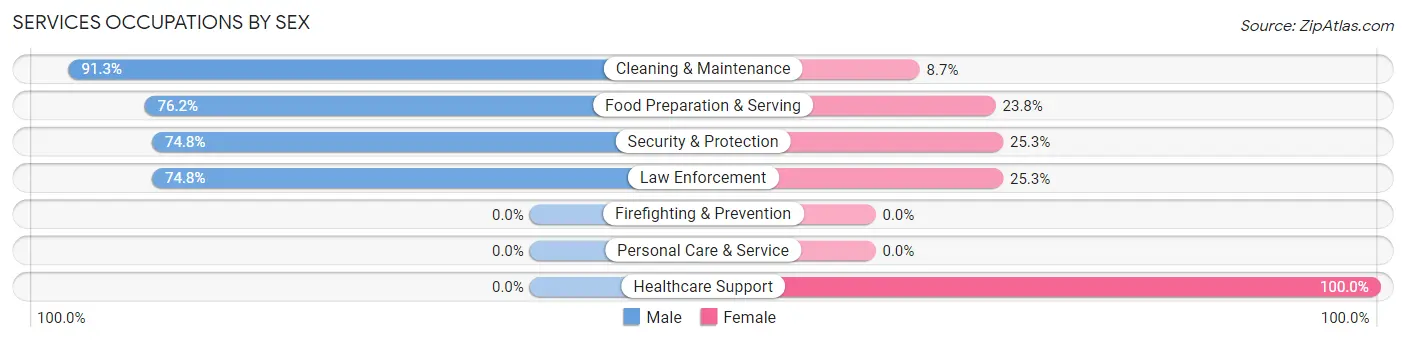
Services Occupations by Sex
Within the Services occupations in Trinity, the most male-oriented occupations are Cleaning & Maintenance (91.3%), Food Preparation & Serving (76.2%), and Security & Protection (74.8%), while the most female-oriented occupations are Healthcare Support (100.0%), Security & Protection (25.3%), and Law Enforcement (25.3%).
| Occupation | Male | Female |
| Healthcare Support | 0 (0.0%) | 85 (100.0%) |
| Security & Protection | 74 (74.8%) | 25 (25.3%) |
| Firefighting & Prevention | 0 (0.0%) | 0 (0.0%) |
| Law Enforcement | 74 (74.8%) | 25 (25.3%) |
| Food Preparation & Serving | 141 (76.2%) | 44 (23.8%) |
| Cleaning & Maintenance | 115 (91.3%) | 11 (8.7%) |
| Personal Care & Service | 0 (0.0%) | 0 (0.0%) |
| Total (Category) | 330 (66.7%) | 165 (33.3%) |
| Total (Overall) | 718 (61.2%) | 455 (38.8%) |
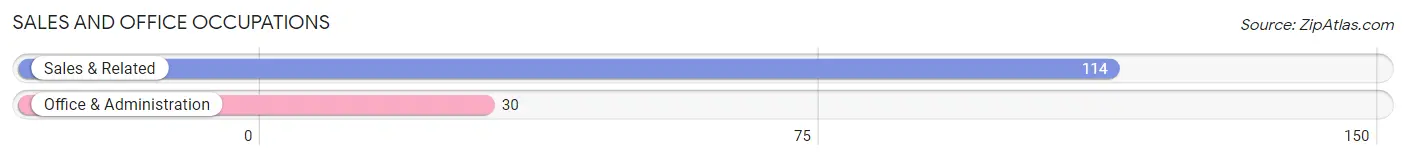
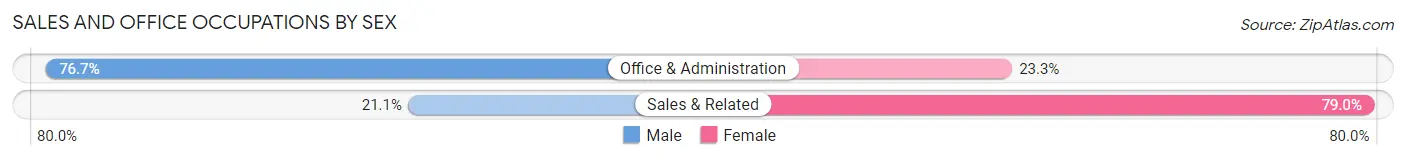
Sales and Office Occupations
The most common Sales and Office occupations in Trinity are Sales & Related (114 | 9.7%), and Office & Administration (30 | 2.6%).
Sales and Office Occupations by Sex
| Occupation | Male | Female |
| Sales & Related | 24 (21.0%) | 90 (78.9%) |
| Office & Administration | 23 (76.7%) | 7 (23.3%) |
| Total (Category) | 47 (32.6%) | 97 (67.4%) |
| Total (Overall) | 718 (61.2%) | 455 (38.8%) |
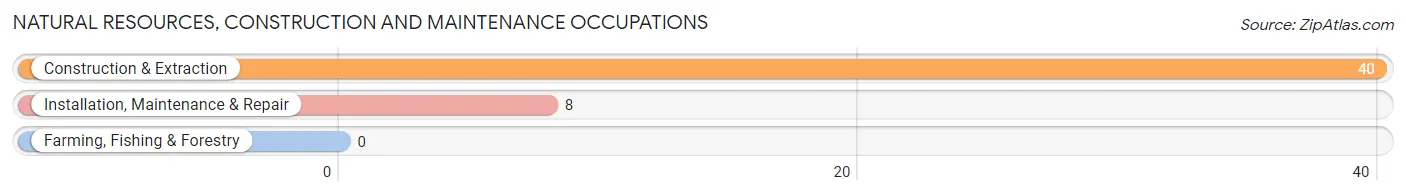
Natural Resources, Construction and Maintenance Occupations
The most common Natural Resources, Construction and Maintenance occupations in Trinity are Construction & Extraction (40 | 3.4%), and Installation, Maintenance & Repair (8 | 0.7%).
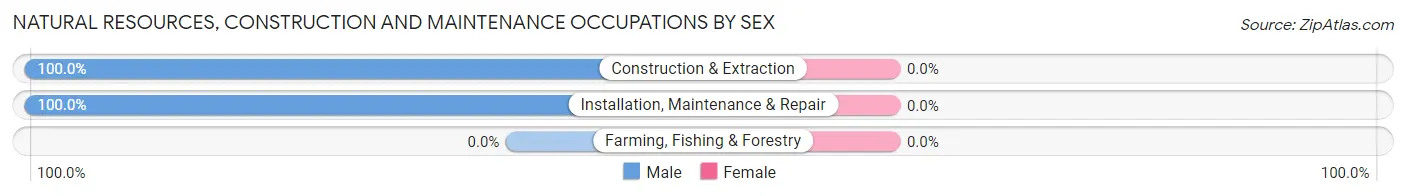
Natural Resources, Construction and Maintenance Occupations by Sex
| Occupation | Male | Female |
| Farming, Fishing & Forestry | 0 (0.0%) | 0 (0.0%) |
| Construction & Extraction | 40 (100.0%) | 0 (0.0%) |
| Installation, Maintenance & Repair | 8 (100.0%) | 0 (0.0%) |
| Total (Category) | 48 (100.0%) | 0 (0.0%) |
| Total (Overall) | 718 (61.2%) | 455 (38.8%) |
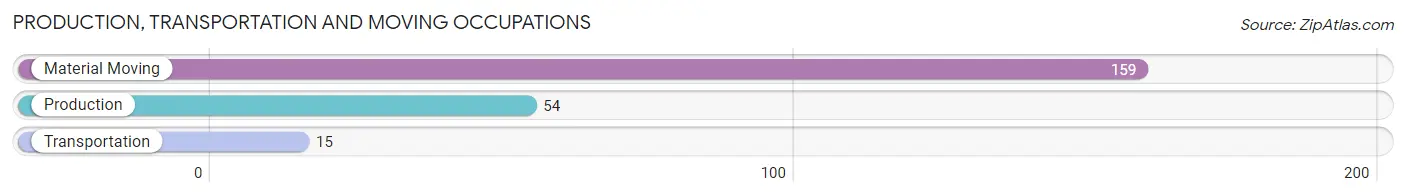
Production, Transportation and Moving Occupations
The most common Production, Transportation and Moving occupations in Trinity are Material Moving (159 | 13.6%), Production (54 | 4.6%), and Transportation (15 | 1.3%).
Production, Transportation and Moving Occupations by Sex
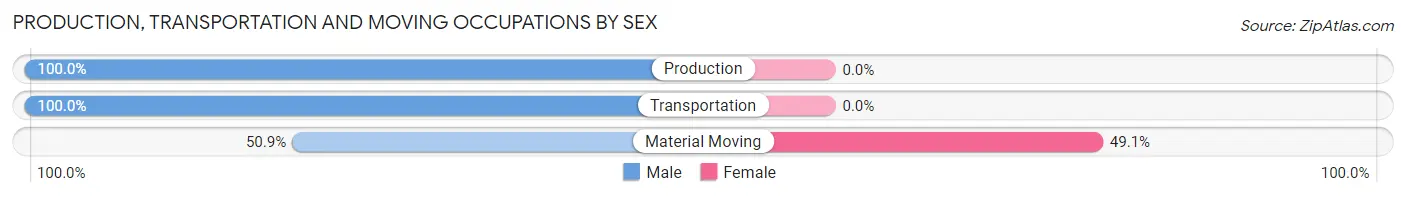
| Occupation | Male | Female |
| Production | 54 (100.0%) | 0 (0.0%) |
| Transportation | 15 (100.0%) | 0 (0.0%) |
| Material Moving | 81 (50.9%) | 78 (49.1%) |
| Total (Category) | 150 (65.8%) | 78 (34.2%) |
| Total (Overall) | 718 (61.2%) | 455 (38.8%) |
Employment Industries by Sex in Trinity
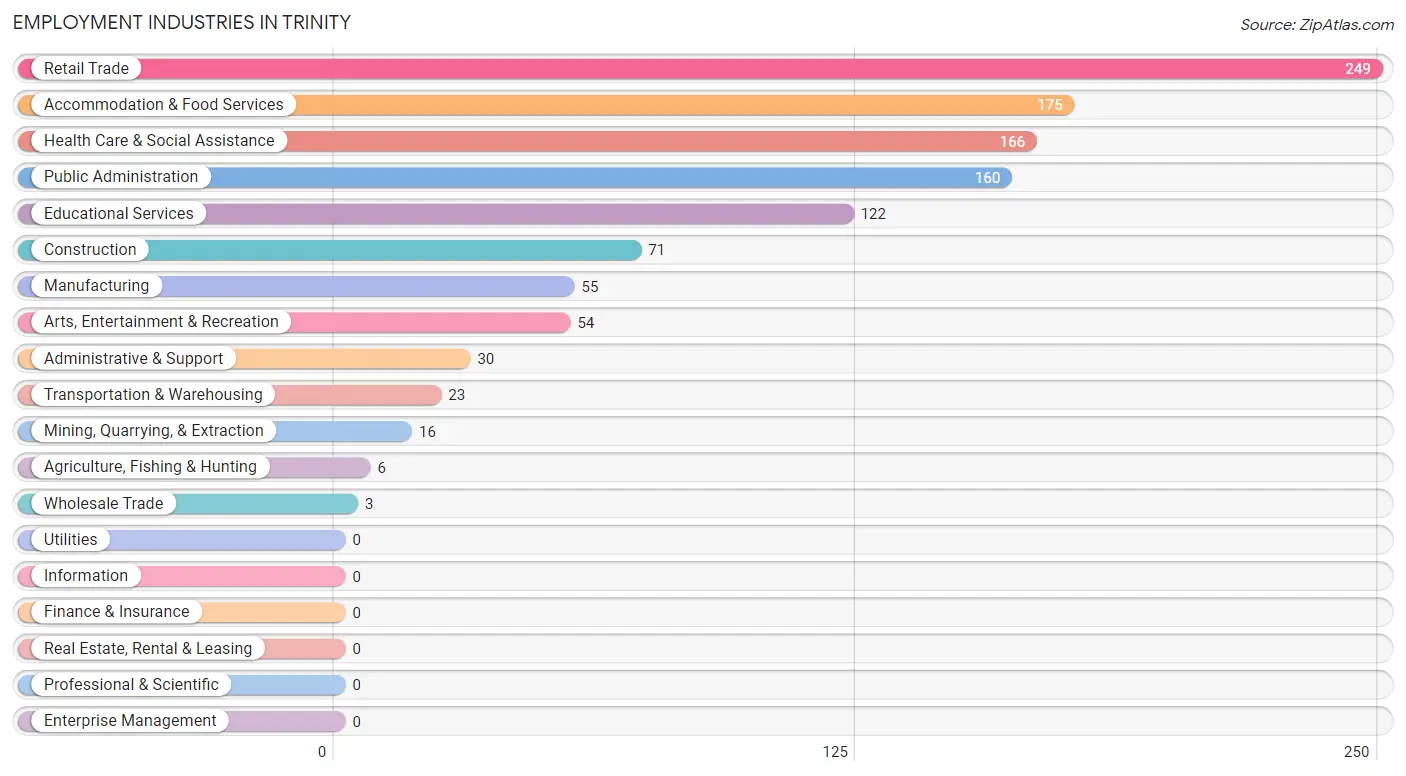
Employment Industries in Trinity
The major employment industries in Trinity include Retail Trade (249 | 21.2%), Accommodation & Food Services (175 | 14.9%), Health Care & Social Assistance (166 | 14.1%), Public Administration (160 | 13.6%), and Educational Services (122 | 10.4%).
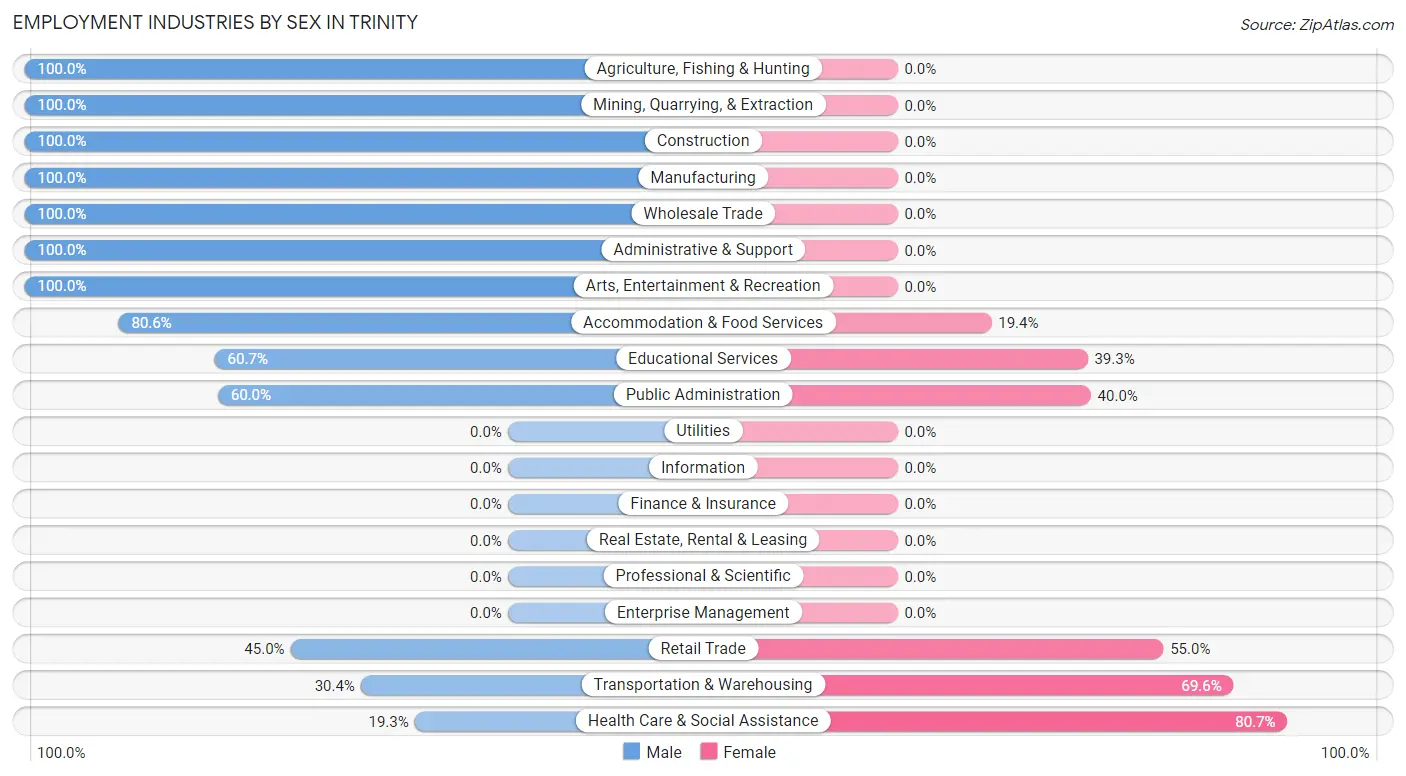
Employment Industries by Sex in Trinity
The Trinity industries that see more men than women are Agriculture, Fishing & Hunting (100.0%), Mining, Quarrying, & Extraction (100.0%), and Construction (100.0%), whereas the industries that tend to have a higher number of women are Health Care & Social Assistance (80.7%), Transportation & Warehousing (69.6%), and Retail Trade (55.0%).
| Industry | Male | Female |
| Agriculture, Fishing & Hunting | 6 (100.0%) | 0 (0.0%) |
| Mining, Quarrying, & Extraction | 16 (100.0%) | 0 (0.0%) |
| Construction | 71 (100.0%) | 0 (0.0%) |
| Manufacturing | 55 (100.0%) | 0 (0.0%) |
| Wholesale Trade | 3 (100.0%) | 0 (0.0%) |
| Retail Trade | 112 (45.0%) | 137 (55.0%) |
| Transportation & Warehousing | 7 (30.4%) | 16 (69.6%) |
| Utilities | 0 (0.0%) | 0 (0.0%) |
| Information | 0 (0.0%) | 0 (0.0%) |
| Finance & Insurance | 0 (0.0%) | 0 (0.0%) |
| Real Estate, Rental & Leasing | 0 (0.0%) | 0 (0.0%) |
| Professional & Scientific | 0 (0.0%) | 0 (0.0%) |
| Enterprise Management | 0 (0.0%) | 0 (0.0%) |
| Administrative & Support | 30 (100.0%) | 0 (0.0%) |
| Educational Services | 74 (60.7%) | 48 (39.3%) |
| Health Care & Social Assistance | 32 (19.3%) | 134 (80.7%) |
| Arts, Entertainment & Recreation | 54 (100.0%) | 0 (0.0%) |
| Accommodation & Food Services | 141 (80.6%) | 34 (19.4%) |
| Public Administration | 96 (60.0%) | 64 (40.0%) |
| Total | 718 (61.2%) | 455 (38.8%) |
Education in Trinity
School Enrollment in Trinity
The most common levels of schooling among the 635 students in Trinity are middle school (202 | 31.8%), high school (192 | 30.2%), and college / undergraduate (146 | 23.0%).
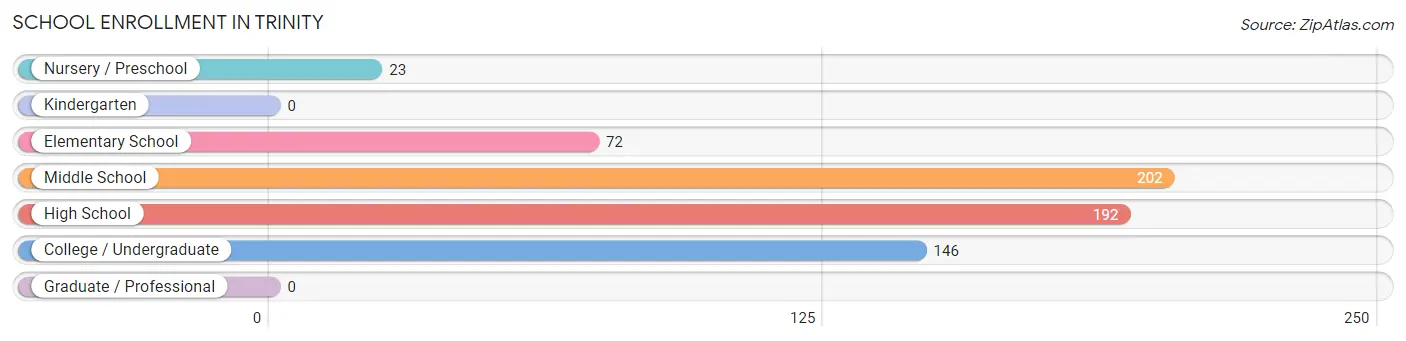
| School Level | # Students | % Students |
| Nursery / Preschool | 23 | 3.6% |
| Kindergarten | 0 | 0.0% |
| Elementary School | 72 | 11.3% |
| Middle School | 202 | 31.8% |
| High School | 192 | 30.2% |
| College / Undergraduate | 146 | 23.0% |
| Graduate / Professional | 0 | 0.0% |
| Total | 635 | 100.0% |
School Enrollment by Age by Funding Source in Trinity
Out of a total of 635 students who are enrolled in schools in Trinity, 58 (9.1%) attend a private institution, while the remaining 577 (90.9%) are enrolled in public schools. The age group of 35 years and over has the highest likelihood of being enrolled in private schools, with 30 (83.3% in the age bracket) enrolled. Conversely, the age group of 10 to 14 year olds has the lowest likelihood of being enrolled in a private school, with 224 (100.0% in the age bracket) attending a public institution.
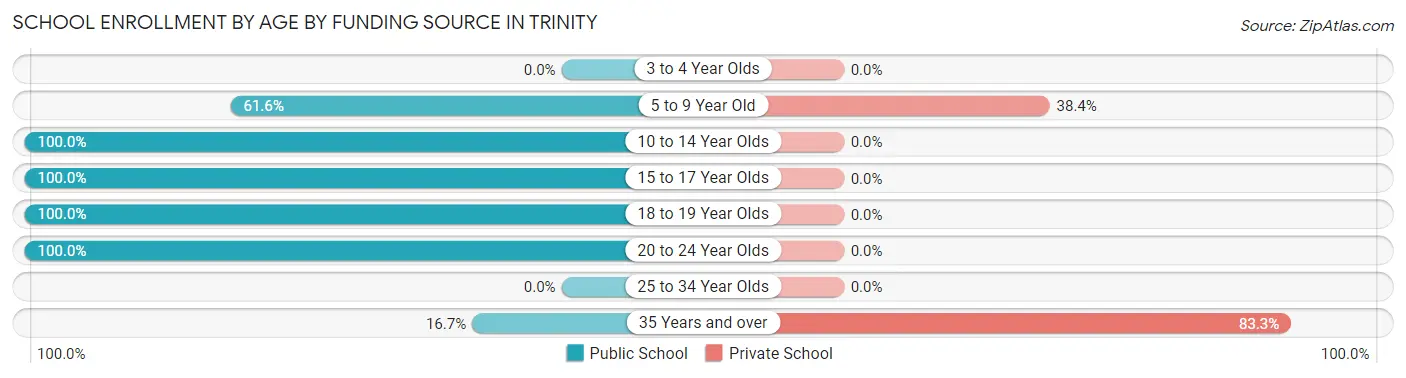
| Age Bracket | Public School | Private School |
| 3 to 4 Year Olds | 0 (0.0%) | 0 (0.0%) |
| 5 to 9 Year Old | 45 (61.6%) | 28 (38.4%) |
| 10 to 14 Year Olds | 224 (100.0%) | 0 (0.0%) |
| 15 to 17 Year Olds | 175 (100.0%) | 0 (0.0%) |
| 18 to 19 Year Olds | 110 (100.0%) | 0 (0.0%) |
| 20 to 24 Year Olds | 17 (100.0%) | 0 (0.0%) |
| 25 to 34 Year Olds | 0 (0.0%) | 0 (0.0%) |
| 35 Years and over | 6 (16.7%) | 30 (83.3%) |
| Total | 577 (90.9%) | 58 (9.1%) |
Educational Attainment by Field of Study in Trinity
Business (72 | 41.9%), engineering (44 | 25.6%), education (26 | 15.1%), computers & mathematics (15 | 8.7%), and arts & humanities (9 | 5.2%) are the most common fields of study among 172 individuals in Trinity who have obtained a bachelor's degree or higher.
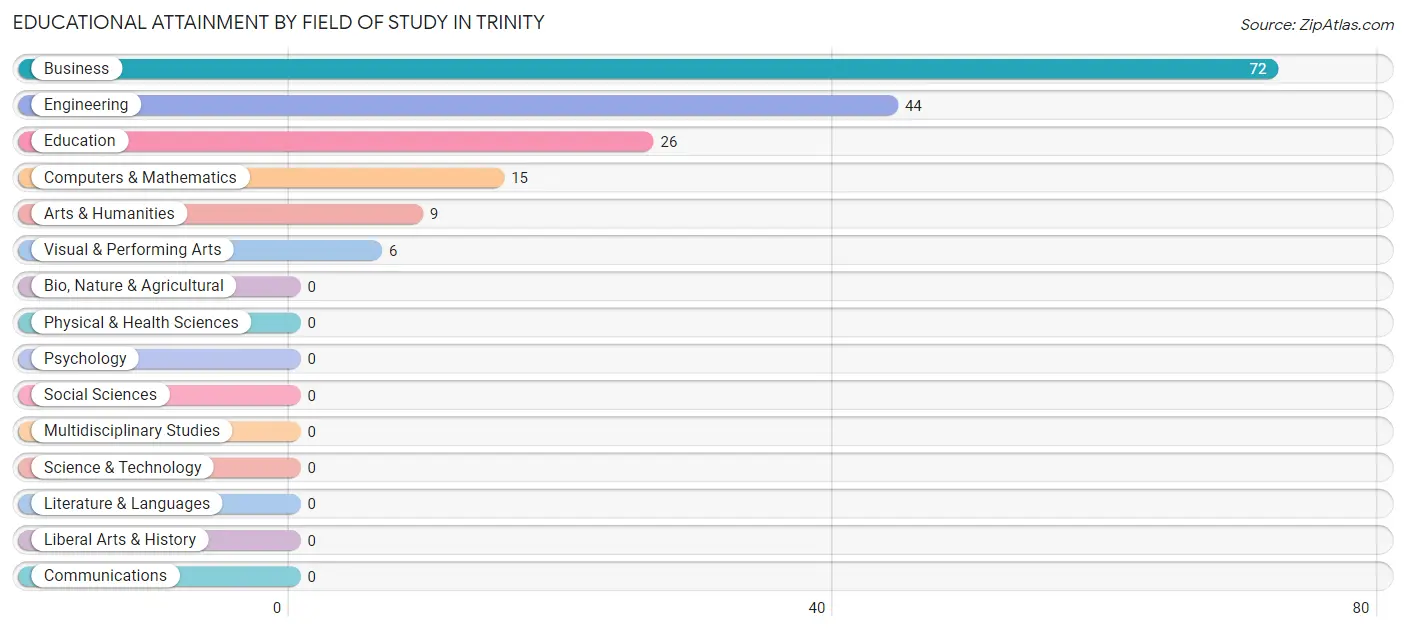
| Field of Study | # Graduates | % Graduates |
| Computers & Mathematics | 15 | 8.7% |
| Bio, Nature & Agricultural | 0 | 0.0% |
| Physical & Health Sciences | 0 | 0.0% |
| Psychology | 0 | 0.0% |
| Social Sciences | 0 | 0.0% |
| Engineering | 44 | 25.6% |
| Multidisciplinary Studies | 0 | 0.0% |
| Science & Technology | 0 | 0.0% |
| Business | 72 | 41.9% |
| Education | 26 | 15.1% |
| Literature & Languages | 0 | 0.0% |
| Liberal Arts & History | 0 | 0.0% |
| Visual & Performing Arts | 6 | 3.5% |
| Communications | 0 | 0.0% |
| Arts & Humanities | 9 | 5.2% |
| Total | 172 | 100.0% |
Transportation & Commute in Trinity
Vehicle Availability by Sex in Trinity
The most prevalent vehicle ownership categories in Trinity are males with 2 vehicles (248, accounting for 37.3%) and females with 2 vehicles (112, making up 58.8%).
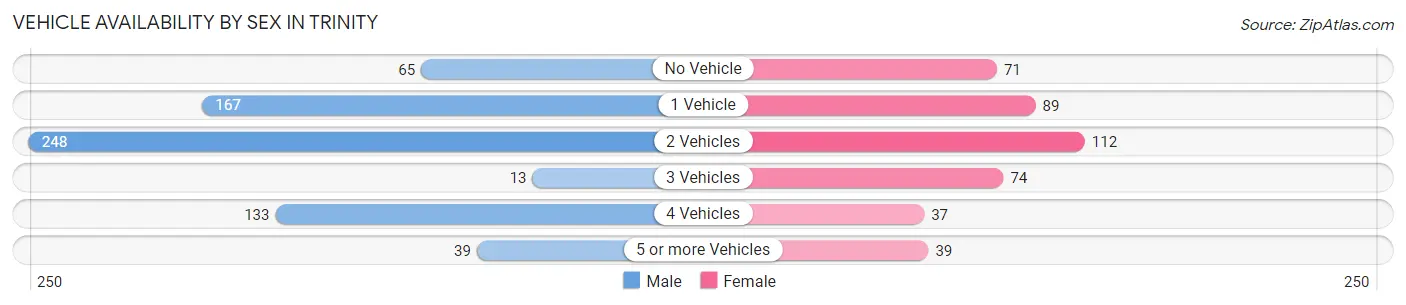
| Vehicles Available | Male | Female |
| No Vehicle | 65 (9.8%) | 71 (16.8%) |
| 1 Vehicle | 167 (25.1%) | 89 (21.1%) |
| 2 Vehicles | 248 (37.3%) | 112 (26.5%) |
| 3 Vehicles | 13 (1.9%) | 74 (17.5%) |
| 4 Vehicles | 133 (20.0%) | 37 (8.8%) |
| 5 or more Vehicles | 39 (5.9%) | 39 (9.2%) |
| Total | 665 (100.0%) | 422 (100.0%) |
Commute Time in Trinity
The most frequently occuring commute durations in Trinity are 10 to 14 minutes (213 commuters, 19.7%), 15 to 19 minutes (190 commuters, 17.6%), and less than 5 minutes (150 commuters, 13.9%).
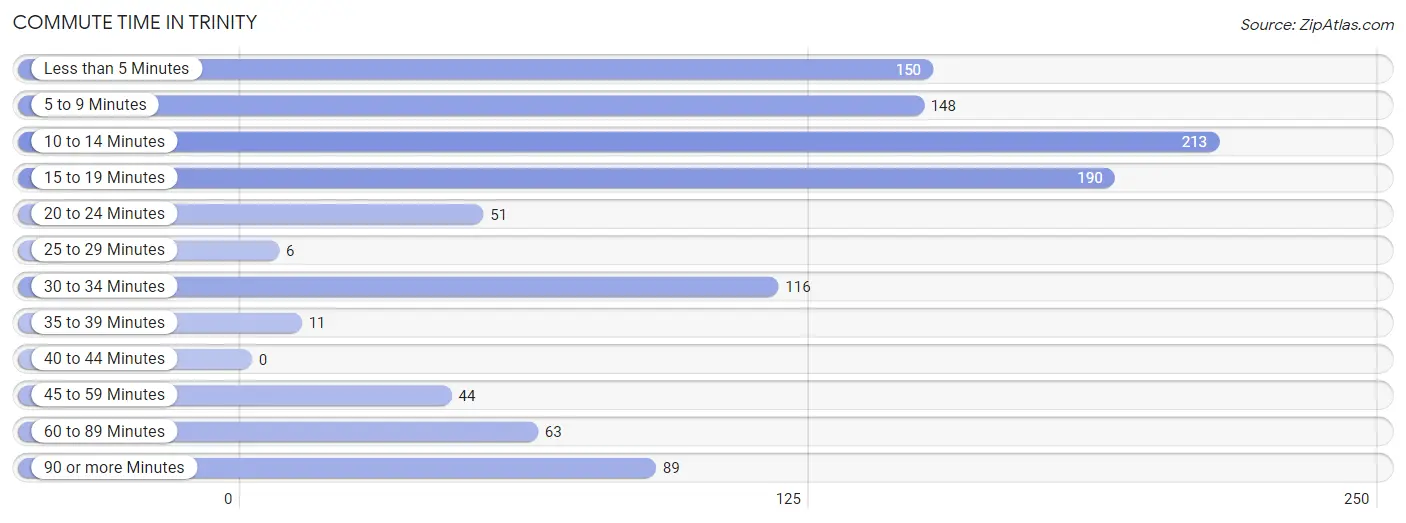
| Commute Time | # Commuters | % Commuters |
| Less than 5 Minutes | 150 | 13.9% |
| 5 to 9 Minutes | 148 | 13.7% |
| 10 to 14 Minutes | 213 | 19.7% |
| 15 to 19 Minutes | 190 | 17.6% |
| 20 to 24 Minutes | 51 | 4.7% |
| 25 to 29 Minutes | 6 | 0.6% |
| 30 to 34 Minutes | 116 | 10.7% |
| 35 to 39 Minutes | 11 | 1.0% |
| 40 to 44 Minutes | 0 | 0.0% |
| 45 to 59 Minutes | 44 | 4.1% |
| 60 to 89 Minutes | 63 | 5.8% |
| 90 or more Minutes | 89 | 8.2% |
Commute Time by Sex in Trinity
The most common commute times in Trinity are 10 to 14 minutes (169 commuters, 25.6%) for males and 5 to 9 minutes (91 commuters, 21.6%) for females.
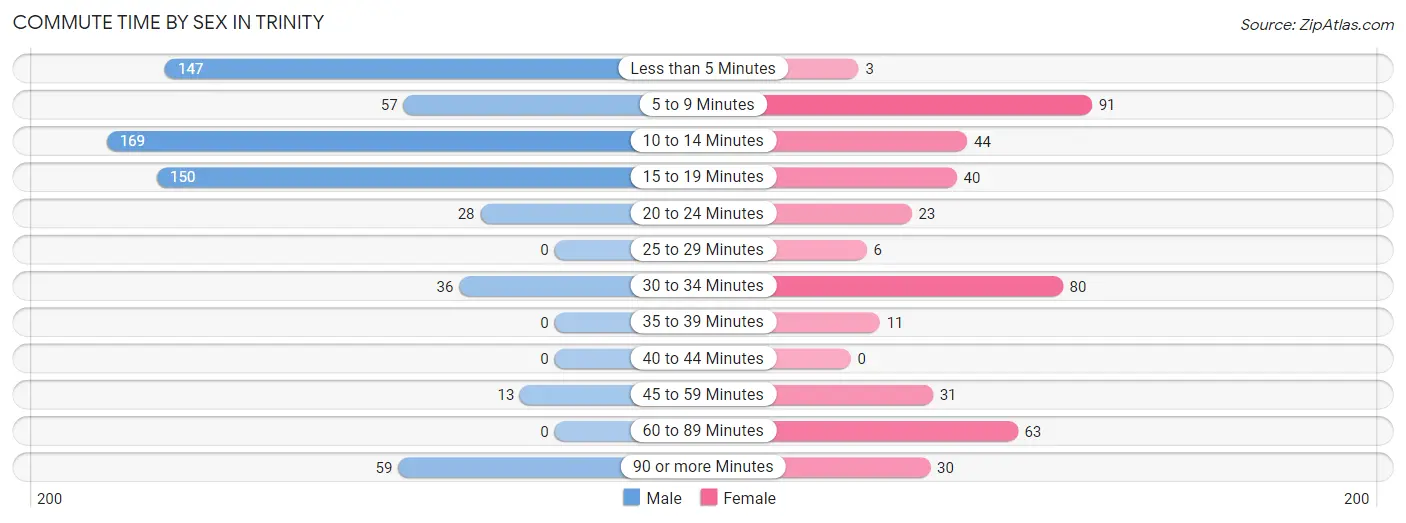
| Commute Time | Male | Female |
| Less than 5 Minutes | 147 (22.3%) | 3 (0.7%) |
| 5 to 9 Minutes | 57 (8.6%) | 91 (21.6%) |
| 10 to 14 Minutes | 169 (25.6%) | 44 (10.4%) |
| 15 to 19 Minutes | 150 (22.8%) | 40 (9.5%) |
| 20 to 24 Minutes | 28 (4.3%) | 23 (5.4%) |
| 25 to 29 Minutes | 0 (0.0%) | 6 (1.4%) |
| 30 to 34 Minutes | 36 (5.5%) | 80 (19.0%) |
| 35 to 39 Minutes | 0 (0.0%) | 11 (2.6%) |
| 40 to 44 Minutes | 0 (0.0%) | 0 (0.0%) |
| 45 to 59 Minutes | 13 (2.0%) | 31 (7.3%) |
| 60 to 89 Minutes | 0 (0.0%) | 63 (14.9%) |
| 90 or more Minutes | 59 (8.9%) | 30 (7.1%) |
Time of Departure to Work by Sex in Trinity
The most frequent times of departure to work in Trinity are 4:00 PM to 11:59 PM (184, 27.9%) for males and 12:00 AM to 4:59 AM (109, 25.8%) for females.
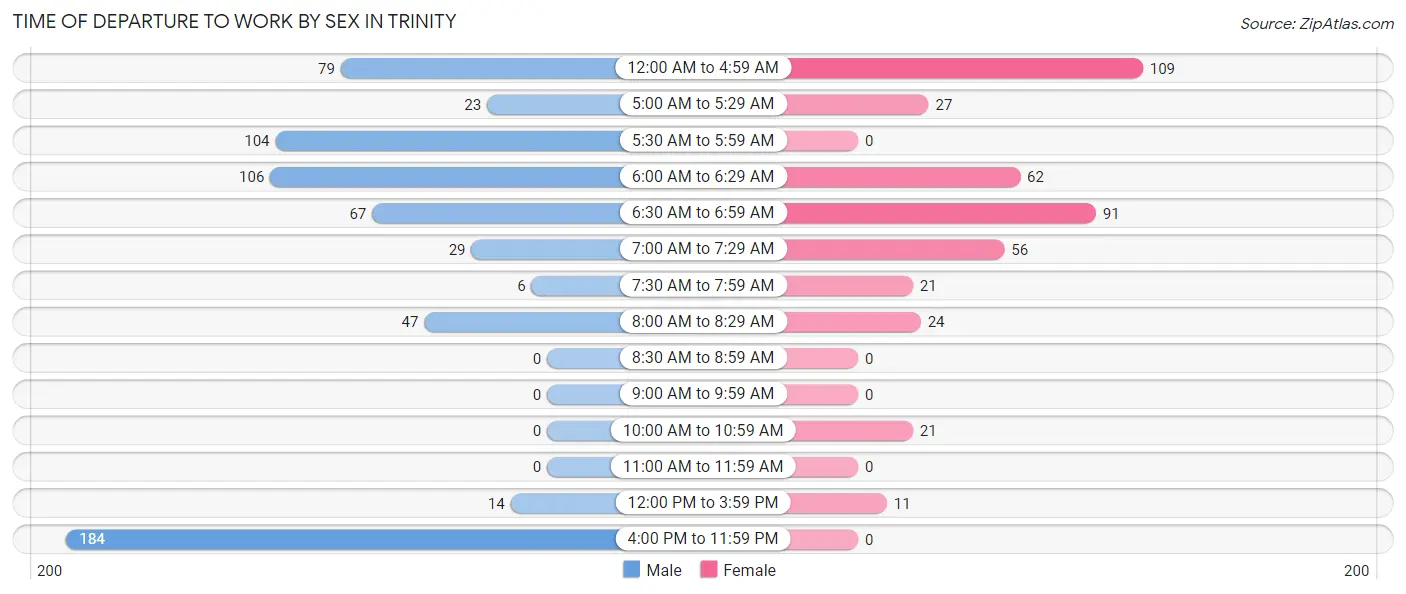
| Time of Departure | Male | Female |
| 12:00 AM to 4:59 AM | 79 (12.0%) | 109 (25.8%) |
| 5:00 AM to 5:29 AM | 23 (3.5%) | 27 (6.4%) |
| 5:30 AM to 5:59 AM | 104 (15.8%) | 0 (0.0%) |
| 6:00 AM to 6:29 AM | 106 (16.1%) | 62 (14.7%) |
| 6:30 AM to 6:59 AM | 67 (10.2%) | 91 (21.6%) |
| 7:00 AM to 7:29 AM | 29 (4.4%) | 56 (13.3%) |
| 7:30 AM to 7:59 AM | 6 (0.9%) | 21 (5.0%) |
| 8:00 AM to 8:29 AM | 47 (7.1%) | 24 (5.7%) |
| 8:30 AM to 8:59 AM | 0 (0.0%) | 0 (0.0%) |
| 9:00 AM to 9:59 AM | 0 (0.0%) | 0 (0.0%) |
| 10:00 AM to 10:59 AM | 0 (0.0%) | 21 (5.0%) |
| 11:00 AM to 11:59 AM | 0 (0.0%) | 0 (0.0%) |
| 12:00 PM to 3:59 PM | 14 (2.1%) | 11 (2.6%) |
| 4:00 PM to 11:59 PM | 184 (27.9%) | 0 (0.0%) |
| Total | 659 (100.0%) | 422 (100.0%) |
Housing Occupancy in Trinity
Occupancy by Ownership in Trinity
Of the total 1,031 dwellings in Trinity, owner-occupied units account for 557 (54.0%), while renter-occupied units make up 474 (46.0%).
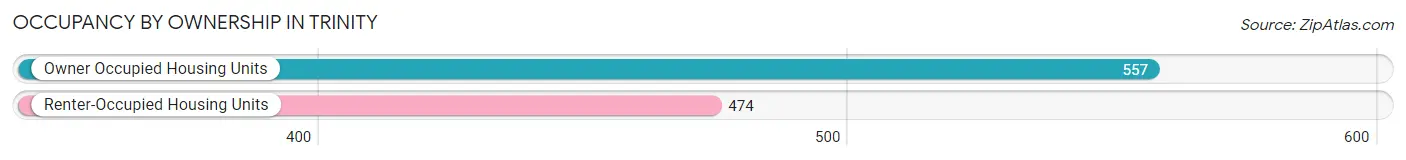
| Occupancy | # Housing Units | % Housing Units |
| Owner Occupied Housing Units | 557 | 54.0% |
| Renter-Occupied Housing Units | 474 | 46.0% |
| Total Occupied Housing Units | 1,031 | 100.0% |
Occupancy by Household Size in Trinity
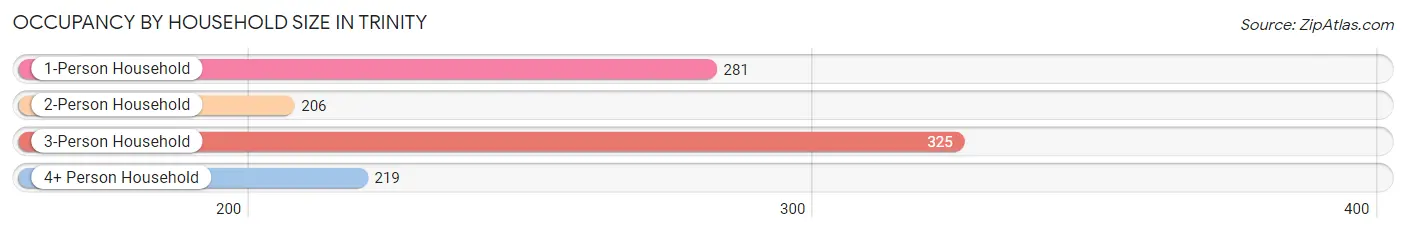
| Household Size | # Housing Units | % Housing Units |
| 1-Person Household | 281 | 27.3% |
| 2-Person Household | 206 | 20.0% |
| 3-Person Household | 325 | 31.5% |
| 4+ Person Household | 219 | 21.2% |
| Total Housing Units | 1,031 | 100.0% |
Occupancy by Ownership by Household Size in Trinity
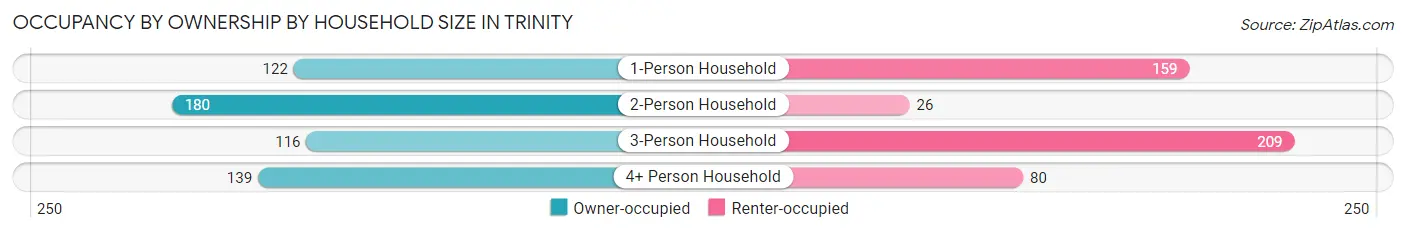
| Household Size | Owner-occupied | Renter-occupied |
| 1-Person Household | 122 (43.4%) | 159 (56.6%) |
| 2-Person Household | 180 (87.4%) | 26 (12.6%) |
| 3-Person Household | 116 (35.7%) | 209 (64.3%) |
| 4+ Person Household | 139 (63.5%) | 80 (36.5%) |
| Total Housing Units | 557 (54.0%) | 474 (46.0%) |
Occupancy by Educational Attainment in Trinity
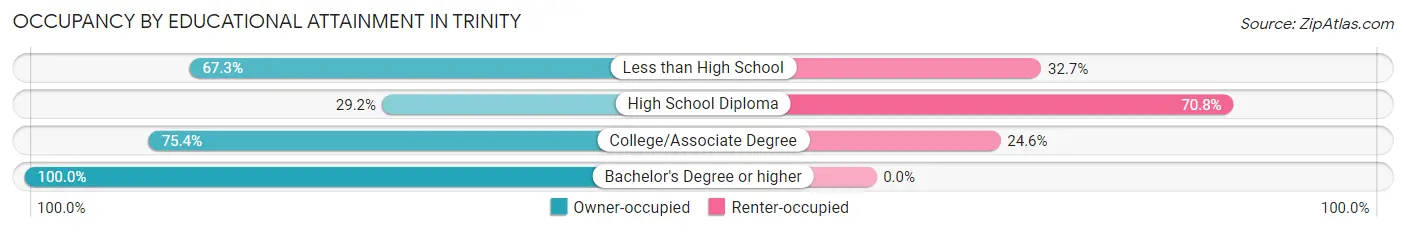
| Household Size | Owner-occupied | Renter-occupied |
| Less than High School | 142 (67.3%) | 69 (32.7%) |
| High School Diploma | 140 (29.2%) | 340 (70.8%) |
| College/Associate Degree | 199 (75.4%) | 65 (24.6%) |
| Bachelor's Degree or higher | 76 (100.0%) | 0 (0.0%) |
Occupancy by Age of Householder in Trinity
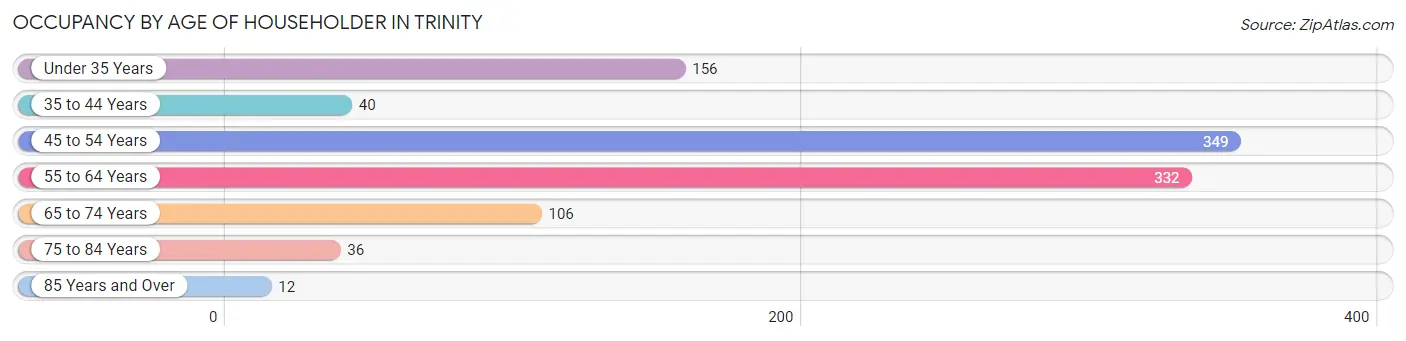
| Age Bracket | # Households | % Households |
| Under 35 Years | 156 | 15.1% |
| 35 to 44 Years | 40 | 3.9% |
| 45 to 54 Years | 349 | 33.9% |
| 55 to 64 Years | 332 | 32.2% |
| 65 to 74 Years | 106 | 10.3% |
| 75 to 84 Years | 36 | 3.5% |
| 85 Years and Over | 12 | 1.2% |
| Total | 1,031 | 100.0% |
Housing Finances in Trinity
Median Income by Occupancy in Trinity
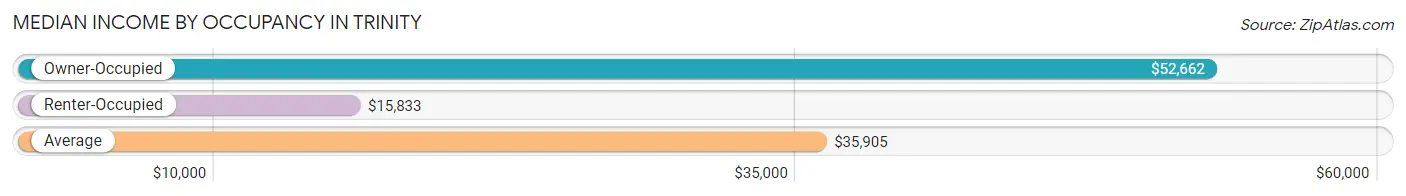
| Occupancy Type | # Households | Median Income |
| Owner-Occupied | 557 (54.0%) | $52,662 |
| Renter-Occupied | 474 (46.0%) | $15,833 |
| Average | 1,031 (100.0%) | $35,905 |
Occupancy by Householder Income Bracket in Trinity
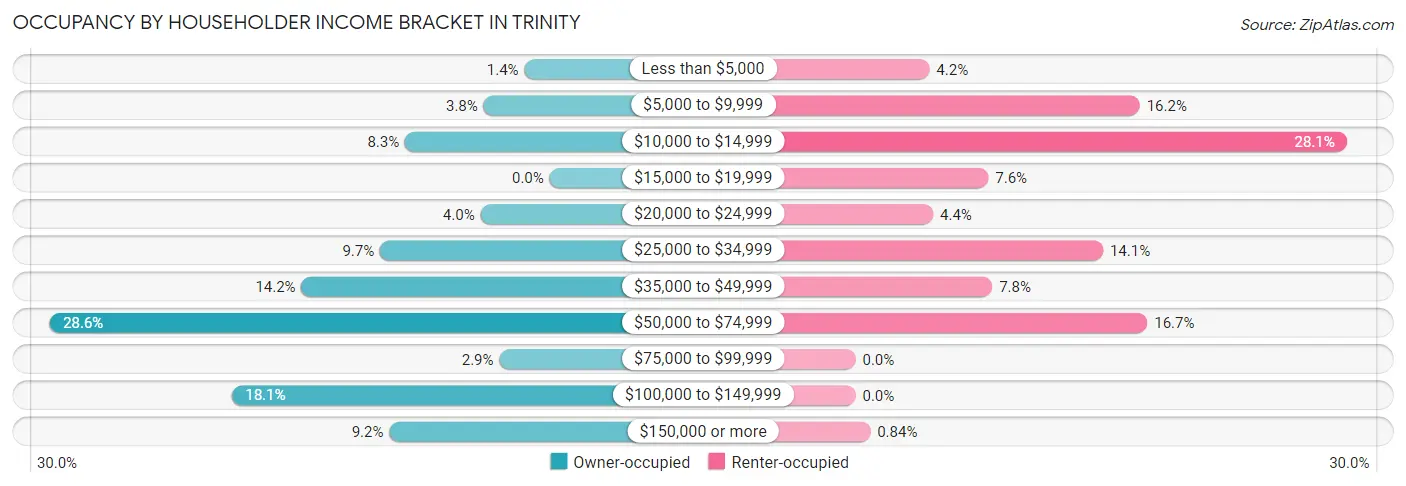
| Income Bracket | Owner-occupied | Renter-occupied |
| Less than $5,000 | 8 (1.4%) | 20 (4.2%) |
| $5,000 to $9,999 | 21 (3.8%) | 77 (16.2%) |
| $10,000 to $14,999 | 46 (8.3%) | 133 (28.1%) |
| $15,000 to $19,999 | 0 (0.0%) | 36 (7.6%) |
| $20,000 to $24,999 | 22 (4.0%) | 21 (4.4%) |
| $25,000 to $34,999 | 54 (9.7%) | 67 (14.1%) |
| $35,000 to $49,999 | 79 (14.2%) | 37 (7.8%) |
| $50,000 to $74,999 | 159 (28.5%) | 79 (16.7%) |
| $75,000 to $99,999 | 16 (2.9%) | 0 (0.0%) |
| $100,000 to $149,999 | 101 (18.1%) | 0 (0.0%) |
| $150,000 or more | 51 (9.2%) | 4 (0.8%) |
| Total | 557 (100.0%) | 474 (100.0%) |
Monthly Housing Cost Tiers in Trinity
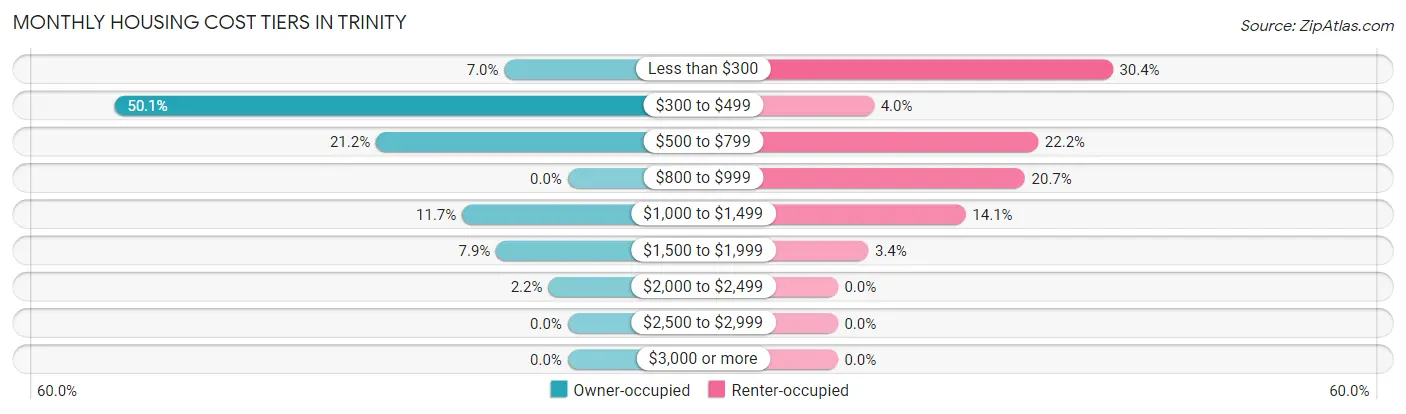
| Monthly Cost | Owner-occupied | Renter-occupied |
| Less than $300 | 39 (7.0%) | 144 (30.4%) |
| $300 to $499 | 279 (50.1%) | 19 (4.0%) |
| $500 to $799 | 118 (21.2%) | 105 (22.2%) |
| $800 to $999 | 0 (0.0%) | 98 (20.7%) |
| $1,000 to $1,499 | 65 (11.7%) | 67 (14.1%) |
| $1,500 to $1,999 | 44 (7.9%) | 16 (3.4%) |
| $2,000 to $2,499 | 12 (2.1%) | 0 (0.0%) |
| $2,500 to $2,999 | 0 (0.0%) | 0 (0.0%) |
| $3,000 or more | 0 (0.0%) | 0 (0.0%) |
| Total | 557 (100.0%) | 474 (100.0%) |
Physical Housing Characteristics in Trinity
Housing Structures in Trinity
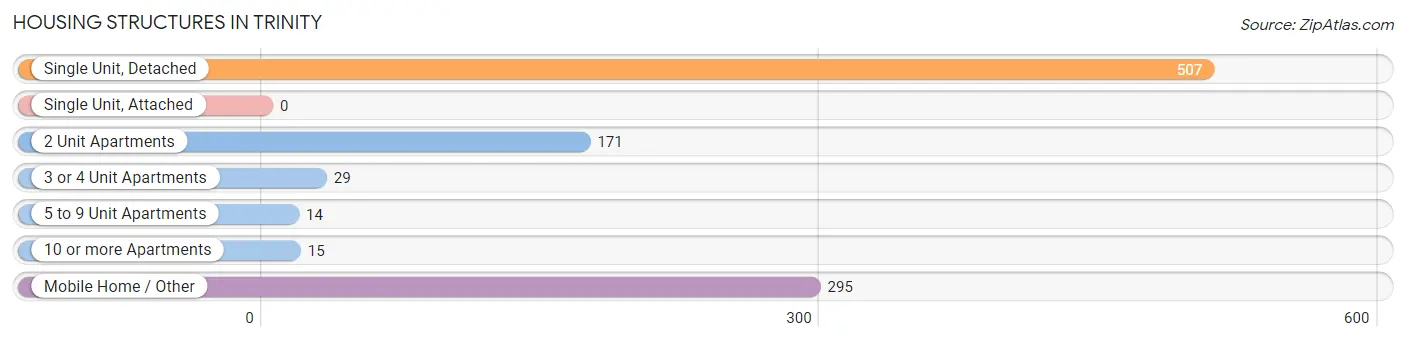
| Structure Type | # Housing Units | % Housing Units |
| Single Unit, Detached | 507 | 49.2% |
| Single Unit, Attached | 0 | 0.0% |
| 2 Unit Apartments | 171 | 16.6% |
| 3 or 4 Unit Apartments | 29 | 2.8% |
| 5 to 9 Unit Apartments | 14 | 1.4% |
| 10 or more Apartments | 15 | 1.5% |
| Mobile Home / Other | 295 | 28.6% |
| Total | 1,031 | 100.0% |
Housing Structures by Occupancy in Trinity
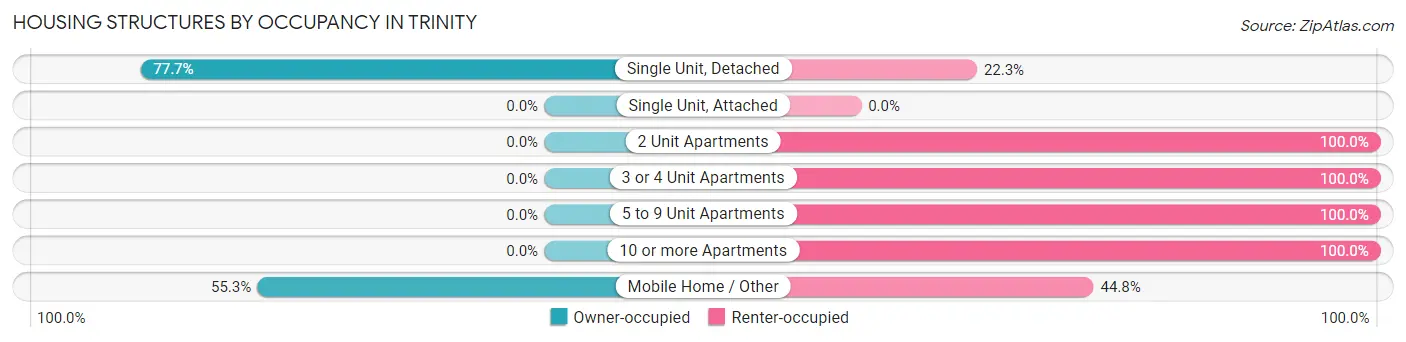
| Structure Type | Owner-occupied | Renter-occupied |
| Single Unit, Detached | 394 (77.7%) | 113 (22.3%) |
| Single Unit, Attached | 0 (0.0%) | 0 (0.0%) |
| 2 Unit Apartments | 0 (0.0%) | 171 (100.0%) |
| 3 or 4 Unit Apartments | 0 (0.0%) | 29 (100.0%) |
| 5 to 9 Unit Apartments | 0 (0.0%) | 14 (100.0%) |
| 10 or more Apartments | 0 (0.0%) | 15 (100.0%) |
| Mobile Home / Other | 163 (55.2%) | 132 (44.8%) |
| Total | 557 (54.0%) | 474 (46.0%) |
Housing Structures by Number of Rooms in Trinity
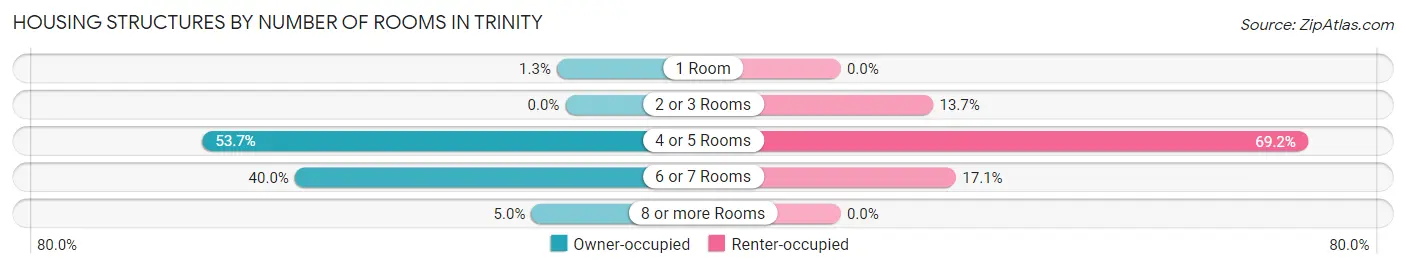
| Number of Rooms | Owner-occupied | Renter-occupied |
| 1 Room | 7 (1.3%) | 0 (0.0%) |
| 2 or 3 Rooms | 0 (0.0%) | 65 (13.7%) |
| 4 or 5 Rooms | 299 (53.7%) | 328 (69.2%) |
| 6 or 7 Rooms | 223 (40.0%) | 81 (17.1%) |
| 8 or more Rooms | 28 (5.0%) | 0 (0.0%) |
| Total | 557 (100.0%) | 474 (100.0%) |
Housing Structure by Heating Type in Trinity
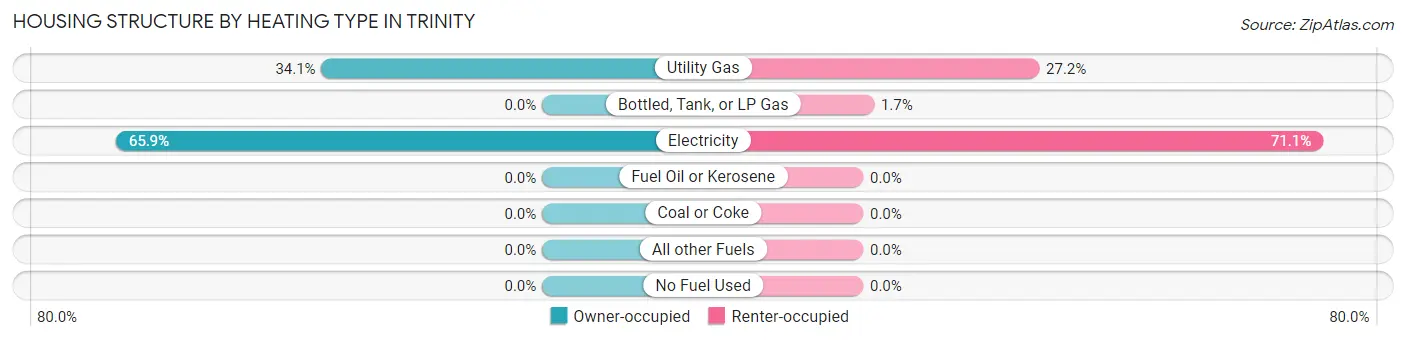
| Heating Type | Owner-occupied | Renter-occupied |
| Utility Gas | 190 (34.1%) | 129 (27.2%) |
| Bottled, Tank, or LP Gas | 0 (0.0%) | 8 (1.7%) |
| Electricity | 367 (65.9%) | 337 (71.1%) |
| Fuel Oil or Kerosene | 0 (0.0%) | 0 (0.0%) |
| Coal or Coke | 0 (0.0%) | 0 (0.0%) |
| All other Fuels | 0 (0.0%) | 0 (0.0%) |
| No Fuel Used | 0 (0.0%) | 0 (0.0%) |
| Total | 557 (100.0%) | 474 (100.0%) |
Household Vehicle Usage in Trinity
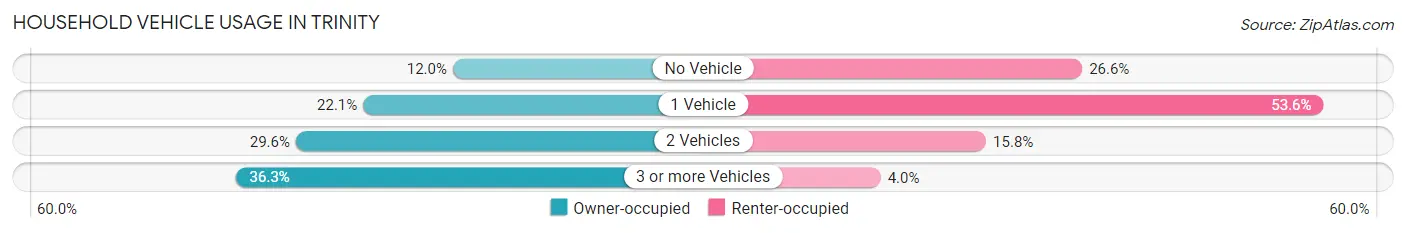
| Vehicles per Household | Owner-occupied | Renter-occupied |
| No Vehicle | 67 (12.0%) | 126 (26.6%) |
| 1 Vehicle | 123 (22.1%) | 254 (53.6%) |
| 2 Vehicles | 165 (29.6%) | 75 (15.8%) |
| 3 or more Vehicles | 202 (36.3%) | 19 (4.0%) |
| Total | 557 (100.0%) | 474 (100.0%) |
Real Estate & Mortgages in Trinity
Real Estate and Mortgage Overview in Trinity
| Characteristic | Without Mortgage | With Mortgage |
| Housing Units | 461 | 96 |
| Median Property Value | $59,600 | $173,500 |
| Median Household Income | $53,542 | $5 |
| Monthly Housing Costs | $446 | $0 |
| Real Estate Taxes | $1,007 | $0 |
Property Value by Mortgage Status in Trinity
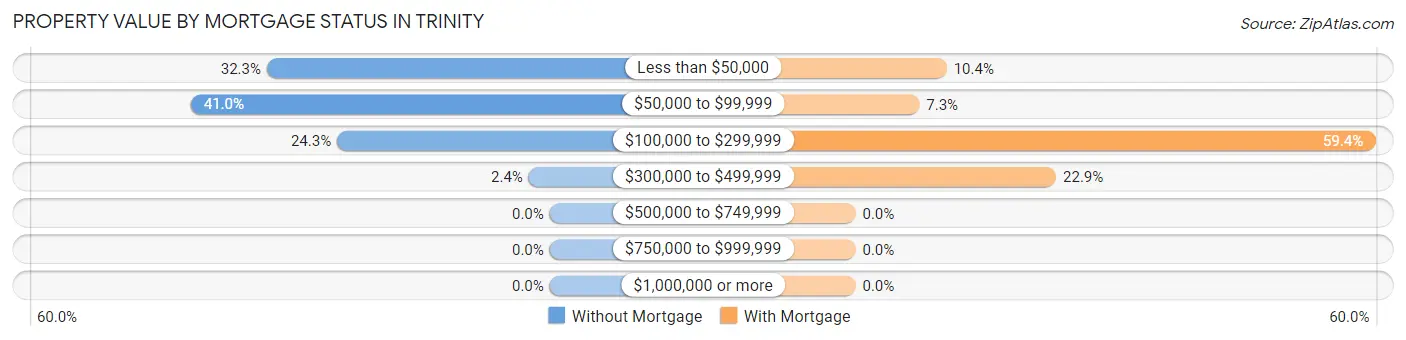
| Property Value | Without Mortgage | With Mortgage |
| Less than $50,000 | 149 (32.3%) | 10 (10.4%) |
| $50,000 to $99,999 | 189 (41.0%) | 7 (7.3%) |
| $100,000 to $299,999 | 112 (24.3%) | 57 (59.4%) |
| $300,000 to $499,999 | 11 (2.4%) | 22 (22.9%) |
| $500,000 to $749,999 | 0 (0.0%) | 0 (0.0%) |
| $750,000 to $999,999 | 0 (0.0%) | 0 (0.0%) |
| $1,000,000 or more | 0 (0.0%) | 0 (0.0%) |
| Total | 461 (100.0%) | 96 (100.0%) |
Household Income by Mortgage Status in Trinity
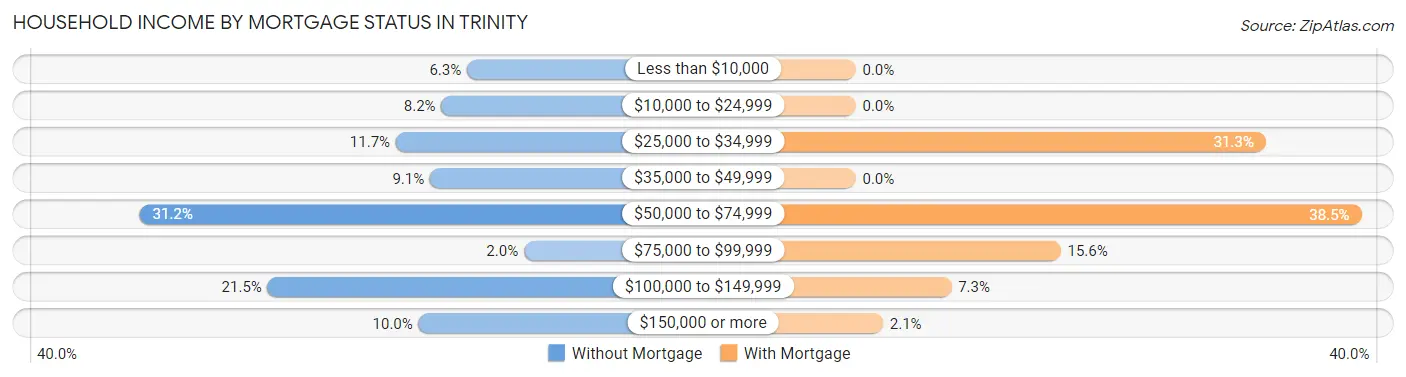
| Household Income | Without Mortgage | With Mortgage |
| Less than $10,000 | 29 (6.3%) | 0 (0.0%) |
| $10,000 to $24,999 | 38 (8.2%) | 0 (0.0%) |
| $25,000 to $34,999 | 54 (11.7%) | 30 (31.2%) |
| $35,000 to $49,999 | 42 (9.1%) | 0 (0.0%) |
| $50,000 to $74,999 | 144 (31.2%) | 37 (38.5%) |
| $75,000 to $99,999 | 9 (1.9%) | 15 (15.6%) |
| $100,000 to $149,999 | 99 (21.5%) | 7 (7.3%) |
| $150,000 or more | 46 (10.0%) | 2 (2.1%) |
| Total | 461 (100.0%) | 96 (100.0%) |
Property Value to Household Income Ratio in Trinity
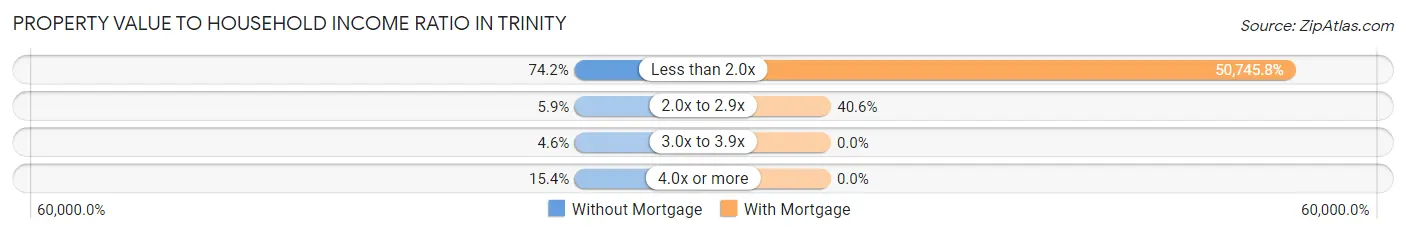
| Value-to-Income Ratio | Without Mortgage | With Mortgage |
| Less than 2.0x | 342 (74.2%) | 48,716 (50,745.8%) |
| 2.0x to 2.9x | 27 (5.9%) | 39 (40.6%) |
| 3.0x to 3.9x | 21 (4.6%) | 0 (0.0%) |
| 4.0x or more | 71 (15.4%) | 0 (0.0%) |
| Total | 461 (100.0%) | 96 (100.0%) |
Real Estate Taxes by Mortgage Status in Trinity
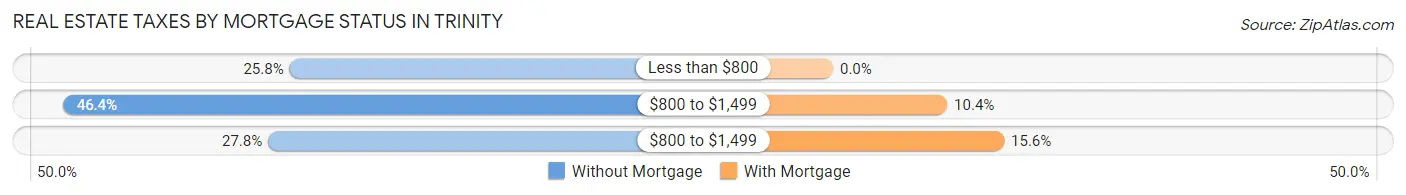
| Property Taxes | Without Mortgage | With Mortgage |
| Less than $800 | 119 (25.8%) | 0 (0.0%) |
| $800 to $1,499 | 214 (46.4%) | 10 (10.4%) |
| $800 to $1,499 | 128 (27.8%) | 15 (15.6%) |
| Total | 461 (100.0%) | 96 (100.0%) |
Health & Disability in Trinity
Health Insurance Coverage by Age in Trinity
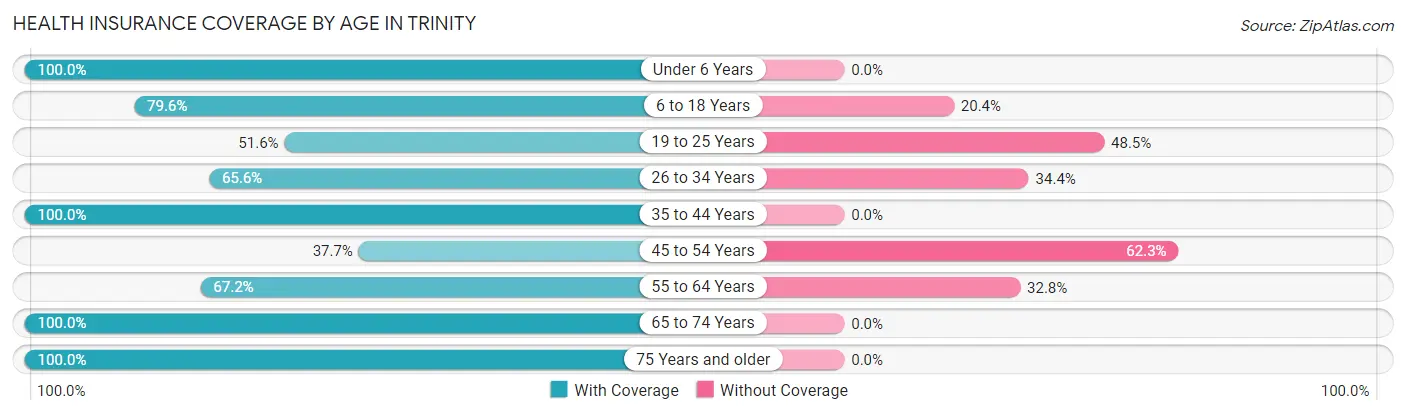
| Age Bracket | With Coverage | Without Coverage |
| Under 6 Years | 164 (100.0%) | 0 (0.0%) |
| 6 to 18 Years | 366 (79.6%) | 94 (20.4%) |
| 19 to 25 Years | 200 (51.5%) | 188 (48.4%) |
| 26 to 34 Years | 105 (65.6%) | 55 (34.4%) |
| 35 to 44 Years | 59 (100.0%) | 0 (0.0%) |
| 45 to 54 Years | 190 (37.7%) | 314 (62.3%) |
| 55 to 64 Years | 328 (67.2%) | 160 (32.8%) |
| 65 to 74 Years | 130 (100.0%) | 0 (0.0%) |
| 75 Years and older | 60 (100.0%) | 0 (0.0%) |
| Total | 1,602 (66.4%) | 811 (33.6%) |
Health Insurance Coverage by Citizenship Status in Trinity
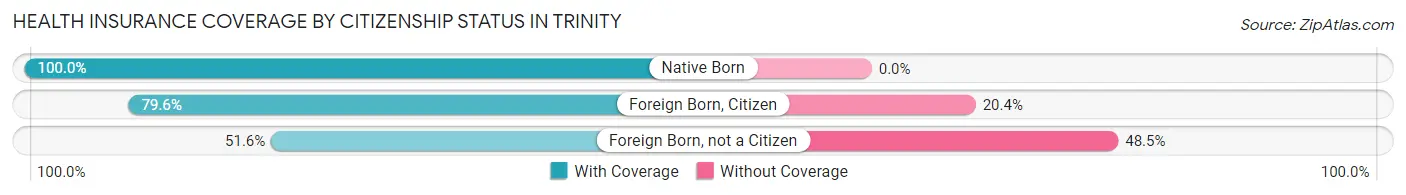
| Citizenship Status | With Coverage | Without Coverage |
| Native Born | 164 (100.0%) | 0 (0.0%) |
| Foreign Born, Citizen | 366 (79.6%) | 94 (20.4%) |
| Foreign Born, not a Citizen | 200 (51.5%) | 188 (48.4%) |
Health Insurance Coverage by Household Income in Trinity
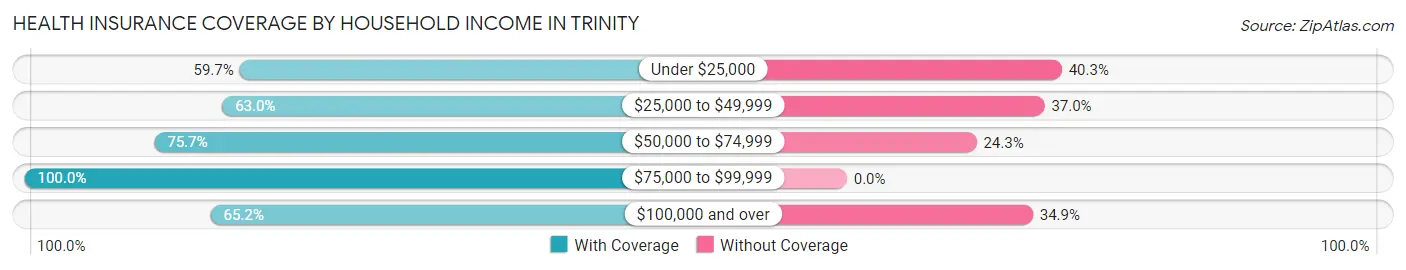
| Household Income | With Coverage | Without Coverage |
| Under $25,000 | 445 (59.7%) | 300 (40.3%) |
| $25,000 to $49,999 | 301 (63.0%) | 177 (37.0%) |
| $50,000 to $74,999 | 514 (75.7%) | 165 (24.3%) |
| $75,000 to $99,999 | 26 (100.0%) | 0 (0.0%) |
| $100,000 and over | 316 (65.1%) | 169 (34.8%) |
Public vs Private Health Insurance Coverage by Age in Trinity
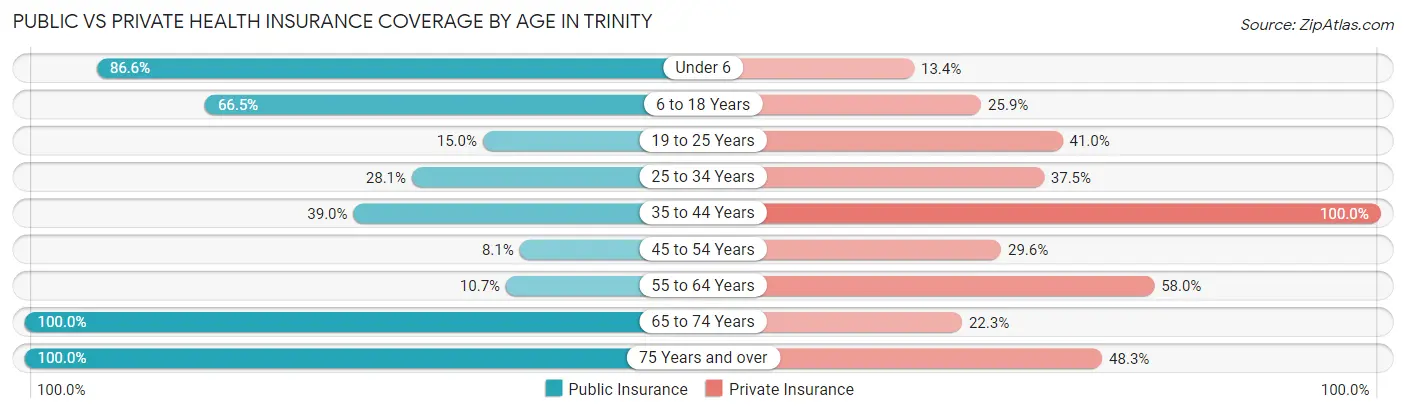
| Age Bracket | Public Insurance | Private Insurance |
| Under 6 | 142 (86.6%) | 22 (13.4%) |
| 6 to 18 Years | 306 (66.5%) | 119 (25.9%) |
| 19 to 25 Years | 58 (14.9%) | 159 (41.0%) |
| 25 to 34 Years | 45 (28.1%) | 60 (37.5%) |
| 35 to 44 Years | 23 (39.0%) | 59 (100.0%) |
| 45 to 54 Years | 41 (8.1%) | 149 (29.6%) |
| 55 to 64 Years | 52 (10.7%) | 283 (58.0%) |
| 65 to 74 Years | 130 (100.0%) | 29 (22.3%) |
| 75 Years and over | 60 (100.0%) | 29 (48.3%) |
| Total | 857 (35.5%) | 909 (37.7%) |
Disability Status by Sex by Age in Trinity
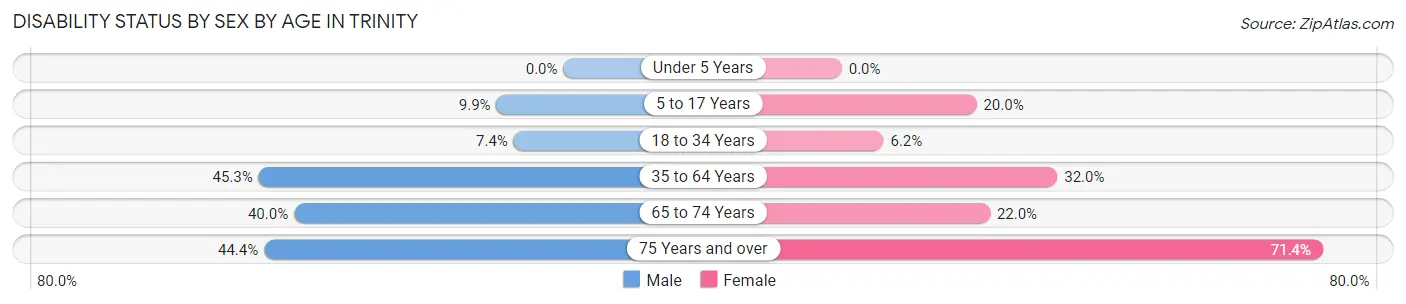
| Age Bracket | Male | Female |
| Under 5 Years | 0 (0.0%) | 0 (0.0%) |
| 5 to 17 Years | 36 (9.9%) | 22 (20.0%) |
| 18 to 34 Years | 21 (7.4%) | 17 (6.2%) |
| 35 to 64 Years | 272 (45.3%) | 144 (32.0%) |
| 65 to 74 Years | 12 (40.0%) | 22 (22.0%) |
| 75 Years and over | 8 (44.4%) | 30 (71.4%) |
Disability Class by Sex by Age in Trinity
Disability Class: Hearing Difficulty
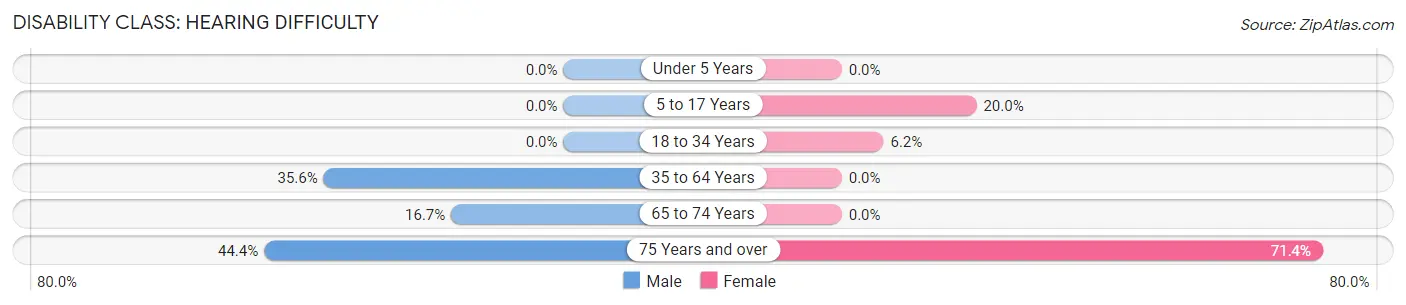
| Age Bracket | Male | Female |
| Under 5 Years | 0 (0.0%) | 0 (0.0%) |
| 5 to 17 Years | 0 (0.0%) | 22 (20.0%) |
| 18 to 34 Years | 0 (0.0%) | 17 (6.2%) |
| 35 to 64 Years | 214 (35.6%) | 0 (0.0%) |
| 65 to 74 Years | 5 (16.7%) | 0 (0.0%) |
| 75 Years and over | 8 (44.4%) | 30 (71.4%) |
Disability Class: Vision Difficulty
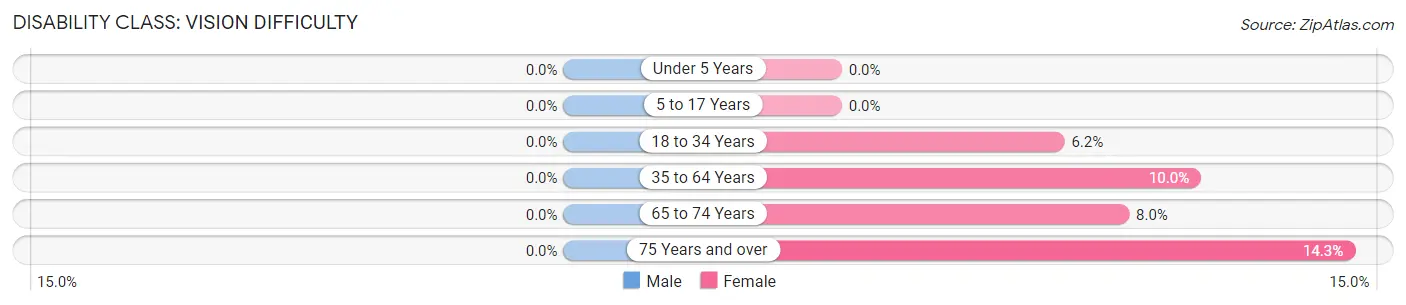
| Age Bracket | Male | Female |
| Under 5 Years | 0 (0.0%) | 0 (0.0%) |
| 5 to 17 Years | 0 (0.0%) | 0 (0.0%) |
| 18 to 34 Years | 0 (0.0%) | 17 (6.2%) |
| 35 to 64 Years | 0 (0.0%) | 45 (10.0%) |
| 65 to 74 Years | 0 (0.0%) | 8 (8.0%) |
| 75 Years and over | 0 (0.0%) | 6 (14.3%) |
Disability Class: Cognitive Difficulty
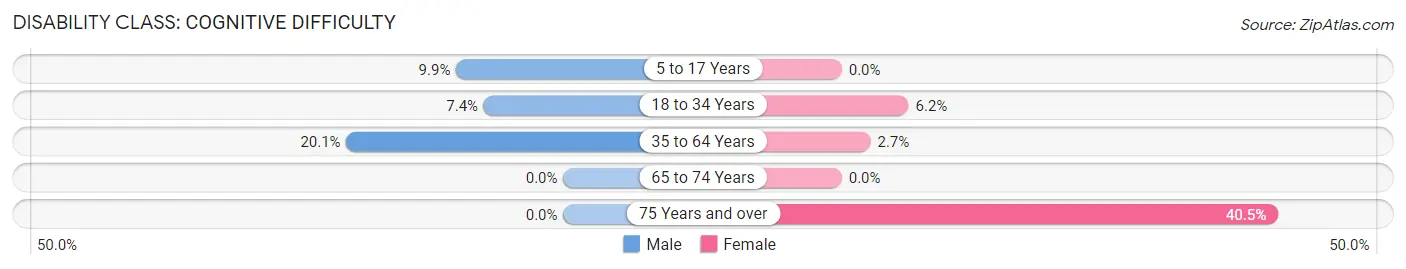
| Age Bracket | Male | Female |
| 5 to 17 Years | 36 (9.9%) | 0 (0.0%) |
| 18 to 34 Years | 21 (7.4%) | 17 (6.2%) |
| 35 to 64 Years | 121 (20.1%) | 12 (2.7%) |
| 65 to 74 Years | 0 (0.0%) | 0 (0.0%) |
| 75 Years and over | 0 (0.0%) | 17 (40.5%) |
Disability Class: Ambulatory Difficulty
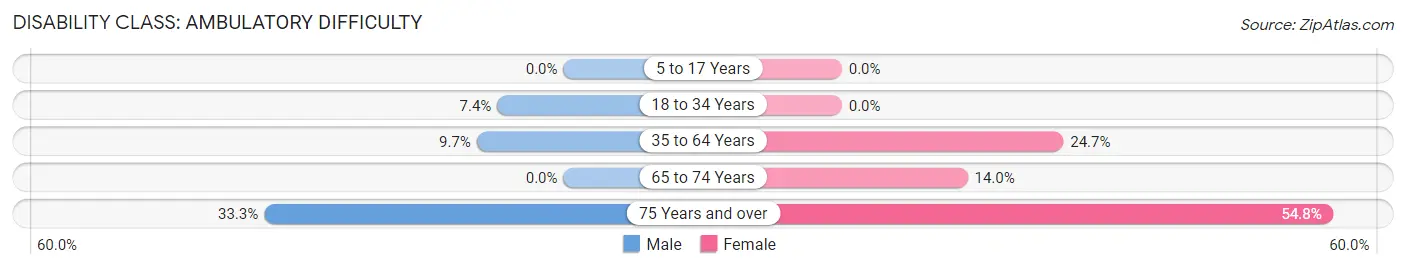
| Age Bracket | Male | Female |
| 5 to 17 Years | 0 (0.0%) | 0 (0.0%) |
| 18 to 34 Years | 21 (7.4%) | 0 (0.0%) |
| 35 to 64 Years | 58 (9.7%) | 111 (24.7%) |
| 65 to 74 Years | 0 (0.0%) | 14 (14.0%) |
| 75 Years and over | 6 (33.3%) | 23 (54.8%) |
Disability Class: Self-Care Difficulty
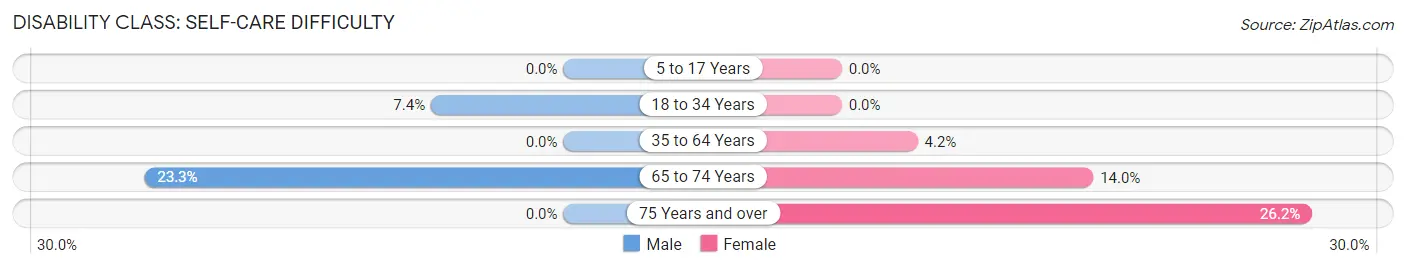
| Age Bracket | Male | Female |
| 5 to 17 Years | 0 (0.0%) | 0 (0.0%) |
| 18 to 34 Years | 21 (7.4%) | 0 (0.0%) |
| 35 to 64 Years | 0 (0.0%) | 19 (4.2%) |
| 65 to 74 Years | 7 (23.3%) | 14 (14.0%) |
| 75 Years and over | 0 (0.0%) | 11 (26.2%) |
Technology Access in Trinity
Computing Device Access in Trinity
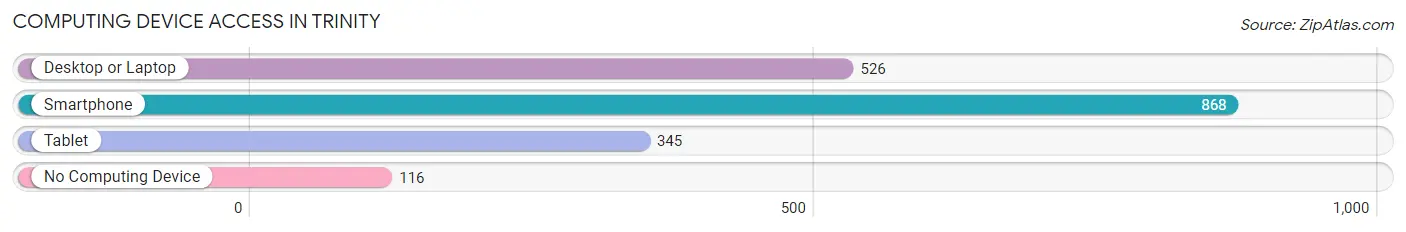
| Device Type | # Households | % Households |
| Desktop or Laptop | 526 | 51.0% |
| Smartphone | 868 | 84.2% |
| Tablet | 345 | 33.5% |
| No Computing Device | 116 | 11.3% |
| Total | 1,031 | 100.0% |
Internet Access in Trinity
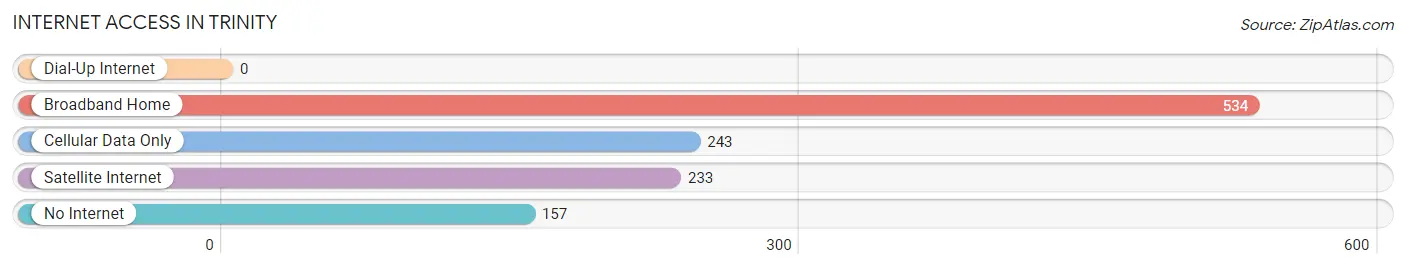
| Internet Type | # Households | % Households |
| Dial-Up Internet | 0 | 0.0% |
| Broadband Home | 534 | 51.8% |
| Cellular Data Only | 243 | 23.6% |
| Satellite Internet | 233 | 22.6% |
| No Internet | 157 | 15.2% |
| Total | 1,031 | 100.0% |
Trinity Summary
Trinity, Texas is a small town located in Trinity County, Texas. It is situated in the Piney Woods region of East Texas, approximately 90 miles north of Houston. The town was founded in 1872 and has a population of approximately 2,000 people.
Trinity is located in the heart of the Piney Woods region of East Texas. The area is characterized by rolling hills, dense forests, and numerous rivers and streams. The climate is humid subtropical, with hot summers and mild winters. The average annual temperature is around 70 degrees Fahrenheit.
Trinity's economy is largely based on agriculture and timber production. The town is home to several large farms and ranches, as well as several small businesses. The town is also home to a number of manufacturing plants, including a paper mill and a furniture factory.
Trinity's population is predominantly white, with a small African American population. The median household income is around $30,000, and the median home value is around $80,000. The town is served by the Trinity Independent School District, which includes two elementary schools, one middle school, and one high school.
Trinity is home to several churches, including the First United Methodist Church, the First Baptist Church, and the Trinity Church of Christ. The town also has a number of parks and recreational facilities, including a public swimming pool, a golf course, and a tennis court.
Trinity is a small town with a rich history and a vibrant economy. It is a great place to live and work, and offers a variety of activities and amenities for its residents. With its close proximity to Houston, Trinity is an ideal place to call home.
Common Questions
What is Per Capita Income in Trinity?
Per Capita income in Trinity is $20,995.
What is the Median Family Income in Trinity?
Median Family Income in Trinity is $48,919.
What is the Median Household income in Trinity?
Median Household Income in Trinity is $35,905.
What is Income or Wage Gap in Trinity?
Income or Wage Gap in Trinity is 32.7%.
Women in Trinity earn 67.3 cents for every dollar earned by a man.
What is Inequality or Gini Index in Trinity?
Inequality or Gini Index in Trinity is 0.48.
What is the Total Population of Trinity?
Total Population of Trinity is 2,493.
What is the Total Male Population of Trinity?
Total Male Population of Trinity is 1,367.
What is the Total Female Population of Trinity?
Total Female Population of Trinity is 1,126.
What is the Ratio of Males per 100 Females in Trinity?
There are 121.40 Males per 100 Females in Trinity.
What is the Ratio of Females per 100 Males in Trinity?
There are 82.37 Females per 100 Males in Trinity.
What is the Median Population Age in Trinity?
Median Population Age in Trinity is 47.6 Years.
What is the Average Family Size in Trinity
Average Family Size in Trinity is 2.8 People.
What is the Average Household Size in Trinity
Average Household Size in Trinity is 2.3 People.
How Large is the Labor Force in Trinity?
There are 1,264 People in the Labor Forcein in Trinity.
What is the Percentage of People in the Labor Force in Trinity?
62.5% of People are in the Labor Force in Trinity.
What is the Unemployment Rate in Trinity?
Unemployment Rate in Trinity is 7.3%.