Tornillo, TX Map & Demographics
Tornillo Map
Tornillo Overview
$20,530
PER CAPITA INCOME
$55,132
AVG FAMILY INCOME
$67,917
AVG HOUSEHOLD INCOME
37.6%
WAGE / INCOME GAP [ % ]
62.4¢/ $1
WAGE / INCOME GAP [ $ ]
0.32
INEQUALITY / GINI INDEX
1,548
TOTAL POPULATION
839
MALE POPULATION
709
FEMALE POPULATION
118.34
MALES / 100 FEMALES
84.51
FEMALES / 100 MALES
39.8
MEDIAN AGE
3.5
AVG FAMILY SIZE
3.6
AVG HOUSEHOLD SIZE
762
LABOR FORCE [ PEOPLE ]
56.1%
PERCENT IN LABOR FORCE
5.1%
UNEMPLOYMENT RATE
Tornillo Zip Codes
Tornillo Area Codes
Income in Tornillo
Income Overview in Tornillo
Per Capita Income in Tornillo is $20,530, while median incomes of families and households are $55,132 and $67,917 respectively.
| Characteristic | Number | Measure |
| Per Capita Income | 1,548 | $20,530 |
| Median Family Income | 390 | $55,132 |
| Mean Family Income | 390 | $69,633 |
| Median Household Income | 433 | $67,917 |
| Mean Household Income | 433 | $69,497 |
| Income Deficit | 390 | $0 |
| Wage / Income Gap (%) | 1,548 | 37.55% |
| Wage / Income Gap ($) | 1,548 | 62.45¢ per $1 |
| Gini / Inequality Index | 1,548 | 0.32 |
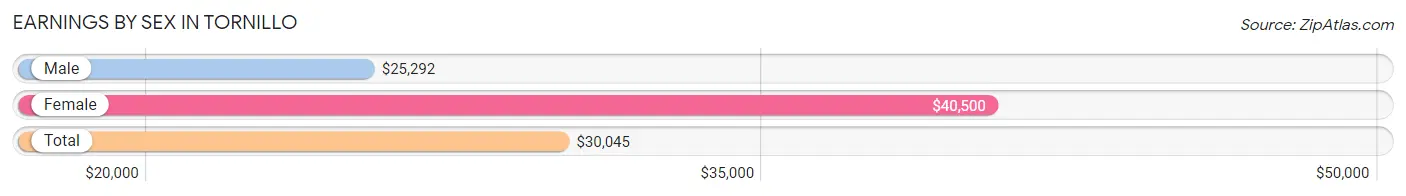
Earnings by Sex in Tornillo
Average Earnings in Tornillo are $30,045, $25,292 for men and $40,500 for women, a difference of 37.6%.
| Sex | Number | Average Earnings |
| Male | 467 (58.5%) | $25,292 |
| Female | 332 (41.5%) | $40,500 |
| Total | 799 (100.0%) | $30,045 |
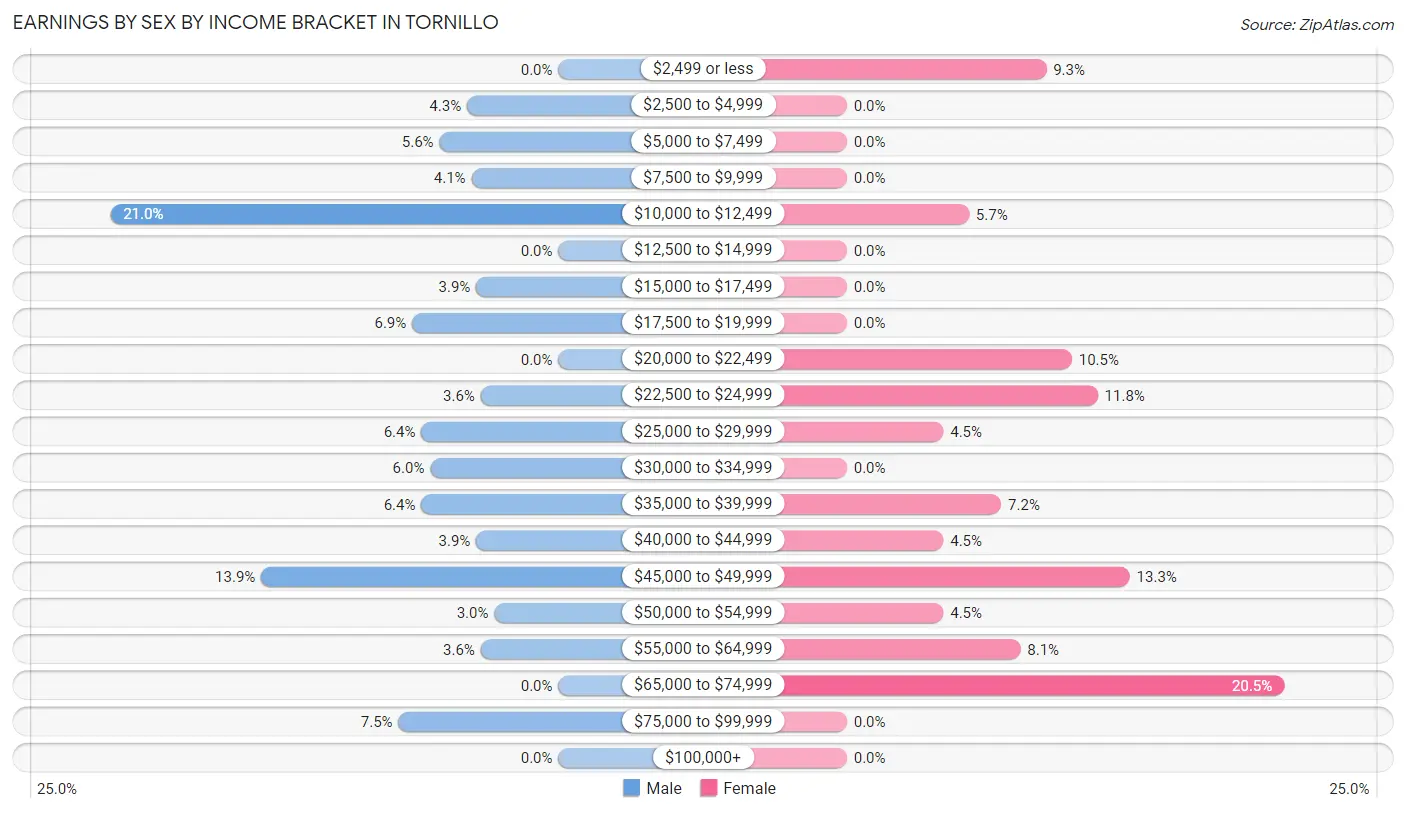
Earnings by Sex by Income Bracket in Tornillo
The most common earnings brackets in Tornillo are $10,000 to $12,499 for men (98 | 21.0%) and $65,000 to $74,999 for women (68 | 20.5%).
| Income | Male | Female |
| $2,499 or less | 0 (0.0%) | 31 (9.3%) |
| $2,500 to $4,999 | 20 (4.3%) | 0 (0.0%) |
| $5,000 to $7,499 | 26 (5.6%) | 0 (0.0%) |
| $7,500 to $9,999 | 19 (4.1%) | 0 (0.0%) |
| $10,000 to $12,499 | 98 (21.0%) | 19 (5.7%) |
| $12,500 to $14,999 | 0 (0.0%) | 0 (0.0%) |
| $15,000 to $17,499 | 18 (3.8%) | 0 (0.0%) |
| $17,500 to $19,999 | 32 (6.9%) | 0 (0.0%) |
| $20,000 to $22,499 | 0 (0.0%) | 35 (10.5%) |
| $22,500 to $24,999 | 17 (3.6%) | 39 (11.7%) |
| $25,000 to $29,999 | 30 (6.4%) | 15 (4.5%) |
| $30,000 to $34,999 | 28 (6.0%) | 0 (0.0%) |
| $35,000 to $39,999 | 30 (6.4%) | 24 (7.2%) |
| $40,000 to $44,999 | 18 (3.8%) | 15 (4.5%) |
| $45,000 to $49,999 | 65 (13.9%) | 44 (13.3%) |
| $50,000 to $54,999 | 14 (3.0%) | 15 (4.5%) |
| $55,000 to $64,999 | 17 (3.6%) | 27 (8.1%) |
| $65,000 to $74,999 | 0 (0.0%) | 68 (20.5%) |
| $75,000 to $99,999 | 35 (7.5%) | 0 (0.0%) |
| $100,000+ | 0 (0.0%) | 0 (0.0%) |
| Total | 467 (100.0%) | 332 (100.0%) |
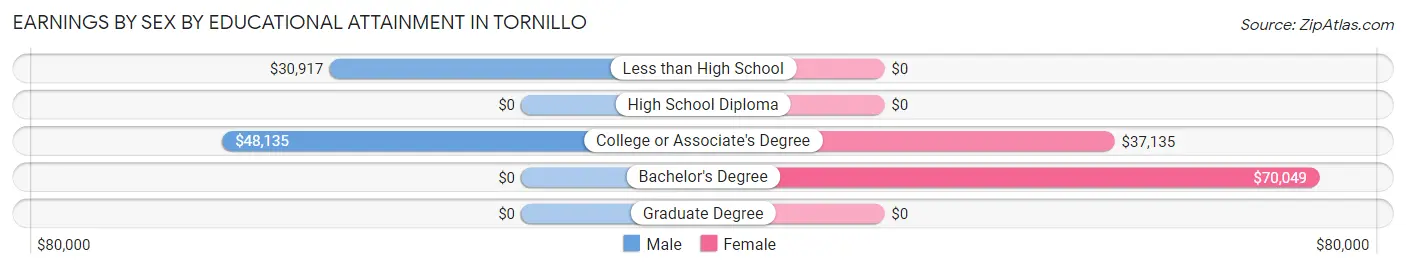
Earnings by Sex by Educational Attainment in Tornillo
Average earnings in Tornillo are $38,167 for men and $47,386 for women, a difference of 19.5%. Men with an educational attainment of college or associate's degree enjoy the highest average annual earnings of $48,135, while those with less than high school education earn the least with $30,917. Women with an educational attainment of bachelor's degree earn the most with the average annual earnings of $70,049, while those with college or associate's degree education have the smallest earnings of $37,135.
| Educational Attainment | Male Income | Female Income |
| Less than High School | $30,917 | $0 |
| High School Diploma | - | - |
| College or Associate's Degree | $48,135 | $37,135 |
| Bachelor's Degree | - | - |
| Graduate Degree | - | - |
| Total | $38,167 | $47,386 |
Family Income in Tornillo
Family Income Brackets in Tornillo
According to the Tornillo family income data, there are 106 families falling into the $100,000 to $149,999 income range, which is the most common income bracket and makes up 27.2% of all families.
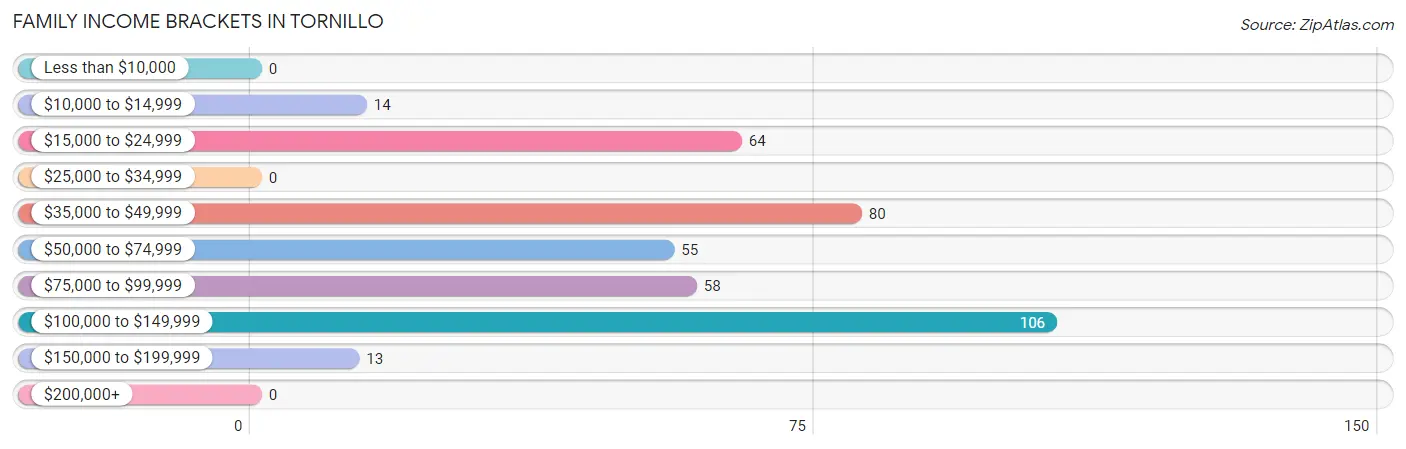
| Income Bracket | # Families | % Families |
| Less than $10,000 | 0 | 0.0% |
| $10,000 to $14,999 | 14 | 3.6% |
| $15,000 to $24,999 | 64 | 16.4% |
| $25,000 to $34,999 | 0 | 0.0% |
| $35,000 to $49,999 | 80 | 20.5% |
| $50,000 to $74,999 | 55 | 14.1% |
| $75,000 to $99,999 | 58 | 14.9% |
| $100,000 to $149,999 | 106 | 27.2% |
| $150,000 to $199,999 | 13 | 3.3% |
| $200,000+ | 0 | 0.0% |
Family Income by Famaliy Size in Tornillo
5-person families (57 | 14.6%) account for the highest median family income in Tornillo with $56,908 per family, while 3-person families (40 | 10.3%) have the highest median income of $17,917 per family member.
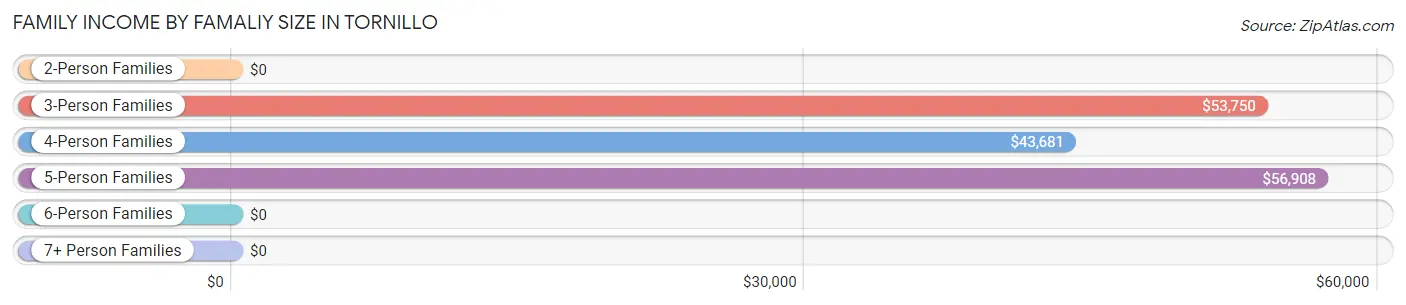
| Income Bracket | # Families | Median Income |
| 2-Person Families | 213 (54.6%) | $0 |
| 3-Person Families | 40 (10.3%) | $53,750 |
| 4-Person Families | 43 (11.0%) | $43,681 |
| 5-Person Families | 57 (14.6%) | $56,908 |
| 6-Person Families | 13 (3.3%) | $0 |
| 7+ Person Families | 24 (6.1%) | $0 |
| Total | 390 (100.0%) | $55,132 |
Family Income by Number of Earners in Tornillo
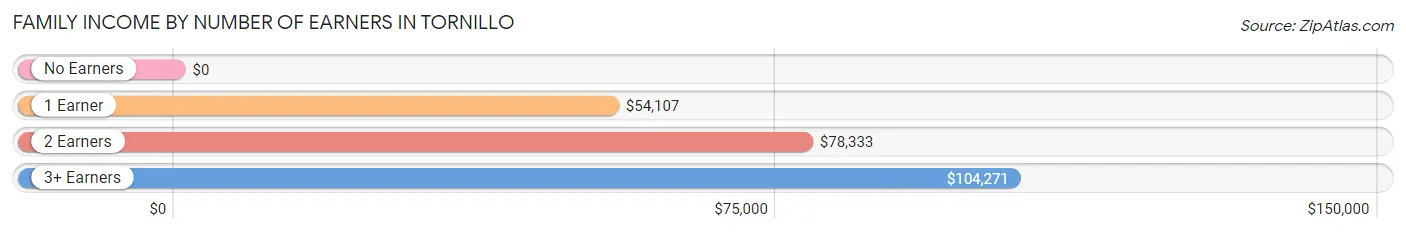
| Number of Earners | # Families | Median Income |
| No Earners | 46 (11.8%) | $0 |
| 1 Earner | 84 (21.5%) | $54,107 |
| 2 Earners | 186 (47.7%) | $78,333 |
| 3+ Earners | 74 (19.0%) | $104,271 |
| Total | 390 (100.0%) | $55,132 |
Household Income in Tornillo
Household Income Brackets in Tornillo
With 106 households falling in the category, the $100,000 to $149,999 income range is the most frequent in Tornillo, accounting for 24.5% of all households.
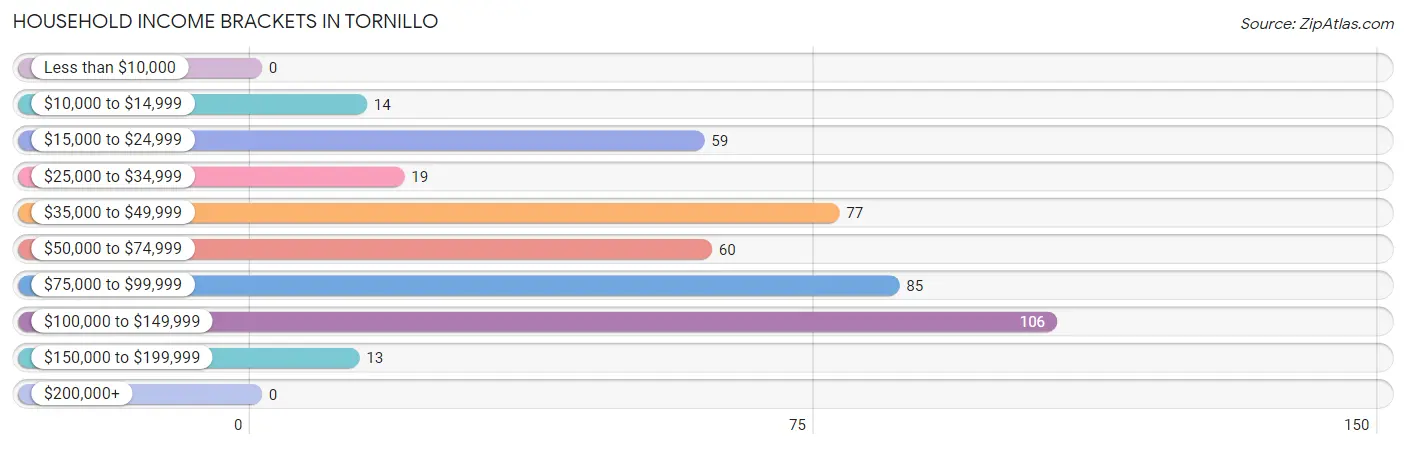
| Income Bracket | # Households | % Households |
| Less than $10,000 | 0 | 0.0% |
| $10,000 to $14,999 | 14 | 3.2% |
| $15,000 to $24,999 | 59 | 13.6% |
| $25,000 to $34,999 | 19 | 4.4% |
| $35,000 to $49,999 | 77 | 17.8% |
| $50,000 to $74,999 | 60 | 13.9% |
| $75,000 to $99,999 | 85 | 19.6% |
| $100,000 to $149,999 | 106 | 24.5% |
| $150,000 to $199,999 | 13 | 3.0% |
| $200,000+ | 0 | 0.0% |
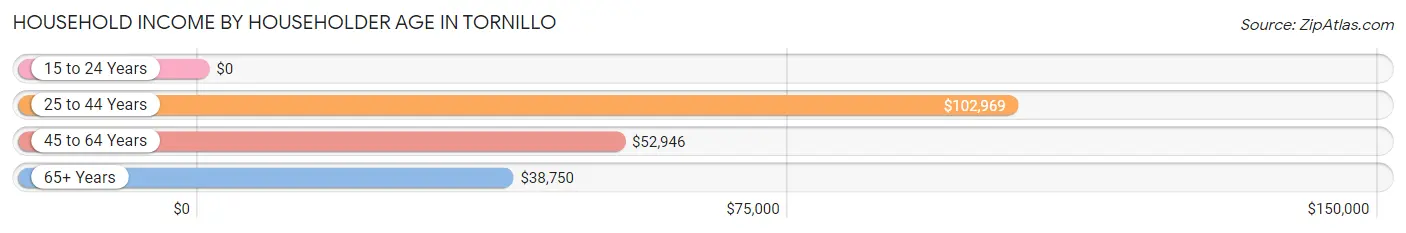
Household Income by Householder Age in Tornillo
The median household income in Tornillo is $67,917, with the highest median household income of $102,969 found in the 25 to 44 years age bracket for the primary householder. A total of 203 households (46.9%) fall into this category.
| Income Bracket | # Households | Median Income |
| 15 to 24 Years | 0 (0.0%) | $0 |
| 25 to 44 Years | 203 (46.9%) | $102,969 |
| 45 to 64 Years | 93 (21.5%) | $52,946 |
| 65+ Years | 137 (31.6%) | $38,750 |
| Total | 433 (100.0%) | $67,917 |
Poverty in Tornillo
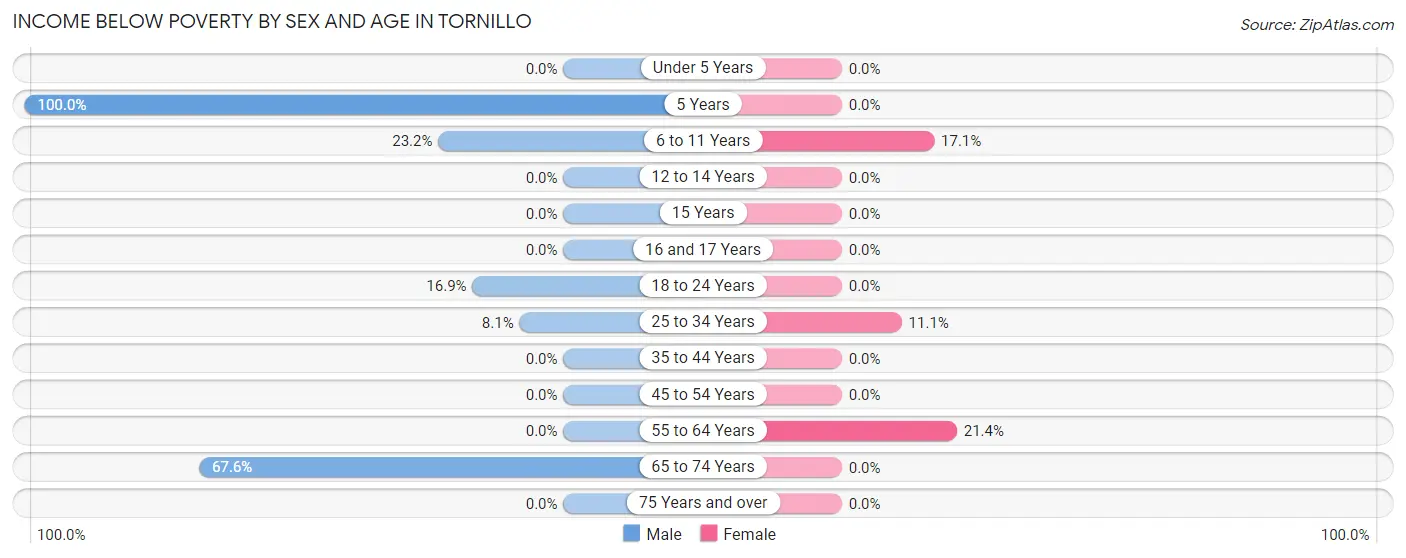
Income Below Poverty by Sex and Age in Tornillo
With 21.8% poverty level for males and 6.1% for females among the residents of Tornillo, 5 year old males and 55 to 64 year old females are the most vulnerable to poverty, with 13 males (100.0%) and 19 females (21.3%) in their respective age groups living below the poverty level.
| Age Bracket | Male | Female |
| Under 5 Years | 0 (0.0%) | 0 (0.0%) |
| 5 Years | 13 (100.0%) | 0 (0.0%) |
| 6 to 11 Years | 13 (23.2%) | 12 (17.1%) |
| 12 to 14 Years | 0 (0.0%) | 0 (0.0%) |
| 15 Years | 0 (0.0%) | 0 (0.0%) |
| 16 and 17 Years | 0 (0.0%) | 0 (0.0%) |
| 18 to 24 Years | 26 (16.9%) | 0 (0.0%) |
| 25 to 34 Years | 14 (8.1%) | 12 (11.1%) |
| 35 to 44 Years | 0 (0.0%) | 0 (0.0%) |
| 45 to 54 Years | 0 (0.0%) | 0 (0.0%) |
| 55 to 64 Years | 0 (0.0%) | 19 (21.3%) |
| 65 to 74 Years | 117 (67.6%) | 0 (0.0%) |
| 75 Years and over | 0 (0.0%) | 0 (0.0%) |
| Total | 183 (21.8%) | 43 (6.1%) |
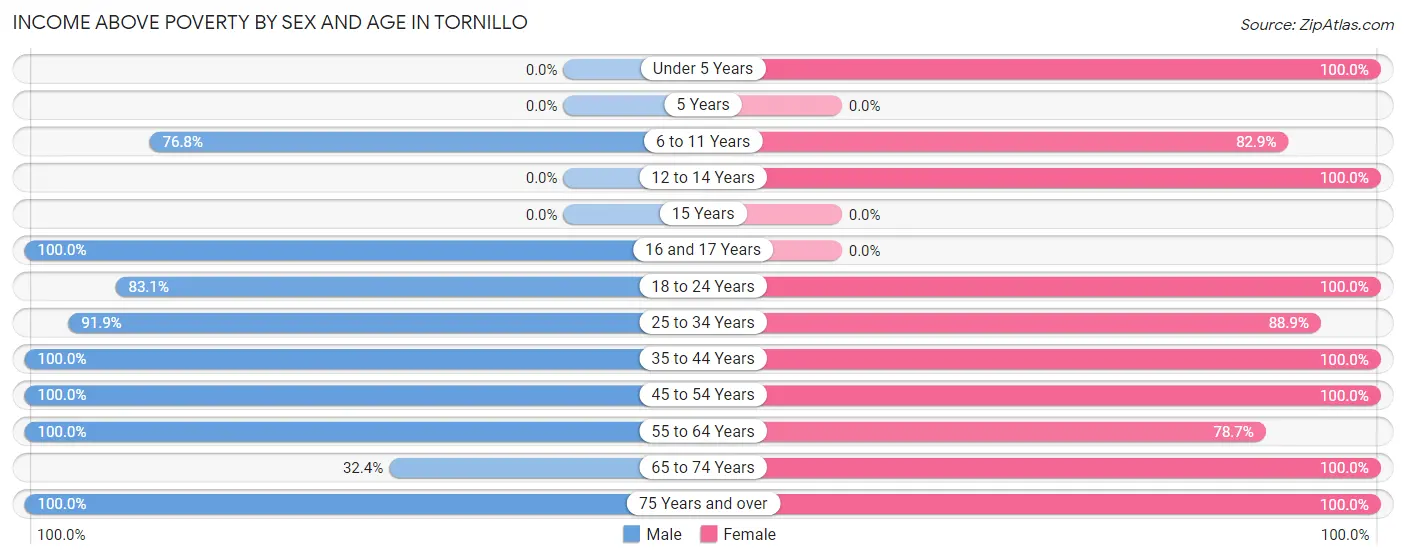
Income Above Poverty by Sex and Age in Tornillo
According to the poverty statistics in Tornillo, males aged 16 and 17 years and females aged under 5 years are the age groups that are most secure financially, with 100.0% of males and 100.0% of females in these age groups living above the poverty line.
| Age Bracket | Male | Female |
| Under 5 Years | 0 (0.0%) | 6 (100.0%) |
| 5 Years | 0 (0.0%) | 0 (0.0%) |
| 6 to 11 Years | 43 (76.8%) | 58 (82.9%) |
| 12 to 14 Years | 0 (0.0%) | 45 (100.0%) |
| 15 Years | 0 (0.0%) | 0 (0.0%) |
| 16 and 17 Years | 45 (100.0%) | 0 (0.0%) |
| 18 to 24 Years | 128 (83.1%) | 66 (100.0%) |
| 25 to 34 Years | 158 (91.9%) | 96 (88.9%) |
| 35 to 44 Years | 70 (100.0%) | 121 (100.0%) |
| 45 to 54 Years | 78 (100.0%) | 48 (100.0%) |
| 55 to 64 Years | 65 (100.0%) | 70 (78.6%) |
| 65 to 74 Years | 56 (32.4%) | 100 (100.0%) |
| 75 Years and over | 13 (100.0%) | 56 (100.0%) |
| Total | 656 (78.2%) | 666 (93.9%) |
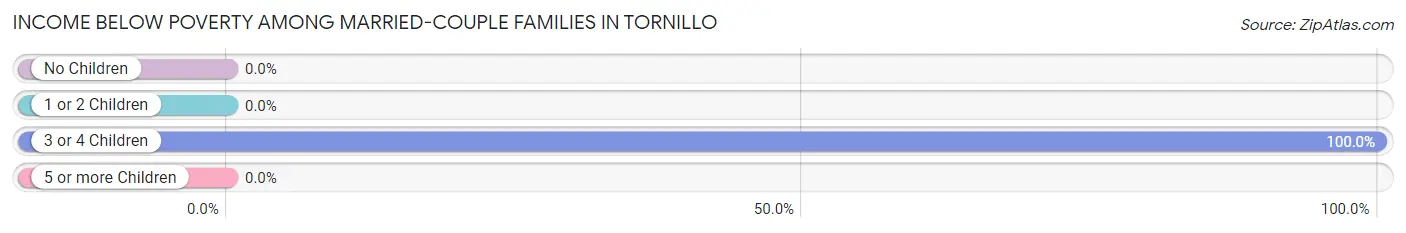
Income Below Poverty Among Married-Couple Families in Tornillo
The poverty statistics for married-couple families in Tornillo show that 6.2% or 14 of the total 225 families live below the poverty line. Families with 3 or 4 children have the highest poverty rate of 100.0%, comprising of 14 families. On the other hand, families with no children have the lowest poverty rate of 0.0%, which includes 0 families.
| Children | Above Poverty | Below Poverty |
| No Children | 169 (100.0%) | 0 (0.0%) |
| 1 or 2 Children | 42 (100.0%) | 0 (0.0%) |
| 3 or 4 Children | 0 (0.0%) | 14 (100.0%) |
| 5 or more Children | 0 (0.0%) | 0 (0.0%) |
| Total | 211 (93.8%) | 14 (6.2%) |
Income Below Poverty Among Single-Parent Households in Tornillo
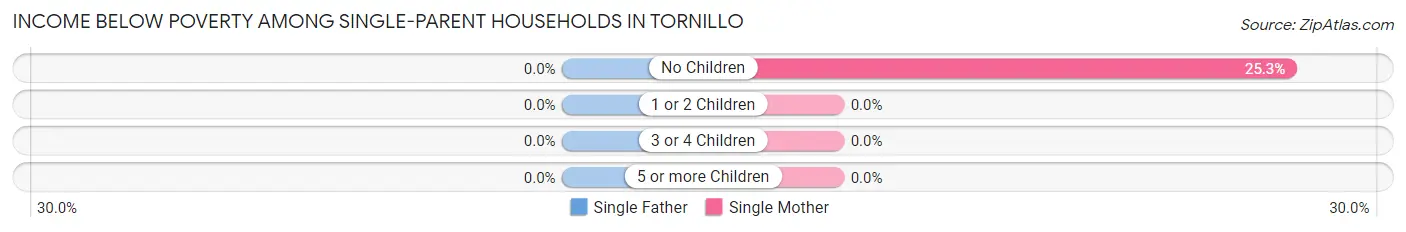
| Children | Single Father | Single Mother |
| No Children | 0 (0.0%) | 19 (25.3%) |
| 1 or 2 Children | 0 (0.0%) | 0 (0.0%) |
| 3 or 4 Children | 0 (0.0%) | 0 (0.0%) |
| 5 or more Children | 0 (0.0%) | 0 (0.0%) |
| Total | 0 (0.0%) | 19 (14.7%) |
Income Below Poverty Among Married-Couple vs Single-Parent Households in Tornillo
The poverty data for Tornillo shows that 14 of the married-couple family households (6.2%) and 19 of the single-parent households (11.5%) are living below the poverty level. Within the married-couple family households, those with 3 or 4 children have the highest poverty rate, with 14 households (100.0%) falling below the poverty line. Among the single-parent households, those with no children have the highest poverty rate, with 19 household (17.1%) living below poverty.
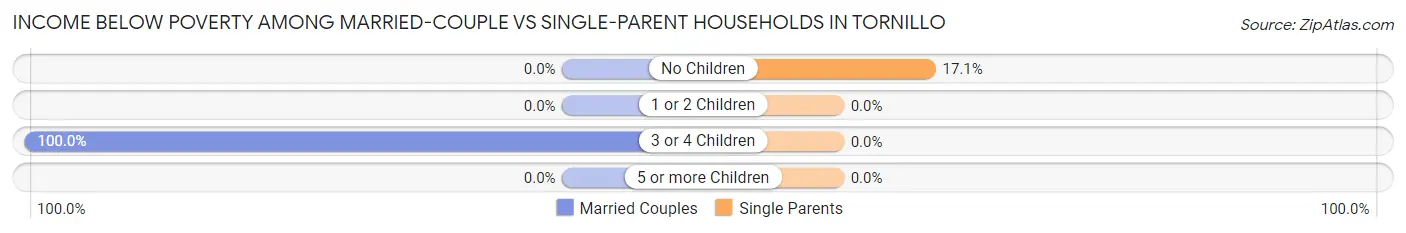
| Children | Married-Couple Families | Single-Parent Households |
| No Children | 0 (0.0%) | 19 (17.1%) |
| 1 or 2 Children | 0 (0.0%) | 0 (0.0%) |
| 3 or 4 Children | 14 (100.0%) | 0 (0.0%) |
| 5 or more Children | 0 (0.0%) | 0 (0.0%) |
| Total | 14 (6.2%) | 19 (11.5%) |
Race in Tornillo
The most populous races in Tornillo are Hispanic or Latino (1,548 | 100.0%), White / Caucasian (574 | 37.1%), and Some other Race (552 | 35.7%).
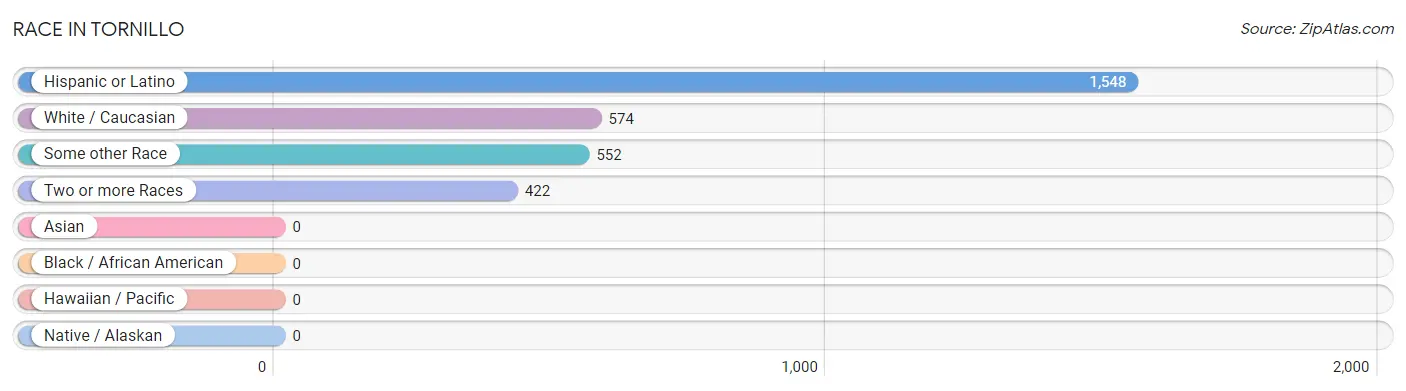
| Race | # Population | % Population |
| Asian | 0 | 0.0% |
| Black / African American | 0 | 0.0% |
| Hawaiian / Pacific | 0 | 0.0% |
| Hispanic or Latino | 1,548 | 100.0% |
| Native / Alaskan | 0 | 0.0% |
| White / Caucasian | 574 | 37.1% |
| Two or more Races | 422 | 27.3% |
| Some other Race | 552 | 35.7% |
| Total | 1,548 | 100.0% |
Ancestry in Tornillo
The most populous ancestries reported in Tornillo are , and Mexican (1,432 | 92.5%), together accounting for 92.5% of all Tornillo residents.

| Ancestry | # Population | % Population |
| Mexican | 1,432 | 92.5% | View All 1 Rows |
Immigrants in Tornillo
The most numerous immigrant groups reported in Tornillo came from Central America (610 | 39.4%), Latin America (610 | 39.4%), and Mexico (610 | 39.4%), together accounting for 118.2% of all Tornillo residents.
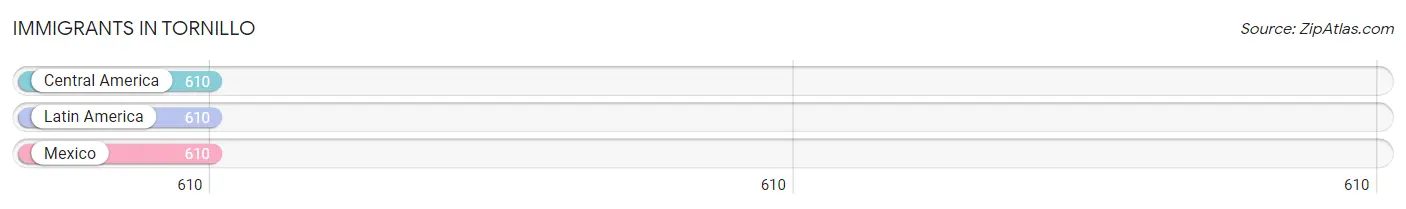
| Immigration Origin | # Population | % Population |
| Central America | 610 | 39.4% |
| Latin America | 610 | 39.4% |
| Mexico | 610 | 39.4% | View All 3 Rows |
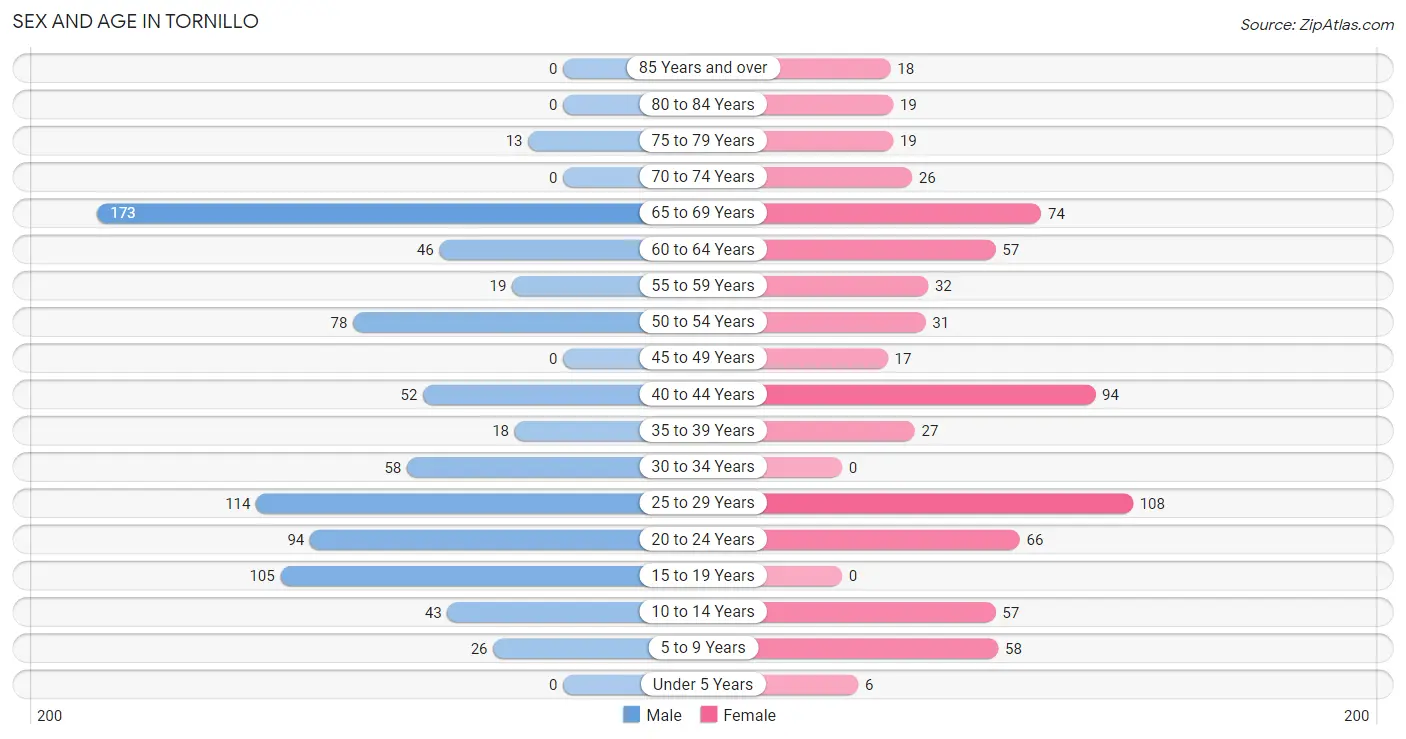
Sex and Age in Tornillo
Sex and Age in Tornillo
The most populous age groups in Tornillo are 65 to 69 Years (173 | 20.6%) for men and 25 to 29 Years (108 | 15.2%) for women.
| Age Bracket | Male | Female |
| Under 5 Years | 0 (0.0%) | 6 (0.9%) |
| 5 to 9 Years | 26 (3.1%) | 58 (8.2%) |
| 10 to 14 Years | 43 (5.1%) | 57 (8.0%) |
| 15 to 19 Years | 105 (12.5%) | 0 (0.0%) |
| 20 to 24 Years | 94 (11.2%) | 66 (9.3%) |
| 25 to 29 Years | 114 (13.6%) | 108 (15.2%) |
| 30 to 34 Years | 58 (6.9%) | 0 (0.0%) |
| 35 to 39 Years | 18 (2.1%) | 27 (3.8%) |
| 40 to 44 Years | 52 (6.2%) | 94 (13.3%) |
| 45 to 49 Years | 0 (0.0%) | 17 (2.4%) |
| 50 to 54 Years | 78 (9.3%) | 31 (4.4%) |
| 55 to 59 Years | 19 (2.3%) | 32 (4.5%) |
| 60 to 64 Years | 46 (5.5%) | 57 (8.0%) |
| 65 to 69 Years | 173 (20.6%) | 74 (10.4%) |
| 70 to 74 Years | 0 (0.0%) | 26 (3.7%) |
| 75 to 79 Years | 13 (1.5%) | 19 (2.7%) |
| 80 to 84 Years | 0 (0.0%) | 19 (2.7%) |
| 85 Years and over | 0 (0.0%) | 18 (2.5%) |
| Total | 839 (100.0%) | 709 (100.0%) |
Families and Households in Tornillo
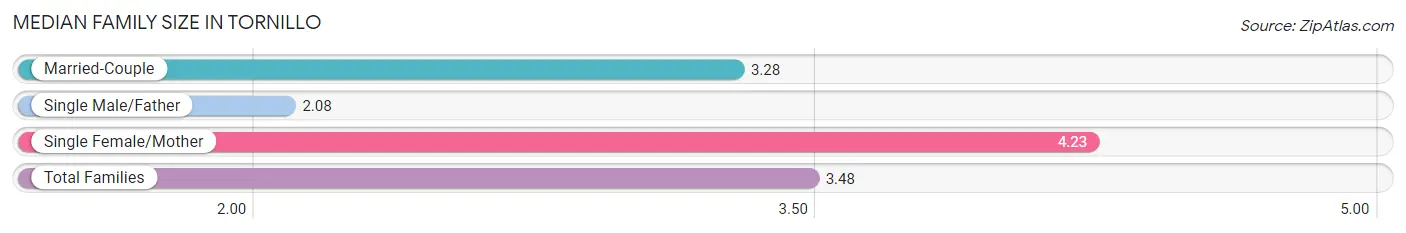
Median Family Size in Tornillo
The median family size in Tornillo is 3.48 persons per family, with single female/mother families (129 | 33.1%) accounting for the largest median family size of 4.23 persons per family. On the other hand, single male/father families (36 | 9.2%) represent the smallest median family size with 2.08 persons per family.
| Family Type | # Families | Family Size |
| Married-Couple | 225 (57.7%) | 3.28 |
| Single Male/Father | 36 (9.2%) | 2.08 |
| Single Female/Mother | 129 (33.1%) | 4.23 |
| Total Families | 390 (100.0%) | 3.48 |
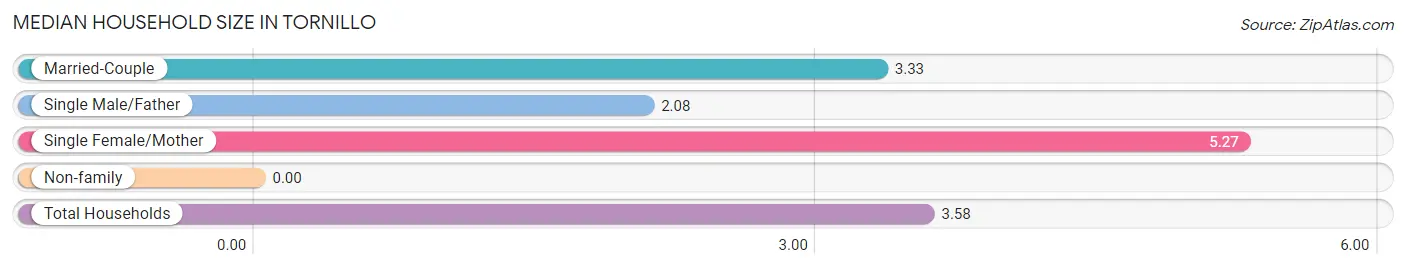
Median Household Size in Tornillo
| Household Type | # Households | Household Size |
| Married-Couple | 225 (52.0%) | 3.33 |
| Single Male/Father | 36 (8.3%) | 2.08 |
| Single Female/Mother | 129 (29.8%) | 5.27 |
| Non-family | 43 (9.9%) | - |
| Total Households | 433 (100.0%) | 3.58 |
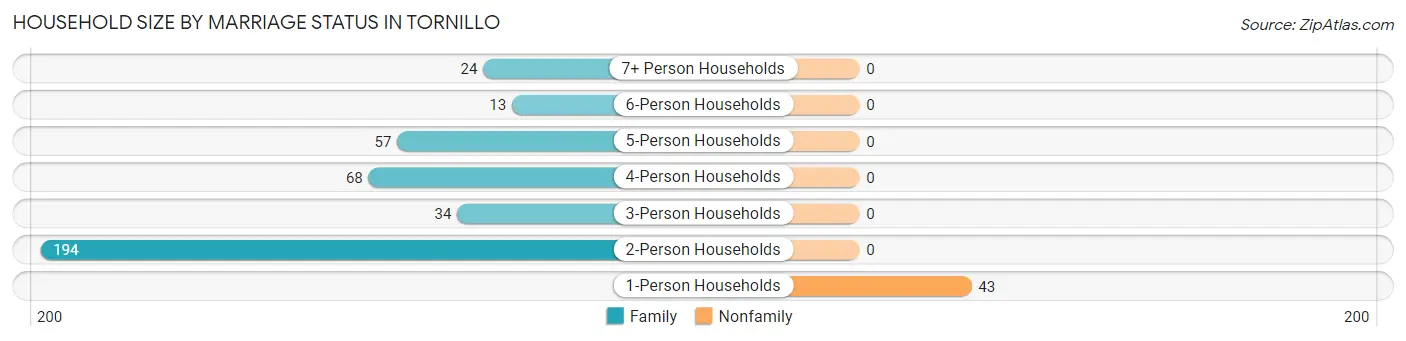
Household Size by Marriage Status in Tornillo
Out of a total of 433 households in Tornillo, 390 (90.1%) are family households, while 43 (9.9%) are nonfamily households. The most numerous type of family households are 2-person households, comprising 194, and the most common type of nonfamily households are 1-person households, comprising 43.
| Household Size | Family Households | Nonfamily Households |
| 1-Person Households | - | 43 (9.9%) |
| 2-Person Households | 194 (44.8%) | 0 (0.0%) |
| 3-Person Households | 34 (7.9%) | 0 (0.0%) |
| 4-Person Households | 68 (15.7%) | 0 (0.0%) |
| 5-Person Households | 57 (13.2%) | 0 (0.0%) |
| 6-Person Households | 13 (3.0%) | 0 (0.0%) |
| 7+ Person Households | 24 (5.5%) | 0 (0.0%) |
| Total | 390 (90.1%) | 43 (9.9%) |
Female Fertility in Tornillo
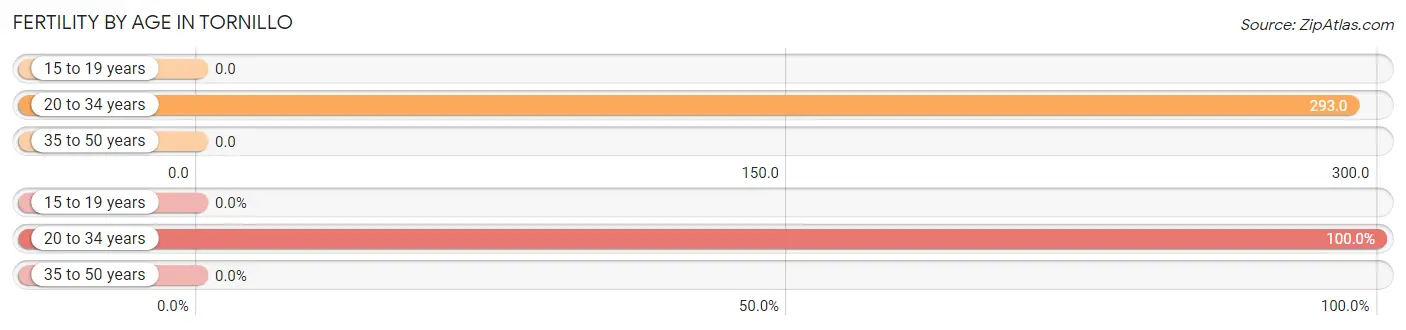
Fertility by Age in Tornillo
Average fertility rate in Tornillo is 158.0 births per 1,000 women. Women in the age bracket of 20 to 34 years have the highest fertility rate with 293.0 births per 1,000 women. Women in the age bracket of 20 to 34 years acount for 100.0% of all women with births.
| Age Bracket | Women with Births | Births / 1,000 Women |
| 15 to 19 years | 0 (0.0%) | 0.0 |
| 20 to 34 years | 51 (100.0%) | 293.0 |
| 35 to 50 years | 0 (0.0%) | 0.0 |
| Total | 51 (100.0%) | 158.0 |
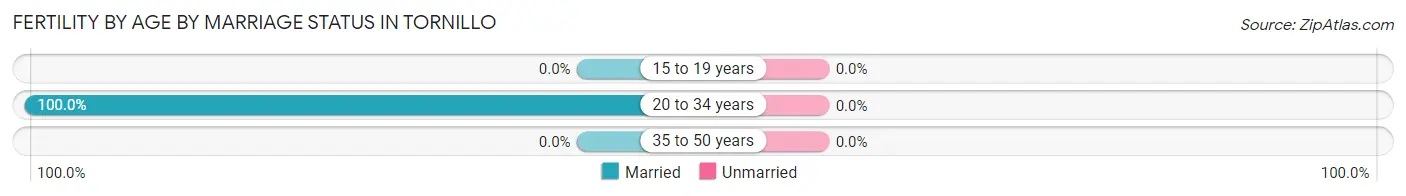
Fertility by Age by Marriage Status in Tornillo
| Age Bracket | Married | Unmarried |
| 15 to 19 years | 0 (0.0%) | 0 (0.0%) |
| 20 to 34 years | 51 (100.0%) | 0 (0.0%) |
| 35 to 50 years | 0 (0.0%) | 0 (0.0%) |
| Total | 51 (100.0%) | 0 (0.0%) |
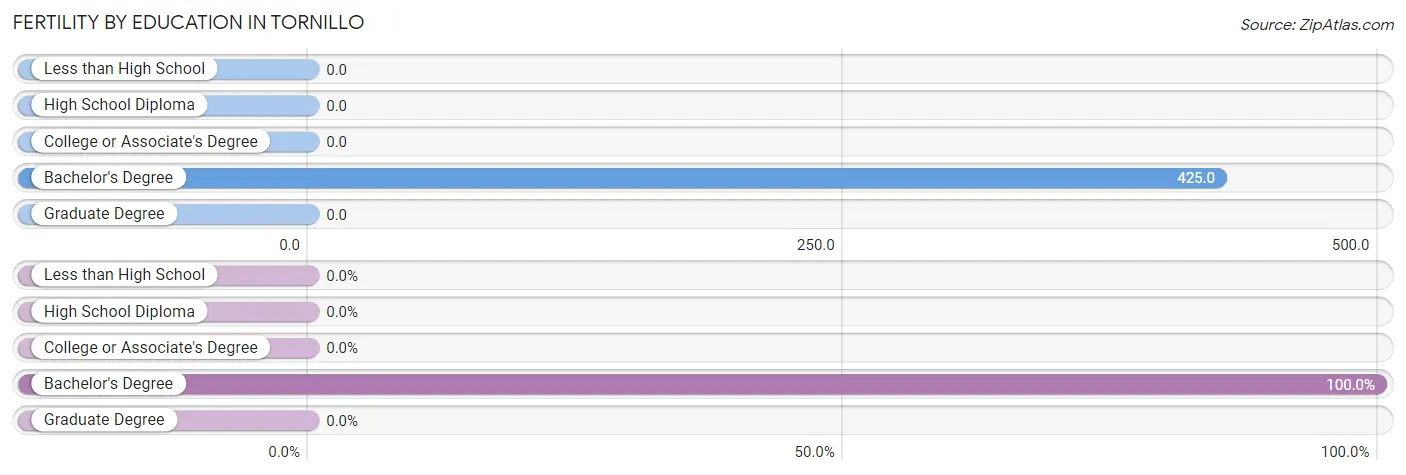
Fertility by Education in Tornillo
| Educational Attainment | Women with Births | Births / 1,000 Women |
| Less than High School | 0 (0.0%) | 0.0 |
| High School Diploma | 0 (0.0%) | 0.0 |
| College or Associate's Degree | 0 (0.0%) | 0.0 |
| Bachelor's Degree | 51 (100.0%) | 425.0 |
| Graduate Degree | 0 (0.0%) | 0.0 |
| Total | 51 (100.0%) | 158.0 |
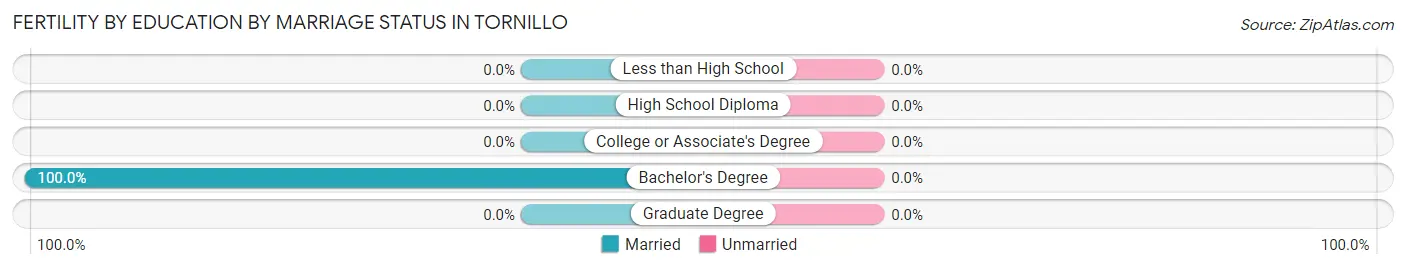
Fertility by Education by Marriage Status in Tornillo
| Educational Attainment | Married | Unmarried |
| Less than High School | 0 (0.0%) | 0 (0.0%) |
| High School Diploma | 0 (0.0%) | 0 (0.0%) |
| College or Associate's Degree | 0 (0.0%) | 0 (0.0%) |
| Bachelor's Degree | 51 (100.0%) | 0 (0.0%) |
| Graduate Degree | 0 (0.0%) | 0 (0.0%) |
| Total | 51 (100.0%) | 0 (0.0%) |
Employment Characteristics in Tornillo
Employment by Class of Employer in Tornillo
Among the 686 employed individuals in Tornillo, private company employees (508 | 74.1%), local government employees (89 | 13.0%), and not-for-profit organizations (36 | 5.2%) make up the most common classes of employment.
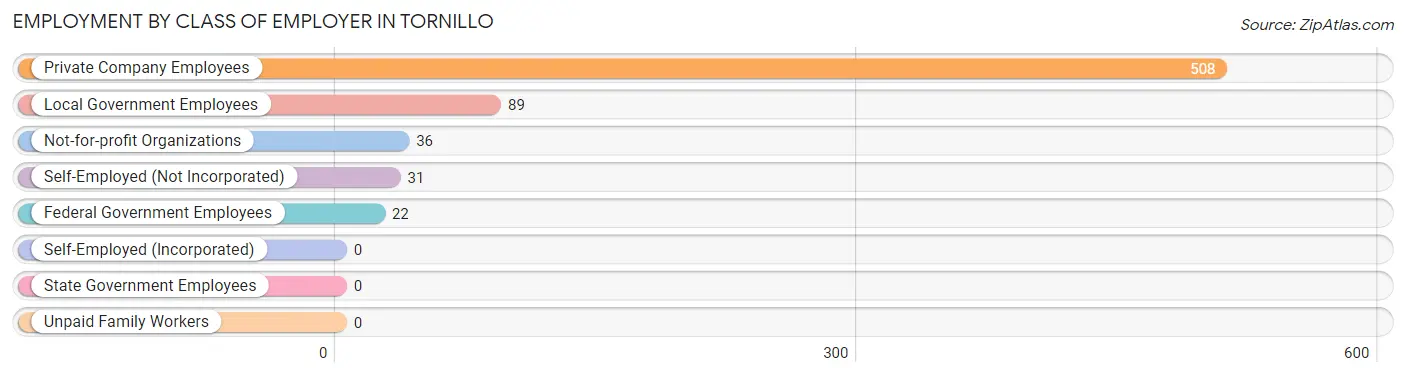
| Employer Class | # Employees | % Employees |
| Private Company Employees | 508 | 74.1% |
| Self-Employed (Incorporated) | 0 | 0.0% |
| Self-Employed (Not Incorporated) | 31 | 4.5% |
| Not-for-profit Organizations | 36 | 5.2% |
| Local Government Employees | 89 | 13.0% |
| State Government Employees | 0 | 0.0% |
| Federal Government Employees | 22 | 3.2% |
| Unpaid Family Workers | 0 | 0.0% |
| Total | 686 | 100.0% |
Employment Status by Age in Tornillo
According to the labor force statistics for Tornillo, out of the total population over 16 years of age (1,358), 56.1% or 762 individuals are in the labor force, with 5.1% or 39 of them unemployed. The age group with the highest labor force participation rate is 25 to 29 years, with 100.0% or 222 individuals in the labor force. Within the labor force, the 25 to 29 years age range has the highest percentage of unemployed individuals, with 14.4% or 32 of them being unemployed.
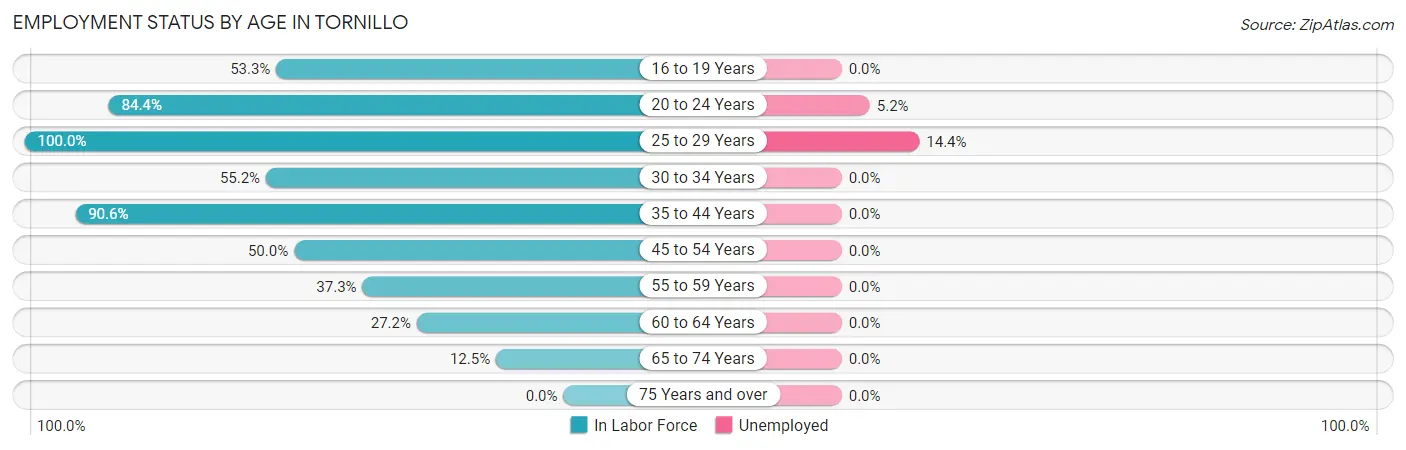
| Age Bracket | In Labor Force | Unemployed |
| 16 to 19 Years | 56 (53.3%) | 0 (0.0%) |
| 20 to 24 Years | 135 (84.4%) | 7 (5.2%) |
| 25 to 29 Years | 222 (100.0%) | 32 (14.4%) |
| 30 to 34 Years | 32 (55.2%) | 0 (0.0%) |
| 35 to 44 Years | 173 (90.6%) | 0 (0.0%) |
| 45 to 54 Years | 63 (50.0%) | 0 (0.0%) |
| 55 to 59 Years | 19 (37.3%) | 0 (0.0%) |
| 60 to 64 Years | 28 (27.2%) | 0 (0.0%) |
| 65 to 74 Years | 34 (12.5%) | 0 (0.0%) |
| 75 Years and over | 0 (0.0%) | 0 (0.0%) |
| Total | 762 (56.1%) | 39 (5.1%) |
Employment Status by Educational Attainment in Tornillo
According to labor force statistics for Tornillo, 71.5% of individuals (537) out of the total population between 25 and 64 years of age (751) are in the labor force, with 6.0% or 32 of them being unemployed. The group with the highest labor force participation rate are those with the educational attainment of college / associate degree, with 100.0% or 204 individuals in the labor force. Within the labor force, individuals with college / associate degree education have the highest percentage of unemployment, with 15.7% or 32 of them being unemployed.
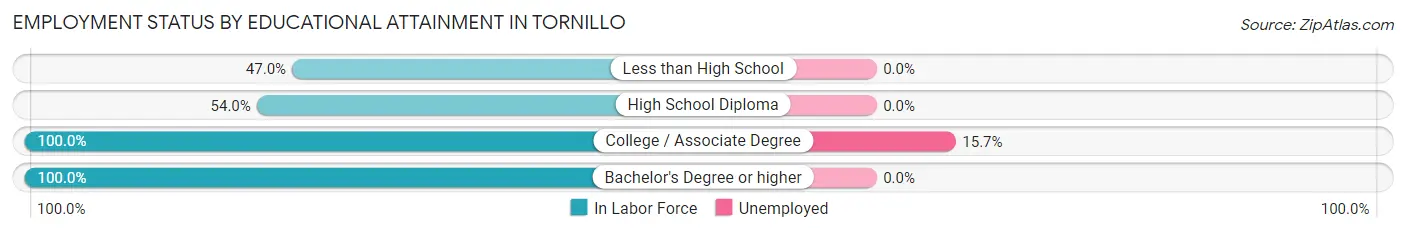
| Educational Attainment | In Labor Force | Unemployed |
| Less than High School | 108 (47.0%) | 0 (0.0%) |
| High School Diploma | 108 (54.0%) | 0 (0.0%) |
| College / Associate Degree | 204 (100.0%) | 32 (15.7%) |
| Bachelor's Degree or higher | 117 (100.0%) | 0 (0.0%) |
| Total | 537 (71.5%) | 45 (6.0%) |
Employment Occupations by Sex in Tornillo
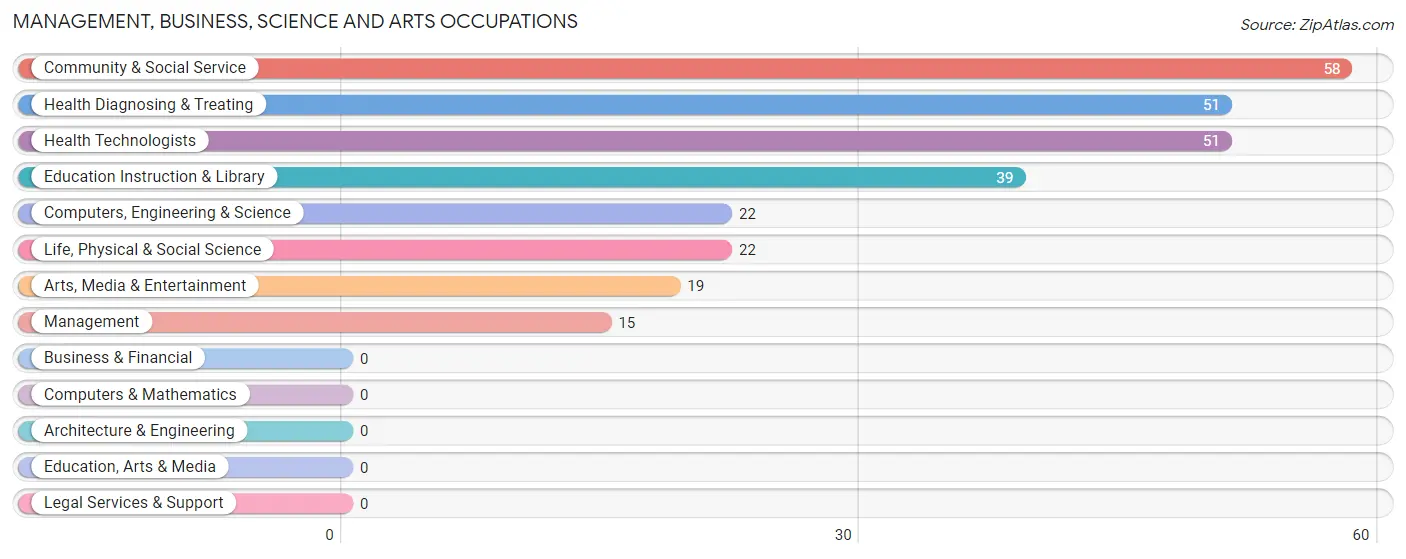
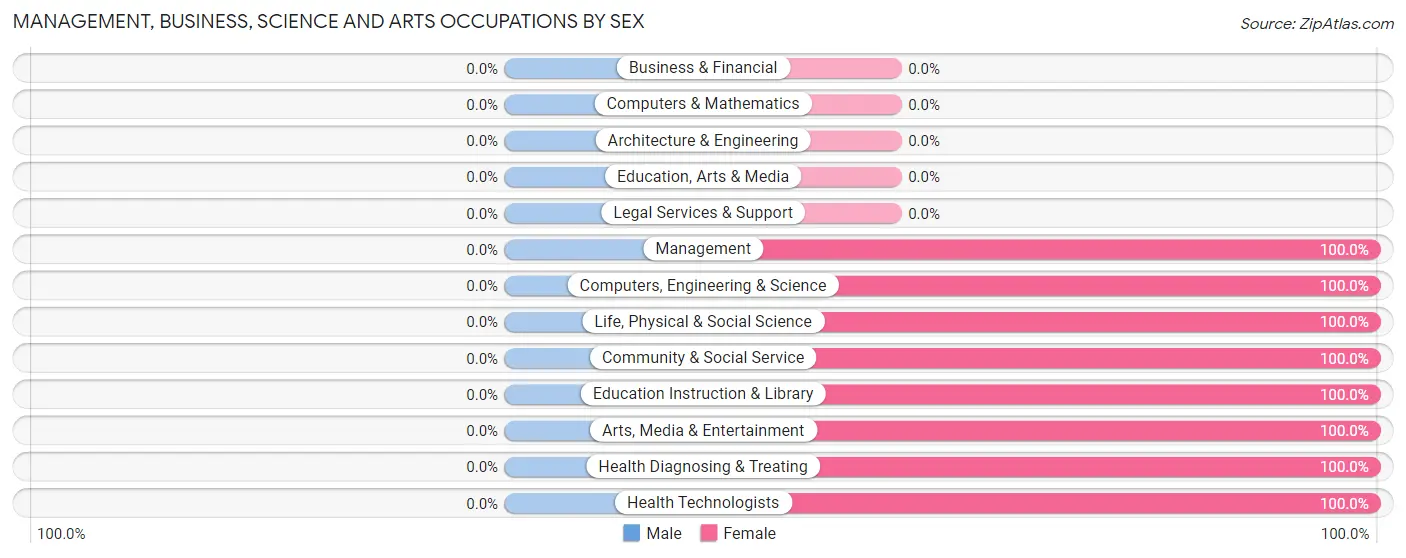
Management, Business, Science and Arts Occupations
The most common Management, Business, Science and Arts occupations in Tornillo are Community & Social Service (58 | 8.0%), Health Diagnosing & Treating (51 | 7.0%), Health Technologists (51 | 7.0%), Education Instruction & Library (39 | 5.4%), and Computers, Engineering & Science (22 | 3.0%).
Management, Business, Science and Arts Occupations by Sex
| Occupation | Male | Female |
| Management | 0 (0.0%) | 15 (100.0%) |
| Business & Financial | 0 (0.0%) | 0 (0.0%) |
| Computers, Engineering & Science | 0 (0.0%) | 22 (100.0%) |
| Computers & Mathematics | 0 (0.0%) | 0 (0.0%) |
| Architecture & Engineering | 0 (0.0%) | 0 (0.0%) |
| Life, Physical & Social Science | 0 (0.0%) | 22 (100.0%) |
| Community & Social Service | 0 (0.0%) | 58 (100.0%) |
| Education, Arts & Media | 0 (0.0%) | 0 (0.0%) |
| Legal Services & Support | 0 (0.0%) | 0 (0.0%) |
| Education Instruction & Library | 0 (0.0%) | 39 (100.0%) |
| Arts, Media & Entertainment | 0 (0.0%) | 19 (100.0%) |
| Health Diagnosing & Treating | 0 (0.0%) | 51 (100.0%) |
| Health Technologists | 0 (0.0%) | 51 (100.0%) |
| Total (Category) | 0 (0.0%) | 146 (100.0%) |
| Total (Overall) | 417 (57.7%) | 306 (42.3%) |
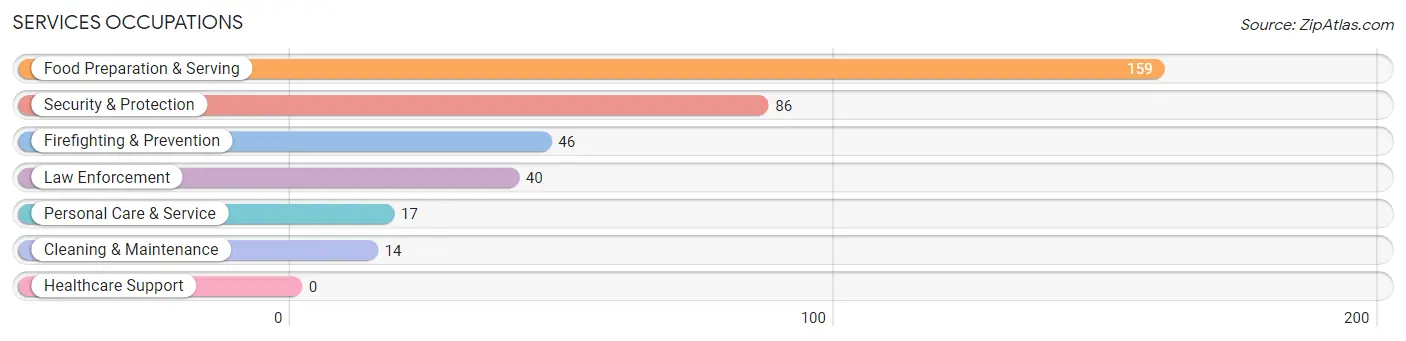
Services Occupations
The most common Services occupations in Tornillo are Food Preparation & Serving (159 | 22.0%), Security & Protection (86 | 11.9%), Firefighting & Prevention (46 | 6.4%), Law Enforcement (40 | 5.5%), and Personal Care & Service (17 | 2.4%).
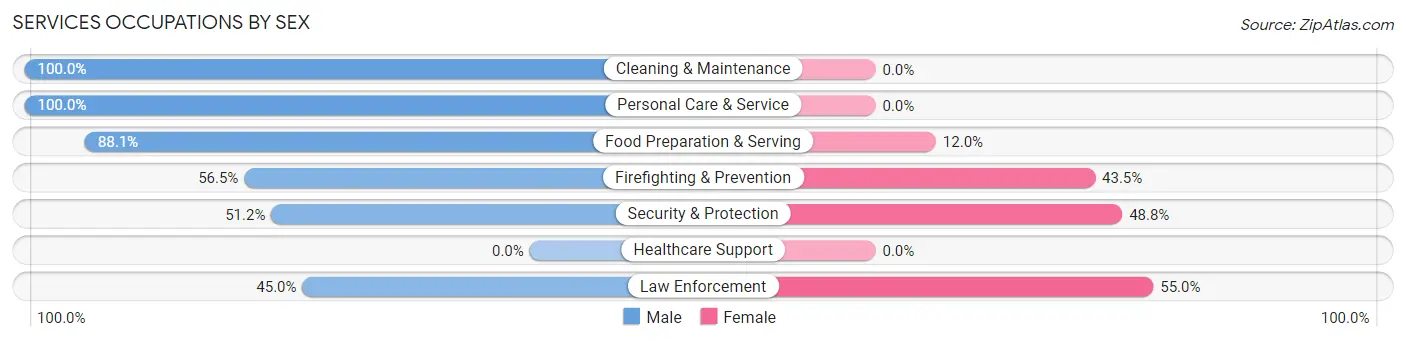
Services Occupations by Sex
Within the Services occupations in Tornillo, the most male-oriented occupations are Cleaning & Maintenance (100.0%), Personal Care & Service (100.0%), and Food Preparation & Serving (88.0%), while the most female-oriented occupations are Law Enforcement (55.0%), Security & Protection (48.8%), and Firefighting & Prevention (43.5%).
| Occupation | Male | Female |
| Healthcare Support | 0 (0.0%) | 0 (0.0%) |
| Security & Protection | 44 (51.2%) | 42 (48.8%) |
| Firefighting & Prevention | 26 (56.5%) | 20 (43.5%) |
| Law Enforcement | 18 (45.0%) | 22 (55.0%) |
| Food Preparation & Serving | 140 (88.0%) | 19 (11.9%) |
| Cleaning & Maintenance | 14 (100.0%) | 0 (0.0%) |
| Personal Care & Service | 17 (100.0%) | 0 (0.0%) |
| Total (Category) | 215 (77.9%) | 61 (22.1%) |
| Total (Overall) | 417 (57.7%) | 306 (42.3%) |
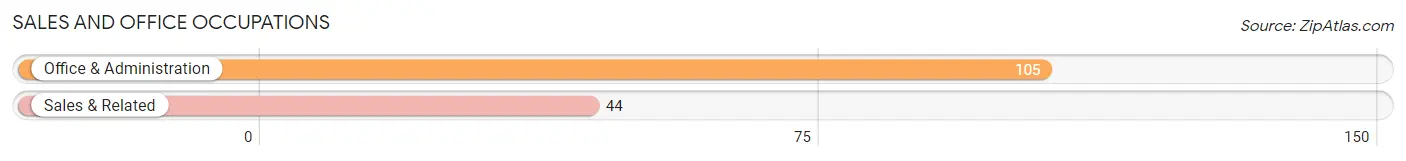
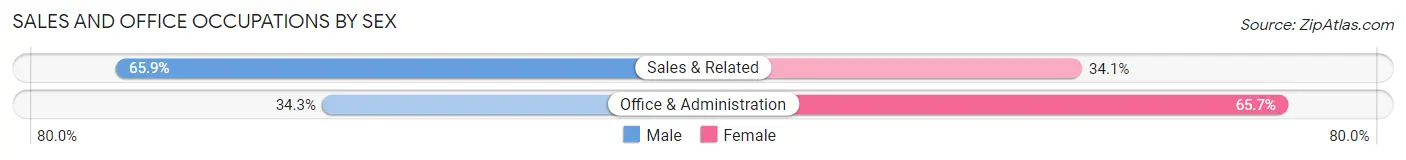
Sales and Office Occupations
The most common Sales and Office occupations in Tornillo are Office & Administration (105 | 14.5%), and Sales & Related (44 | 6.1%).
Sales and Office Occupations by Sex
| Occupation | Male | Female |
| Sales & Related | 29 (65.9%) | 15 (34.1%) |
| Office & Administration | 36 (34.3%) | 69 (65.7%) |
| Total (Category) | 65 (43.6%) | 84 (56.4%) |
| Total (Overall) | 417 (57.7%) | 306 (42.3%) |
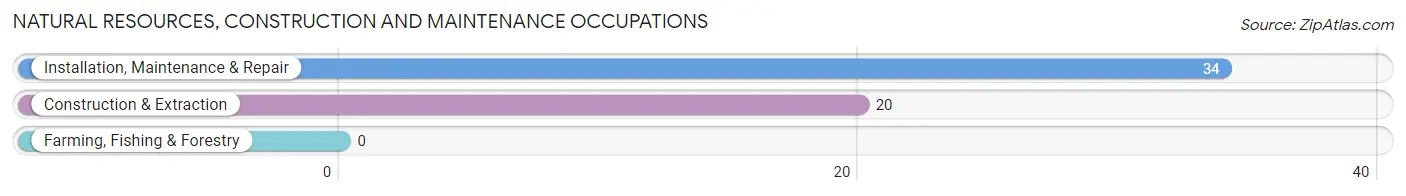
Natural Resources, Construction and Maintenance Occupations
The most common Natural Resources, Construction and Maintenance occupations in Tornillo are Installation, Maintenance & Repair (34 | 4.7%), and Construction & Extraction (20 | 2.8%).
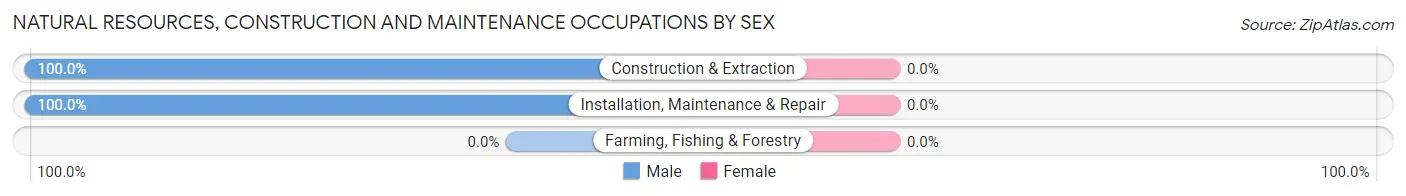
Natural Resources, Construction and Maintenance Occupations by Sex
| Occupation | Male | Female |
| Farming, Fishing & Forestry | 0 (0.0%) | 0 (0.0%) |
| Construction & Extraction | 20 (100.0%) | 0 (0.0%) |
| Installation, Maintenance & Repair | 34 (100.0%) | 0 (0.0%) |
| Total (Category) | 54 (100.0%) | 0 (0.0%) |
| Total (Overall) | 417 (57.7%) | 306 (42.3%) |
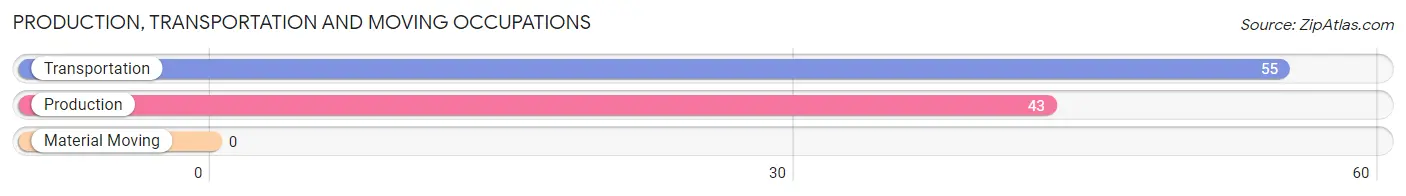
Production, Transportation and Moving Occupations
The most common Production, Transportation and Moving occupations in Tornillo are Transportation (55 | 7.6%), and Production (43 | 5.9%).
Production, Transportation and Moving Occupations by Sex
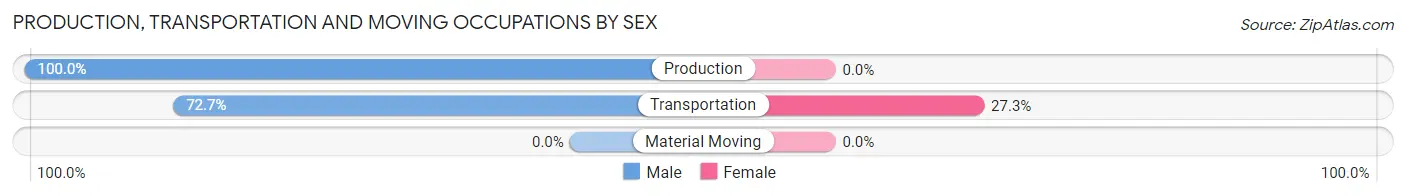
| Occupation | Male | Female |
| Production | 43 (100.0%) | 0 (0.0%) |
| Transportation | 40 (72.7%) | 15 (27.3%) |
| Material Moving | 0 (0.0%) | 0 (0.0%) |
| Total (Category) | 83 (84.7%) | 15 (15.3%) |
| Total (Overall) | 417 (57.7%) | 306 (42.3%) |
Employment Industries by Sex in Tornillo
Employment Industries in Tornillo
The major employment industries in Tornillo include Accommodation & Food Services (159 | 22.0%), Educational Services (95 | 13.1%), Administrative & Support (66 | 9.1%), Health Care & Social Assistance (66 | 9.1%), and Transportation & Warehousing (53 | 7.3%).
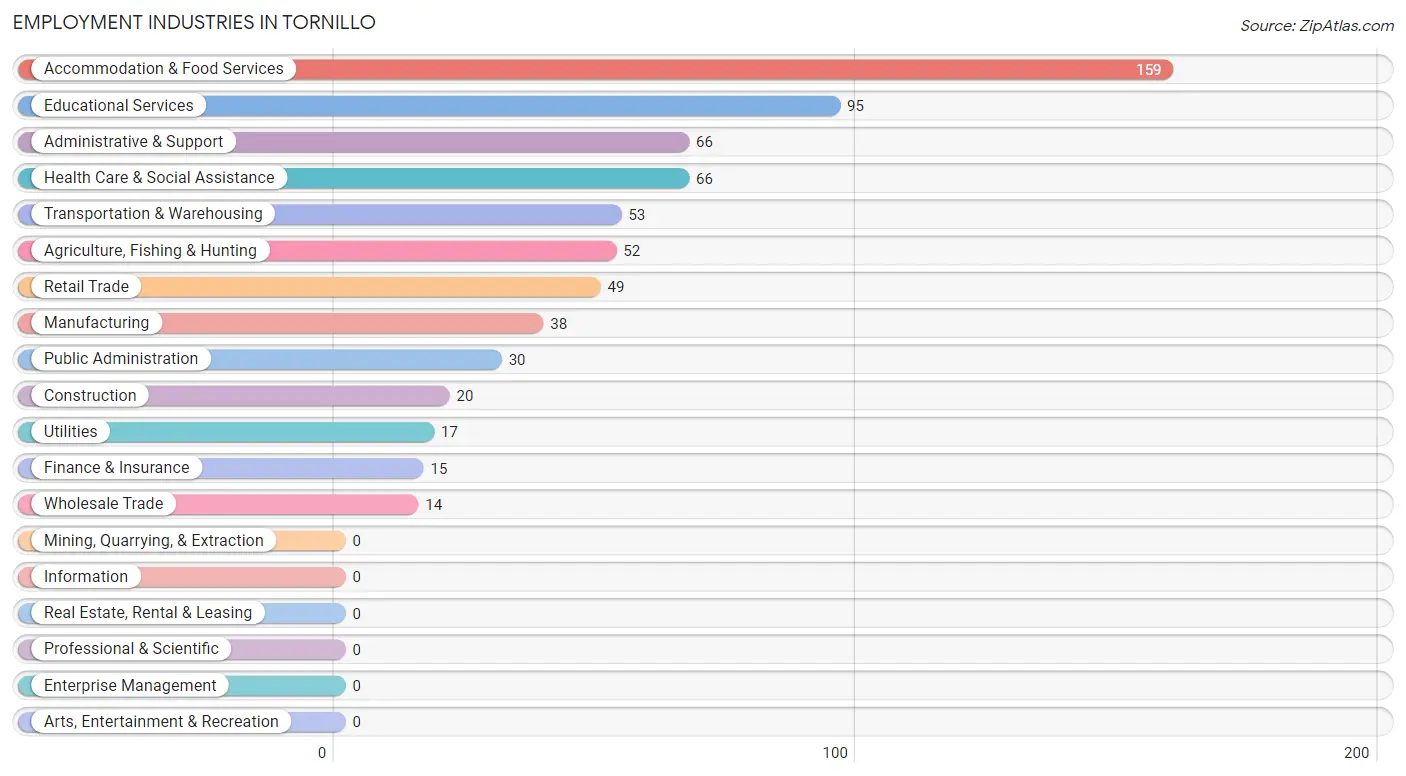
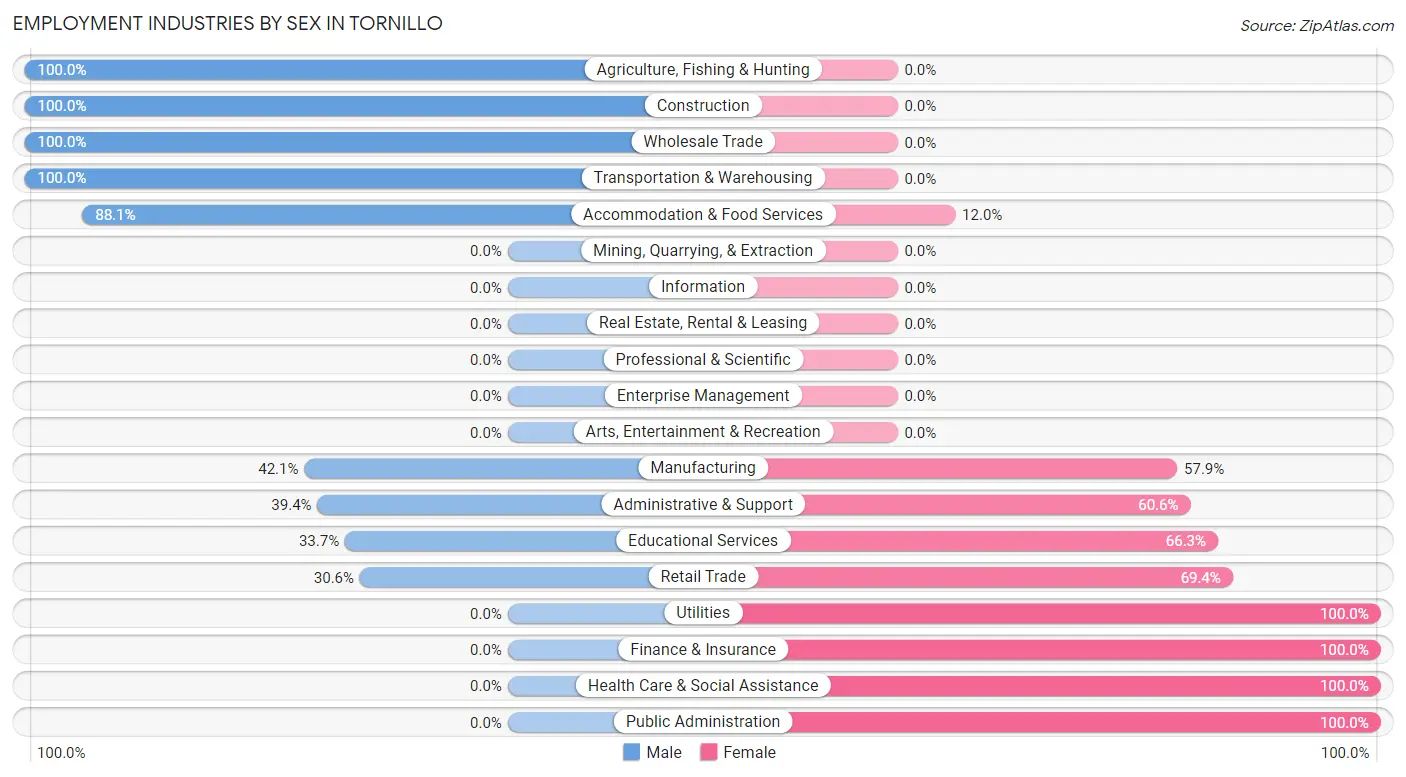
Employment Industries by Sex in Tornillo
The Tornillo industries that see more men than women are Agriculture, Fishing & Hunting (100.0%), Construction (100.0%), and Wholesale Trade (100.0%), whereas the industries that tend to have a higher number of women are Utilities (100.0%), Finance & Insurance (100.0%), and Health Care & Social Assistance (100.0%).
| Industry | Male | Female |
| Agriculture, Fishing & Hunting | 52 (100.0%) | 0 (0.0%) |
| Mining, Quarrying, & Extraction | 0 (0.0%) | 0 (0.0%) |
| Construction | 20 (100.0%) | 0 (0.0%) |
| Manufacturing | 16 (42.1%) | 22 (57.9%) |
| Wholesale Trade | 14 (100.0%) | 0 (0.0%) |
| Retail Trade | 15 (30.6%) | 34 (69.4%) |
| Transportation & Warehousing | 53 (100.0%) | 0 (0.0%) |
| Utilities | 0 (0.0%) | 17 (100.0%) |
| Information | 0 (0.0%) | 0 (0.0%) |
| Finance & Insurance | 0 (0.0%) | 15 (100.0%) |
| Real Estate, Rental & Leasing | 0 (0.0%) | 0 (0.0%) |
| Professional & Scientific | 0 (0.0%) | 0 (0.0%) |
| Enterprise Management | 0 (0.0%) | 0 (0.0%) |
| Administrative & Support | 26 (39.4%) | 40 (60.6%) |
| Educational Services | 32 (33.7%) | 63 (66.3%) |
| Health Care & Social Assistance | 0 (0.0%) | 66 (100.0%) |
| Arts, Entertainment & Recreation | 0 (0.0%) | 0 (0.0%) |
| Accommodation & Food Services | 140 (88.0%) | 19 (11.9%) |
| Public Administration | 0 (0.0%) | 30 (100.0%) |
| Total | 417 (57.7%) | 306 (42.3%) |
Education in Tornillo
School Enrollment in Tornillo
The most common levels of schooling among the 461 students in Tornillo are college / undergraduate (171 | 37.1%), middle school (100 | 21.7%), and high school (81 | 17.6%).
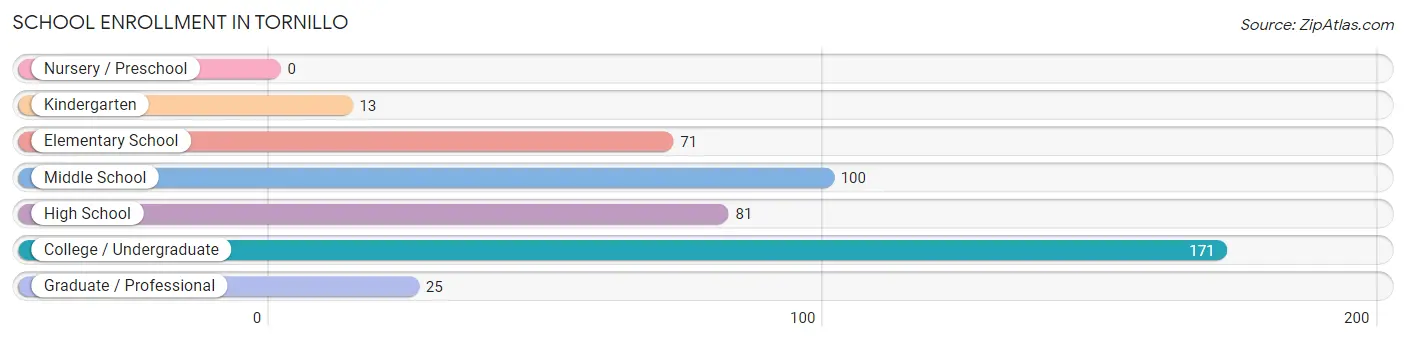
| School Level | # Students | % Students |
| Nursery / Preschool | 0 | 0.0% |
| Kindergarten | 13 | 2.8% |
| Elementary School | 71 | 15.4% |
| Middle School | 100 | 21.7% |
| High School | 81 | 17.6% |
| College / Undergraduate | 171 | 37.1% |
| Graduate / Professional | 25 | 5.4% |
| Total | 461 | 100.0% |
School Enrollment by Age by Funding Source in Tornillo
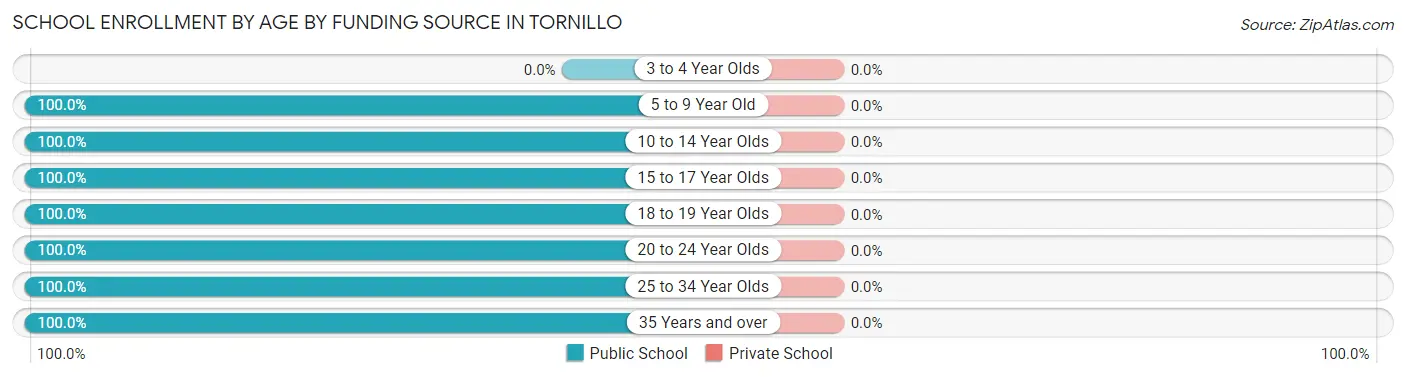
| Age Bracket | Public School | Private School |
| 3 to 4 Year Olds | 0 (0.0%) | 0 (0.0%) |
| 5 to 9 Year Old | 84 (100.0%) | 0 (0.0%) |
| 10 to 14 Year Olds | 100 (100.0%) | 0 (0.0%) |
| 15 to 17 Year Olds | 45 (100.0%) | 0 (0.0%) |
| 18 to 19 Year Olds | 36 (100.0%) | 0 (0.0%) |
| 20 to 24 Year Olds | 44 (100.0%) | 0 (0.0%) |
| 25 to 34 Year Olds | 116 (100.0%) | 0 (0.0%) |
| 35 Years and over | 36 (100.0%) | 0 (0.0%) |
| Total | 461 (100.0%) | 0 (0.0%) |
Educational Attainment by Field of Study in Tornillo
Science & technology (51 | 43.6%), arts & humanities (49 | 41.9%), and business (17 | 14.5%) are the most common fields of study among 117 individuals in Tornillo who have obtained a bachelor's degree or higher.
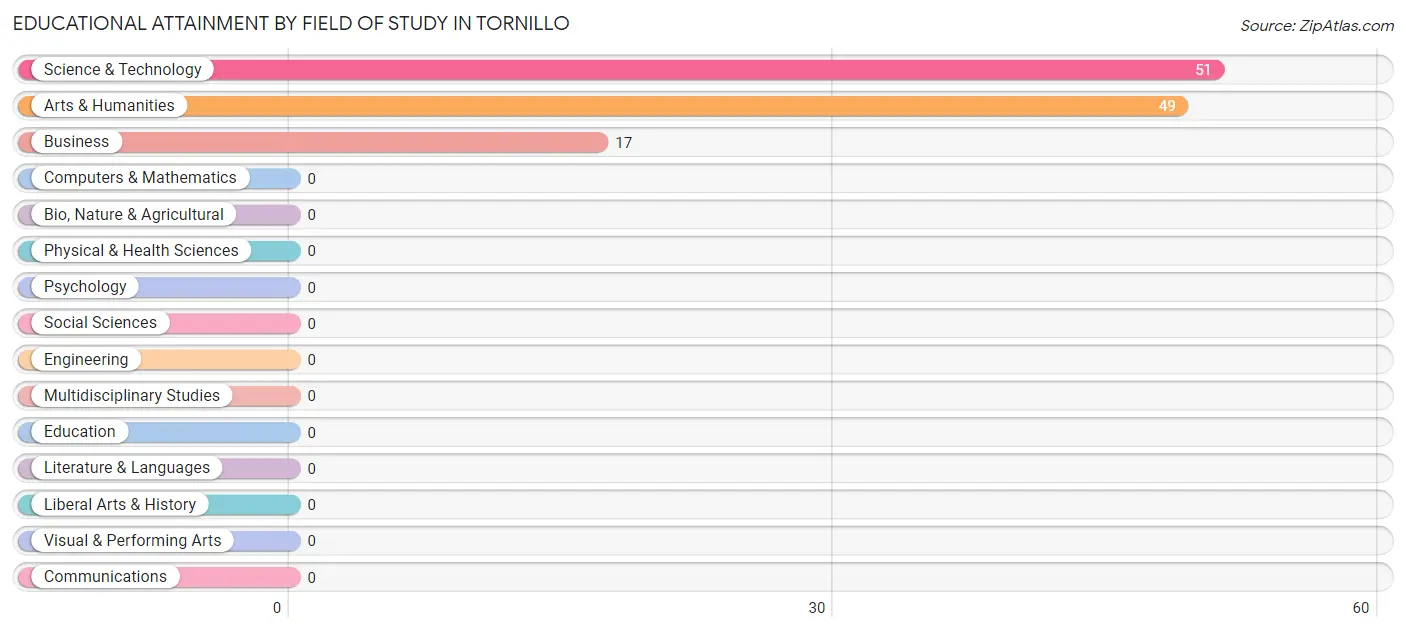
| Field of Study | # Graduates | % Graduates |
| Computers & Mathematics | 0 | 0.0% |
| Bio, Nature & Agricultural | 0 | 0.0% |
| Physical & Health Sciences | 0 | 0.0% |
| Psychology | 0 | 0.0% |
| Social Sciences | 0 | 0.0% |
| Engineering | 0 | 0.0% |
| Multidisciplinary Studies | 0 | 0.0% |
| Science & Technology | 51 | 43.6% |
| Business | 17 | 14.5% |
| Education | 0 | 0.0% |
| Literature & Languages | 0 | 0.0% |
| Liberal Arts & History | 0 | 0.0% |
| Visual & Performing Arts | 0 | 0.0% |
| Communications | 0 | 0.0% |
| Arts & Humanities | 49 | 41.9% |
| Total | 117 | 100.0% |
Transportation & Commute in Tornillo
Vehicle Availability by Sex in Tornillo
The most prevalent vehicle ownership categories in Tornillo are males with 2 vehicles (144, accounting for 36.1%) and females with 2 vehicles (158, making up 50.2%).
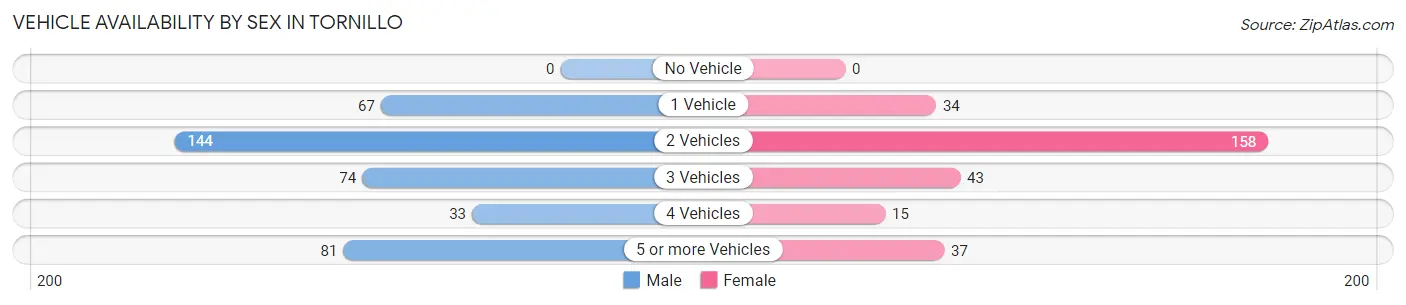
| Vehicles Available | Male | Female |
| No Vehicle | 0 (0.0%) | 0 (0.0%) |
| 1 Vehicle | 67 (16.8%) | 34 (11.8%) |
| 2 Vehicles | 144 (36.1%) | 158 (55.0%) |
| 3 Vehicles | 74 (18.5%) | 43 (15.0%) |
| 4 Vehicles | 33 (8.3%) | 15 (5.2%) |
| 5 or more Vehicles | 81 (20.3%) | 37 (12.9%) |
| Total | 399 (100.0%) | 287 (100.0%) |
Commute Time in Tornillo
The most frequently occuring commute durations in Tornillo are 60 to 89 minutes (106 commuters, 16.3%), 20 to 24 minutes (95 commuters, 14.6%), and 30 to 34 minutes (94 commuters, 14.5%).
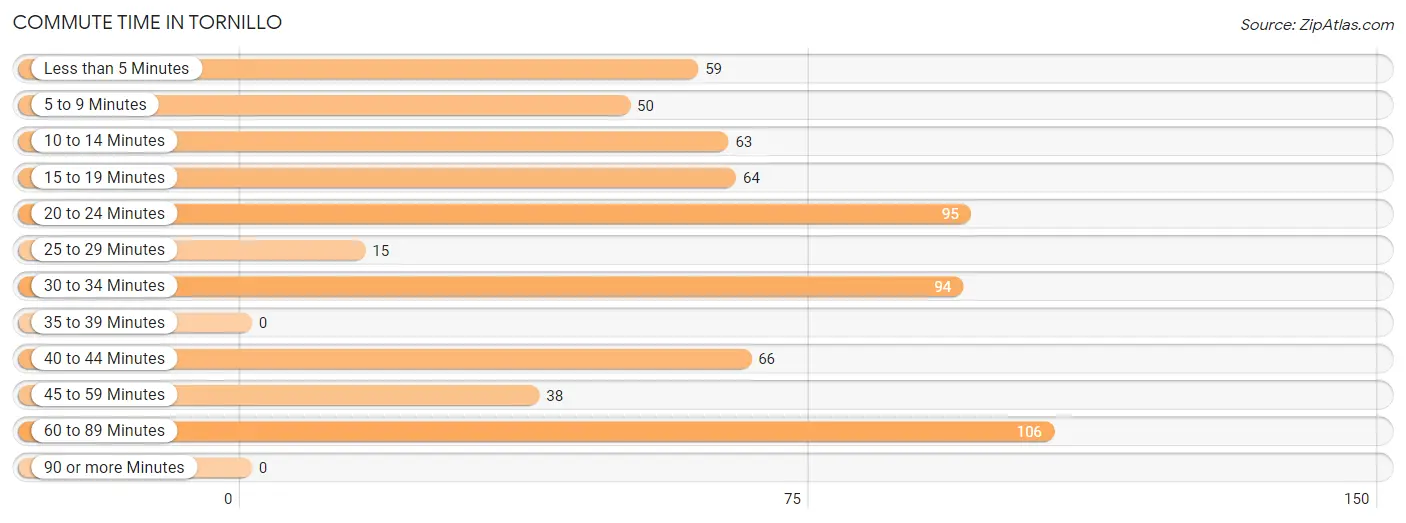
| Commute Time | # Commuters | % Commuters |
| Less than 5 Minutes | 59 | 9.1% |
| 5 to 9 Minutes | 50 | 7.7% |
| 10 to 14 Minutes | 63 | 9.7% |
| 15 to 19 Minutes | 64 | 9.9% |
| 20 to 24 Minutes | 95 | 14.6% |
| 25 to 29 Minutes | 15 | 2.3% |
| 30 to 34 Minutes | 94 | 14.5% |
| 35 to 39 Minutes | 0 | 0.0% |
| 40 to 44 Minutes | 66 | 10.2% |
| 45 to 59 Minutes | 38 | 5.9% |
| 60 to 89 Minutes | 106 | 16.3% |
| 90 or more Minutes | 0 | 0.0% |
Commute Time by Sex in Tornillo
The most common commute times in Tornillo are 30 to 34 minutes (79 commuters, 21.8%) for males and 60 to 89 minutes (71 commuters, 24.7%) for females.
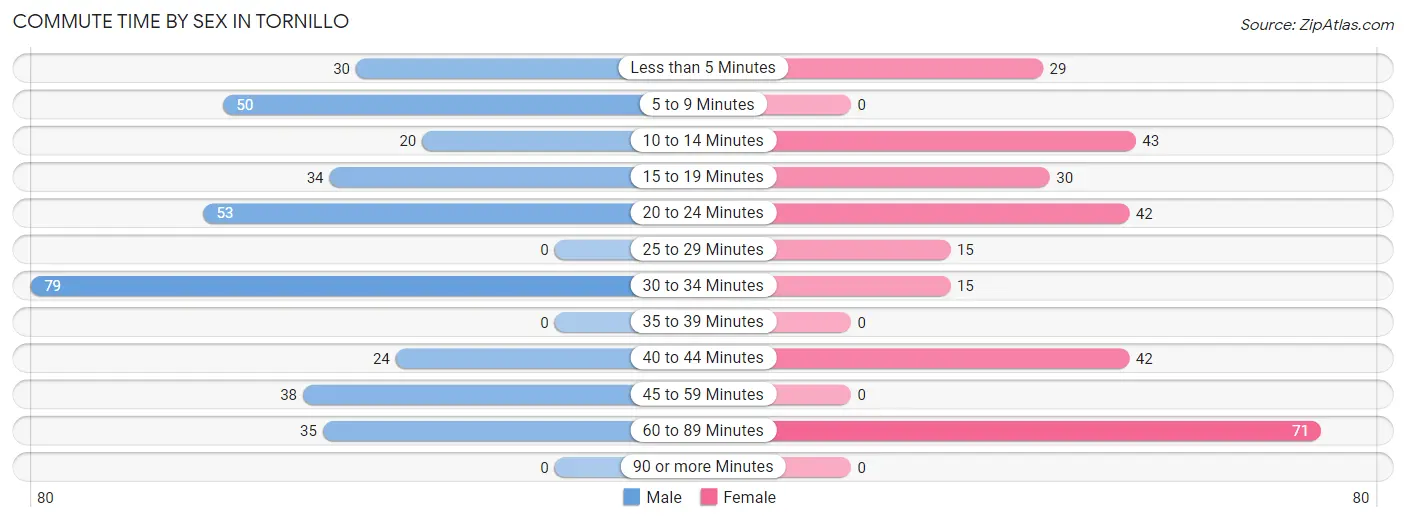
| Commute Time | Male | Female |
| Less than 5 Minutes | 30 (8.3%) | 29 (10.1%) |
| 5 to 9 Minutes | 50 (13.8%) | 0 (0.0%) |
| 10 to 14 Minutes | 20 (5.5%) | 43 (15.0%) |
| 15 to 19 Minutes | 34 (9.4%) | 30 (10.4%) |
| 20 to 24 Minutes | 53 (14.6%) | 42 (14.6%) |
| 25 to 29 Minutes | 0 (0.0%) | 15 (5.2%) |
| 30 to 34 Minutes | 79 (21.8%) | 15 (5.2%) |
| 35 to 39 Minutes | 0 (0.0%) | 0 (0.0%) |
| 40 to 44 Minutes | 24 (6.6%) | 42 (14.6%) |
| 45 to 59 Minutes | 38 (10.5%) | 0 (0.0%) |
| 60 to 89 Minutes | 35 (9.6%) | 71 (24.7%) |
| 90 or more Minutes | 0 (0.0%) | 0 (0.0%) |
Time of Departure to Work by Sex in Tornillo
The most frequent times of departure to work in Tornillo are 4:00 PM to 11:59 PM (101, 27.8%) for males and 7:30 AM to 7:59 AM (129, 45.0%) for females.
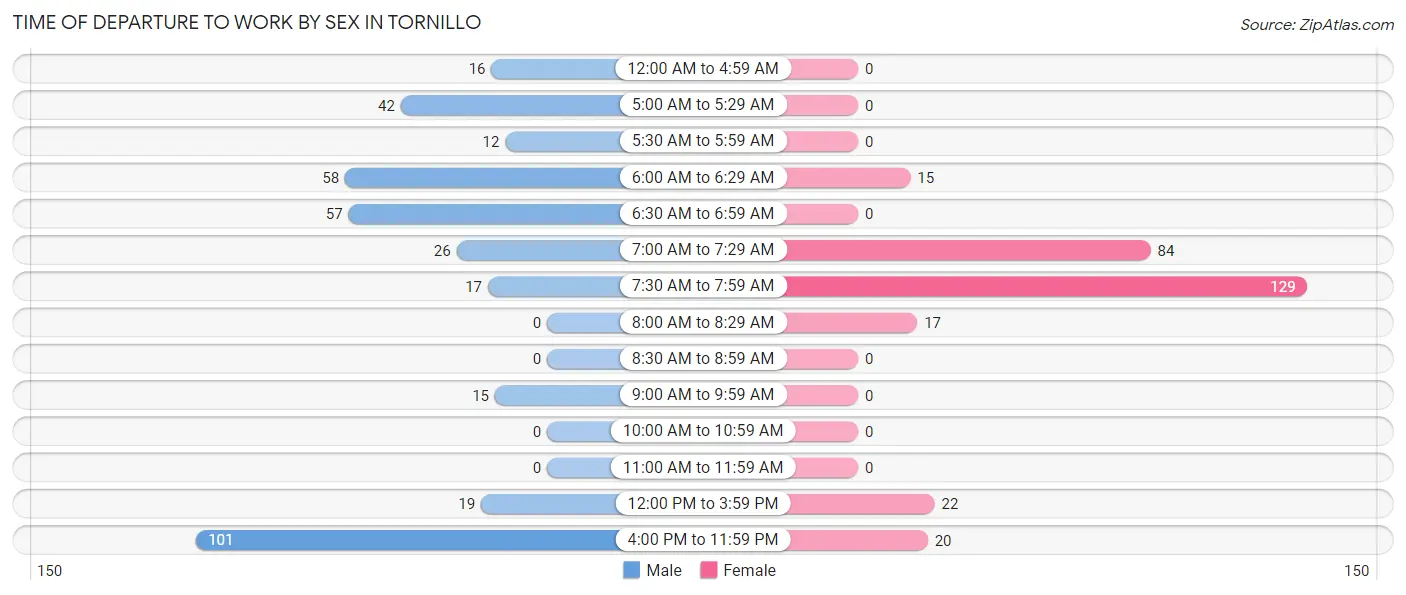
| Time of Departure | Male | Female |
| 12:00 AM to 4:59 AM | 16 (4.4%) | 0 (0.0%) |
| 5:00 AM to 5:29 AM | 42 (11.6%) | 0 (0.0%) |
| 5:30 AM to 5:59 AM | 12 (3.3%) | 0 (0.0%) |
| 6:00 AM to 6:29 AM | 58 (16.0%) | 15 (5.2%) |
| 6:30 AM to 6:59 AM | 57 (15.7%) | 0 (0.0%) |
| 7:00 AM to 7:29 AM | 26 (7.2%) | 84 (29.3%) |
| 7:30 AM to 7:59 AM | 17 (4.7%) | 129 (45.0%) |
| 8:00 AM to 8:29 AM | 0 (0.0%) | 17 (5.9%) |
| 8:30 AM to 8:59 AM | 0 (0.0%) | 0 (0.0%) |
| 9:00 AM to 9:59 AM | 15 (4.1%) | 0 (0.0%) |
| 10:00 AM to 10:59 AM | 0 (0.0%) | 0 (0.0%) |
| 11:00 AM to 11:59 AM | 0 (0.0%) | 0 (0.0%) |
| 12:00 PM to 3:59 PM | 19 (5.2%) | 22 (7.7%) |
| 4:00 PM to 11:59 PM | 101 (27.8%) | 20 (7.0%) |
| Total | 363 (100.0%) | 287 (100.0%) |
Housing Occupancy in Tornillo
Occupancy by Ownership in Tornillo
Of the total 433 dwellings in Tornillo, owner-occupied units account for 415 (95.8%), while renter-occupied units make up 18 (4.2%).
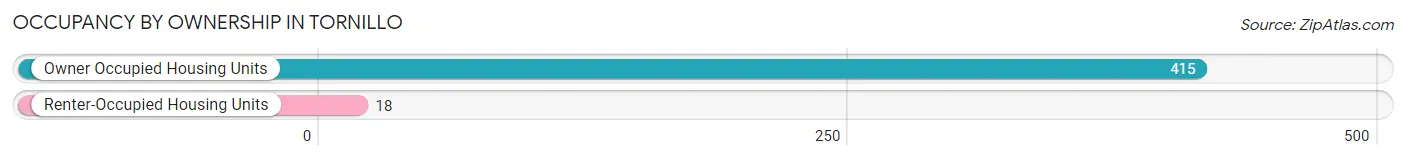
| Occupancy | # Housing Units | % Housing Units |
| Owner Occupied Housing Units | 415 | 95.8% |
| Renter-Occupied Housing Units | 18 | 4.2% |
| Total Occupied Housing Units | 433 | 100.0% |
Occupancy by Household Size in Tornillo
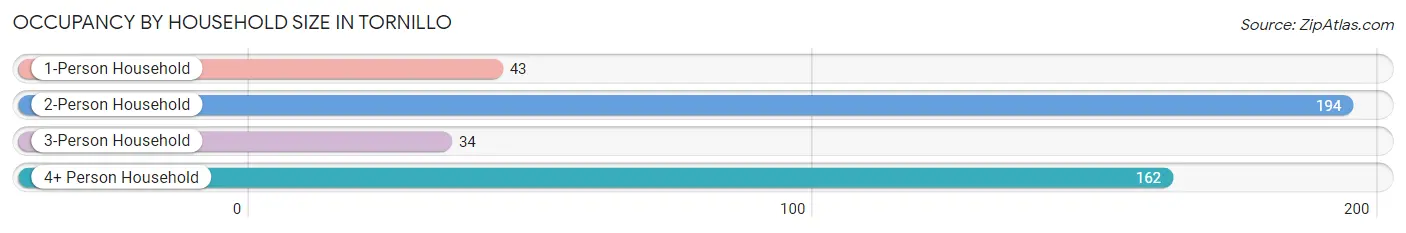
| Household Size | # Housing Units | % Housing Units |
| 1-Person Household | 43 | 9.9% |
| 2-Person Household | 194 | 44.8% |
| 3-Person Household | 34 | 7.9% |
| 4+ Person Household | 162 | 37.4% |
| Total Housing Units | 433 | 100.0% |
Occupancy by Ownership by Household Size in Tornillo
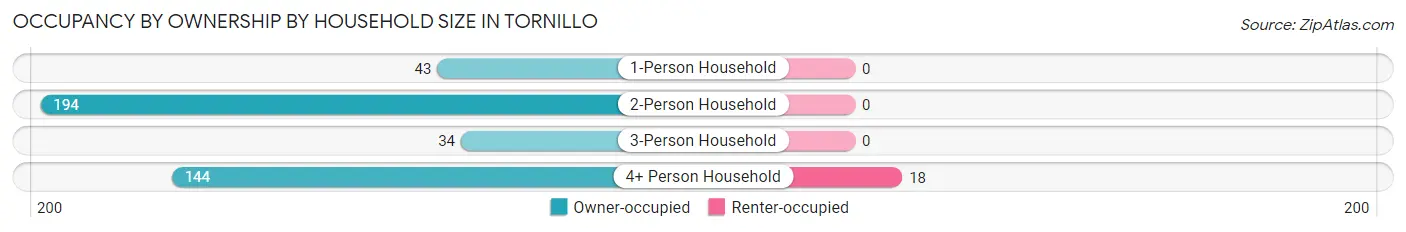
| Household Size | Owner-occupied | Renter-occupied |
| 1-Person Household | 43 (100.0%) | 0 (0.0%) |
| 2-Person Household | 194 (100.0%) | 0 (0.0%) |
| 3-Person Household | 34 (100.0%) | 0 (0.0%) |
| 4+ Person Household | 144 (88.9%) | 18 (11.1%) |
| Total Housing Units | 415 (95.8%) | 18 (4.2%) |
Occupancy by Educational Attainment in Tornillo
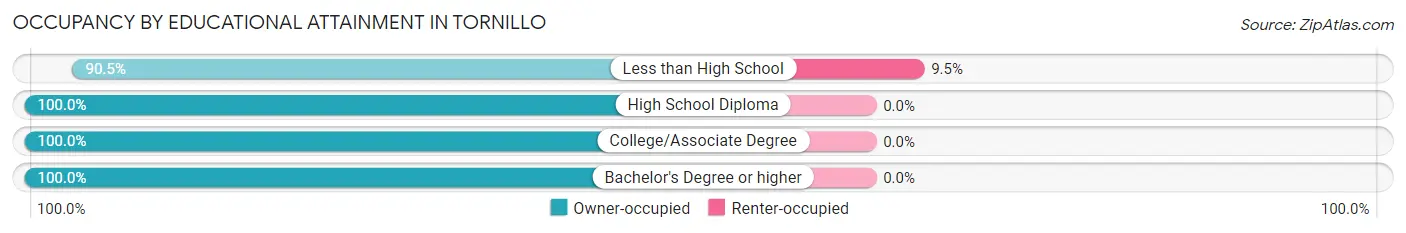
| Household Size | Owner-occupied | Renter-occupied |
| Less than High School | 171 (90.5%) | 18 (9.5%) |
| High School Diploma | 92 (100.0%) | 0 (0.0%) |
| College/Associate Degree | 135 (100.0%) | 0 (0.0%) |
| Bachelor's Degree or higher | 17 (100.0%) | 0 (0.0%) |
Occupancy by Age of Householder in Tornillo
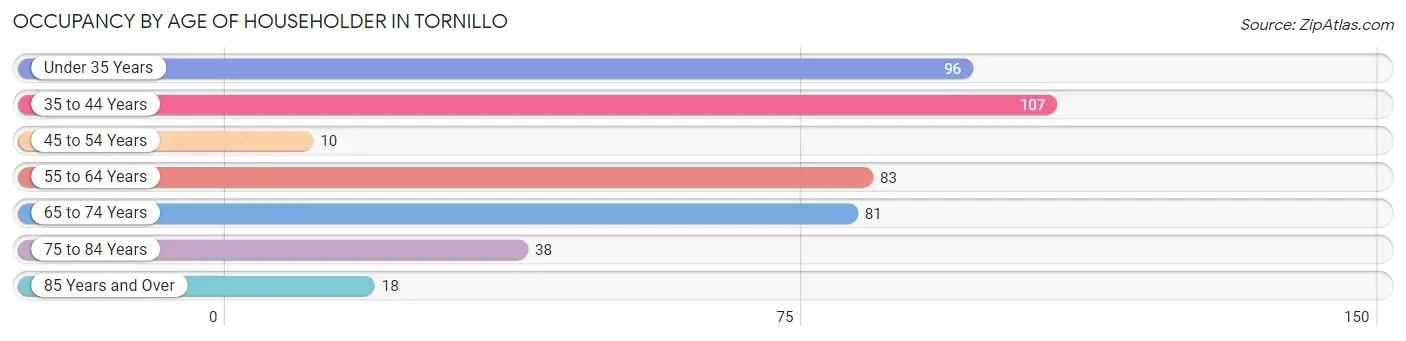
| Age Bracket | # Households | % Households |
| Under 35 Years | 96 | 22.2% |
| 35 to 44 Years | 107 | 24.7% |
| 45 to 54 Years | 10 | 2.3% |
| 55 to 64 Years | 83 | 19.2% |
| 65 to 74 Years | 81 | 18.7% |
| 75 to 84 Years | 38 | 8.8% |
| 85 Years and Over | 18 | 4.2% |
| Total | 433 | 100.0% |
Housing Finances in Tornillo
Median Income by Occupancy in Tornillo
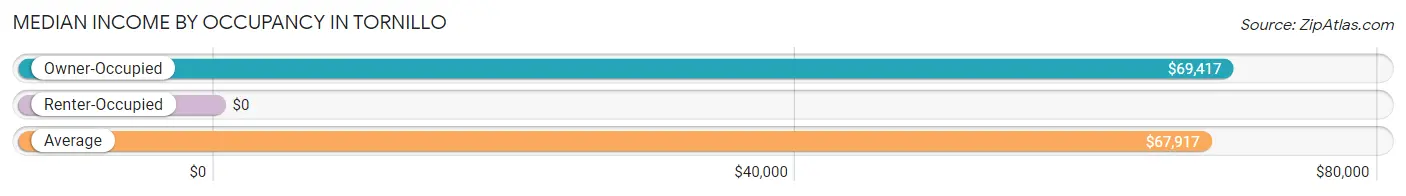
| Occupancy Type | # Households | Median Income |
| Owner-Occupied | 415 (95.8%) | $69,417 |
| Renter-Occupied | 18 (4.2%) | $0 |
| Average | 433 (100.0%) | $67,917 |
Occupancy by Householder Income Bracket in Tornillo
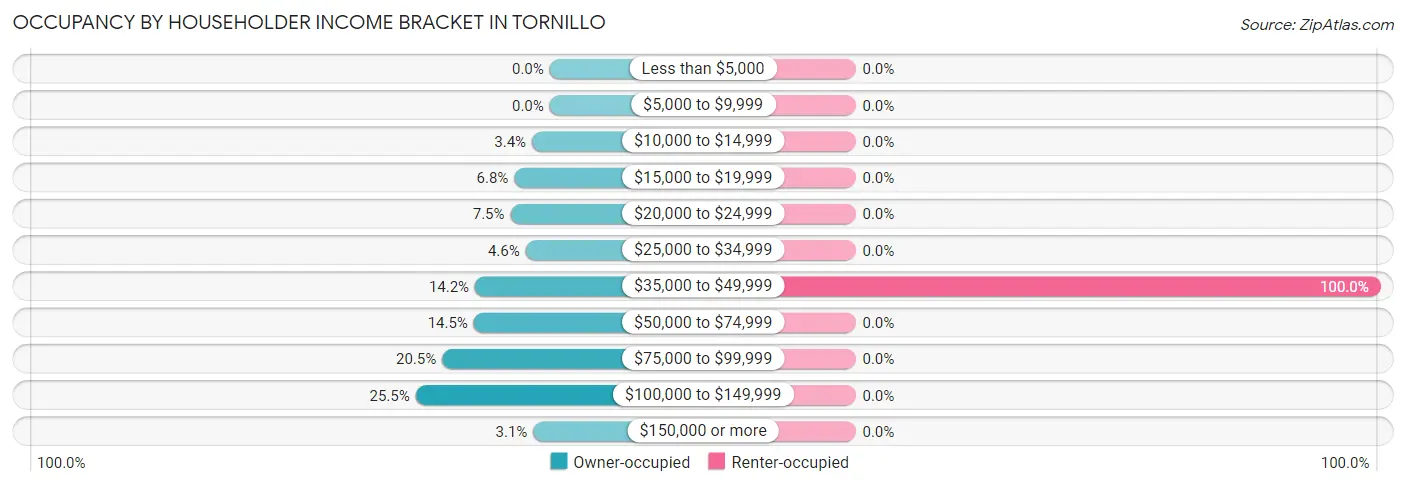
| Income Bracket | Owner-occupied | Renter-occupied |
| Less than $5,000 | 0 (0.0%) | 0 (0.0%) |
| $5,000 to $9,999 | 0 (0.0%) | 0 (0.0%) |
| $10,000 to $14,999 | 14 (3.4%) | 0 (0.0%) |
| $15,000 to $19,999 | 28 (6.8%) | 0 (0.0%) |
| $20,000 to $24,999 | 31 (7.5%) | 0 (0.0%) |
| $25,000 to $34,999 | 19 (4.6%) | 0 (0.0%) |
| $35,000 to $49,999 | 59 (14.2%) | 18 (100.0%) |
| $50,000 to $74,999 | 60 (14.5%) | 0 (0.0%) |
| $75,000 to $99,999 | 85 (20.5%) | 0 (0.0%) |
| $100,000 to $149,999 | 106 (25.5%) | 0 (0.0%) |
| $150,000 or more | 13 (3.1%) | 0 (0.0%) |
| Total | 415 (100.0%) | 18 (100.0%) |
Monthly Housing Cost Tiers in Tornillo
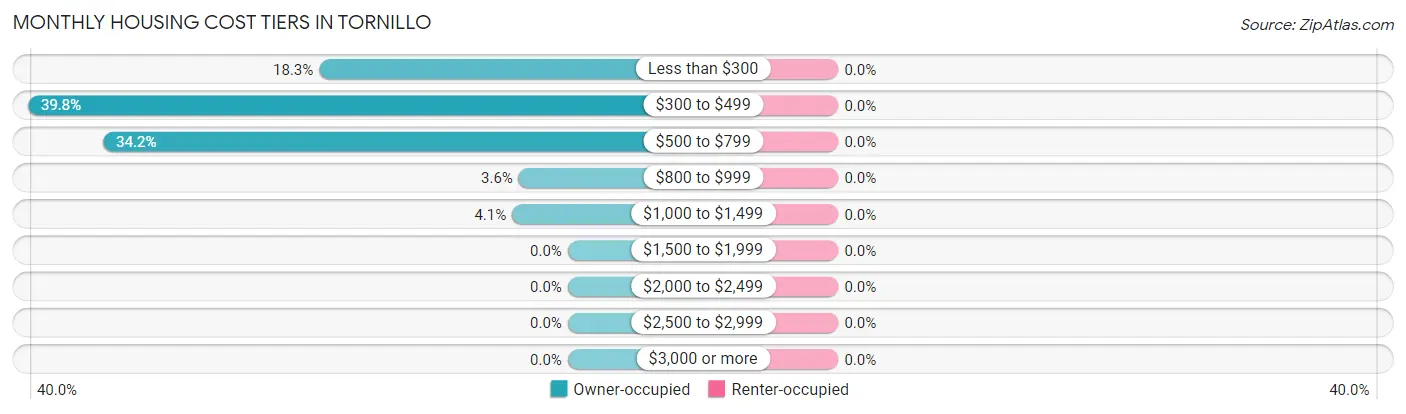
| Monthly Cost | Owner-occupied | Renter-occupied |
| Less than $300 | 76 (18.3%) | 0 (0.0%) |
| $300 to $499 | 165 (39.8%) | 0 (0.0%) |
| $500 to $799 | 142 (34.2%) | 0 (0.0%) |
| $800 to $999 | 15 (3.6%) | 0 (0.0%) |
| $1,000 to $1,499 | 17 (4.1%) | 0 (0.0%) |
| $1,500 to $1,999 | 0 (0.0%) | 0 (0.0%) |
| $2,000 to $2,499 | 0 (0.0%) | 0 (0.0%) |
| $2,500 to $2,999 | 0 (0.0%) | 0 (0.0%) |
| $3,000 or more | 0 (0.0%) | 0 (0.0%) |
| Total | 415 (100.0%) | 18 (100.0%) |
Physical Housing Characteristics in Tornillo
Housing Structures in Tornillo
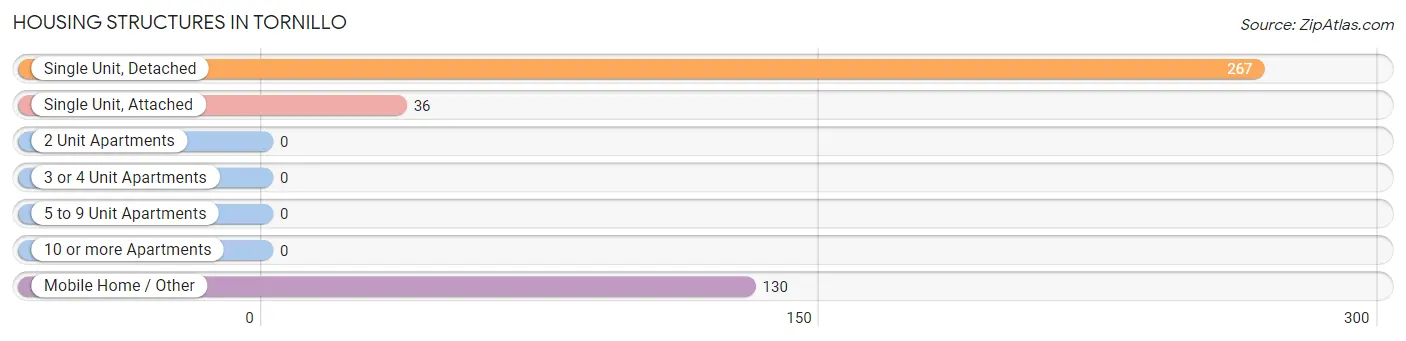
| Structure Type | # Housing Units | % Housing Units |
| Single Unit, Detached | 267 | 61.7% |
| Single Unit, Attached | 36 | 8.3% |
| 2 Unit Apartments | 0 | 0.0% |
| 3 or 4 Unit Apartments | 0 | 0.0% |
| 5 to 9 Unit Apartments | 0 | 0.0% |
| 10 or more Apartments | 0 | 0.0% |
| Mobile Home / Other | 130 | 30.0% |
| Total | 433 | 100.0% |
Housing Structures by Occupancy in Tornillo
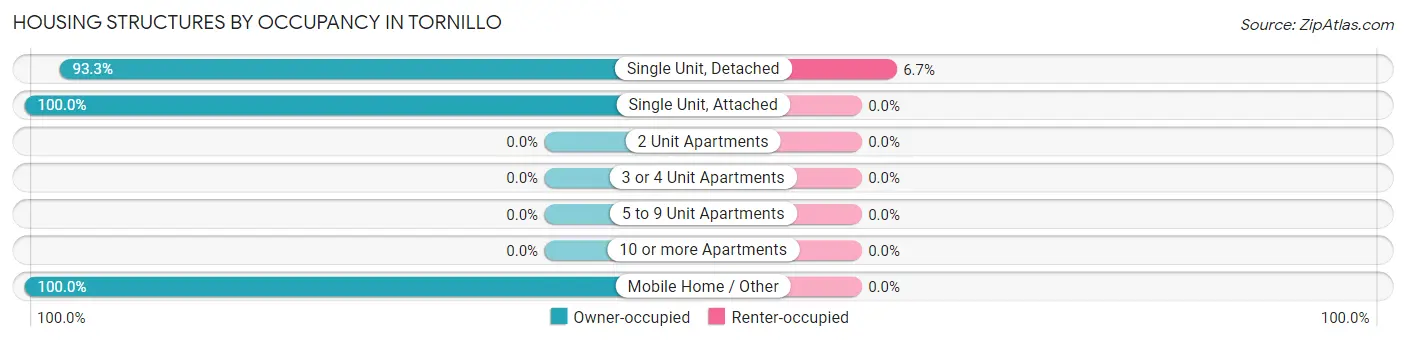
| Structure Type | Owner-occupied | Renter-occupied |
| Single Unit, Detached | 249 (93.3%) | 18 (6.7%) |
| Single Unit, Attached | 36 (100.0%) | 0 (0.0%) |
| 2 Unit Apartments | 0 (0.0%) | 0 (0.0%) |
| 3 or 4 Unit Apartments | 0 (0.0%) | 0 (0.0%) |
| 5 to 9 Unit Apartments | 0 (0.0%) | 0 (0.0%) |
| 10 or more Apartments | 0 (0.0%) | 0 (0.0%) |
| Mobile Home / Other | 130 (100.0%) | 0 (0.0%) |
| Total | 415 (95.8%) | 18 (4.2%) |
Housing Structures by Number of Rooms in Tornillo
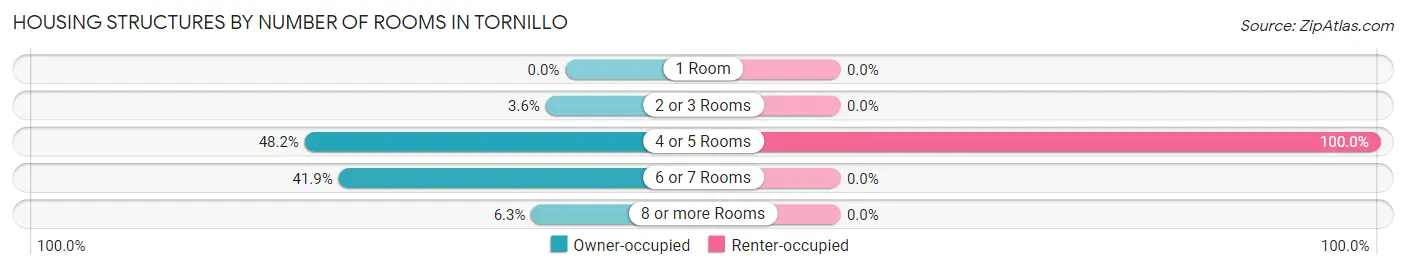
| Number of Rooms | Owner-occupied | Renter-occupied |
| 1 Room | 0 (0.0%) | 0 (0.0%) |
| 2 or 3 Rooms | 15 (3.6%) | 0 (0.0%) |
| 4 or 5 Rooms | 200 (48.2%) | 18 (100.0%) |
| 6 or 7 Rooms | 174 (41.9%) | 0 (0.0%) |
| 8 or more Rooms | 26 (6.3%) | 0 (0.0%) |
| Total | 415 (100.0%) | 18 (100.0%) |
Housing Structure by Heating Type in Tornillo
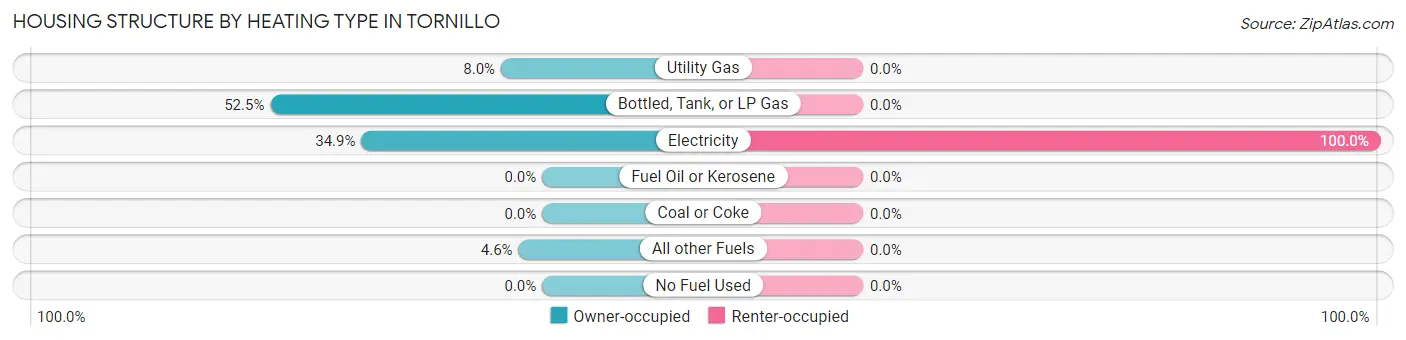
| Heating Type | Owner-occupied | Renter-occupied |
| Utility Gas | 33 (8.0%) | 0 (0.0%) |
| Bottled, Tank, or LP Gas | 218 (52.5%) | 0 (0.0%) |
| Electricity | 145 (34.9%) | 18 (100.0%) |
| Fuel Oil or Kerosene | 0 (0.0%) | 0 (0.0%) |
| Coal or Coke | 0 (0.0%) | 0 (0.0%) |
| All other Fuels | 19 (4.6%) | 0 (0.0%) |
| No Fuel Used | 0 (0.0%) | 0 (0.0%) |
| Total | 415 (100.0%) | 18 (100.0%) |
Household Vehicle Usage in Tornillo
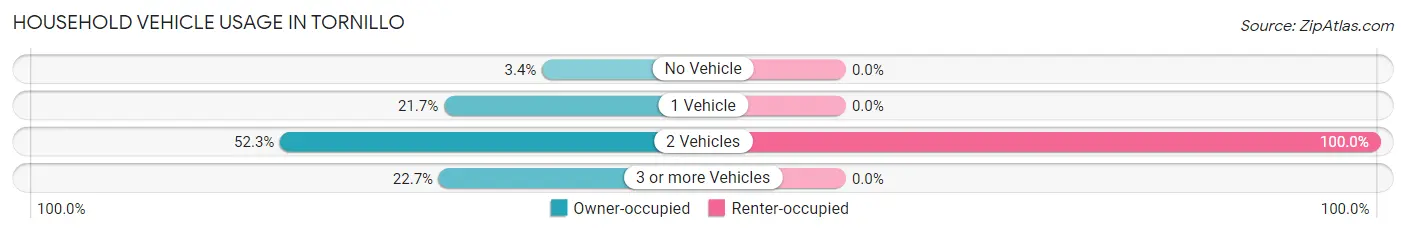
| Vehicles per Household | Owner-occupied | Renter-occupied |
| No Vehicle | 14 (3.4%) | 0 (0.0%) |
| 1 Vehicle | 90 (21.7%) | 0 (0.0%) |
| 2 Vehicles | 217 (52.3%) | 18 (100.0%) |
| 3 or more Vehicles | 94 (22.7%) | 0 (0.0%) |
| Total | 415 (100.0%) | 18 (100.0%) |
Real Estate & Mortgages in Tornillo
Real Estate and Mortgage Overview in Tornillo
| Characteristic | Without Mortgage | With Mortgage |
| Housing Units | 383 | 32 |
| Median Property Value | $69,500 | $0 |
| Median Household Income | $56,908 | $0 |
| Monthly Housing Costs | $442 | $0 |
| Real Estate Taxes | $1,000 | $0 |
Property Value by Mortgage Status in Tornillo
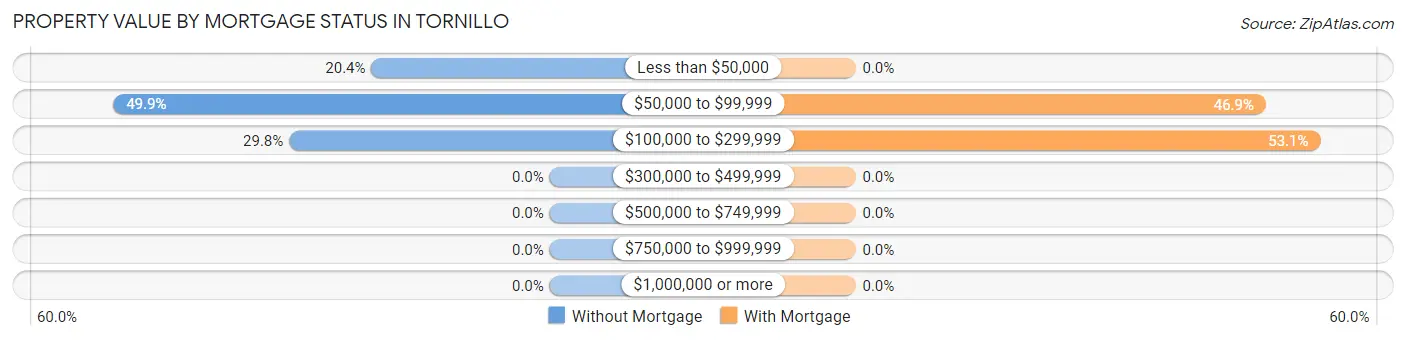
| Property Value | Without Mortgage | With Mortgage |
| Less than $50,000 | 78 (20.4%) | 0 (0.0%) |
| $50,000 to $99,999 | 191 (49.9%) | 15 (46.9%) |
| $100,000 to $299,999 | 114 (29.8%) | 17 (53.1%) |
| $300,000 to $499,999 | 0 (0.0%) | 0 (0.0%) |
| $500,000 to $749,999 | 0 (0.0%) | 0 (0.0%) |
| $750,000 to $999,999 | 0 (0.0%) | 0 (0.0%) |
| $1,000,000 or more | 0 (0.0%) | 0 (0.0%) |
| Total | 383 (100.0%) | 32 (100.0%) |
Household Income by Mortgage Status in Tornillo
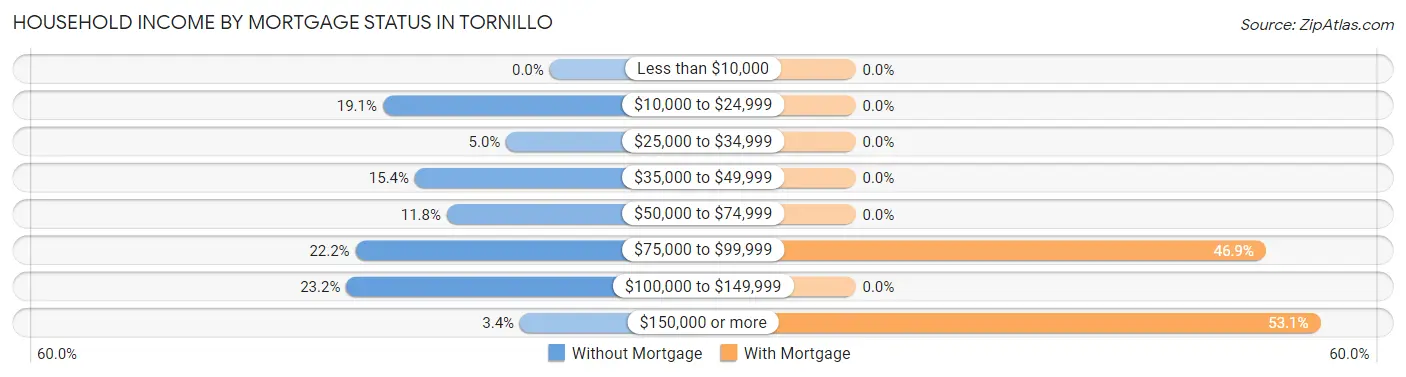
| Household Income | Without Mortgage | With Mortgage |
| Less than $10,000 | 0 (0.0%) | 0 (0.0%) |
| $10,000 to $24,999 | 73 (19.1%) | 0 (0.0%) |
| $25,000 to $34,999 | 19 (5.0%) | 0 (0.0%) |
| $35,000 to $49,999 | 59 (15.4%) | 0 (0.0%) |
| $50,000 to $74,999 | 45 (11.7%) | 0 (0.0%) |
| $75,000 to $99,999 | 85 (22.2%) | 15 (46.9%) |
| $100,000 to $149,999 | 89 (23.2%) | 0 (0.0%) |
| $150,000 or more | 13 (3.4%) | 17 (53.1%) |
| Total | 383 (100.0%) | 32 (100.0%) |
Property Value to Household Income Ratio in Tornillo
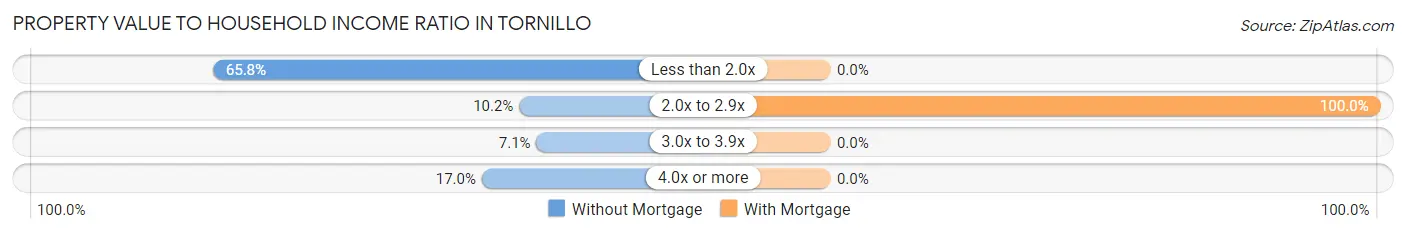
| Value-to-Income Ratio | Without Mortgage | With Mortgage |
| Less than 2.0x | 252 (65.8%) | 0 (0.0%) |
| 2.0x to 2.9x | 39 (10.2%) | 32 (100.0%) |
| 3.0x to 3.9x | 27 (7.0%) | 0 (0.0%) |
| 4.0x or more | 65 (17.0%) | 0 (0.0%) |
| Total | 383 (100.0%) | 32 (100.0%) |
Real Estate Taxes by Mortgage Status in Tornillo
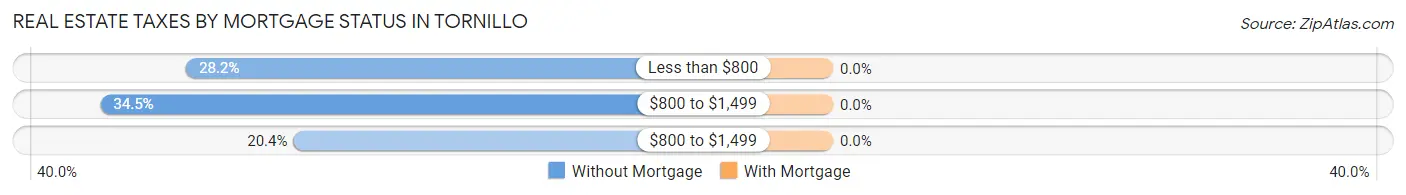
| Property Taxes | Without Mortgage | With Mortgage |
| Less than $800 | 108 (28.2%) | 0 (0.0%) |
| $800 to $1,499 | 132 (34.5%) | 0 (0.0%) |
| $800 to $1,499 | 78 (20.4%) | 0 (0.0%) |
| Total | 383 (100.0%) | 32 (100.0%) |
Health & Disability in Tornillo
Health Insurance Coverage by Age in Tornillo
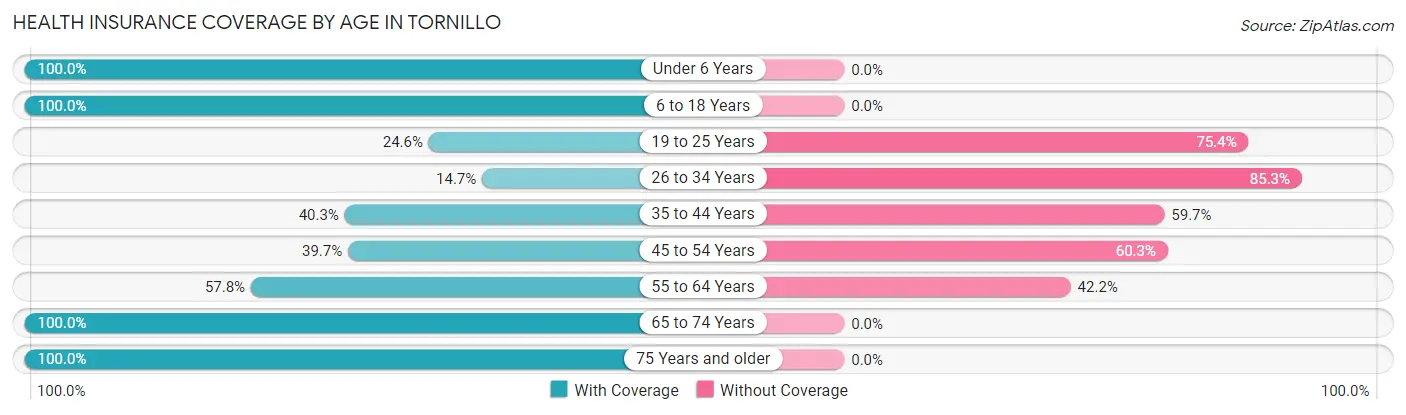
| Age Bracket | With Coverage | Without Coverage |
| Under 6 Years | 19 (100.0%) | 0 (0.0%) |
| 6 to 18 Years | 234 (100.0%) | 0 (0.0%) |
| 19 to 25 Years | 65 (24.6%) | 199 (75.4%) |
| 26 to 34 Years | 32 (14.7%) | 186 (85.3%) |
| 35 to 44 Years | 77 (40.3%) | 114 (59.7%) |
| 45 to 54 Years | 50 (39.7%) | 76 (60.3%) |
| 55 to 64 Years | 89 (57.8%) | 65 (42.2%) |
| 65 to 74 Years | 273 (100.0%) | 0 (0.0%) |
| 75 Years and older | 69 (100.0%) | 0 (0.0%) |
| Total | 908 (58.7%) | 640 (41.3%) |
Health Insurance Coverage by Citizenship Status in Tornillo
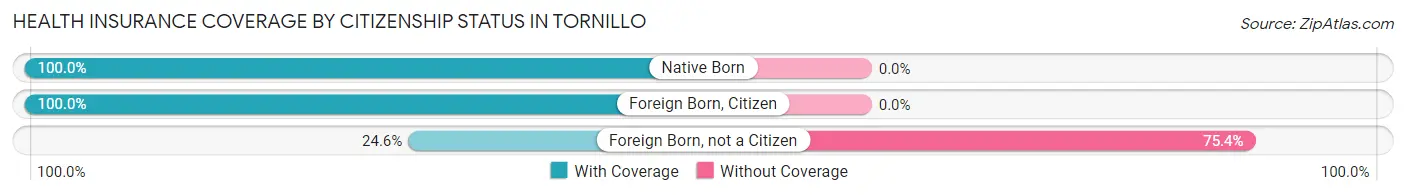
| Citizenship Status | With Coverage | Without Coverage |
| Native Born | 19 (100.0%) | 0 (0.0%) |
| Foreign Born, Citizen | 234 (100.0%) | 0 (0.0%) |
| Foreign Born, not a Citizen | 65 (24.6%) | 199 (75.4%) |
Health Insurance Coverage by Household Income in Tornillo
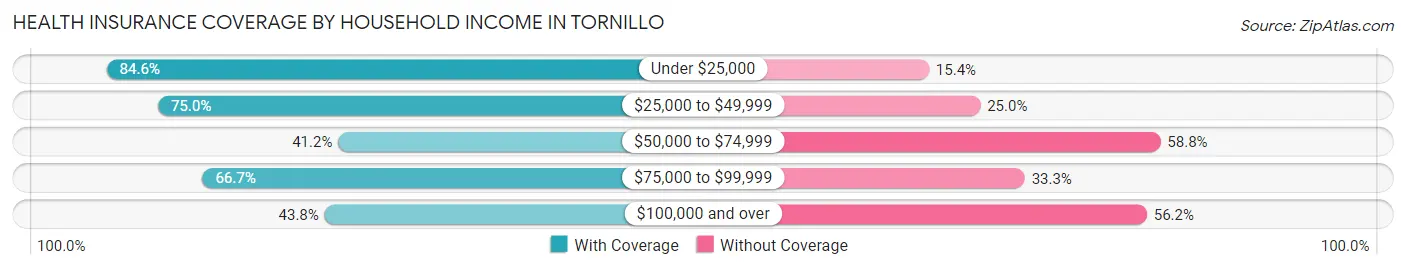
| Household Income | With Coverage | Without Coverage |
| Under $25,000 | 143 (84.6%) | 26 (15.4%) |
| $25,000 to $49,999 | 282 (75.0%) | 94 (25.0%) |
| $50,000 to $74,999 | 113 (41.2%) | 161 (58.8%) |
| $75,000 to $99,999 | 148 (66.7%) | 74 (33.3%) |
| $100,000 and over | 222 (43.8%) | 285 (56.2%) |
Public vs Private Health Insurance Coverage by Age in Tornillo
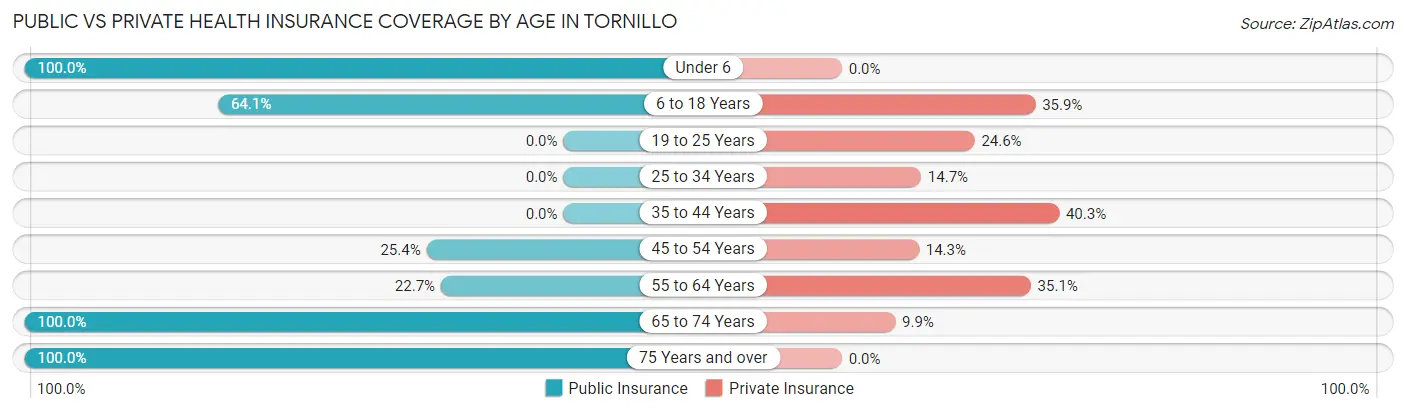
| Age Bracket | Public Insurance | Private Insurance |
| Under 6 | 19 (100.0%) | 0 (0.0%) |
| 6 to 18 Years | 150 (64.1%) | 84 (35.9%) |
| 19 to 25 Years | 0 (0.0%) | 65 (24.6%) |
| 25 to 34 Years | 0 (0.0%) | 32 (14.7%) |
| 35 to 44 Years | 0 (0.0%) | 77 (40.3%) |
| 45 to 54 Years | 32 (25.4%) | 18 (14.3%) |
| 55 to 64 Years | 35 (22.7%) | 54 (35.1%) |
| 65 to 74 Years | 273 (100.0%) | 27 (9.9%) |
| 75 Years and over | 69 (100.0%) | 0 (0.0%) |
| Total | 578 (37.3%) | 357 (23.1%) |
Disability Status by Sex by Age in Tornillo
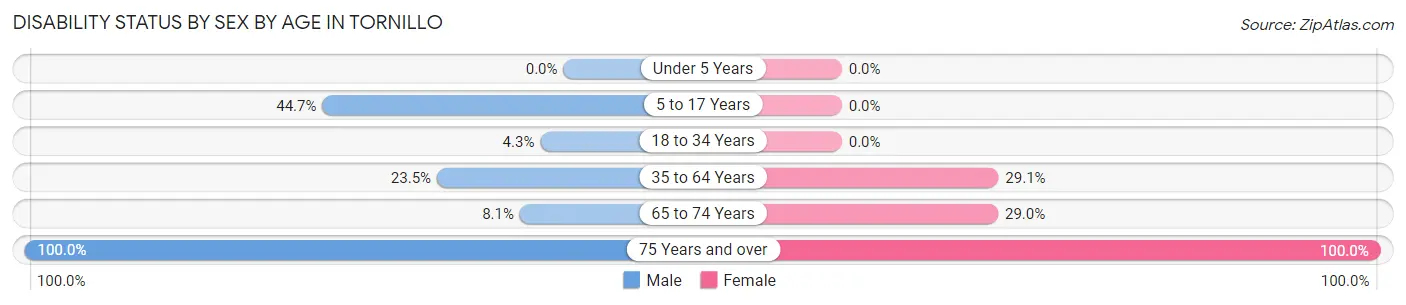
| Age Bracket | Male | Female |
| Under 5 Years | 0 (0.0%) | 0 (0.0%) |
| 5 to 17 Years | 51 (44.7%) | 0 (0.0%) |
| 18 to 34 Years | 14 (4.3%) | 0 (0.0%) |
| 35 to 64 Years | 50 (23.5%) | 75 (29.1%) |
| 65 to 74 Years | 14 (8.1%) | 29 (29.0%) |
| 75 Years and over | 13 (100.0%) | 56 (100.0%) |
Disability Class by Sex by Age in Tornillo
Disability Class: Hearing Difficulty
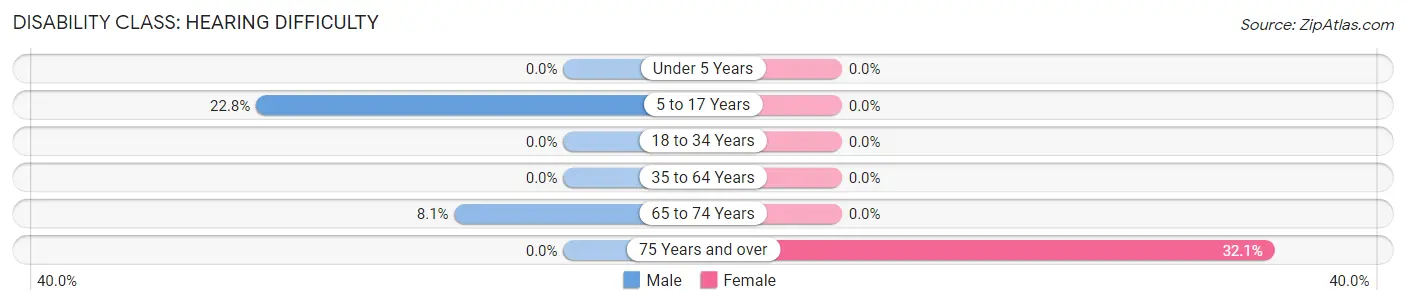
| Age Bracket | Male | Female |
| Under 5 Years | 0 (0.0%) | 0 (0.0%) |
| 5 to 17 Years | 26 (22.8%) | 0 (0.0%) |
| 18 to 34 Years | 0 (0.0%) | 0 (0.0%) |
| 35 to 64 Years | 0 (0.0%) | 0 (0.0%) |
| 65 to 74 Years | 14 (8.1%) | 0 (0.0%) |
| 75 Years and over | 0 (0.0%) | 18 (32.1%) |
Disability Class: Vision Difficulty
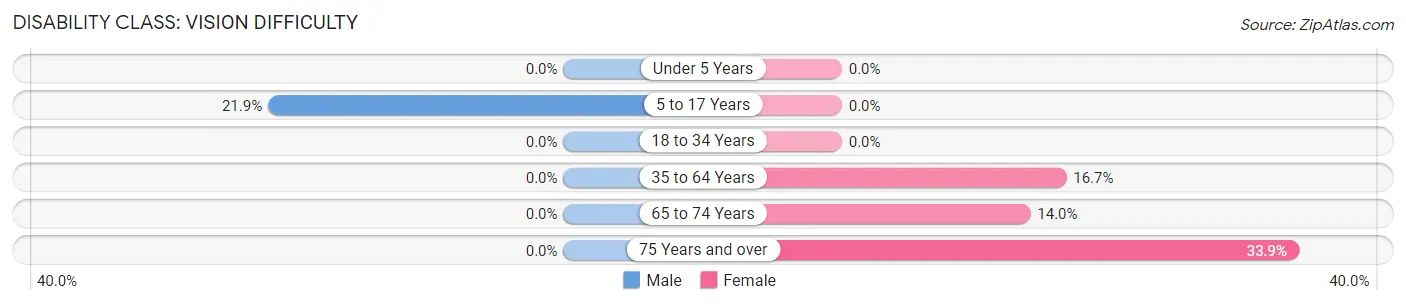
| Age Bracket | Male | Female |
| Under 5 Years | 0 (0.0%) | 0 (0.0%) |
| 5 to 17 Years | 25 (21.9%) | 0 (0.0%) |
| 18 to 34 Years | 0 (0.0%) | 0 (0.0%) |
| 35 to 64 Years | 0 (0.0%) | 43 (16.7%) |
| 65 to 74 Years | 0 (0.0%) | 14 (14.0%) |
| 75 Years and over | 0 (0.0%) | 19 (33.9%) |
Disability Class: Cognitive Difficulty
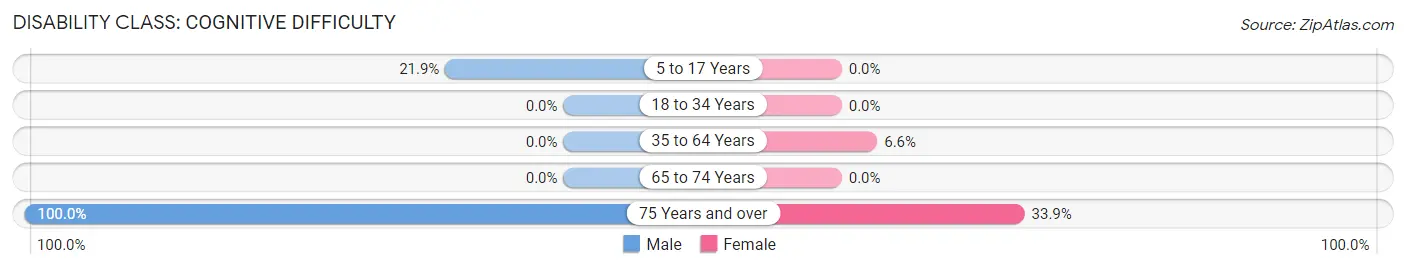
| Age Bracket | Male | Female |
| 5 to 17 Years | 25 (21.9%) | 0 (0.0%) |
| 18 to 34 Years | 0 (0.0%) | 0 (0.0%) |
| 35 to 64 Years | 0 (0.0%) | 17 (6.6%) |
| 65 to 74 Years | 0 (0.0%) | 0 (0.0%) |
| 75 Years and over | 13 (100.0%) | 19 (33.9%) |
Disability Class: Ambulatory Difficulty
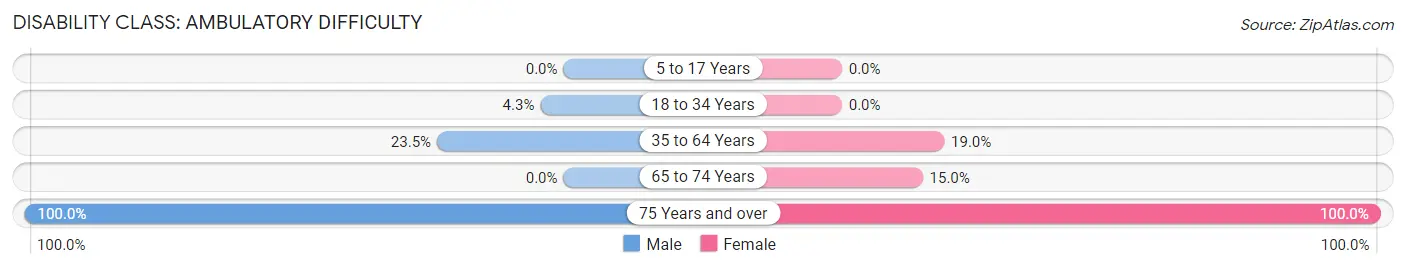
| Age Bracket | Male | Female |
| 5 to 17 Years | 0 (0.0%) | 0 (0.0%) |
| 18 to 34 Years | 14 (4.3%) | 0 (0.0%) |
| 35 to 64 Years | 50 (23.5%) | 49 (19.0%) |
| 65 to 74 Years | 0 (0.0%) | 15 (15.0%) |
| 75 Years and over | 13 (100.0%) | 56 (100.0%) |
Disability Class: Self-Care Difficulty
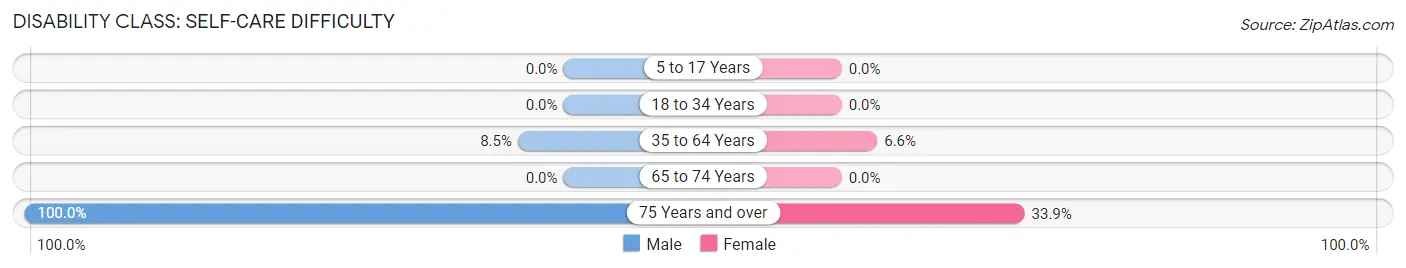
| Age Bracket | Male | Female |
| 5 to 17 Years | 0 (0.0%) | 0 (0.0%) |
| 18 to 34 Years | 0 (0.0%) | 0 (0.0%) |
| 35 to 64 Years | 18 (8.5%) | 17 (6.6%) |
| 65 to 74 Years | 0 (0.0%) | 0 (0.0%) |
| 75 Years and over | 13 (100.0%) | 19 (33.9%) |
Technology Access in Tornillo
Computing Device Access in Tornillo
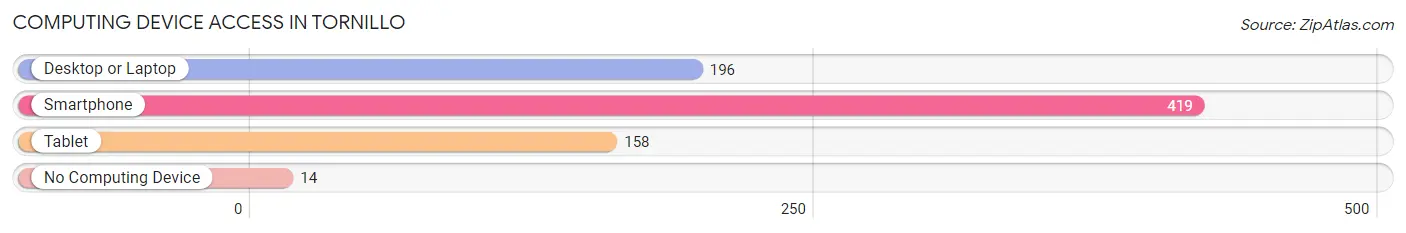
| Device Type | # Households | % Households |
| Desktop or Laptop | 196 | 45.3% |
| Smartphone | 419 | 96.8% |
| Tablet | 158 | 36.5% |
| No Computing Device | 14 | 3.2% |
| Total | 433 | 100.0% |
Internet Access in Tornillo
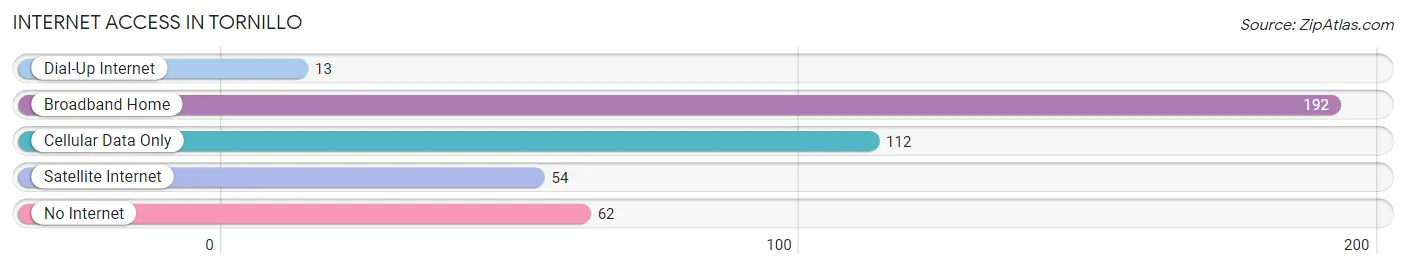
| Internet Type | # Households | % Households |
| Dial-Up Internet | 13 | 3.0% |
| Broadband Home | 192 | 44.3% |
| Cellular Data Only | 112 | 25.9% |
| Satellite Internet | 54 | 12.5% |
| No Internet | 62 | 14.3% |
| Total | 433 | 100.0% |
Tornillo Summary
Tornillo, Texas is a small town located in El Paso County, Texas. It is situated on the banks of the Rio Grande, just south of the city of El Paso. The town was founded in 1881 and has a population of approximately 2,000 people.
History
Tornillo was founded in 1881 by a group of settlers from Mexico. The town was named after the Spanish word for “screw”, as the settlers found a large number of screws in the area. The town was originally a farming community, and the main crops were cotton, corn, and wheat.
In the early 1900s, the town began to grow and develop. The first school was built in 1910, and the first post office was established in 1911. The town also had a general store, a blacksmith shop, and a hotel.
In the 1920s, the town began to experience a population boom. This was due to the construction of the Southern Pacific Railroad, which ran through the town. This allowed for the transportation of goods and people to and from the town.
In the 1940s, the town experienced a decline in population due to the Great Depression. However, the population began to increase again in the 1950s, as the town began to experience an economic boom. This was due to the construction of the Tornillo-Guadalupe Dam, which provided irrigation for the area.
Geography
Tornillo is located in El Paso County, Texas. It is situated on the banks of the Rio Grande, just south of the city of El Paso. The town is located in the Chihuahuan Desert, and the climate is arid and semi-arid. The average temperature in the summer is around 90 degrees Fahrenheit, and the average temperature in the winter is around 50 degrees Fahrenheit.
The town is surrounded by several mountain ranges, including the Franklin Mountains, the Hueco Mountains, and the Sierra de Juarez. The town is also located near the Franklin Mountains State Park, which is a popular destination for hikers and campers.
Economy
The economy of Tornillo is largely based on agriculture. The main crops grown in the area are cotton, corn, and wheat. The town also has a number of small businesses, including restaurants, grocery stores, and auto repair shops.
The town is also home to a number of manufacturing companies, including a furniture factory and a plastics factory. The town is also home to a number of oil and gas companies, which are responsible for the extraction of oil and gas from the area.
Demographics
As of the 2010 census, the population of Tornillo was 2,068. The racial makeup of the town was 79.3% White, 0.3% African American, 0.2% Native American, 0.2% Asian, 0.1% Pacific Islander, 17.7% from other races, and 2.4% from two or more races. Hispanic or Latino of any race were 97.2% of the population.
The median income for a household in the town was $25,625, and the median income for a family was $30,000. The per capita income for the town was $11,845. About 24.2% of families and 28.2% of the population were below the poverty line, including 37.2% of those under age 18 and 15.2% of those age 65 or over.
Tornillo is a small town with a rich history and a diverse population. The town has experienced a number of economic booms and busts over the years, but it remains a vibrant and thriving community. The town is home to a number of businesses, and it is a popular destination for tourists and outdoor enthusiasts.
Common Questions
What is Per Capita Income in Tornillo?
Per Capita income in Tornillo is $20,530.
What is the Median Family Income in Tornillo?
Median Family Income in Tornillo is $55,132.
What is the Median Household income in Tornillo?
Median Household Income in Tornillo is $67,917.
What is Income or Wage Gap in Tornillo?
Income or Wage Gap in Tornillo is 37.6%.
Women in Tornillo earn 62.4 cents for every dollar earned by a man.
What is Inequality or Gini Index in Tornillo?
Inequality or Gini Index in Tornillo is 0.32.
What is the Total Population of Tornillo?
Total Population of Tornillo is 1,548.
What is the Total Male Population of Tornillo?
Total Male Population of Tornillo is 839.
What is the Total Female Population of Tornillo?
Total Female Population of Tornillo is 709.
What is the Ratio of Males per 100 Females in Tornillo?
There are 118.34 Males per 100 Females in Tornillo.
What is the Ratio of Females per 100 Males in Tornillo?
There are 84.51 Females per 100 Males in Tornillo.
What is the Median Population Age in Tornillo?
Median Population Age in Tornillo is 39.8 Years.
What is the Average Family Size in Tornillo
Average Family Size in Tornillo is 3.5 People.
What is the Average Household Size in Tornillo
Average Household Size in Tornillo is 3.6 People.
How Large is the Labor Force in Tornillo?
There are 762 People in the Labor Forcein in Tornillo.
What is the Percentage of People in the Labor Force in Tornillo?
56.1% of People are in the Labor Force in Tornillo.
What is the Unemployment Rate in Tornillo?
Unemployment Rate in Tornillo is 5.1%.