Tenaha, TX Map & Demographics
Tenaha Map
Tenaha Overview
$13,580
PER CAPITA INCOME
$32,800
AVG FAMILY INCOME
$24,702
AVG HOUSEHOLD INCOME
15.7%
WAGE / INCOME GAP [ % ]
84.3¢/ $1
WAGE / INCOME GAP [ $ ]
0.51
INEQUALITY / GINI INDEX
1,091
TOTAL POPULATION
500
MALE POPULATION
591
FEMALE POPULATION
84.60
MALES / 100 FEMALES
118.20
FEMALES / 100 MALES
33.0
MEDIAN AGE
3.8
AVG FAMILY SIZE
3.1
AVG HOUSEHOLD SIZE
341
LABOR FORCE [ PEOPLE ]
45.1%
PERCENT IN LABOR FORCE
Tenaha Zip Codes
Tenaha Area Codes
Income in Tenaha
Income Overview in Tenaha
Per Capita Income in Tenaha is $13,580, while median incomes of families and households are $32,800 and $24,702 respectively.
| Characteristic | Number | Measure |
| Per Capita Income | 1,091 | $13,580 |
| Median Family Income | 228 | $32,800 |
| Mean Family Income | 228 | $43,253 |
| Median Household Income | 357 | $24,702 |
| Mean Household Income | 357 | $37,133 |
| Income Deficit | 228 | $0 |
| Wage / Income Gap (%) | 1,091 | 15.69% |
| Wage / Income Gap ($) | 1,091 | 84.31¢ per $1 |
| Gini / Inequality Index | 1,091 | 0.51 |
Earnings by Sex in Tenaha
Average Earnings in Tenaha are $24,135, $27,500 for men and $23,185 for women, a difference of 15.7%.
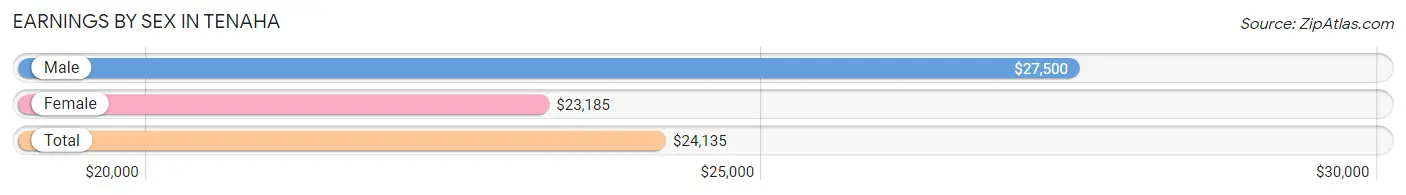
| Sex | Number | Average Earnings |
| Male | 188 (50.7%) | $27,500 |
| Female | 183 (49.3%) | $23,185 |
| Total | 371 (100.0%) | $24,135 |
Earnings by Sex by Income Bracket in Tenaha
The most common earnings brackets in Tenaha are $12,500 to $14,999 for men (52 | 27.7%) and $22,500 to $24,999 for women (31 | 16.9%).
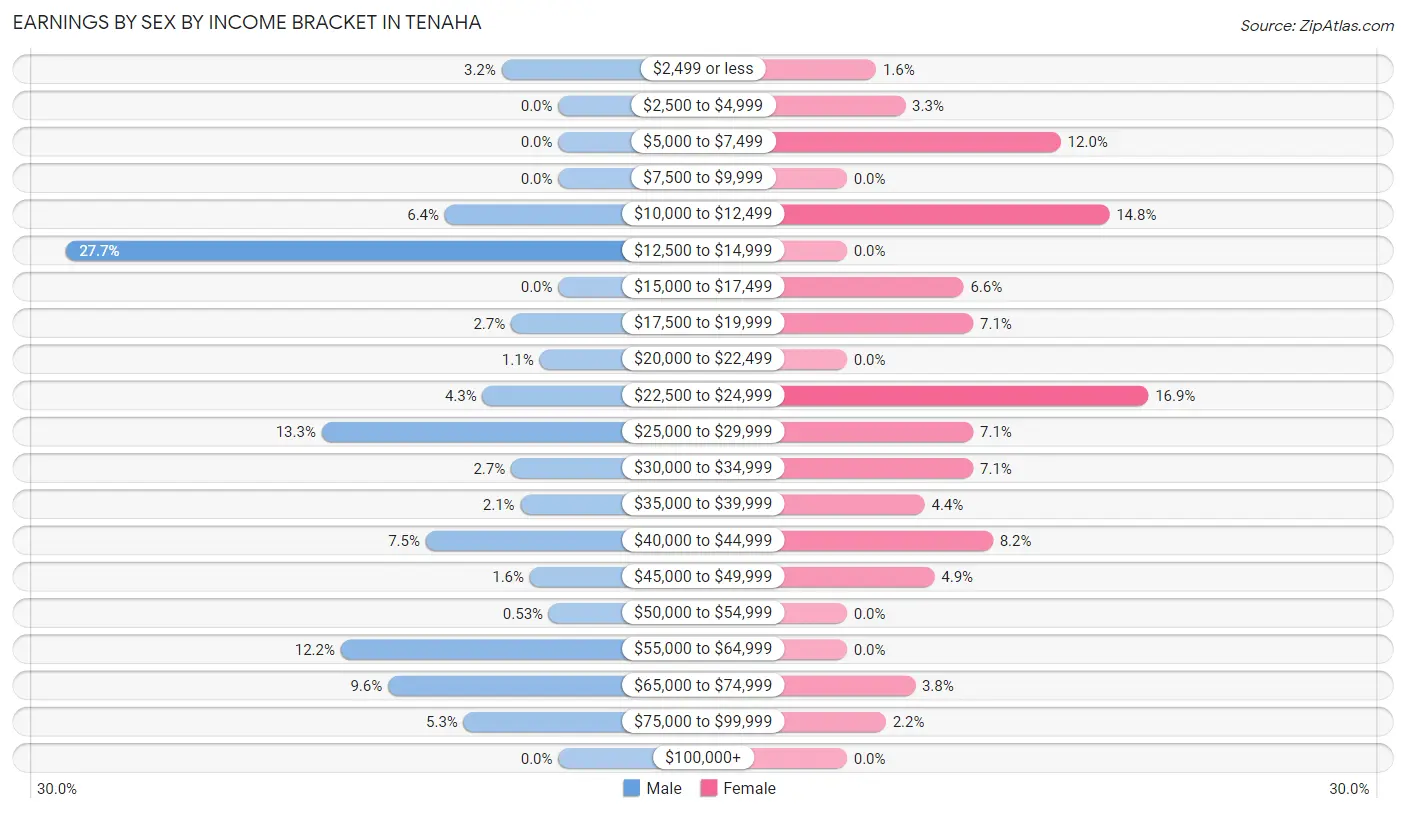
| Income | Male | Female |
| $2,499 or less | 6 (3.2%) | 3 (1.6%) |
| $2,500 to $4,999 | 0 (0.0%) | 6 (3.3%) |
| $5,000 to $7,499 | 0 (0.0%) | 22 (12.0%) |
| $7,500 to $9,999 | 0 (0.0%) | 0 (0.0%) |
| $10,000 to $12,499 | 12 (6.4%) | 27 (14.7%) |
| $12,500 to $14,999 | 52 (27.7%) | 0 (0.0%) |
| $15,000 to $17,499 | 0 (0.0%) | 12 (6.6%) |
| $17,500 to $19,999 | 5 (2.7%) | 13 (7.1%) |
| $20,000 to $22,499 | 2 (1.1%) | 0 (0.0%) |
| $22,500 to $24,999 | 8 (4.3%) | 31 (16.9%) |
| $25,000 to $29,999 | 25 (13.3%) | 13 (7.1%) |
| $30,000 to $34,999 | 5 (2.7%) | 13 (7.1%) |
| $35,000 to $39,999 | 4 (2.1%) | 8 (4.4%) |
| $40,000 to $44,999 | 14 (7.4%) | 15 (8.2%) |
| $45,000 to $49,999 | 3 (1.6%) | 9 (4.9%) |
| $50,000 to $54,999 | 1 (0.5%) | 0 (0.0%) |
| $55,000 to $64,999 | 23 (12.2%) | 0 (0.0%) |
| $65,000 to $74,999 | 18 (9.6%) | 7 (3.8%) |
| $75,000 to $99,999 | 10 (5.3%) | 4 (2.2%) |
| $100,000+ | 0 (0.0%) | 0 (0.0%) |
| Total | 188 (100.0%) | 183 (100.0%) |
Earnings by Sex by Educational Attainment in Tenaha
Average earnings in Tenaha are $28,942 for men and $22,702 for women, a difference of 21.6%. Men with an educational attainment of less than high school enjoy the highest average annual earnings of $40,893, while those with less than high school education earn the least with $40,893. Women with an educational attainment of less than high school earn the most with the average annual earnings of $36,094, while those with high school diploma education have the smallest earnings of $10,156.
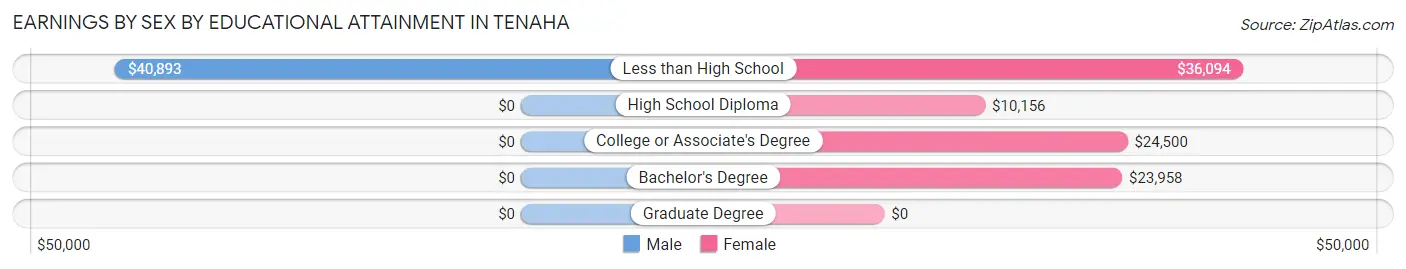
| Educational Attainment | Male Income | Female Income |
| Less than High School | $40,893 | $36,094 |
| High School Diploma | - | - |
| College or Associate's Degree | - | - |
| Bachelor's Degree | - | - |
| Graduate Degree | - | - |
| Total | $28,942 | $22,702 |
Family Income in Tenaha
Family Income Brackets in Tenaha
According to the Tenaha family income data, there are 57 families falling into the $25,000 to $34,999 income range, which is the most common income bracket and makes up 25.0% of all families.
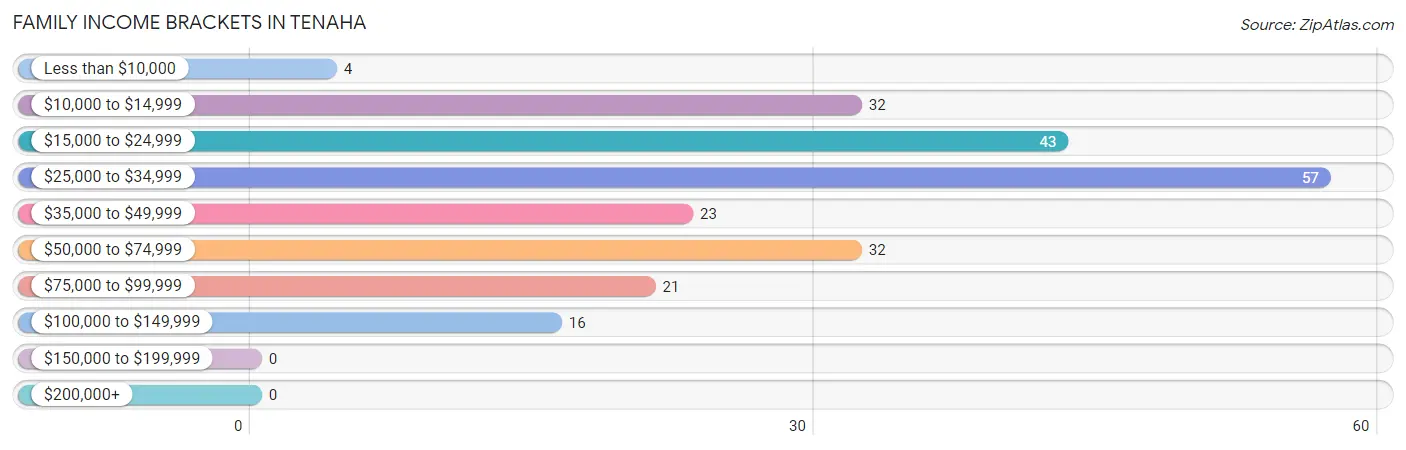
| Income Bracket | # Families | % Families |
| Less than $10,000 | 4 | 1.8% |
| $10,000 to $14,999 | 32 | 14.0% |
| $15,000 to $24,999 | 43 | 18.9% |
| $25,000 to $34,999 | 57 | 25.0% |
| $35,000 to $49,999 | 23 | 10.1% |
| $50,000 to $74,999 | 32 | 14.0% |
| $75,000 to $99,999 | 21 | 9.2% |
| $100,000 to $149,999 | 16 | 7.0% |
| $150,000 to $199,999 | 0 | 0.0% |
| $200,000+ | 0 | 0.0% |
Family Income by Famaliy Size in Tenaha
4-person families (22 | 9.7%) account for the highest median family income in Tenaha with $67,917 per family, while 4-person families (22 | 9.7%) have the highest median income of $16,979 per family member.
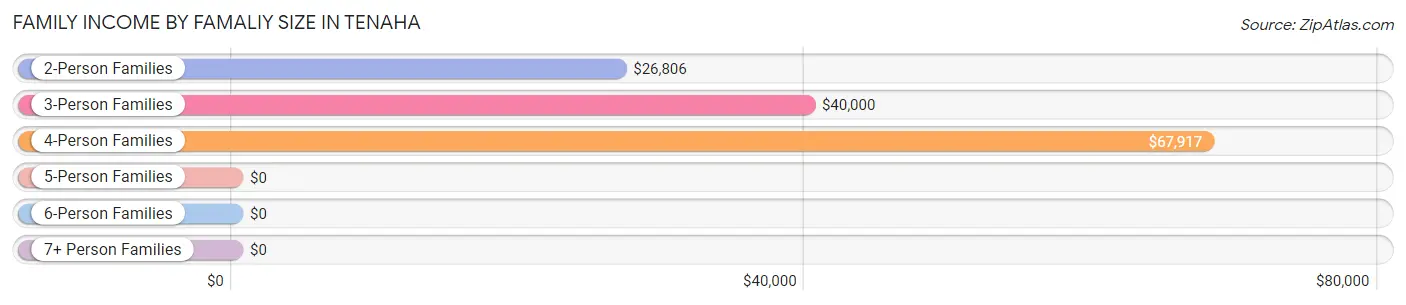
| Income Bracket | # Families | Median Income |
| 2-Person Families | 105 (46.1%) | $26,806 |
| 3-Person Families | 36 (15.8%) | $40,000 |
| 4-Person Families | 22 (9.7%) | $67,917 |
| 5-Person Families | 49 (21.5%) | $0 |
| 6-Person Families | 16 (7.0%) | $0 |
| 7+ Person Families | 0 (0.0%) | $0 |
| Total | 228 (100.0%) | $32,800 |
Family Income by Number of Earners in Tenaha
The median family income in Tenaha is $32,800, with families comprising 3+ earners (13) having the highest median family income of $140,625, while families with no earners (39) have the lowest median family income of $23,250, accounting for 5.7% and 17.1% of families, respectively.
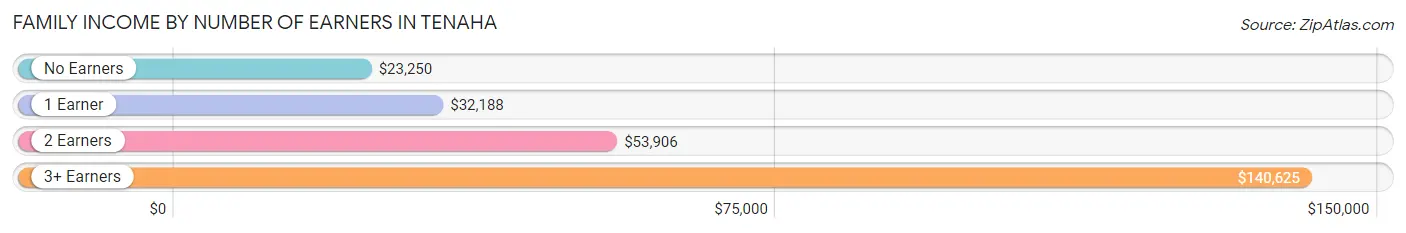
| Number of Earners | # Families | Median Income |
| No Earners | 39 (17.1%) | $23,250 |
| 1 Earner | 135 (59.2%) | $32,188 |
| 2 Earners | 41 (18.0%) | $53,906 |
| 3+ Earners | 13 (5.7%) | $140,625 |
| Total | 228 (100.0%) | $32,800 |
Household Income in Tenaha
Household Income Brackets in Tenaha
With 93 households falling in the category, the $10,000 to $14,999 income range is the most frequent in Tenaha, accounting for 26.1% of all households. In contrast, only 1 households (0.3%) fall into the $200,000+ income bracket, making it the least populous group.
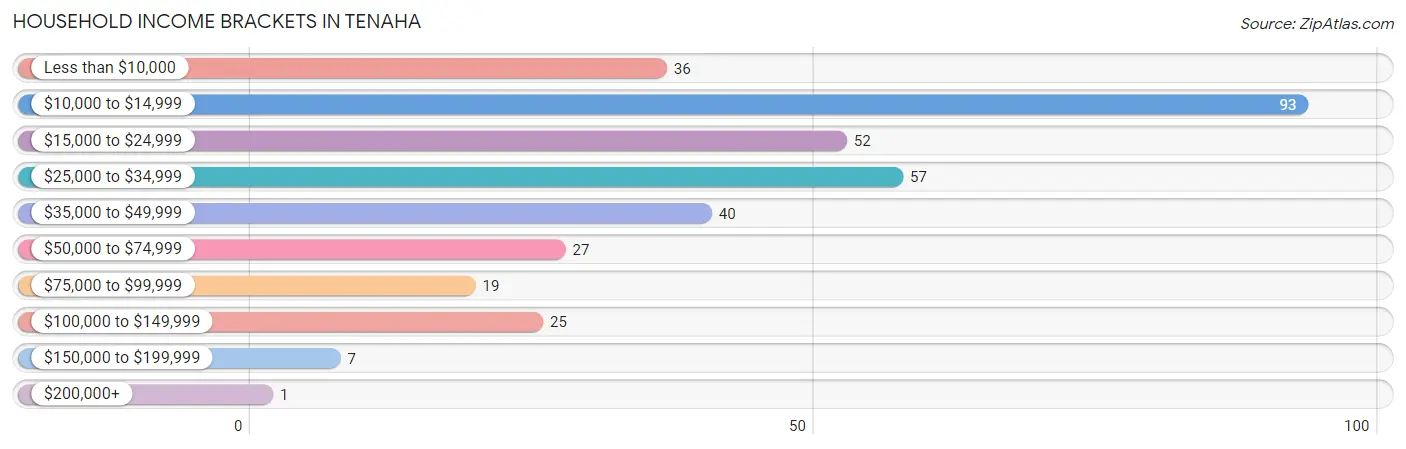
| Income Bracket | # Households | % Households |
| Less than $10,000 | 36 | 10.1% |
| $10,000 to $14,999 | 93 | 26.1% |
| $15,000 to $24,999 | 52 | 14.6% |
| $25,000 to $34,999 | 57 | 16.0% |
| $35,000 to $49,999 | 40 | 11.2% |
| $50,000 to $74,999 | 27 | 7.6% |
| $75,000 to $99,999 | 19 | 5.3% |
| $100,000 to $149,999 | 25 | 7.0% |
| $150,000 to $199,999 | 7 | 2.0% |
| $200,000+ | 1 | 0.3% |
Household Income by Householder Age in Tenaha
The median household income in Tenaha is $24,702, with the highest median household income of $34,250 found in the 25 to 44 years age bracket for the primary householder. A total of 135 households (37.8%) fall into this category. Meanwhile, the 15 to 24 years age bracket for the primary householder has the lowest median household income of $0, with 2 households (0.6%) in this group.
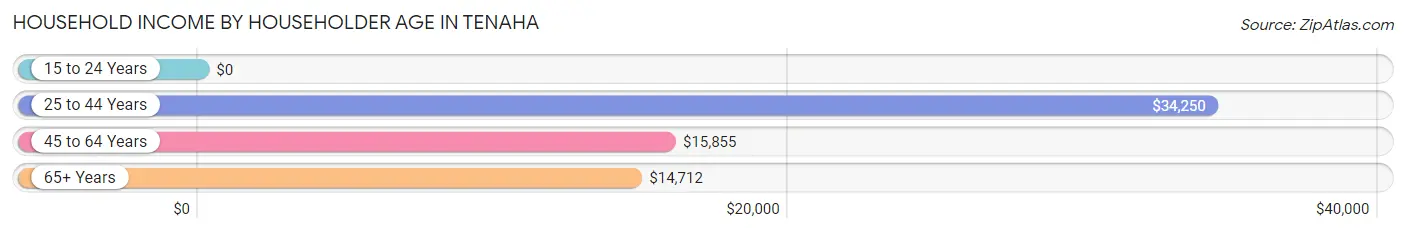
| Income Bracket | # Households | Median Income |
| 15 to 24 Years | 2 (0.6%) | $0 |
| 25 to 44 Years | 135 (37.8%) | $34,250 |
| 45 to 64 Years | 151 (42.3%) | $15,855 |
| 65+ Years | 69 (19.3%) | $14,712 |
| Total | 357 (100.0%) | $24,702 |
Poverty in Tenaha
Income Below Poverty by Sex and Age in Tenaha
With 27.5% poverty level for males and 49.2% for females among the residents of Tenaha, 75 year old and over males and 16 and 17 year old females are the most vulnerable to poverty, with 11 males (68.8%) and 23 females (100.0%) in their respective age groups living below the poverty level.
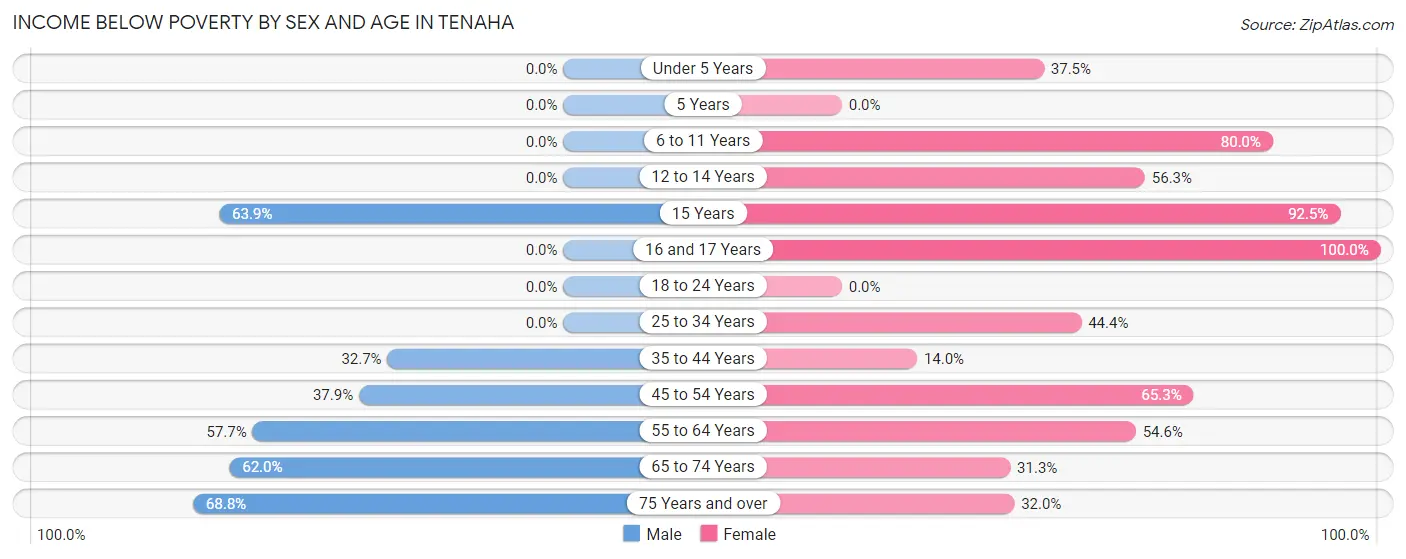
| Age Bracket | Male | Female |
| Under 5 Years | 0 (0.0%) | 6 (37.5%) |
| 5 Years | 0 (0.0%) | 0 (0.0%) |
| 6 to 11 Years | 0 (0.0%) | 12 (80.0%) |
| 12 to 14 Years | 0 (0.0%) | 72 (56.2%) |
| 15 Years | 23 (63.9%) | 37 (92.5%) |
| 16 and 17 Years | 0 (0.0%) | 23 (100.0%) |
| 18 to 24 Years | 0 (0.0%) | 0 (0.0%) |
| 25 to 34 Years | 0 (0.0%) | 28 (44.4%) |
| 35 to 44 Years | 16 (32.7%) | 12 (14.0%) |
| 45 to 54 Years | 22 (37.9%) | 47 (65.3%) |
| 55 to 64 Years | 30 (57.7%) | 36 (54.5%) |
| 65 to 74 Years | 31 (62.0%) | 10 (31.2%) |
| 75 Years and over | 11 (68.8%) | 8 (32.0%) |
| Total | 133 (27.5%) | 291 (49.2%) |
Income Above Poverty by Sex and Age in Tenaha
According to the poverty statistics in Tenaha, males aged under 5 years and females aged 5 years are the age groups that are most secure financially, with 100.0% of males and 100.0% of females in these age groups living above the poverty line.
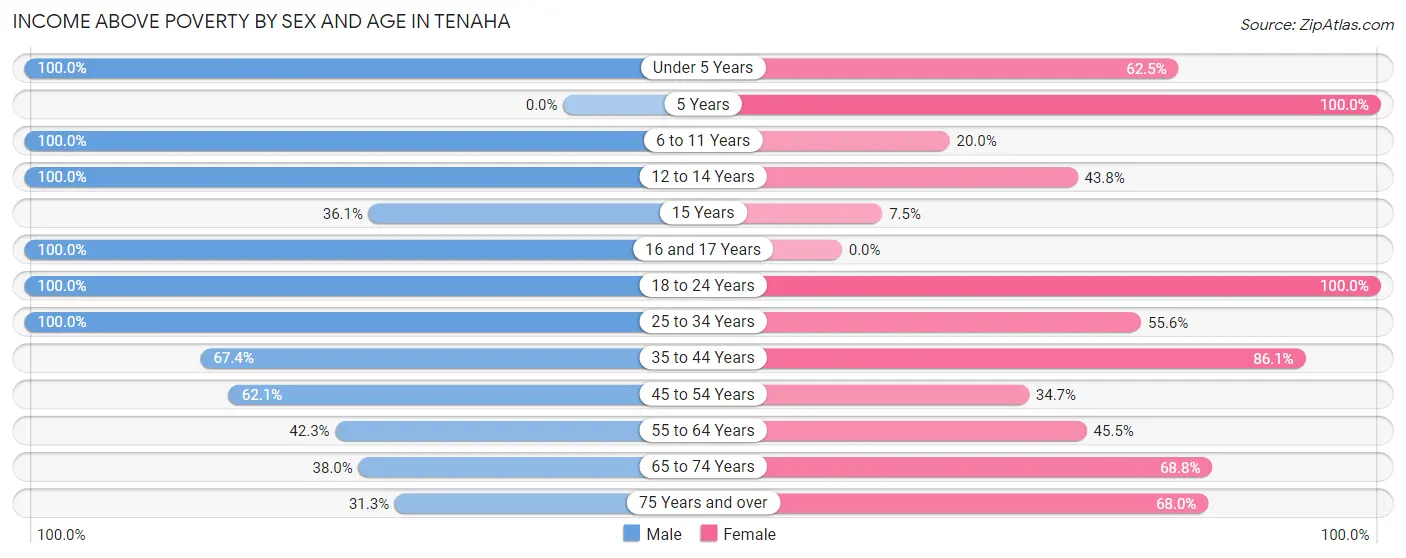
| Age Bracket | Male | Female |
| Under 5 Years | 32 (100.0%) | 10 (62.5%) |
| 5 Years | 0 (0.0%) | 4 (100.0%) |
| 6 to 11 Years | 32 (100.0%) | 3 (20.0%) |
| 12 to 14 Years | 16 (100.0%) | 56 (43.8%) |
| 15 Years | 13 (36.1%) | 3 (7.5%) |
| 16 and 17 Years | 10 (100.0%) | 0 (0.0%) |
| 18 to 24 Years | 66 (100.0%) | 21 (100.0%) |
| 25 to 34 Years | 67 (100.0%) | 35 (55.6%) |
| 35 to 44 Years | 33 (67.3%) | 74 (86.1%) |
| 45 to 54 Years | 36 (62.1%) | 25 (34.7%) |
| 55 to 64 Years | 22 (42.3%) | 30 (45.5%) |
| 65 to 74 Years | 19 (38.0%) | 22 (68.8%) |
| 75 Years and over | 5 (31.2%) | 17 (68.0%) |
| Total | 351 (72.5%) | 300 (50.8%) |
Income Below Poverty Among Married-Couple Families in Tenaha
The poverty statistics for married-couple families in Tenaha show that 38.8% or 40 of the total 103 families live below the poverty line. Families with 3 or 4 children have the highest poverty rate of 51.8%, comprising of 14 families. On the other hand, families with 1 or 2 children have the lowest poverty rate of 15.0%, which includes 3 families.
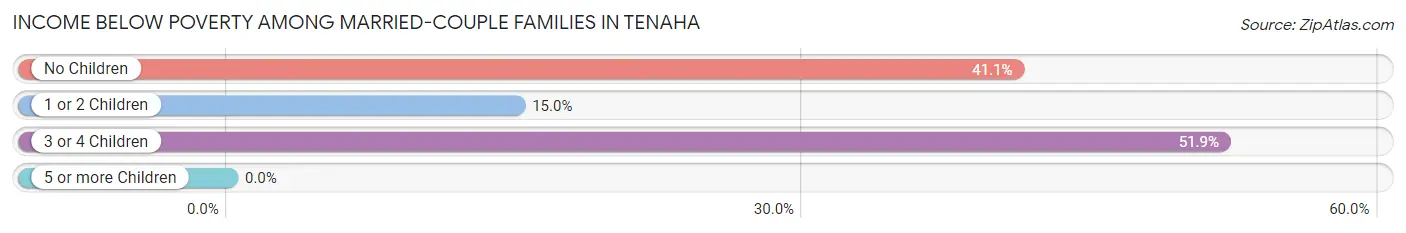
| Children | Above Poverty | Below Poverty |
| No Children | 33 (58.9%) | 23 (41.1%) |
| 1 or 2 Children | 17 (85.0%) | 3 (15.0%) |
| 3 or 4 Children | 13 (48.1%) | 14 (51.8%) |
| 5 or more Children | 0 (0.0%) | 0 (0.0%) |
| Total | 63 (61.2%) | 40 (38.8%) |
Income Below Poverty Among Single-Parent Households in Tenaha
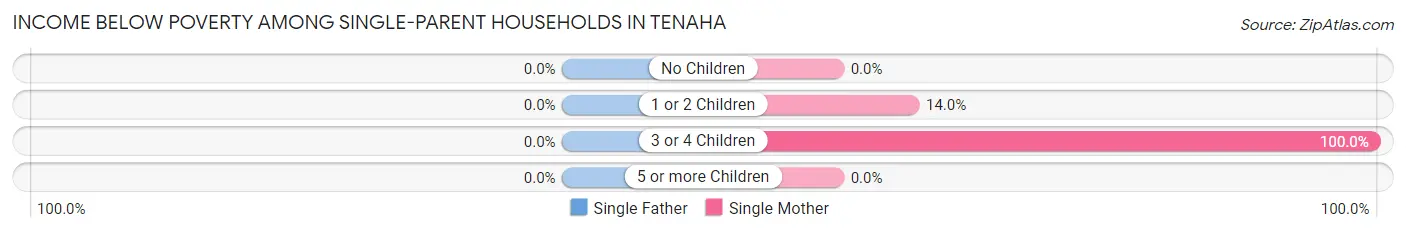
| Children | Single Father | Single Mother |
| No Children | 0 (0.0%) | 0 (0.0%) |
| 1 or 2 Children | 0 (0.0%) | 8 (14.0%) |
| 3 or 4 Children | 0 (0.0%) | 24 (100.0%) |
| 5 or more Children | 0 (0.0%) | 0 (0.0%) |
| Total | 0 (0.0%) | 32 (29.6%) |
Income Below Poverty Among Married-Couple vs Single-Parent Households in Tenaha
The poverty data for Tenaha shows that 40 of the married-couple family households (38.8%) and 32 of the single-parent households (25.6%) are living below the poverty level. Within the married-couple family households, those with 3 or 4 children have the highest poverty rate, with 14 households (51.8%) falling below the poverty line. Among the single-parent households, those with 3 or 4 children have the highest poverty rate, with 24 household (82.8%) living below poverty.
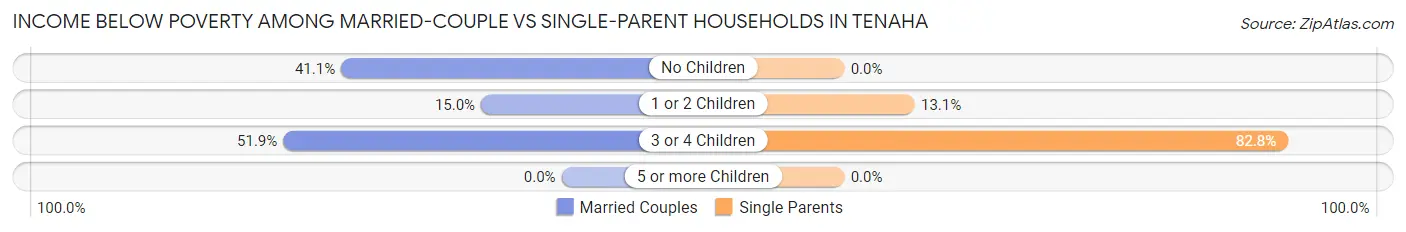
| Children | Married-Couple Families | Single-Parent Households |
| No Children | 23 (41.1%) | 0 (0.0%) |
| 1 or 2 Children | 3 (15.0%) | 8 (13.1%) |
| 3 or 4 Children | 14 (51.8%) | 24 (82.8%) |
| 5 or more Children | 0 (0.0%) | 0 (0.0%) |
| Total | 40 (38.8%) | 32 (25.6%) |
Race in Tenaha
The most populous races in Tenaha are Black / African American (520 | 47.7%), White / Caucasian (386 | 35.4%), and Hispanic or Latino (341 | 31.3%).
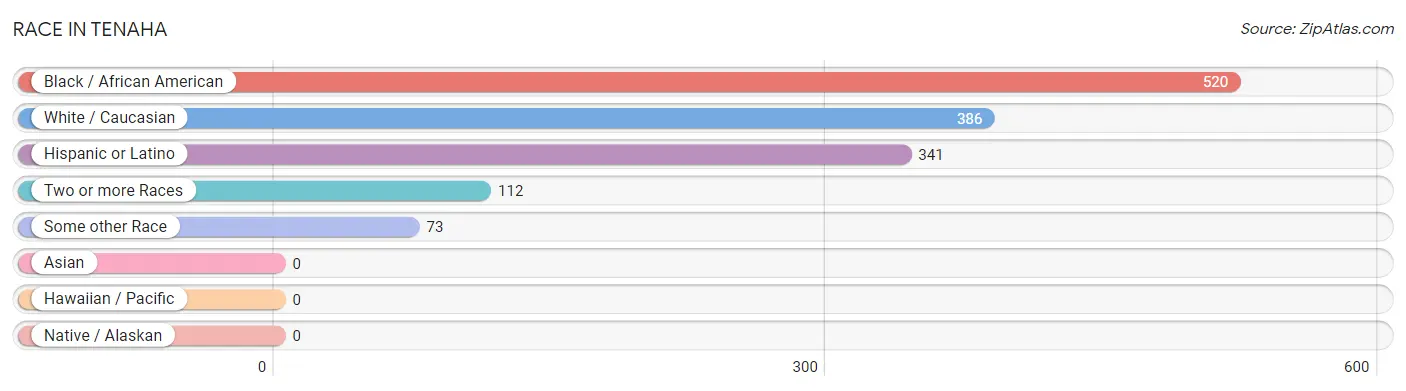
| Race | # Population | % Population |
| Asian | 0 | 0.0% |
| Black / African American | 520 | 47.7% |
| Hawaiian / Pacific | 0 | 0.0% |
| Hispanic or Latino | 341 | 31.3% |
| Native / Alaskan | 0 | 0.0% |
| White / Caucasian | 386 | 35.4% |
| Two or more Races | 112 | 10.3% |
| Some other Race | 73 | 6.7% |
| Total | 1,091 | 100.0% |
Ancestry in Tenaha
The most populous ancestries reported in Tenaha are Mexican (337 | 30.9%), American (63 | 5.8%), Irish (52 | 4.8%), German (36 | 3.3%), and Italian (25 | 2.3%), together accounting for 47.0% of all Tenaha residents.
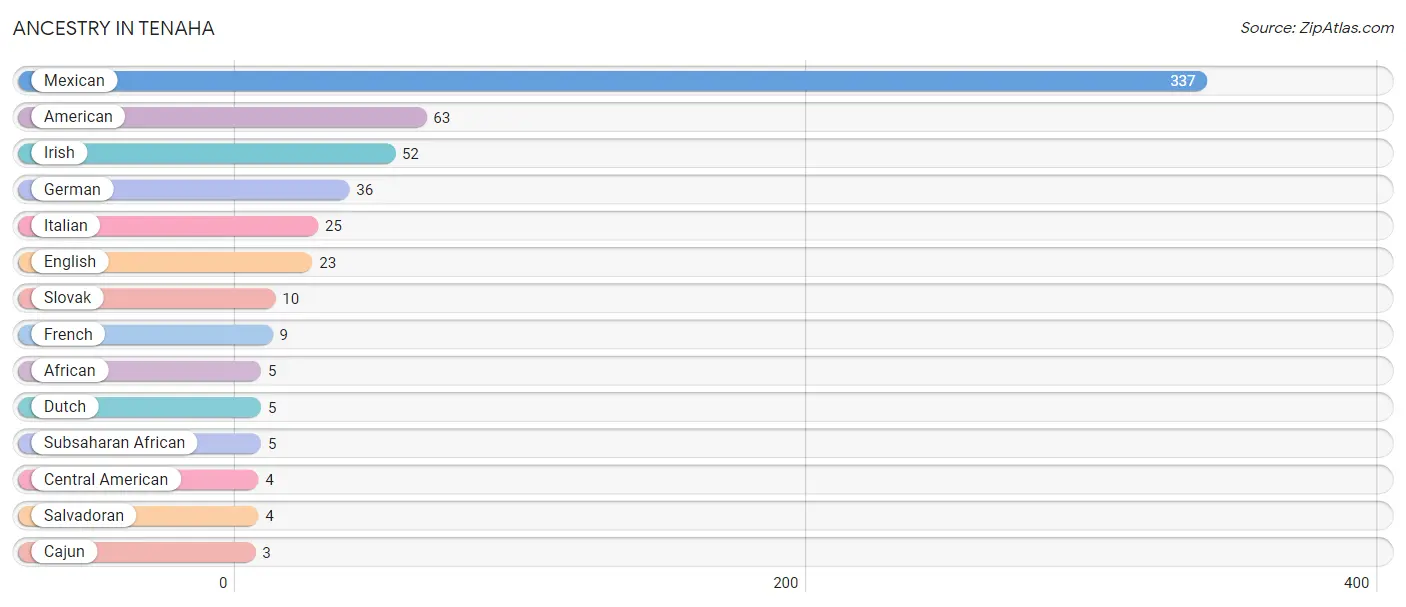
| Ancestry | # Population | % Population |
| African | 5 | 0.5% |
| American | 63 | 5.8% |
| Cajun | 3 | 0.3% |
| Central American | 4 | 0.4% |
| Dutch | 5 | 0.5% |
| English | 23 | 2.1% |
| French | 9 | 0.8% |
| German | 36 | 3.3% |
| Irish | 52 | 4.8% |
| Italian | 25 | 2.3% |
| Mexican | 337 | 30.9% |
| Salvadoran | 4 | 0.4% |
| Slovak | 10 | 0.9% |
| Subsaharan African | 5 | 0.5% | View All 14 Rows |
Immigrants in Tenaha
The most numerous immigrant groups reported in Tenaha came from Central America (155 | 14.2%), Latin America (155 | 14.2%), and Mexico (155 | 14.2%), together accounting for 42.6% of all Tenaha residents.
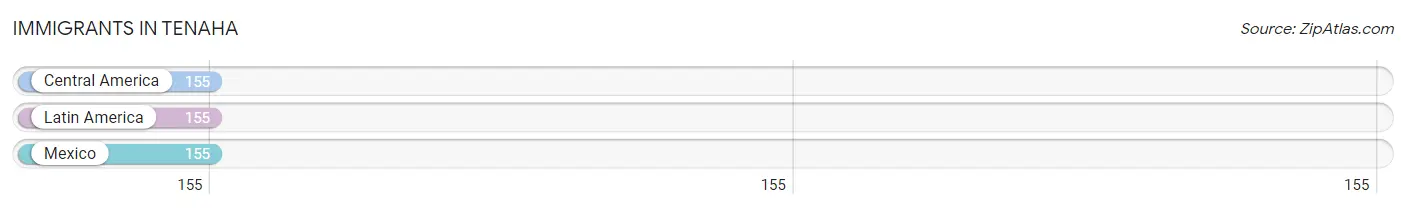
| Immigration Origin | # Population | % Population |
| Central America | 155 | 14.2% |
| Latin America | 155 | 14.2% |
| Mexico | 155 | 14.2% | View All 3 Rows |
Sex and Age in Tenaha
Sex and Age in Tenaha
The most populous age groups in Tenaha are 15 to 19 Years (97 | 19.4%) for men and 10 to 14 Years (140 | 23.7%) for women.
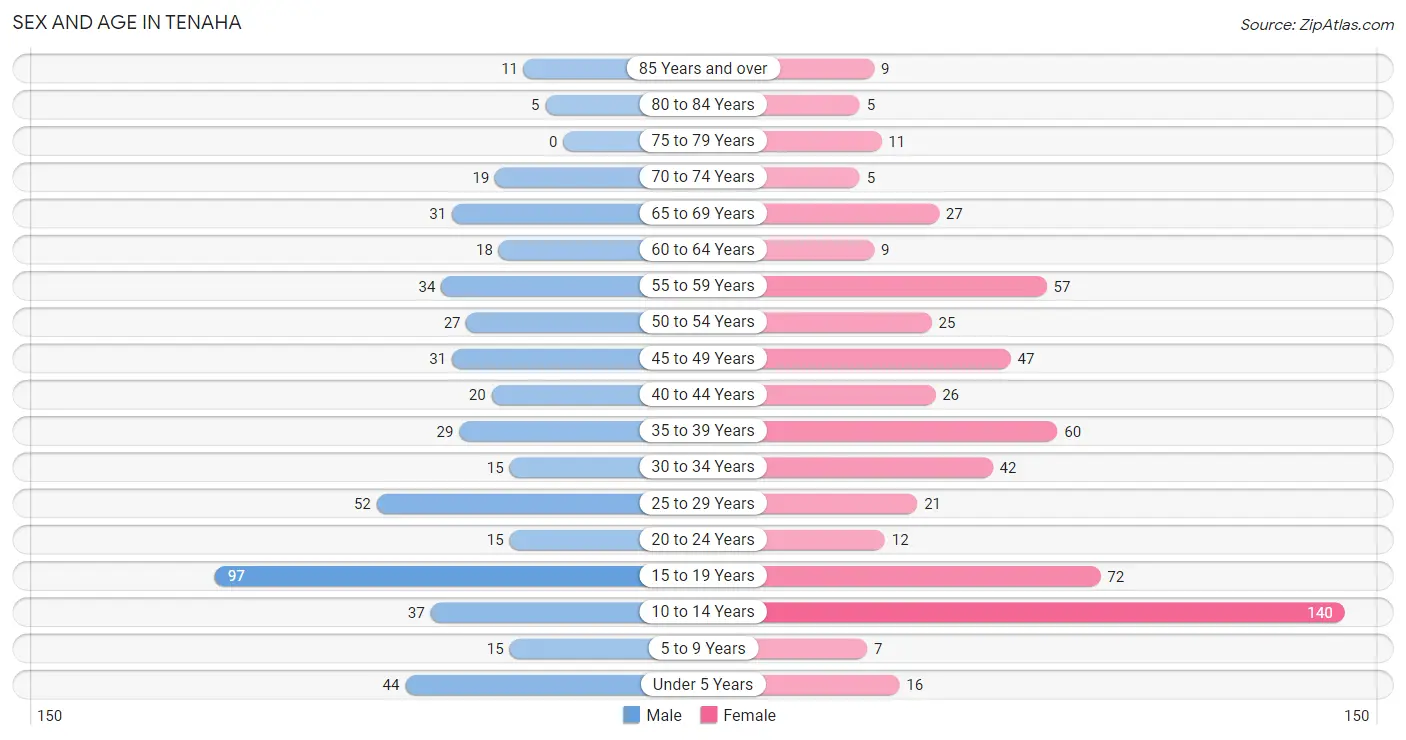
| Age Bracket | Male | Female |
| Under 5 Years | 44 (8.8%) | 16 (2.7%) |
| 5 to 9 Years | 15 (3.0%) | 7 (1.2%) |
| 10 to 14 Years | 37 (7.4%) | 140 (23.7%) |
| 15 to 19 Years | 97 (19.4%) | 72 (12.2%) |
| 20 to 24 Years | 15 (3.0%) | 12 (2.0%) |
| 25 to 29 Years | 52 (10.4%) | 21 (3.5%) |
| 30 to 34 Years | 15 (3.0%) | 42 (7.1%) |
| 35 to 39 Years | 29 (5.8%) | 60 (10.2%) |
| 40 to 44 Years | 20 (4.0%) | 26 (4.4%) |
| 45 to 49 Years | 31 (6.2%) | 47 (8.0%) |
| 50 to 54 Years | 27 (5.4%) | 25 (4.2%) |
| 55 to 59 Years | 34 (6.8%) | 57 (9.6%) |
| 60 to 64 Years | 18 (3.6%) | 9 (1.5%) |
| 65 to 69 Years | 31 (6.2%) | 27 (4.6%) |
| 70 to 74 Years | 19 (3.8%) | 5 (0.9%) |
| 75 to 79 Years | 0 (0.0%) | 11 (1.9%) |
| 80 to 84 Years | 5 (1.0%) | 5 (0.9%) |
| 85 Years and over | 11 (2.2%) | 9 (1.5%) |
| Total | 500 (100.0%) | 591 (100.0%) |
Families and Households in Tenaha
Median Family Size in Tenaha
The median family size in Tenaha is 3.82 persons per family, with single female/mother families (108 | 47.4%) accounting for the largest median family size of 4.05 persons per family. On the other hand, single male/father families (17 | 7.5%) represent the smallest median family size with 3.12 persons per family.
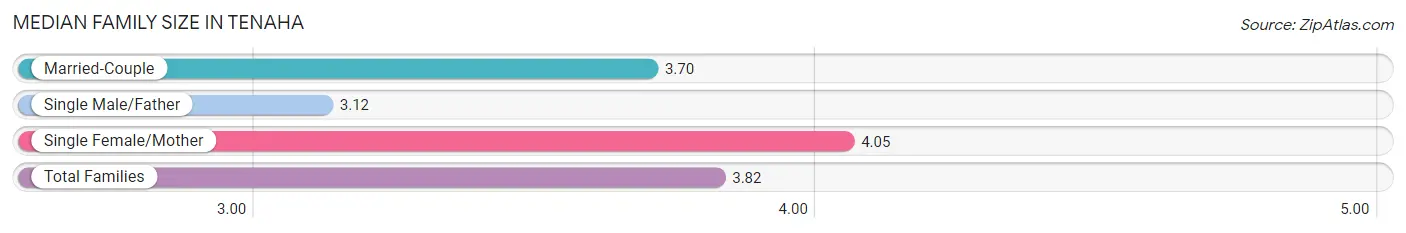
| Family Type | # Families | Family Size |
| Married-Couple | 103 (45.2%) | 3.70 |
| Single Male/Father | 17 (7.5%) | 3.12 |
| Single Female/Mother | 108 (47.4%) | 4.05 |
| Total Families | 228 (100.0%) | 3.82 |
Median Household Size in Tenaha
The median household size in Tenaha is 3.06 persons per household, with single female/mother households (108 | 30.2%) accounting for the largest median household size of 4.33 persons per household. non-family households (129 | 36.1%) represent the smallest median household size with 1.40 persons per household.
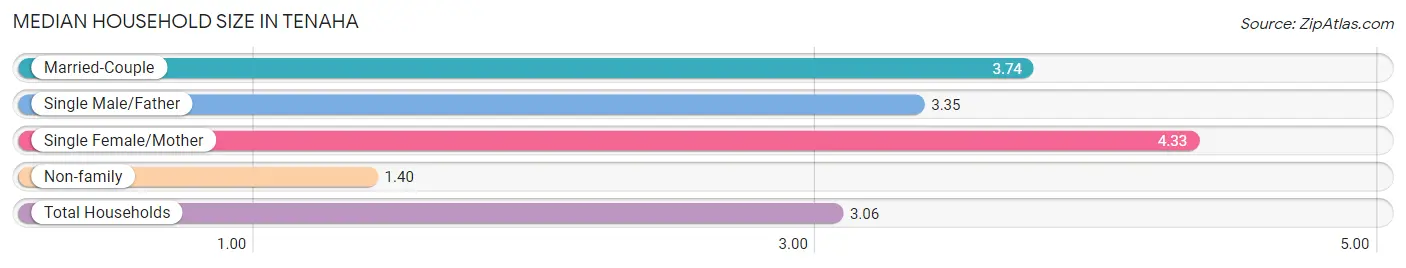
| Household Type | # Households | Household Size |
| Married-Couple | 103 (28.8%) | 3.74 |
| Single Male/Father | 17 (4.8%) | 3.35 |
| Single Female/Mother | 108 (30.2%) | 4.33 |
| Non-family | 129 (36.1%) | 1.40 |
| Total Households | 357 (100.0%) | 3.06 |
Household Size by Marriage Status in Tenaha
Out of a total of 357 households in Tenaha, 228 (63.9%) are family households, while 129 (36.1%) are nonfamily households. The most numerous type of family households are 2-person households, comprising 97, and the most common type of nonfamily households are 1-person households, comprising 77.
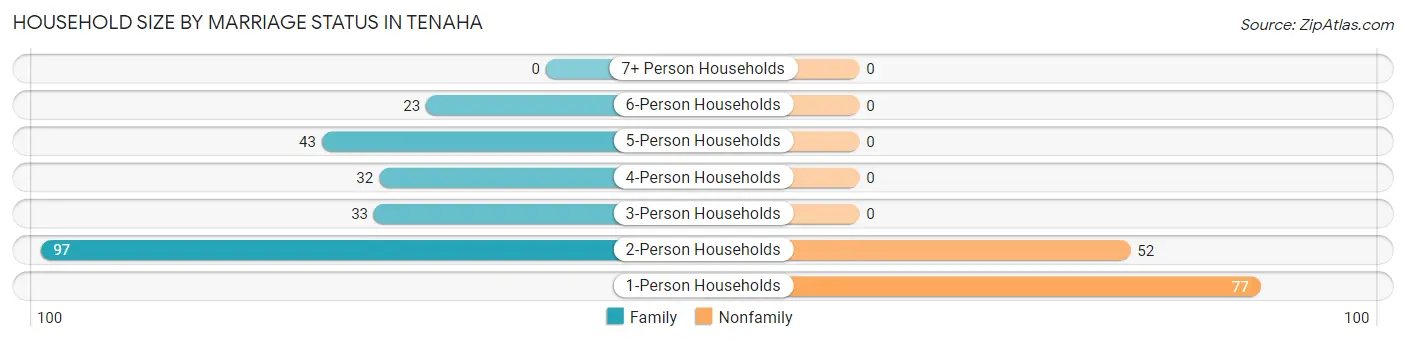
| Household Size | Family Households | Nonfamily Households |
| 1-Person Households | - | 77 (21.6%) |
| 2-Person Households | 97 (27.2%) | 52 (14.6%) |
| 3-Person Households | 33 (9.2%) | 0 (0.0%) |
| 4-Person Households | 32 (9.0%) | 0 (0.0%) |
| 5-Person Households | 43 (12.0%) | 0 (0.0%) |
| 6-Person Households | 23 (6.4%) | 0 (0.0%) |
| 7+ Person Households | 0 (0.0%) | 0 (0.0%) |
| Total | 228 (63.9%) | 129 (36.1%) |
Female Fertility in Tenaha
Fertility by Age in Tenaha
Average fertility rate in Tenaha is 21.0 births per 1,000 women. Women in the age bracket of 35 to 50 years have the highest fertility rate with 45.0 births per 1,000 women. Women in the age bracket of 35 to 50 years acount for 100.0% of all women with births.
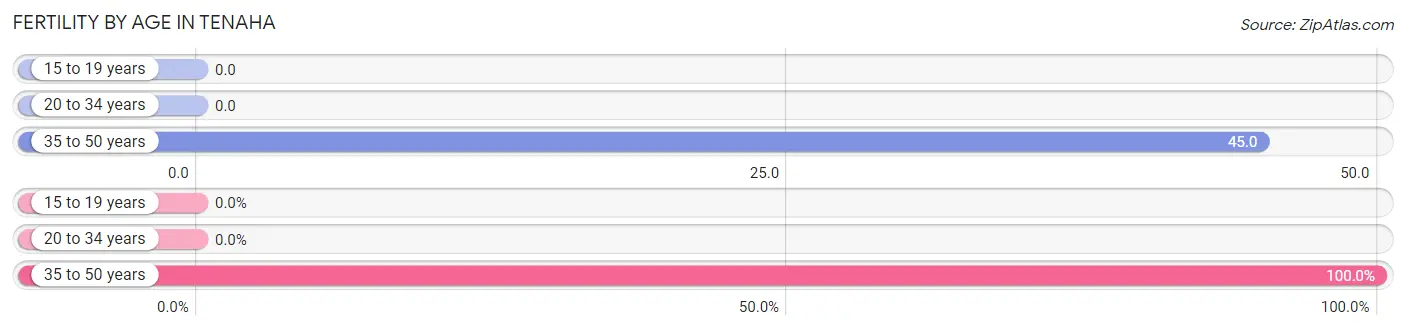
| Age Bracket | Women with Births | Births / 1,000 Women |
| 15 to 19 years | 0 (0.0%) | 0.0 |
| 20 to 34 years | 0 (0.0%) | 0.0 |
| 35 to 50 years | 6 (100.0%) | 45.0 |
| Total | 6 (100.0%) | 21.0 |
Fertility by Age by Marriage Status in Tenaha
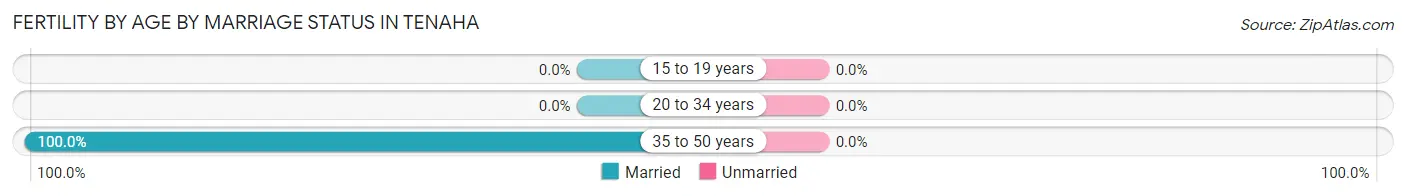
| Age Bracket | Married | Unmarried |
| 15 to 19 years | 0 (0.0%) | 0 (0.0%) |
| 20 to 34 years | 0 (0.0%) | 0 (0.0%) |
| 35 to 50 years | 6 (100.0%) | 0 (0.0%) |
| Total | 6 (100.0%) | 0 (0.0%) |
Fertility by Education in Tenaha
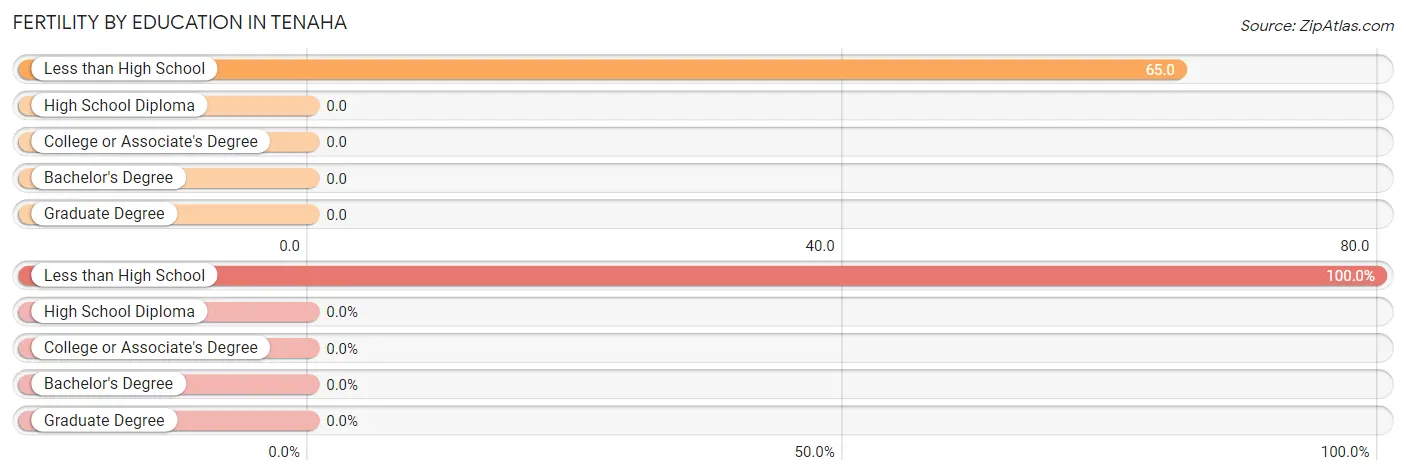
| Educational Attainment | Women with Births | Births / 1,000 Women |
| Less than High School | 6 (100.0%) | 65.0 |
| High School Diploma | 0 (0.0%) | 0.0 |
| College or Associate's Degree | 0 (0.0%) | 0.0 |
| Bachelor's Degree | 0 (0.0%) | 0.0 |
| Graduate Degree | 0 (0.0%) | 0.0 |
| Total | 6 (100.0%) | 21.0 |
Fertility by Education by Marriage Status in Tenaha
| Educational Attainment | Married | Unmarried |
| Less than High School | 6 (100.0%) | 0 (0.0%) |
| High School Diploma | 0 (0.0%) | 0 (0.0%) |
| College or Associate's Degree | 0 (0.0%) | 0 (0.0%) |
| Bachelor's Degree | 0 (0.0%) | 0 (0.0%) |
| Graduate Degree | 0 (0.0%) | 0 (0.0%) |
| Total | 6 (100.0%) | 0 (0.0%) |
Employment Characteristics in Tenaha
Employment by Class of Employer in Tenaha
Among the 341 employed individuals in Tenaha, private company employees (256 | 75.1%), not-for-profit organizations (24 | 7.0%), and state government employees (18 | 5.3%) make up the most common classes of employment.
| Employer Class | # Employees | % Employees |
| Private Company Employees | 256 | 75.1% |
| Self-Employed (Incorporated) | 7 | 2.1% |
| Self-Employed (Not Incorporated) | 13 | 3.8% |
| Not-for-profit Organizations | 24 | 7.0% |
| Local Government Employees | 17 | 5.0% |
| State Government Employees | 18 | 5.3% |
| Federal Government Employees | 0 | 0.0% |
| Unpaid Family Workers | 6 | 1.8% |
| Total | 341 | 100.0% |
Employment Status by Age in Tenaha
| Age Bracket | In Labor Force | Unemployed |
| 16 to 19 Years | 6 (6.5%) | 0 (0.0%) |
| 20 to 24 Years | 27 (100.0%) | 0 (0.0%) |
| 25 to 29 Years | 50 (68.5%) | 0 (0.0%) |
| 30 to 34 Years | 50 (87.7%) | 0 (0.0%) |
| 35 to 44 Years | 110 (81.5%) | 0 (0.0%) |
| 45 to 54 Years | 39 (30.0%) | 0 (0.0%) |
| 55 to 59 Years | 34 (37.4%) | 0 (0.0%) |
| 60 to 64 Years | 11 (40.7%) | 0 (0.0%) |
| 65 to 74 Years | 11 (13.4%) | 0 (0.0%) |
| 75 Years and over | 3 (7.3%) | 0 (0.0%) |
| Total | 341 (45.1%) | 0 (0.0%) |
Employment Status by Educational Attainment in Tenaha
| Educational Attainment | In Labor Force | Unemployed |
| Less than High School | 63 (42.3%) | 0 (0.0%) |
| High School Diploma | 115 (52.8%) | 0 (0.0%) |
| College / Associate Degree | 109 (78.4%) | 0 (0.0%) |
| Bachelor's Degree or higher | 7 (100.0%) | 0 (0.0%) |
| Total | 294 (57.3%) | 0 (0.0%) |
Employment Occupations by Sex in Tenaha
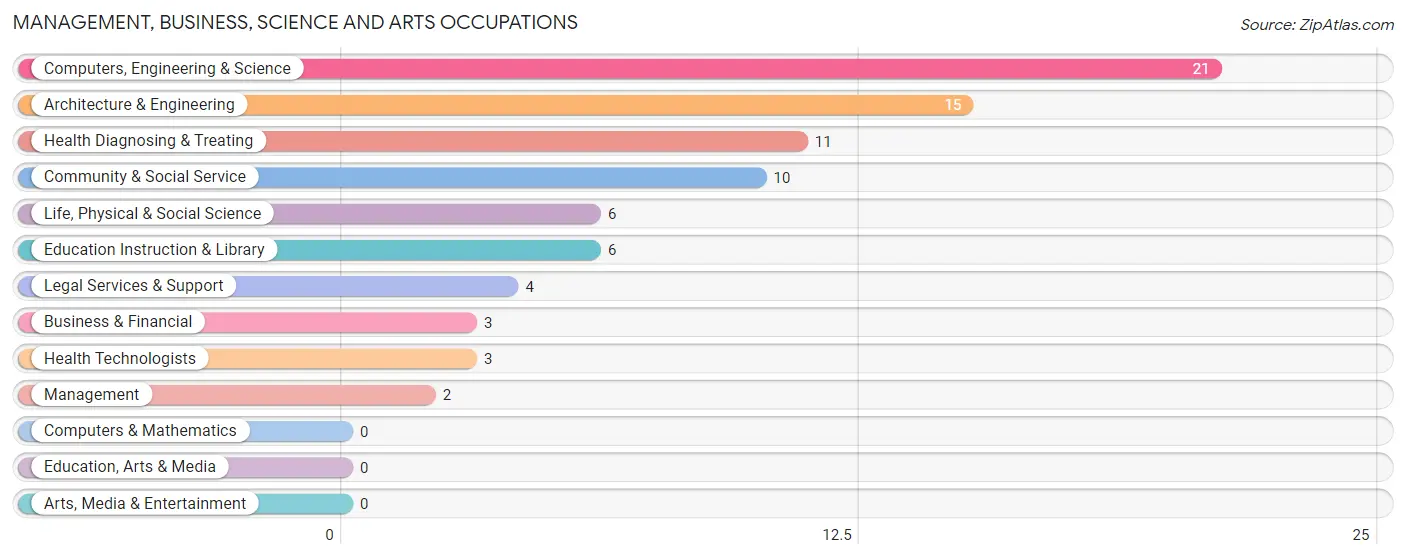
Management, Business, Science and Arts Occupations
The most common Management, Business, Science and Arts occupations in Tenaha are Computers, Engineering & Science (21 | 6.2%), Architecture & Engineering (15 | 4.4%), Health Diagnosing & Treating (11 | 3.2%), Community & Social Service (10 | 2.9%), and Life, Physical & Social Science (6 | 1.8%).
Management, Business, Science and Arts Occupations by Sex
Within the Management, Business, Science and Arts occupations in Tenaha, the most male-oriented occupations are Education Instruction & Library (83.3%), Community & Social Service (50.0%), and Health Diagnosing & Treating (36.4%), while the most female-oriented occupations are Management (100.0%), Business & Financial (100.0%), and Computers, Engineering & Science (100.0%).
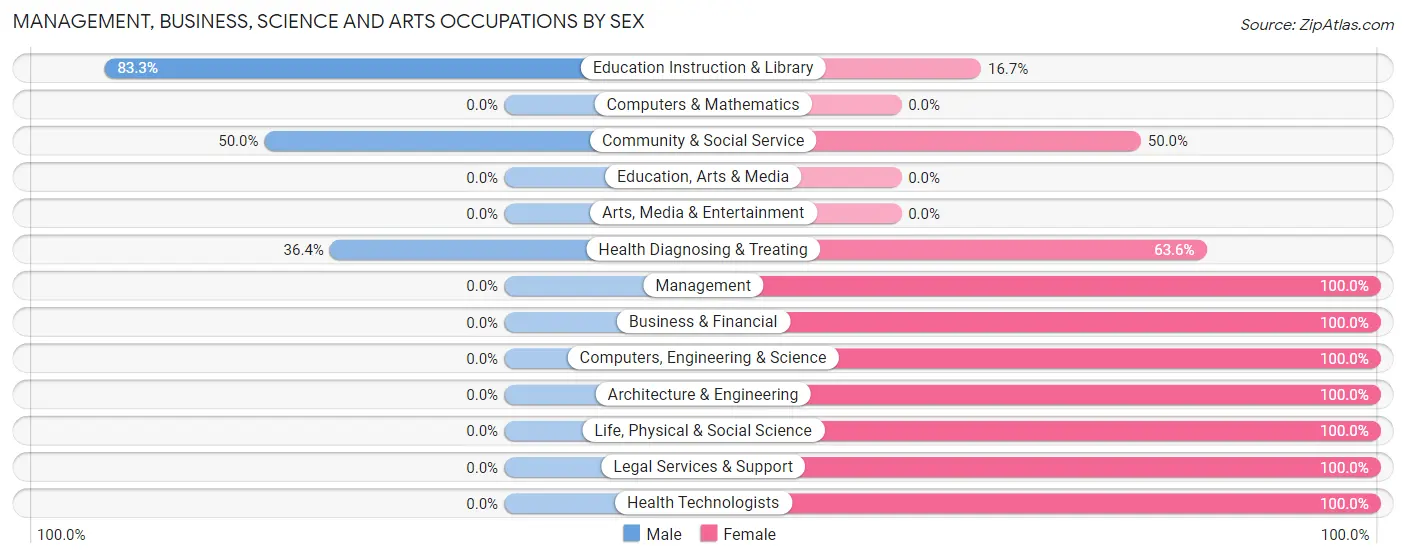
| Occupation | Male | Female |
| Management | 0 (0.0%) | 2 (100.0%) |
| Business & Financial | 0 (0.0%) | 3 (100.0%) |
| Computers, Engineering & Science | 0 (0.0%) | 21 (100.0%) |
| Computers & Mathematics | 0 (0.0%) | 0 (0.0%) |
| Architecture & Engineering | 0 (0.0%) | 15 (100.0%) |
| Life, Physical & Social Science | 0 (0.0%) | 6 (100.0%) |
| Community & Social Service | 5 (50.0%) | 5 (50.0%) |
| Education, Arts & Media | 0 (0.0%) | 0 (0.0%) |
| Legal Services & Support | 0 (0.0%) | 4 (100.0%) |
| Education Instruction & Library | 5 (83.3%) | 1 (16.7%) |
| Arts, Media & Entertainment | 0 (0.0%) | 0 (0.0%) |
| Health Diagnosing & Treating | 4 (36.4%) | 7 (63.6%) |
| Health Technologists | 0 (0.0%) | 3 (100.0%) |
| Total (Category) | 9 (19.2%) | 38 (80.8%) |
| Total (Overall) | 194 (56.9%) | 147 (43.1%) |
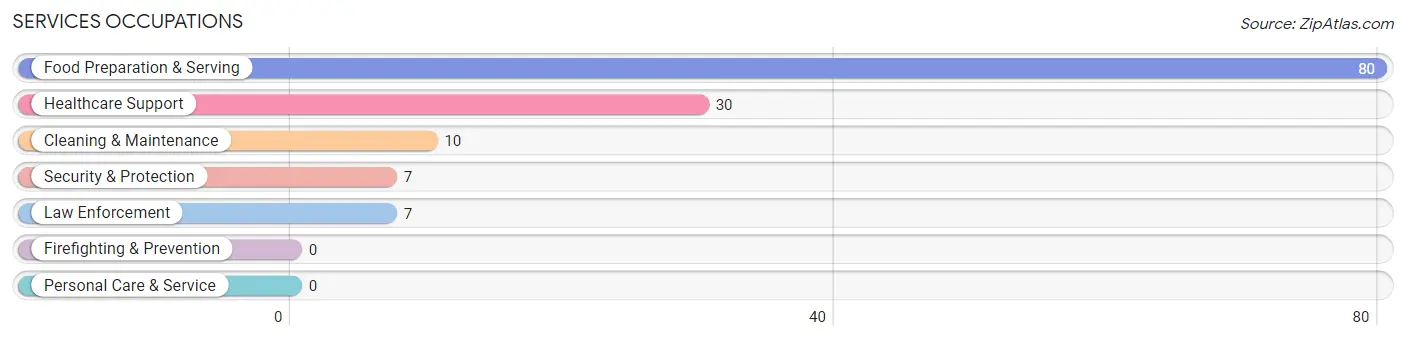
Services Occupations
The most common Services occupations in Tenaha are Food Preparation & Serving (80 | 23.5%), Healthcare Support (30 | 8.8%), Cleaning & Maintenance (10 | 2.9%), Security & Protection (7 | 2.1%), and Law Enforcement (7 | 2.1%).
Services Occupations by Sex
Within the Services occupations in Tenaha, the most male-oriented occupations are Cleaning & Maintenance (100.0%), and Food Preparation & Serving (68.8%), while the most female-oriented occupations are Healthcare Support (100.0%), Security & Protection (100.0%), and Law Enforcement (100.0%).
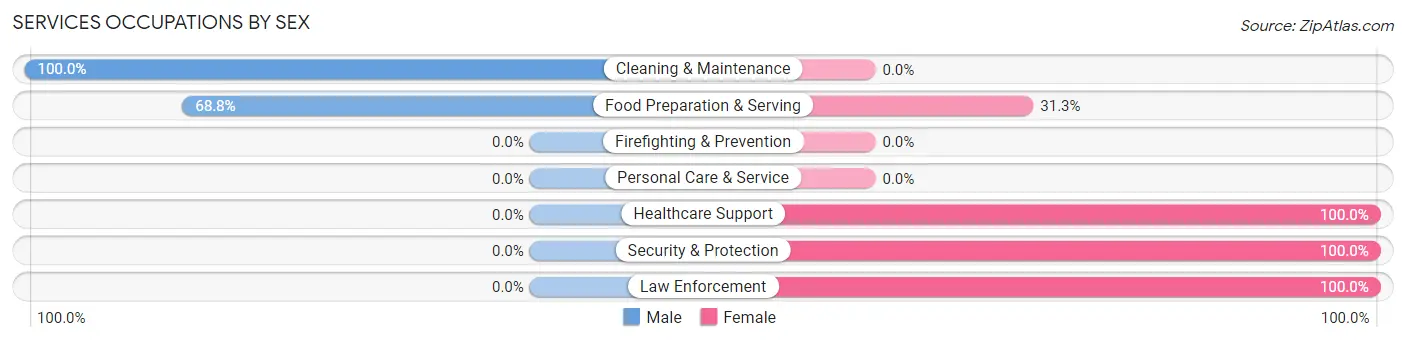
| Occupation | Male | Female |
| Healthcare Support | 0 (0.0%) | 30 (100.0%) |
| Security & Protection | 0 (0.0%) | 7 (100.0%) |
| Firefighting & Prevention | 0 (0.0%) | 0 (0.0%) |
| Law Enforcement | 0 (0.0%) | 7 (100.0%) |
| Food Preparation & Serving | 55 (68.8%) | 25 (31.2%) |
| Cleaning & Maintenance | 10 (100.0%) | 0 (0.0%) |
| Personal Care & Service | 0 (0.0%) | 0 (0.0%) |
| Total (Category) | 65 (51.2%) | 62 (48.8%) |
| Total (Overall) | 194 (56.9%) | 147 (43.1%) |
Sales and Office Occupations
The most common Sales and Office occupations in Tenaha are Office & Administration (25 | 7.3%), and Sales & Related (20 | 5.9%).
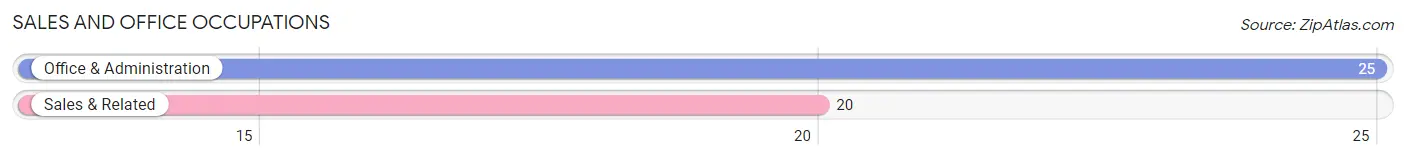
Sales and Office Occupations by Sex

| Occupation | Male | Female |
| Sales & Related | 10 (50.0%) | 10 (50.0%) |
| Office & Administration | 0 (0.0%) | 25 (100.0%) |
| Total (Category) | 10 (22.2%) | 35 (77.8%) |
| Total (Overall) | 194 (56.9%) | 147 (43.1%) |
Natural Resources, Construction and Maintenance Occupations
The most common Natural Resources, Construction and Maintenance occupations in Tenaha are Construction & Extraction (28 | 8.2%), Farming, Fishing & Forestry (22 | 6.5%), and Installation, Maintenance & Repair (14 | 4.1%).
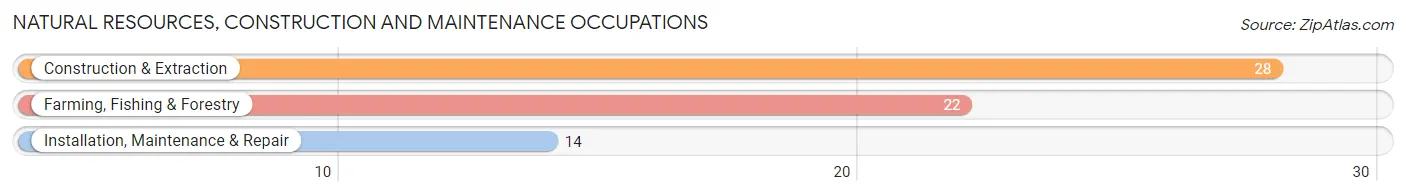
Natural Resources, Construction and Maintenance Occupations by Sex
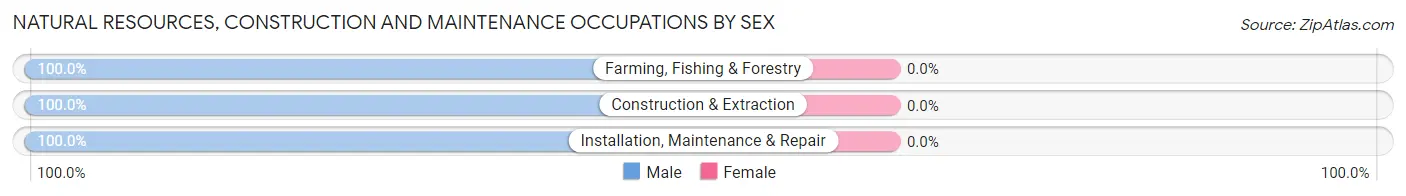
| Occupation | Male | Female |
| Farming, Fishing & Forestry | 22 (100.0%) | 0 (0.0%) |
| Construction & Extraction | 28 (100.0%) | 0 (0.0%) |
| Installation, Maintenance & Repair | 14 (100.0%) | 0 (0.0%) |
| Total (Category) | 64 (100.0%) | 0 (0.0%) |
| Total (Overall) | 194 (56.9%) | 147 (43.1%) |
Production, Transportation and Moving Occupations
The most common Production, Transportation and Moving occupations in Tenaha are Transportation (32 | 9.4%), Material Moving (19 | 5.6%), and Production (7 | 2.1%).
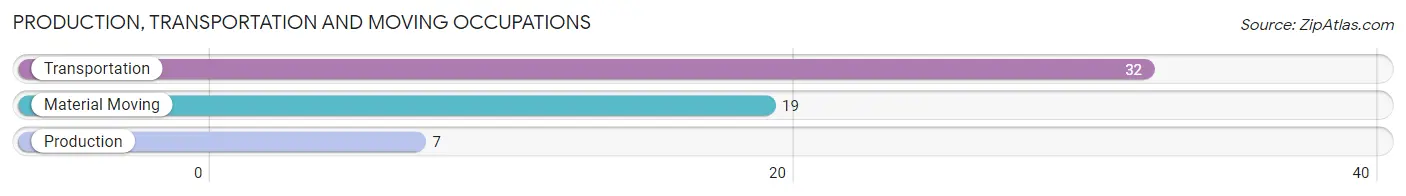
Production, Transportation and Moving Occupations by Sex
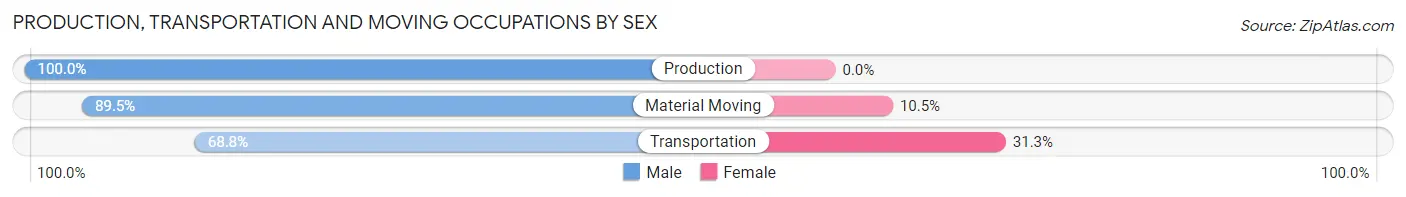
| Occupation | Male | Female |
| Production | 7 (100.0%) | 0 (0.0%) |
| Transportation | 22 (68.8%) | 10 (31.2%) |
| Material Moving | 17 (89.5%) | 2 (10.5%) |
| Total (Category) | 46 (79.3%) | 12 (20.7%) |
| Total (Overall) | 194 (56.9%) | 147 (43.1%) |
Employment Industries by Sex in Tenaha
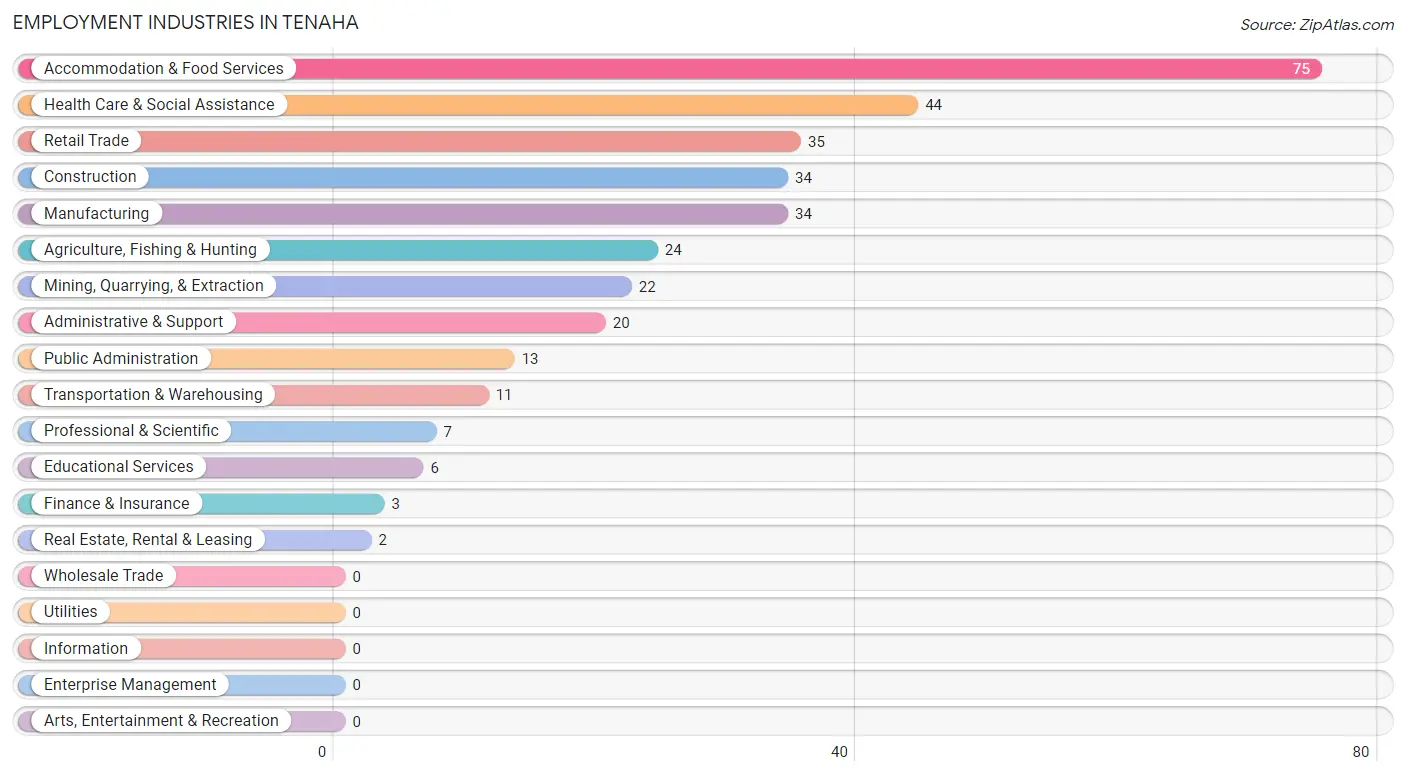
Employment Industries in Tenaha
The major employment industries in Tenaha include Accommodation & Food Services (75 | 22.0%), Health Care & Social Assistance (44 | 12.9%), Retail Trade (35 | 10.3%), Construction (34 | 10.0%), and Manufacturing (34 | 10.0%).
Employment Industries by Sex in Tenaha
The Tenaha industries that see more men than women are Agriculture, Fishing & Hunting (100.0%), Construction (100.0%), and Educational Services (83.3%), whereas the industries that tend to have a higher number of women are Finance & Insurance (100.0%), Real Estate, Rental & Leasing (100.0%), and Professional & Scientific (100.0%).
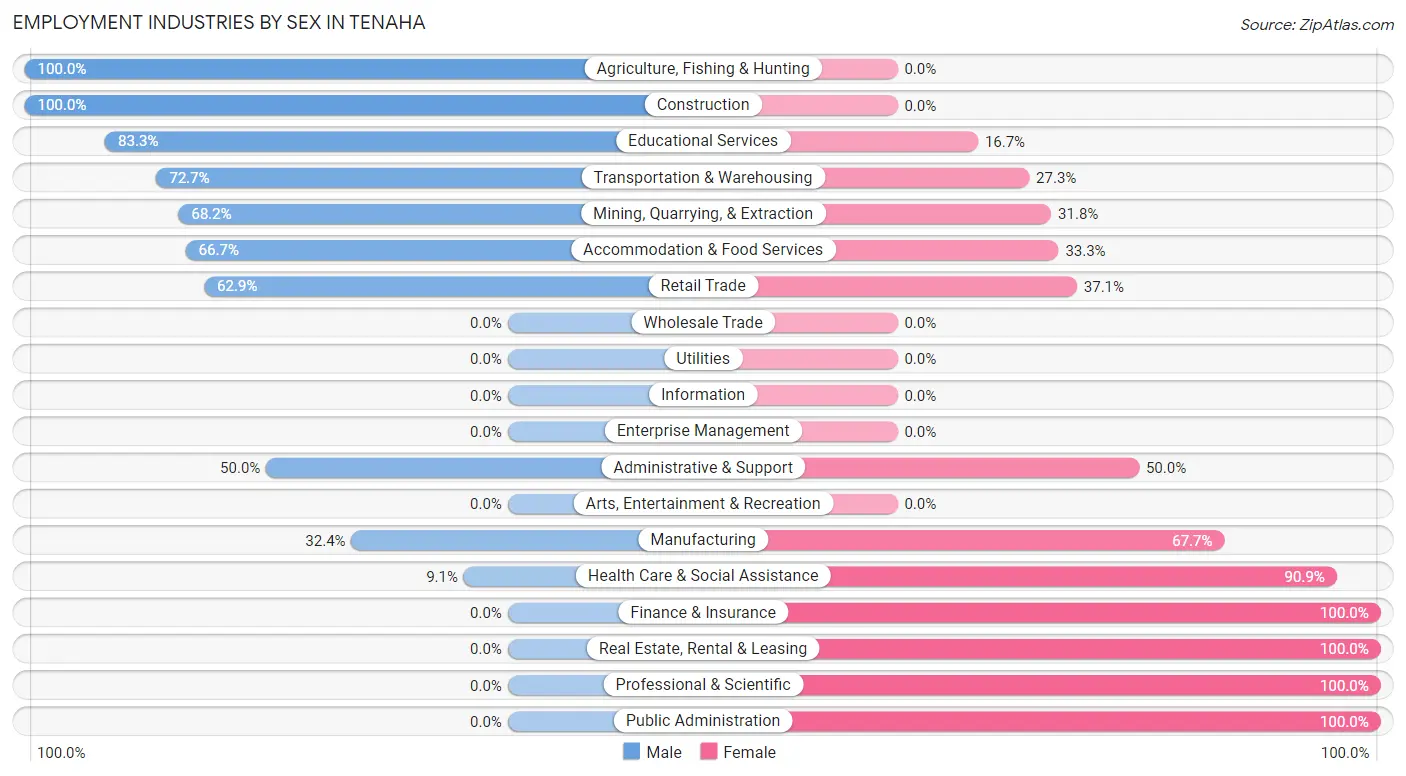
| Industry | Male | Female |
| Agriculture, Fishing & Hunting | 24 (100.0%) | 0 (0.0%) |
| Mining, Quarrying, & Extraction | 15 (68.2%) | 7 (31.8%) |
| Construction | 34 (100.0%) | 0 (0.0%) |
| Manufacturing | 11 (32.4%) | 23 (67.6%) |
| Wholesale Trade | 0 (0.0%) | 0 (0.0%) |
| Retail Trade | 22 (62.9%) | 13 (37.1%) |
| Transportation & Warehousing | 8 (72.7%) | 3 (27.3%) |
| Utilities | 0 (0.0%) | 0 (0.0%) |
| Information | 0 (0.0%) | 0 (0.0%) |
| Finance & Insurance | 0 (0.0%) | 3 (100.0%) |
| Real Estate, Rental & Leasing | 0 (0.0%) | 2 (100.0%) |
| Professional & Scientific | 0 (0.0%) | 7 (100.0%) |
| Enterprise Management | 0 (0.0%) | 0 (0.0%) |
| Administrative & Support | 10 (50.0%) | 10 (50.0%) |
| Educational Services | 5 (83.3%) | 1 (16.7%) |
| Health Care & Social Assistance | 4 (9.1%) | 40 (90.9%) |
| Arts, Entertainment & Recreation | 0 (0.0%) | 0 (0.0%) |
| Accommodation & Food Services | 50 (66.7%) | 25 (33.3%) |
| Public Administration | 0 (0.0%) | 13 (100.0%) |
| Total | 194 (56.9%) | 147 (43.1%) |
Education in Tenaha
School Enrollment in Tenaha
The most common levels of schooling among the 403 students in Tenaha are middle school (140 | 34.7%), high school (139 | 34.5%), and college / undergraduate (57 | 14.1%).
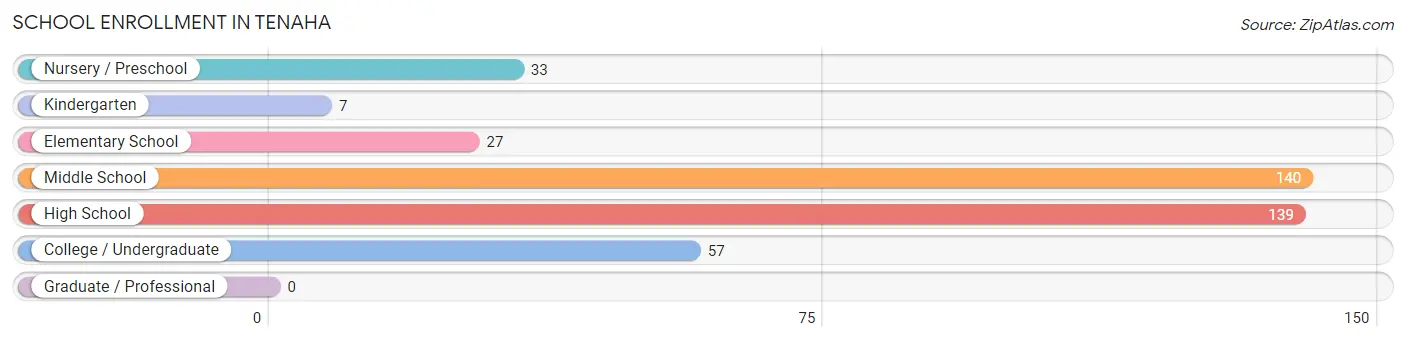
| School Level | # Students | % Students |
| Nursery / Preschool | 33 | 8.2% |
| Kindergarten | 7 | 1.7% |
| Elementary School | 27 | 6.7% |
| Middle School | 140 | 34.7% |
| High School | 139 | 34.5% |
| College / Undergraduate | 57 | 14.1% |
| Graduate / Professional | 0 | 0.0% |
| Total | 403 | 100.0% |
School Enrollment by Age by Funding Source in Tenaha
Out of a total of 403 students who are enrolled in schools in Tenaha, 14 (3.5%) attend a private institution, while the remaining 389 (96.5%) are enrolled in public schools. The age group of 5 to 9 year old has the highest likelihood of being enrolled in private schools, with 3 (13.6% in the age bracket) enrolled. Conversely, the age group of 3 to 4 year olds has the lowest likelihood of being enrolled in a private school, with 33 (100.0% in the age bracket) attending a public institution.
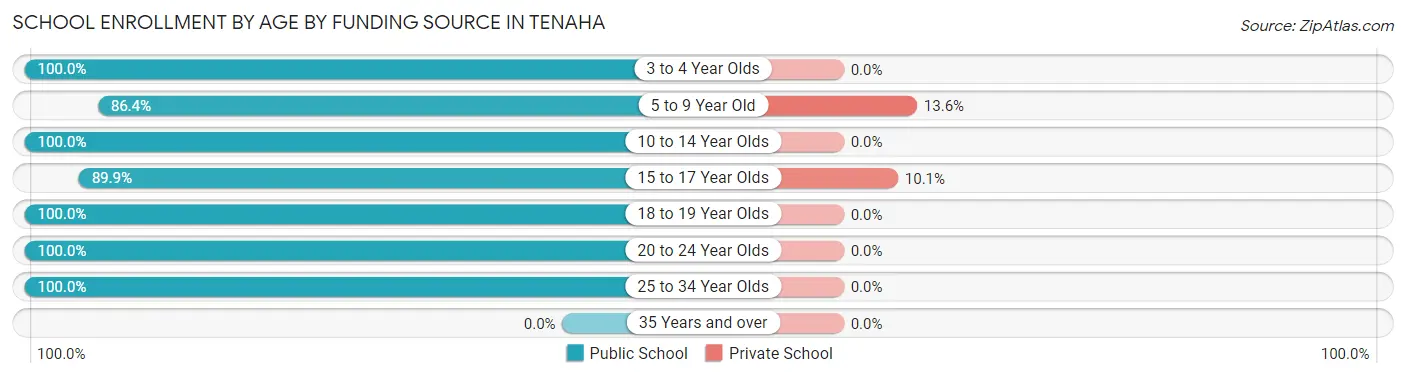
| Age Bracket | Public School | Private School |
| 3 to 4 Year Olds | 33 (100.0%) | 0 (0.0%) |
| 5 to 9 Year Old | 19 (86.4%) | 3 (13.6%) |
| 10 to 14 Year Olds | 177 (100.0%) | 0 (0.0%) |
| 15 to 17 Year Olds | 98 (89.9%) | 11 (10.1%) |
| 18 to 19 Year Olds | 43 (100.0%) | 0 (0.0%) |
| 20 to 24 Year Olds | 7 (100.0%) | 0 (0.0%) |
| 25 to 34 Year Olds | 12 (100.0%) | 0 (0.0%) |
| 35 Years and over | 0 (0.0%) | 0 (0.0%) |
| Total | 389 (96.5%) | 14 (3.5%) |
Educational Attainment by Field of Study in Tenaha
Education (15 | 55.6%), and science & technology (12 | 44.4%) are the most common fields of study among 27 individuals in Tenaha who have obtained a bachelor's degree or higher.
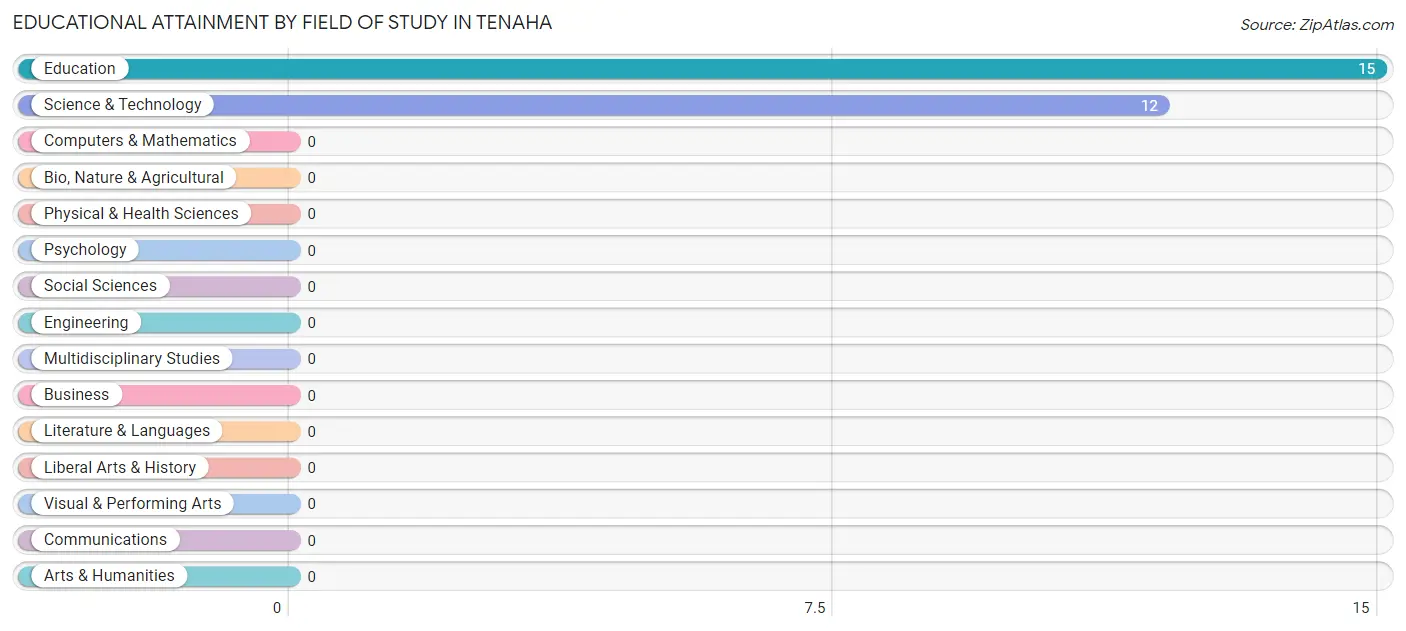
| Field of Study | # Graduates | % Graduates |
| Computers & Mathematics | 0 | 0.0% |
| Bio, Nature & Agricultural | 0 | 0.0% |
| Physical & Health Sciences | 0 | 0.0% |
| Psychology | 0 | 0.0% |
| Social Sciences | 0 | 0.0% |
| Engineering | 0 | 0.0% |
| Multidisciplinary Studies | 0 | 0.0% |
| Science & Technology | 12 | 44.4% |
| Business | 0 | 0.0% |
| Education | 15 | 55.6% |
| Literature & Languages | 0 | 0.0% |
| Liberal Arts & History | 0 | 0.0% |
| Visual & Performing Arts | 0 | 0.0% |
| Communications | 0 | 0.0% |
| Arts & Humanities | 0 | 0.0% |
| Total | 27 | 100.0% |
Transportation & Commute in Tenaha
Vehicle Availability by Sex in Tenaha
The most prevalent vehicle ownership categories in Tenaha are males with 4 vehicles (54, accounting for 27.8%) and females with 4 vehicles (13, making up 36.7%).
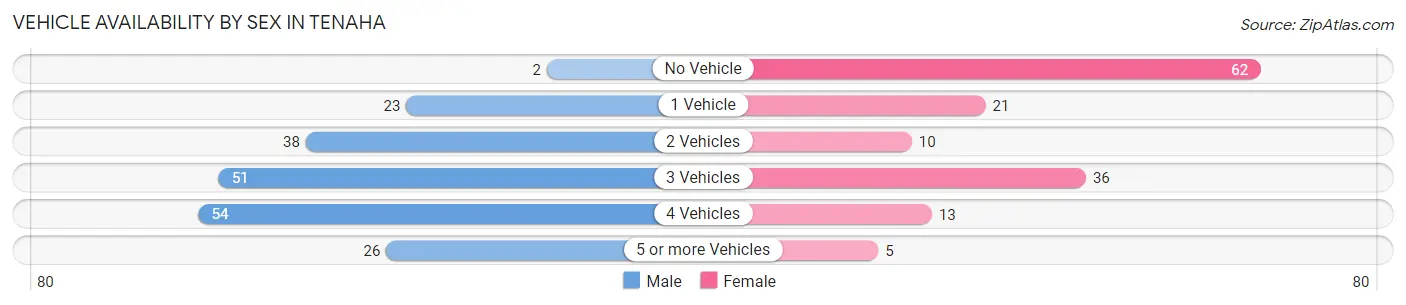
| Vehicles Available | Male | Female |
| No Vehicle | 2 (1.0%) | 62 (42.2%) |
| 1 Vehicle | 23 (11.9%) | 21 (14.3%) |
| 2 Vehicles | 38 (19.6%) | 10 (6.8%) |
| 3 Vehicles | 51 (26.3%) | 36 (24.5%) |
| 4 Vehicles | 54 (27.8%) | 13 (8.8%) |
| 5 or more Vehicles | 26 (13.4%) | 5 (3.4%) |
| Total | 194 (100.0%) | 147 (100.0%) |
Commute Time in Tenaha
The most frequently occuring commute durations in Tenaha are 30 to 34 minutes (54 commuters, 16.0%), 10 to 14 minutes (41 commuters, 12.2%), and 5 to 9 minutes (39 commuters, 11.6%).
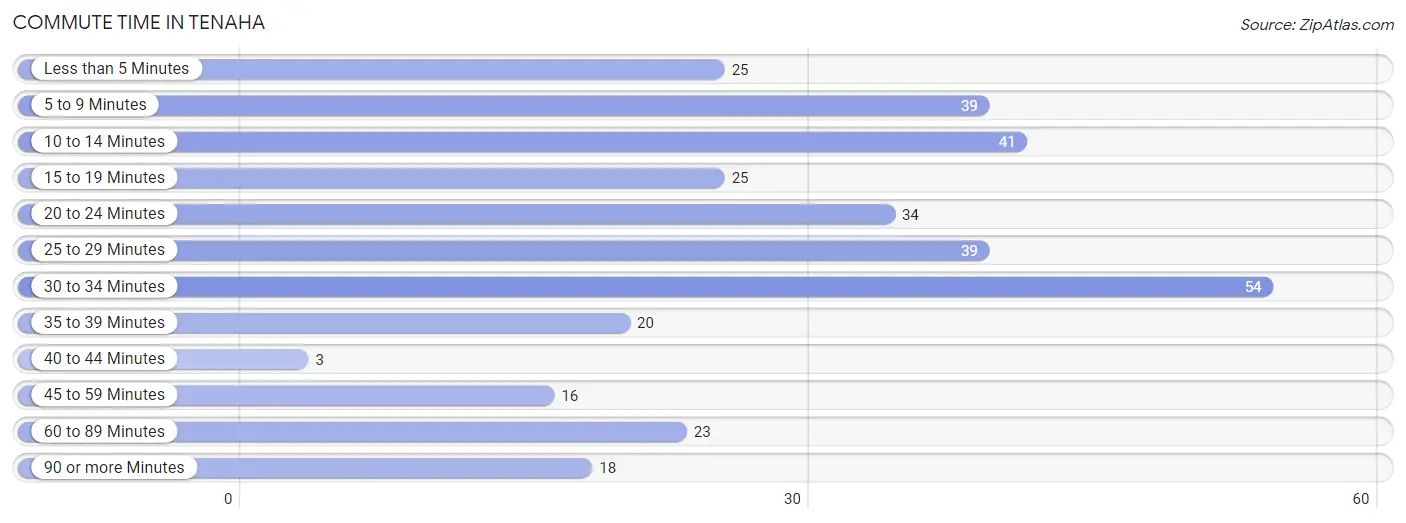
| Commute Time | # Commuters | % Commuters |
| Less than 5 Minutes | 25 | 7.4% |
| 5 to 9 Minutes | 39 | 11.6% |
| 10 to 14 Minutes | 41 | 12.2% |
| 15 to 19 Minutes | 25 | 7.4% |
| 20 to 24 Minutes | 34 | 10.1% |
| 25 to 29 Minutes | 39 | 11.6% |
| 30 to 34 Minutes | 54 | 16.0% |
| 35 to 39 Minutes | 20 | 5.9% |
| 40 to 44 Minutes | 3 | 0.9% |
| 45 to 59 Minutes | 16 | 4.8% |
| 60 to 89 Minutes | 23 | 6.8% |
| 90 or more Minutes | 18 | 5.3% |
Commute Time by Sex in Tenaha
The most common commute times in Tenaha are 30 to 34 minutes (42 commuters, 21.8%) for males and 25 to 29 minutes (31 commuters, 21.5%) for females.
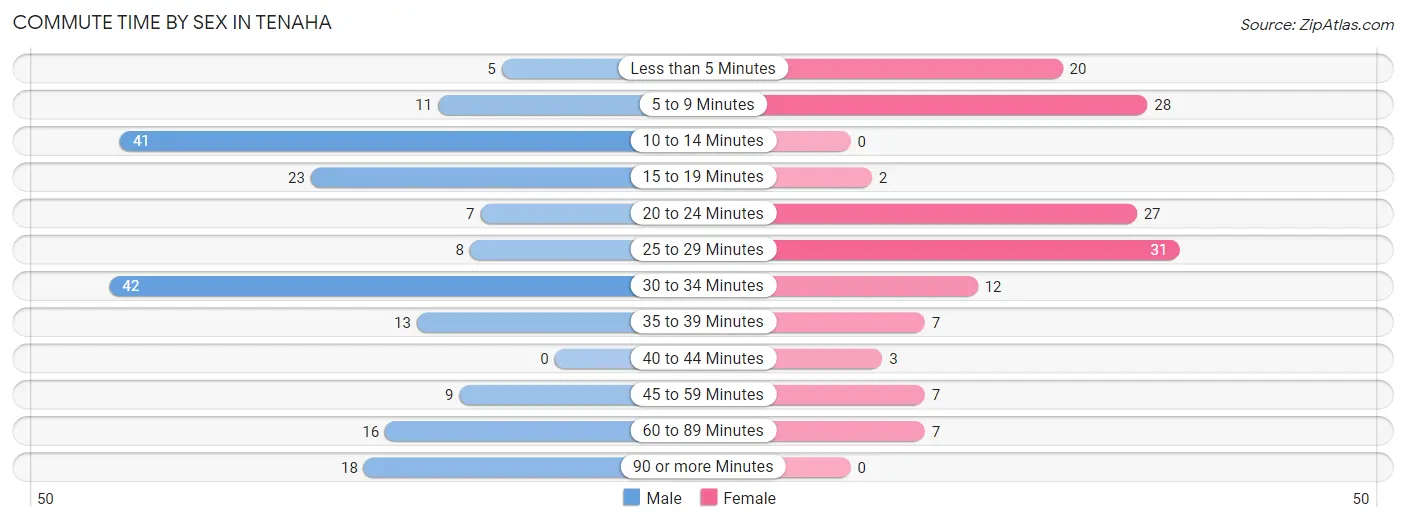
| Commute Time | Male | Female |
| Less than 5 Minutes | 5 (2.6%) | 20 (13.9%) |
| 5 to 9 Minutes | 11 (5.7%) | 28 (19.4%) |
| 10 to 14 Minutes | 41 (21.2%) | 0 (0.0%) |
| 15 to 19 Minutes | 23 (11.9%) | 2 (1.4%) |
| 20 to 24 Minutes | 7 (3.6%) | 27 (18.8%) |
| 25 to 29 Minutes | 8 (4.2%) | 31 (21.5%) |
| 30 to 34 Minutes | 42 (21.8%) | 12 (8.3%) |
| 35 to 39 Minutes | 13 (6.7%) | 7 (4.9%) |
| 40 to 44 Minutes | 0 (0.0%) | 3 (2.1%) |
| 45 to 59 Minutes | 9 (4.7%) | 7 (4.9%) |
| 60 to 89 Minutes | 16 (8.3%) | 7 (4.9%) |
| 90 or more Minutes | 18 (9.3%) | 0 (0.0%) |
Time of Departure to Work by Sex in Tenaha
The most frequent times of departure to work in Tenaha are 5:00 AM to 5:29 AM (46, 23.8%) for males and 7:30 AM to 7:59 AM (41, 28.5%) for females.
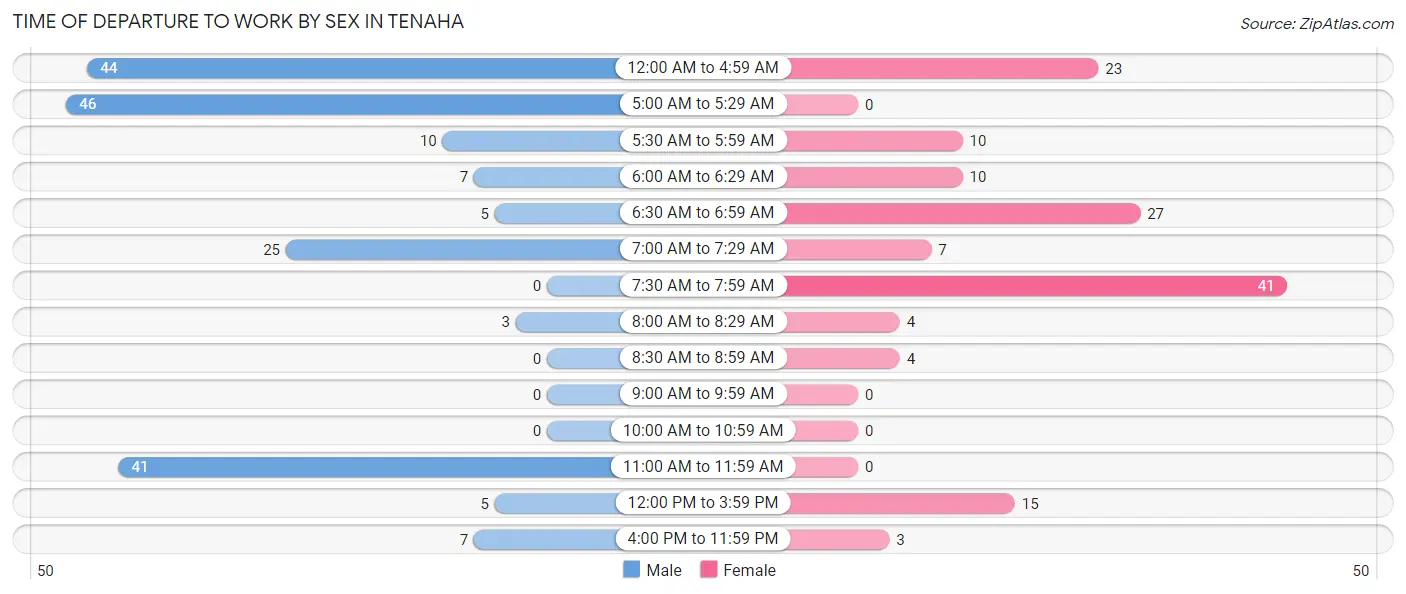
| Time of Departure | Male | Female |
| 12:00 AM to 4:59 AM | 44 (22.8%) | 23 (16.0%) |
| 5:00 AM to 5:29 AM | 46 (23.8%) | 0 (0.0%) |
| 5:30 AM to 5:59 AM | 10 (5.2%) | 10 (6.9%) |
| 6:00 AM to 6:29 AM | 7 (3.6%) | 10 (6.9%) |
| 6:30 AM to 6:59 AM | 5 (2.6%) | 27 (18.8%) |
| 7:00 AM to 7:29 AM | 25 (13.0%) | 7 (4.9%) |
| 7:30 AM to 7:59 AM | 0 (0.0%) | 41 (28.5%) |
| 8:00 AM to 8:29 AM | 3 (1.5%) | 4 (2.8%) |
| 8:30 AM to 8:59 AM | 0 (0.0%) | 4 (2.8%) |
| 9:00 AM to 9:59 AM | 0 (0.0%) | 0 (0.0%) |
| 10:00 AM to 10:59 AM | 0 (0.0%) | 0 (0.0%) |
| 11:00 AM to 11:59 AM | 41 (21.2%) | 0 (0.0%) |
| 12:00 PM to 3:59 PM | 5 (2.6%) | 15 (10.4%) |
| 4:00 PM to 11:59 PM | 7 (3.6%) | 3 (2.1%) |
| Total | 193 (100.0%) | 144 (100.0%) |
Housing Occupancy in Tenaha
Occupancy by Ownership in Tenaha
Of the total 357 dwellings in Tenaha, owner-occupied units account for 181 (50.7%), while renter-occupied units make up 176 (49.3%).
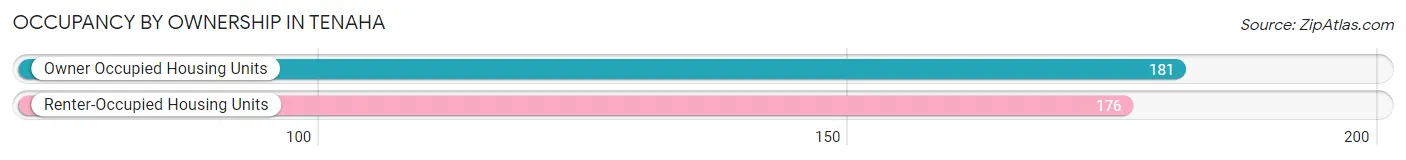
| Occupancy | # Housing Units | % Housing Units |
| Owner Occupied Housing Units | 181 | 50.7% |
| Renter-Occupied Housing Units | 176 | 49.3% |
| Total Occupied Housing Units | 357 | 100.0% |
Occupancy by Household Size in Tenaha
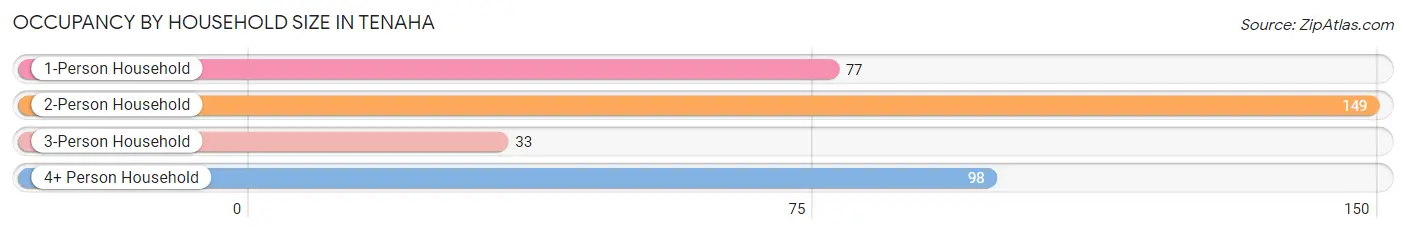
| Household Size | # Housing Units | % Housing Units |
| 1-Person Household | 77 | 21.6% |
| 2-Person Household | 149 | 41.7% |
| 3-Person Household | 33 | 9.2% |
| 4+ Person Household | 98 | 27.5% |
| Total Housing Units | 357 | 100.0% |
Occupancy by Ownership by Household Size in Tenaha
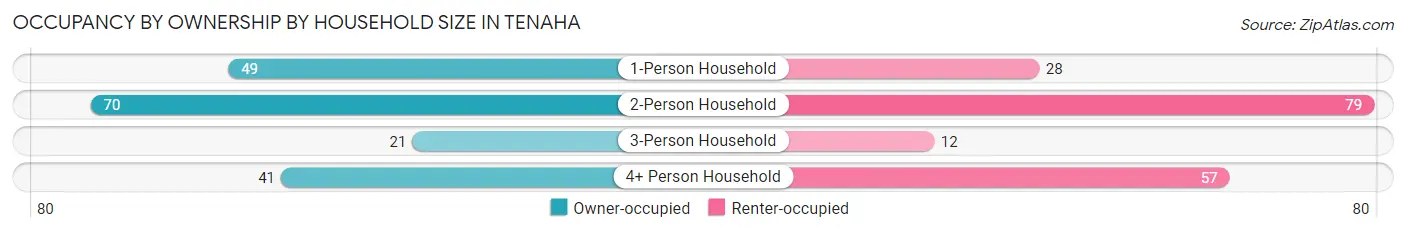
| Household Size | Owner-occupied | Renter-occupied |
| 1-Person Household | 49 (63.6%) | 28 (36.4%) |
| 2-Person Household | 70 (47.0%) | 79 (53.0%) |
| 3-Person Household | 21 (63.6%) | 12 (36.4%) |
| 4+ Person Household | 41 (41.8%) | 57 (58.2%) |
| Total Housing Units | 181 (50.7%) | 176 (49.3%) |
Occupancy by Educational Attainment in Tenaha
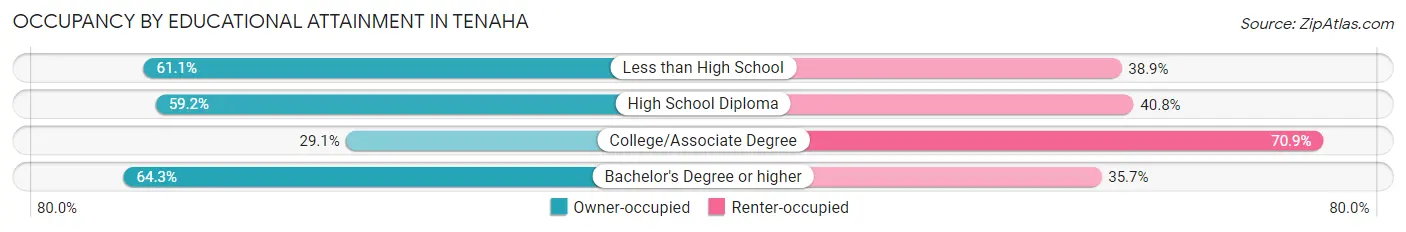
| Household Size | Owner-occupied | Renter-occupied |
| Less than High School | 66 (61.1%) | 42 (38.9%) |
| High School Diploma | 74 (59.2%) | 51 (40.8%) |
| College/Associate Degree | 32 (29.1%) | 78 (70.9%) |
| Bachelor's Degree or higher | 9 (64.3%) | 5 (35.7%) |
Occupancy by Age of Householder in Tenaha
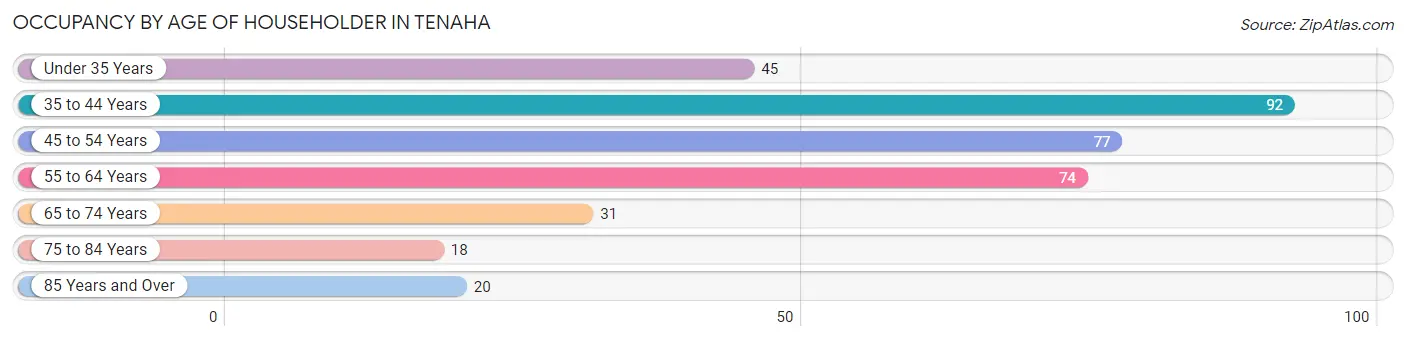
| Age Bracket | # Households | % Households |
| Under 35 Years | 45 | 12.6% |
| 35 to 44 Years | 92 | 25.8% |
| 45 to 54 Years | 77 | 21.6% |
| 55 to 64 Years | 74 | 20.7% |
| 65 to 74 Years | 31 | 8.7% |
| 75 to 84 Years | 18 | 5.0% |
| 85 Years and Over | 20 | 5.6% |
| Total | 357 | 100.0% |
Housing Finances in Tenaha
Median Income by Occupancy in Tenaha
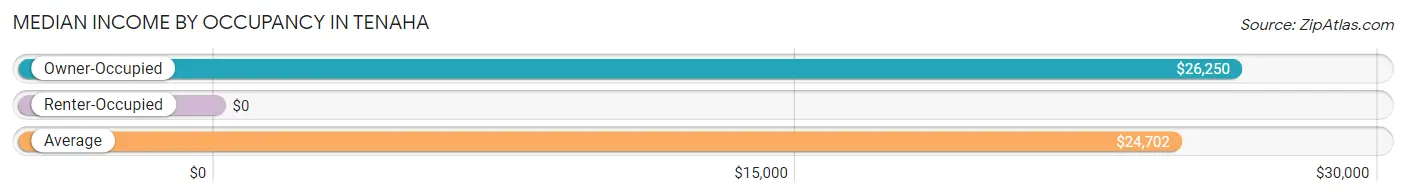
| Occupancy Type | # Households | Median Income |
| Owner-Occupied | 181 (50.7%) | $26,250 |
| Renter-Occupied | 176 (49.3%) | $0 |
| Average | 357 (100.0%) | $24,702 |
Occupancy by Householder Income Bracket in Tenaha
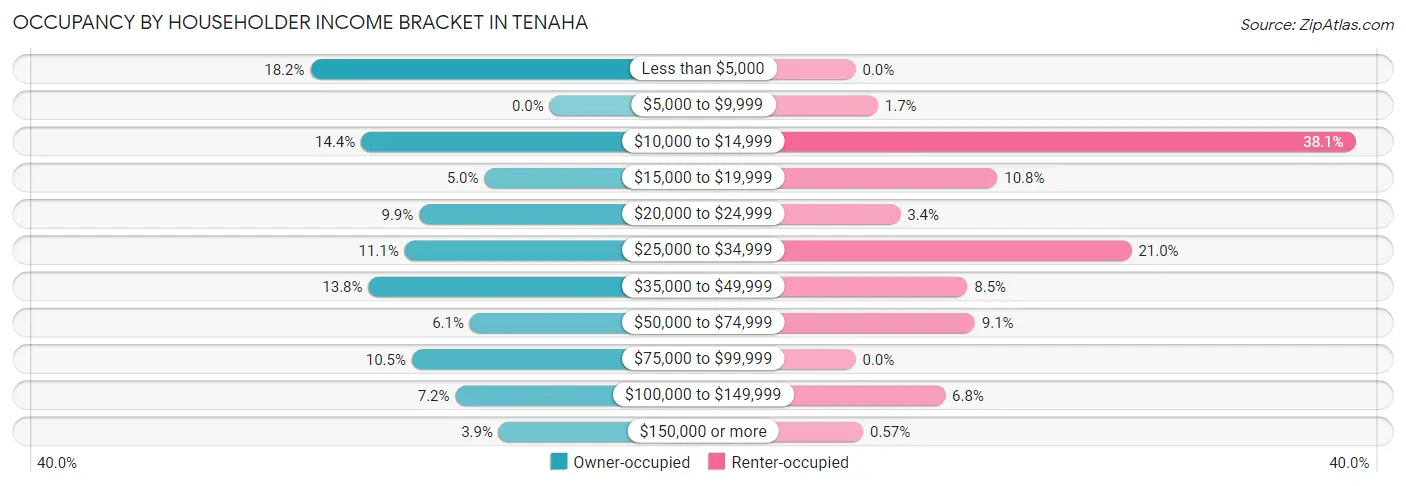
| Income Bracket | Owner-occupied | Renter-occupied |
| Less than $5,000 | 33 (18.2%) | 0 (0.0%) |
| $5,000 to $9,999 | 0 (0.0%) | 3 (1.7%) |
| $10,000 to $14,999 | 26 (14.4%) | 67 (38.1%) |
| $15,000 to $19,999 | 9 (5.0%) | 19 (10.8%) |
| $20,000 to $24,999 | 18 (9.9%) | 6 (3.4%) |
| $25,000 to $34,999 | 20 (11.1%) | 37 (21.0%) |
| $35,000 to $49,999 | 25 (13.8%) | 15 (8.5%) |
| $50,000 to $74,999 | 11 (6.1%) | 16 (9.1%) |
| $75,000 to $99,999 | 19 (10.5%) | 0 (0.0%) |
| $100,000 to $149,999 | 13 (7.2%) | 12 (6.8%) |
| $150,000 or more | 7 (3.9%) | 1 (0.6%) |
| Total | 181 (100.0%) | 176 (100.0%) |
Monthly Housing Cost Tiers in Tenaha
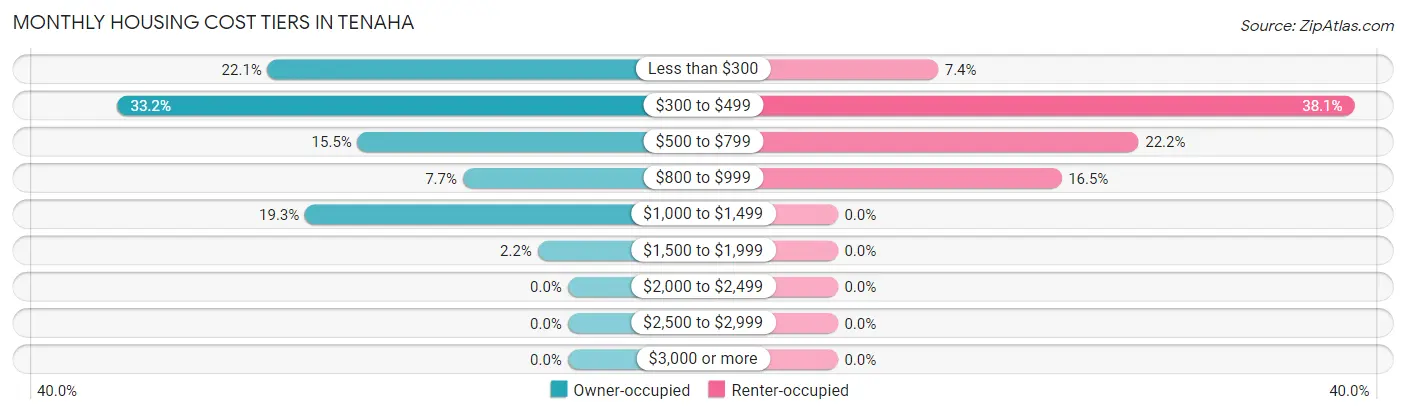
| Monthly Cost | Owner-occupied | Renter-occupied |
| Less than $300 | 40 (22.1%) | 13 (7.4%) |
| $300 to $499 | 60 (33.2%) | 67 (38.1%) |
| $500 to $799 | 28 (15.5%) | 39 (22.2%) |
| $800 to $999 | 14 (7.7%) | 29 (16.5%) |
| $1,000 to $1,499 | 35 (19.3%) | 0 (0.0%) |
| $1,500 to $1,999 | 4 (2.2%) | 0 (0.0%) |
| $2,000 to $2,499 | 0 (0.0%) | 0 (0.0%) |
| $2,500 to $2,999 | 0 (0.0%) | 0 (0.0%) |
| $3,000 or more | 0 (0.0%) | 0 (0.0%) |
| Total | 181 (100.0%) | 176 (100.0%) |
Physical Housing Characteristics in Tenaha
Housing Structures in Tenaha
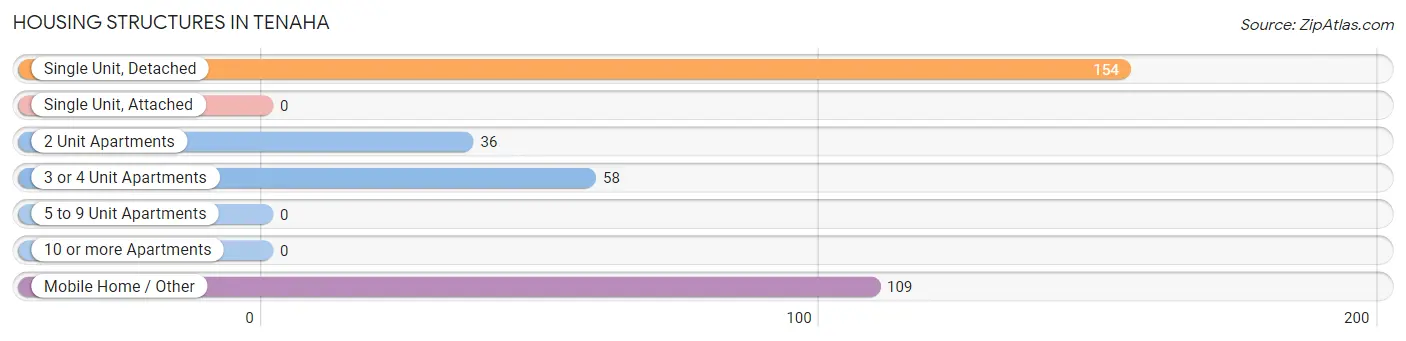
| Structure Type | # Housing Units | % Housing Units |
| Single Unit, Detached | 154 | 43.1% |
| Single Unit, Attached | 0 | 0.0% |
| 2 Unit Apartments | 36 | 10.1% |
| 3 or 4 Unit Apartments | 58 | 16.3% |
| 5 to 9 Unit Apartments | 0 | 0.0% |
| 10 or more Apartments | 0 | 0.0% |
| Mobile Home / Other | 109 | 30.5% |
| Total | 357 | 100.0% |
Housing Structures by Occupancy in Tenaha
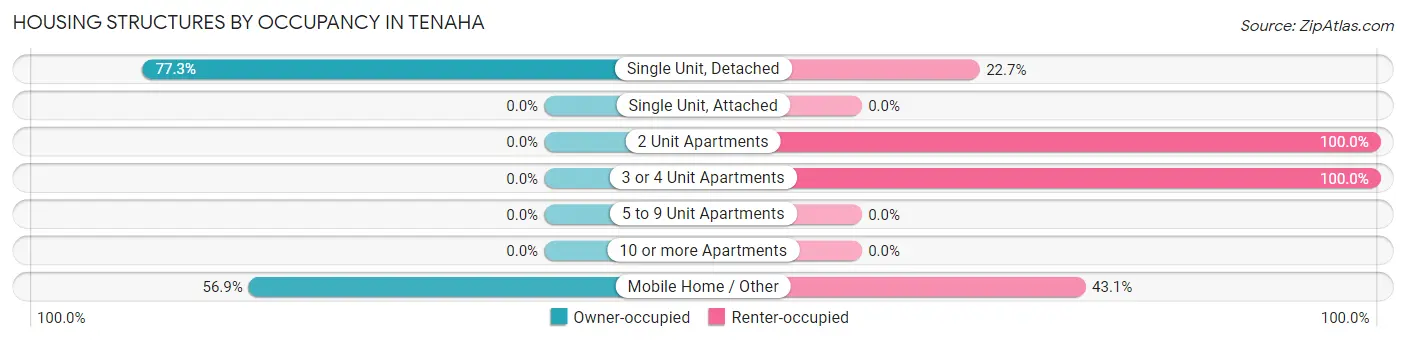
| Structure Type | Owner-occupied | Renter-occupied |
| Single Unit, Detached | 119 (77.3%) | 35 (22.7%) |
| Single Unit, Attached | 0 (0.0%) | 0 (0.0%) |
| 2 Unit Apartments | 0 (0.0%) | 36 (100.0%) |
| 3 or 4 Unit Apartments | 0 (0.0%) | 58 (100.0%) |
| 5 to 9 Unit Apartments | 0 (0.0%) | 0 (0.0%) |
| 10 or more Apartments | 0 (0.0%) | 0 (0.0%) |
| Mobile Home / Other | 62 (56.9%) | 47 (43.1%) |
| Total | 181 (50.7%) | 176 (49.3%) |
Housing Structures by Number of Rooms in Tenaha
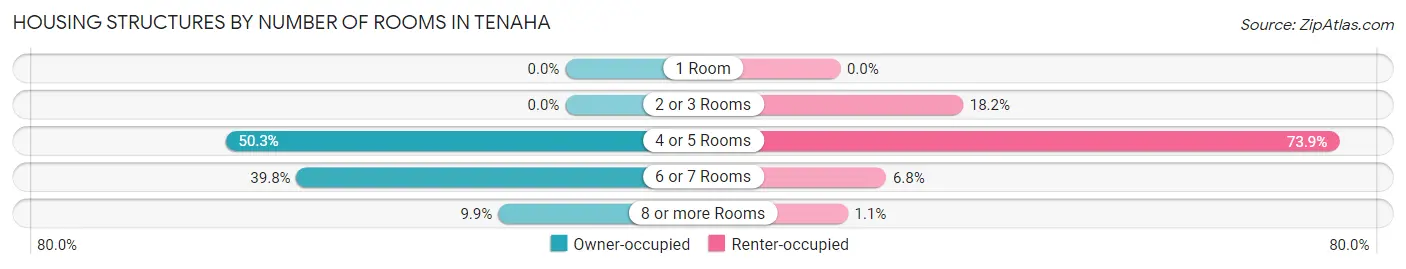
| Number of Rooms | Owner-occupied | Renter-occupied |
| 1 Room | 0 (0.0%) | 0 (0.0%) |
| 2 or 3 Rooms | 0 (0.0%) | 32 (18.2%) |
| 4 or 5 Rooms | 91 (50.3%) | 130 (73.9%) |
| 6 or 7 Rooms | 72 (39.8%) | 12 (6.8%) |
| 8 or more Rooms | 18 (9.9%) | 2 (1.1%) |
| Total | 181 (100.0%) | 176 (100.0%) |
Housing Structure by Heating Type in Tenaha
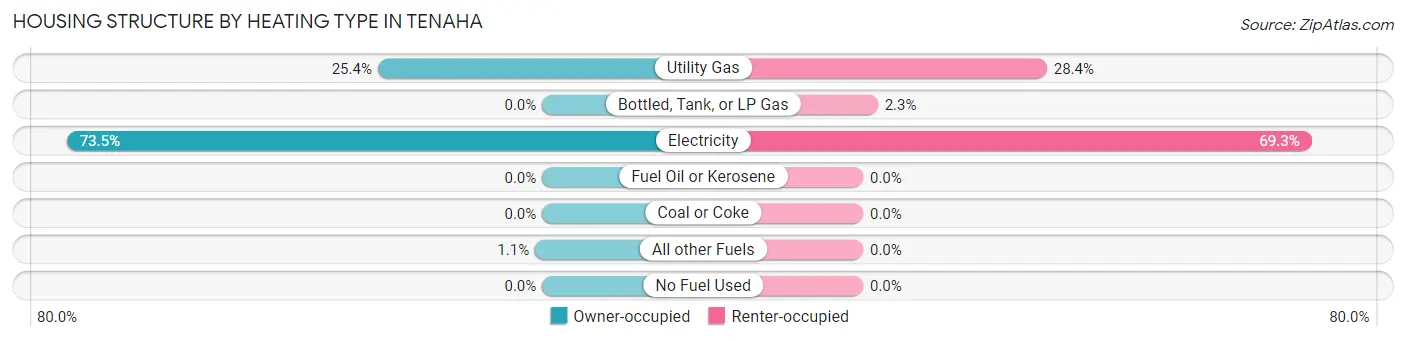
| Heating Type | Owner-occupied | Renter-occupied |
| Utility Gas | 46 (25.4%) | 50 (28.4%) |
| Bottled, Tank, or LP Gas | 0 (0.0%) | 4 (2.3%) |
| Electricity | 133 (73.5%) | 122 (69.3%) |
| Fuel Oil or Kerosene | 0 (0.0%) | 0 (0.0%) |
| Coal or Coke | 0 (0.0%) | 0 (0.0%) |
| All other Fuels | 2 (1.1%) | 0 (0.0%) |
| No Fuel Used | 0 (0.0%) | 0 (0.0%) |
| Total | 181 (100.0%) | 176 (100.0%) |
Household Vehicle Usage in Tenaha
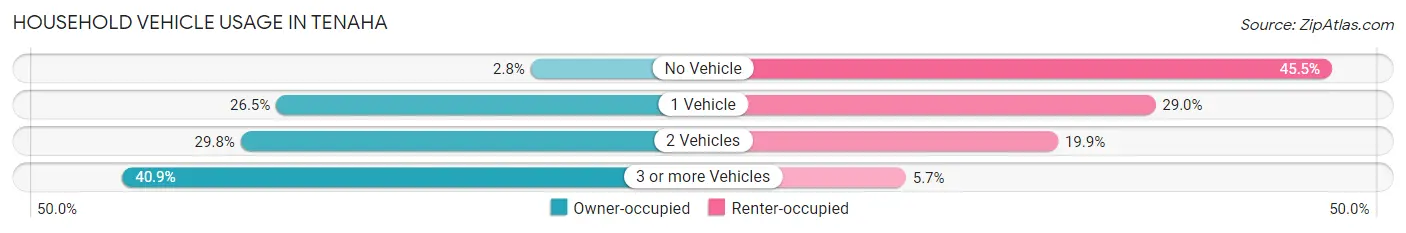
| Vehicles per Household | Owner-occupied | Renter-occupied |
| No Vehicle | 5 (2.8%) | 80 (45.5%) |
| 1 Vehicle | 48 (26.5%) | 51 (29.0%) |
| 2 Vehicles | 54 (29.8%) | 35 (19.9%) |
| 3 or more Vehicles | 74 (40.9%) | 10 (5.7%) |
| Total | 181 (100.0%) | 176 (100.0%) |
Real Estate & Mortgages in Tenaha
Real Estate and Mortgage Overview in Tenaha
| Characteristic | Without Mortgage | With Mortgage |
| Housing Units | 131 | 50 |
| Median Property Value | $95,500 | $81,900 |
| Median Household Income | $25,694 | $7 |
| Monthly Housing Costs | $407 | $0 |
| Real Estate Taxes | - | - |
Property Value by Mortgage Status in Tenaha
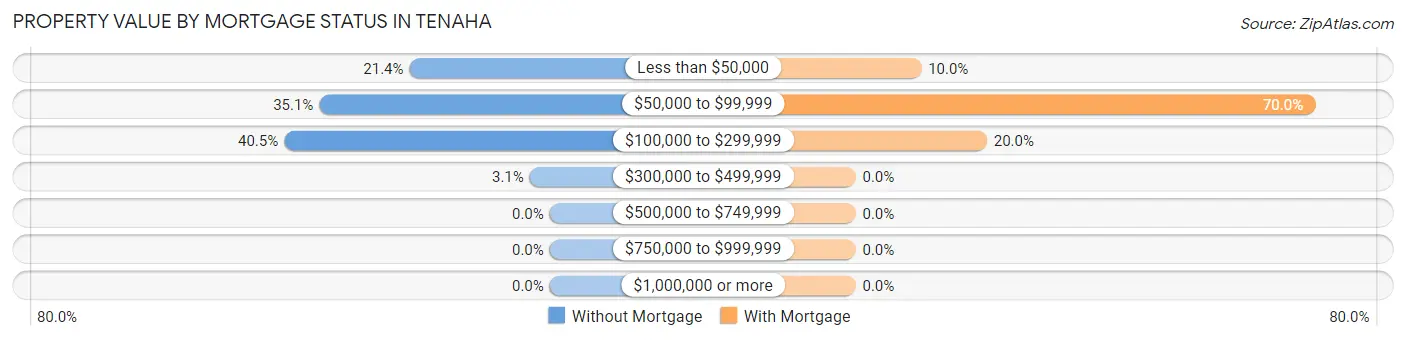
| Property Value | Without Mortgage | With Mortgage |
| Less than $50,000 | 28 (21.4%) | 5 (10.0%) |
| $50,000 to $99,999 | 46 (35.1%) | 35 (70.0%) |
| $100,000 to $299,999 | 53 (40.5%) | 10 (20.0%) |
| $300,000 to $499,999 | 4 (3.0%) | 0 (0.0%) |
| $500,000 to $749,999 | 0 (0.0%) | 0 (0.0%) |
| $750,000 to $999,999 | 0 (0.0%) | 0 (0.0%) |
| $1,000,000 or more | 0 (0.0%) | 0 (0.0%) |
| Total | 131 (100.0%) | 50 (100.0%) |
Household Income by Mortgage Status in Tenaha
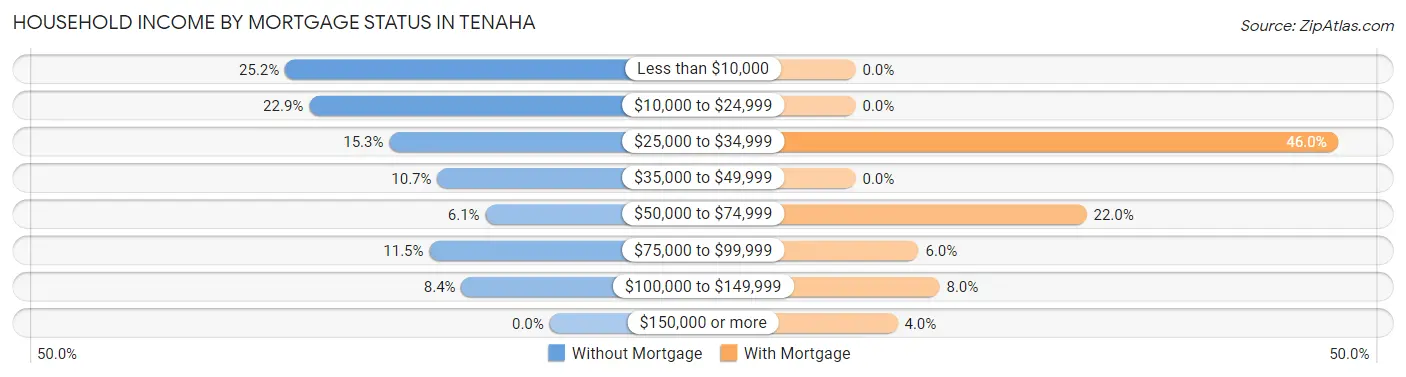
| Household Income | Without Mortgage | With Mortgage |
| Less than $10,000 | 33 (25.2%) | 0 (0.0%) |
| $10,000 to $24,999 | 30 (22.9%) | 0 (0.0%) |
| $25,000 to $34,999 | 20 (15.3%) | 23 (46.0%) |
| $35,000 to $49,999 | 14 (10.7%) | 0 (0.0%) |
| $50,000 to $74,999 | 8 (6.1%) | 11 (22.0%) |
| $75,000 to $99,999 | 15 (11.5%) | 3 (6.0%) |
| $100,000 to $149,999 | 11 (8.4%) | 4 (8.0%) |
| $150,000 or more | 0 (0.0%) | 2 (4.0%) |
| Total | 131 (100.0%) | 50 (100.0%) |
Property Value to Household Income Ratio in Tenaha
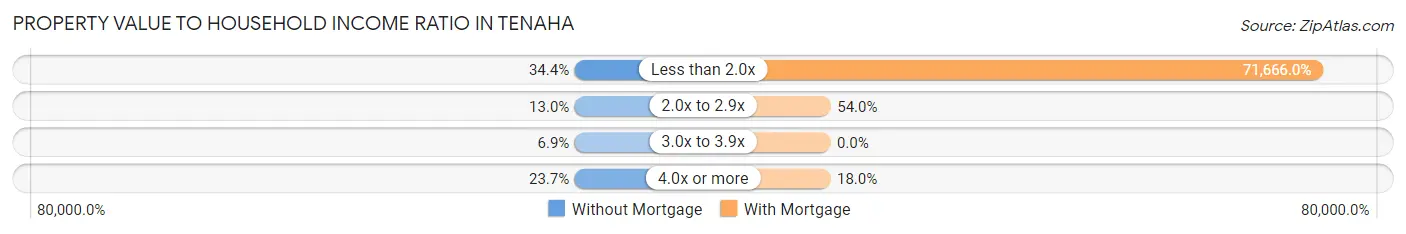
| Value-to-Income Ratio | Without Mortgage | With Mortgage |
| Less than 2.0x | 45 (34.4%) | 35,833 (71,666.0%) |
| 2.0x to 2.9x | 17 (13.0%) | 27 (54.0%) |
| 3.0x to 3.9x | 9 (6.9%) | 0 (0.0%) |
| 4.0x or more | 31 (23.7%) | 9 (18.0%) |
| Total | 131 (100.0%) | 50 (100.0%) |
Real Estate Taxes by Mortgage Status in Tenaha
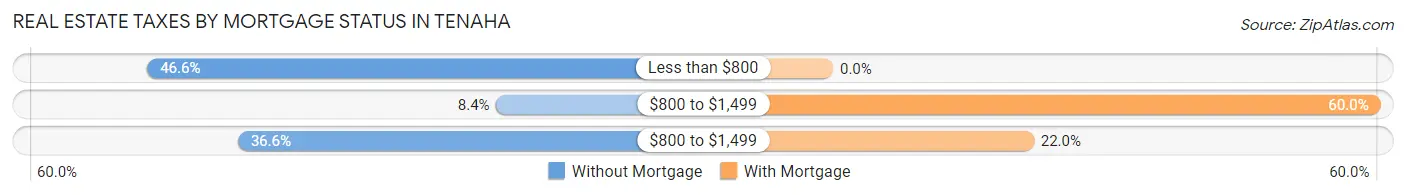
| Property Taxes | Without Mortgage | With Mortgage |
| Less than $800 | 61 (46.6%) | 0 (0.0%) |
| $800 to $1,499 | 11 (8.4%) | 30 (60.0%) |
| $800 to $1,499 | 48 (36.6%) | 11 (22.0%) |
| Total | 131 (100.0%) | 50 (100.0%) |
Health & Disability in Tenaha
Health Insurance Coverage by Age in Tenaha
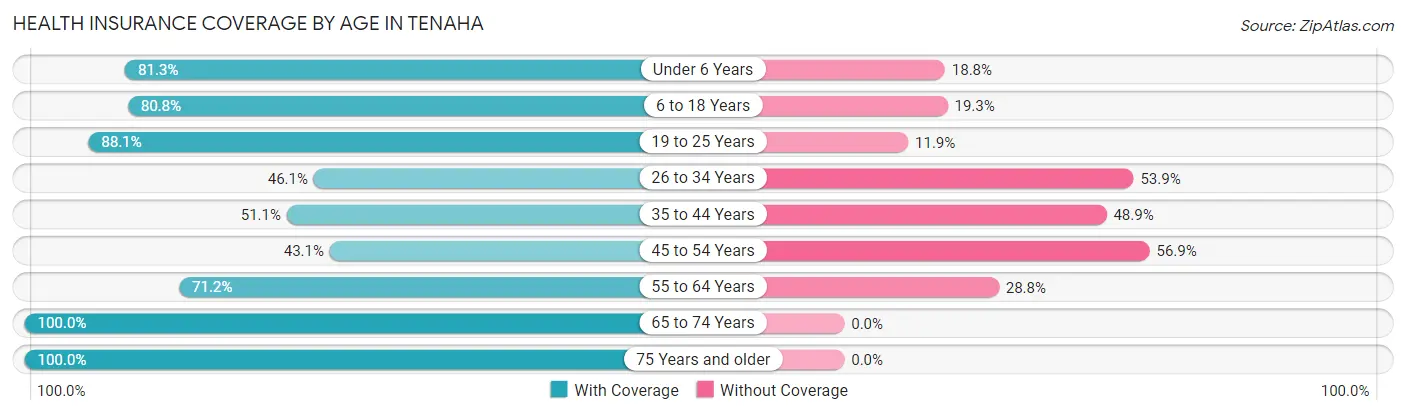
| Age Bracket | With Coverage | Without Coverage |
| Under 6 Years | 52 (81.2%) | 12 (18.8%) |
| 6 to 18 Years | 281 (80.7%) | 67 (19.3%) |
| 19 to 25 Years | 74 (88.1%) | 10 (11.9%) |
| 26 to 34 Years | 41 (46.1%) | 48 (53.9%) |
| 35 to 44 Years | 69 (51.1%) | 66 (48.9%) |
| 45 to 54 Years | 56 (43.1%) | 74 (56.9%) |
| 55 to 64 Years | 84 (71.2%) | 34 (28.8%) |
| 65 to 74 Years | 82 (100.0%) | 0 (0.0%) |
| 75 Years and older | 41 (100.0%) | 0 (0.0%) |
| Total | 780 (71.5%) | 311 (28.5%) |
Health Insurance Coverage by Citizenship Status in Tenaha
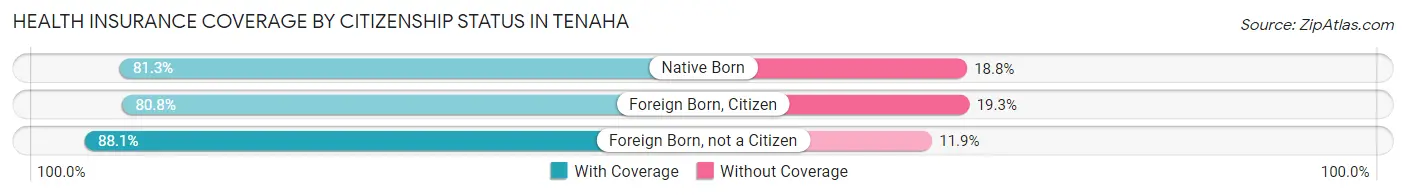
| Citizenship Status | With Coverage | Without Coverage |
| Native Born | 52 (81.2%) | 12 (18.8%) |
| Foreign Born, Citizen | 281 (80.7%) | 67 (19.3%) |
| Foreign Born, not a Citizen | 74 (88.1%) | 10 (11.9%) |
Health Insurance Coverage by Household Income in Tenaha
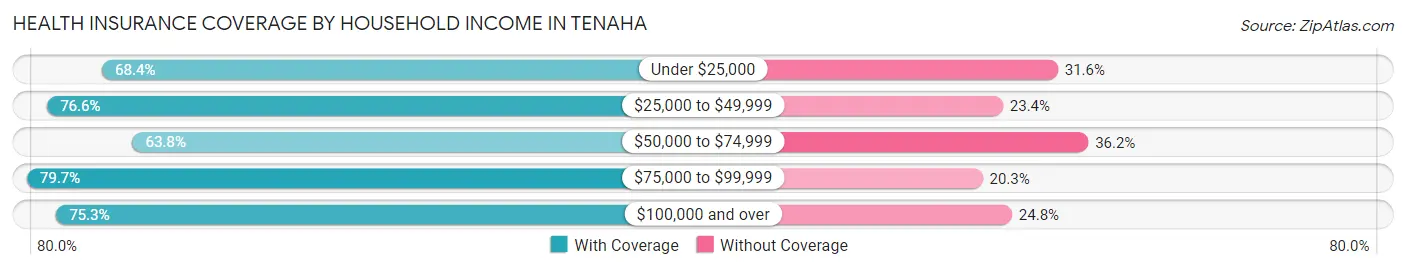
| Household Income | With Coverage | Without Coverage |
| Under $25,000 | 294 (68.4%) | 136 (31.6%) |
| $25,000 to $49,999 | 190 (76.6%) | 58 (23.4%) |
| $50,000 to $74,999 | 97 (63.8%) | 55 (36.2%) |
| $75,000 to $99,999 | 47 (79.7%) | 12 (20.3%) |
| $100,000 and over | 152 (75.2%) | 50 (24.7%) |
Public vs Private Health Insurance Coverage by Age in Tenaha
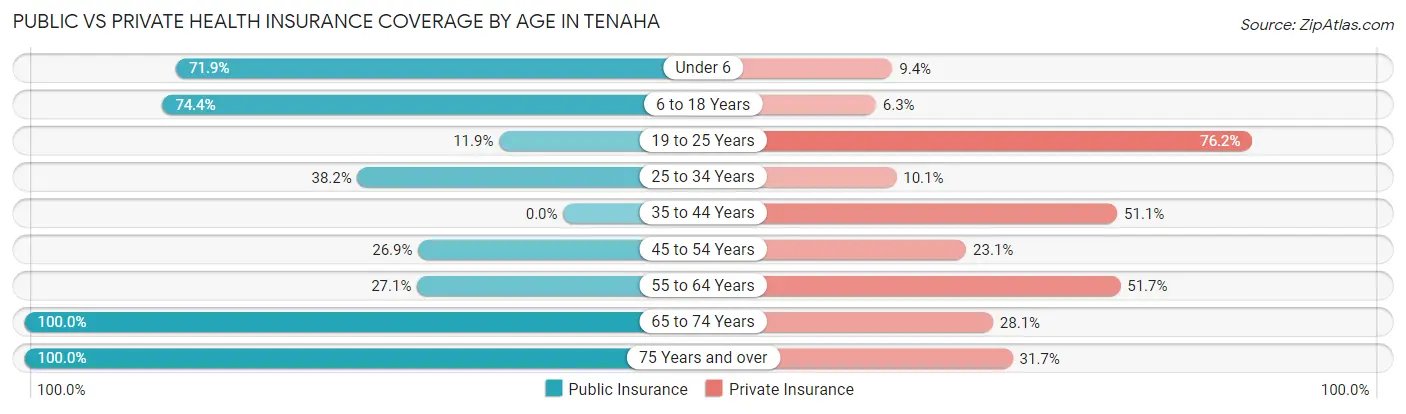
| Age Bracket | Public Insurance | Private Insurance |
| Under 6 | 46 (71.9%) | 6 (9.4%) |
| 6 to 18 Years | 259 (74.4%) | 22 (6.3%) |
| 19 to 25 Years | 10 (11.9%) | 64 (76.2%) |
| 25 to 34 Years | 34 (38.2%) | 9 (10.1%) |
| 35 to 44 Years | 0 (0.0%) | 69 (51.1%) |
| 45 to 54 Years | 35 (26.9%) | 30 (23.1%) |
| 55 to 64 Years | 32 (27.1%) | 61 (51.7%) |
| 65 to 74 Years | 82 (100.0%) | 23 (28.1%) |
| 75 Years and over | 41 (100.0%) | 13 (31.7%) |
| Total | 539 (49.4%) | 297 (27.2%) |
Disability Status by Sex by Age in Tenaha
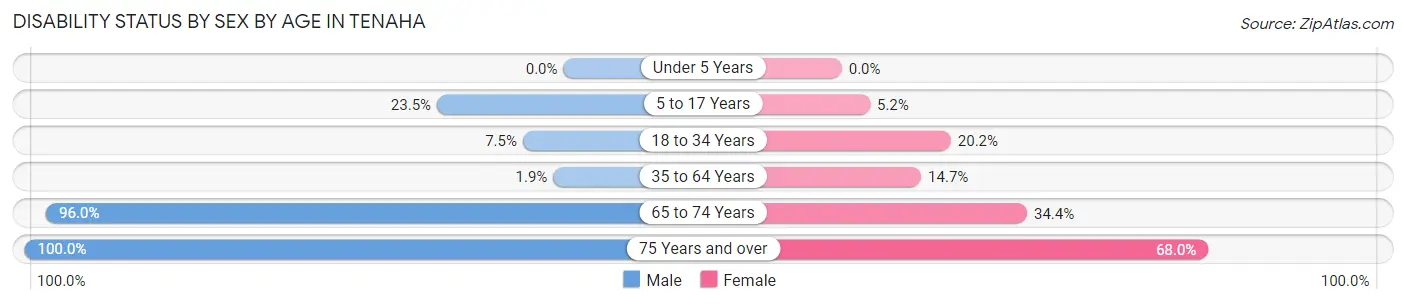
| Age Bracket | Male | Female |
| Under 5 Years | 0 (0.0%) | 0 (0.0%) |
| 5 to 17 Years | 23 (23.5%) | 11 (5.2%) |
| 18 to 34 Years | 10 (7.5%) | 17 (20.2%) |
| 35 to 64 Years | 3 (1.9%) | 33 (14.7%) |
| 65 to 74 Years | 48 (96.0%) | 11 (34.4%) |
| 75 Years and over | 16 (100.0%) | 17 (68.0%) |
Disability Class by Sex by Age in Tenaha
Disability Class: Hearing Difficulty
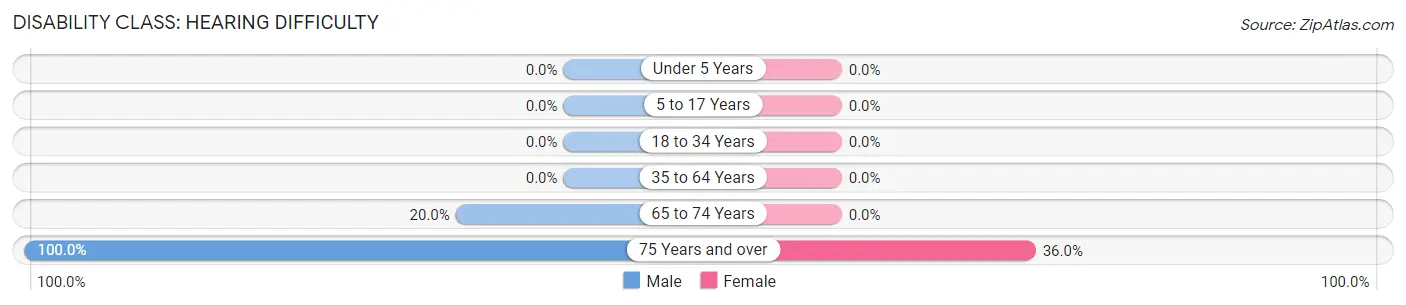
| Age Bracket | Male | Female |
| Under 5 Years | 0 (0.0%) | 0 (0.0%) |
| 5 to 17 Years | 0 (0.0%) | 0 (0.0%) |
| 18 to 34 Years | 0 (0.0%) | 0 (0.0%) |
| 35 to 64 Years | 0 (0.0%) | 0 (0.0%) |
| 65 to 74 Years | 10 (20.0%) | 0 (0.0%) |
| 75 Years and over | 16 (100.0%) | 9 (36.0%) |
Disability Class: Vision Difficulty
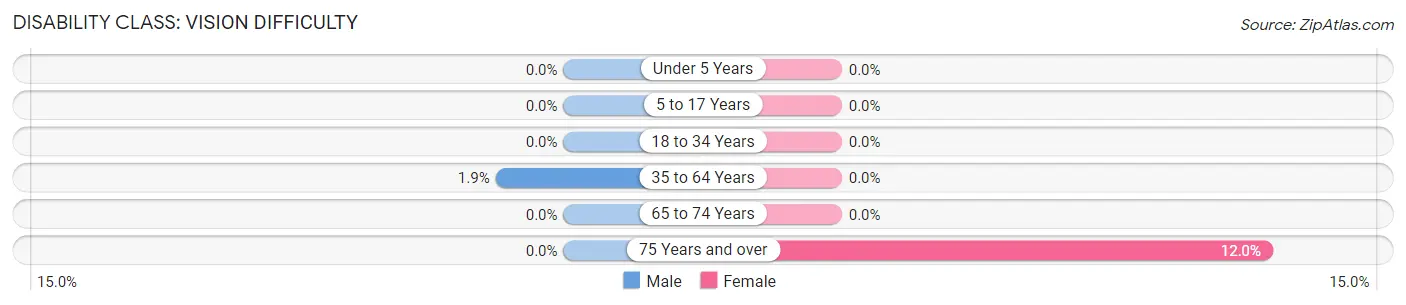
| Age Bracket | Male | Female |
| Under 5 Years | 0 (0.0%) | 0 (0.0%) |
| 5 to 17 Years | 0 (0.0%) | 0 (0.0%) |
| 18 to 34 Years | 0 (0.0%) | 0 (0.0%) |
| 35 to 64 Years | 3 (1.9%) | 0 (0.0%) |
| 65 to 74 Years | 0 (0.0%) | 0 (0.0%) |
| 75 Years and over | 0 (0.0%) | 3 (12.0%) |
Disability Class: Cognitive Difficulty
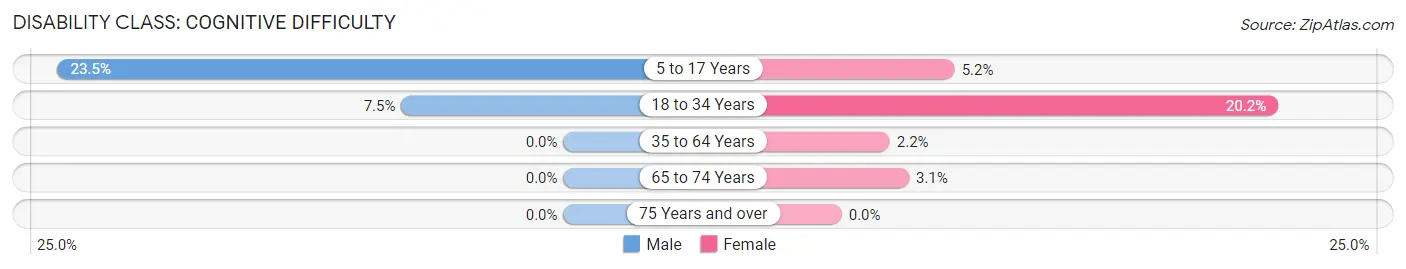
| Age Bracket | Male | Female |
| 5 to 17 Years | 23 (23.5%) | 11 (5.2%) |
| 18 to 34 Years | 10 (7.5%) | 17 (20.2%) |
| 35 to 64 Years | 0 (0.0%) | 5 (2.2%) |
| 65 to 74 Years | 0 (0.0%) | 1 (3.1%) |
| 75 Years and over | 0 (0.0%) | 0 (0.0%) |
Disability Class: Ambulatory Difficulty
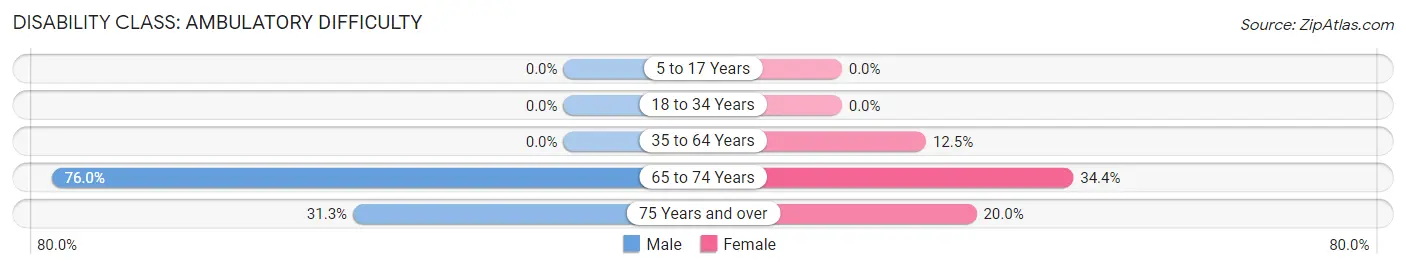
| Age Bracket | Male | Female |
| 5 to 17 Years | 0 (0.0%) | 0 (0.0%) |
| 18 to 34 Years | 0 (0.0%) | 0 (0.0%) |
| 35 to 64 Years | 0 (0.0%) | 28 (12.5%) |
| 65 to 74 Years | 38 (76.0%) | 11 (34.4%) |
| 75 Years and over | 5 (31.2%) | 5 (20.0%) |
Disability Class: Self-Care Difficulty
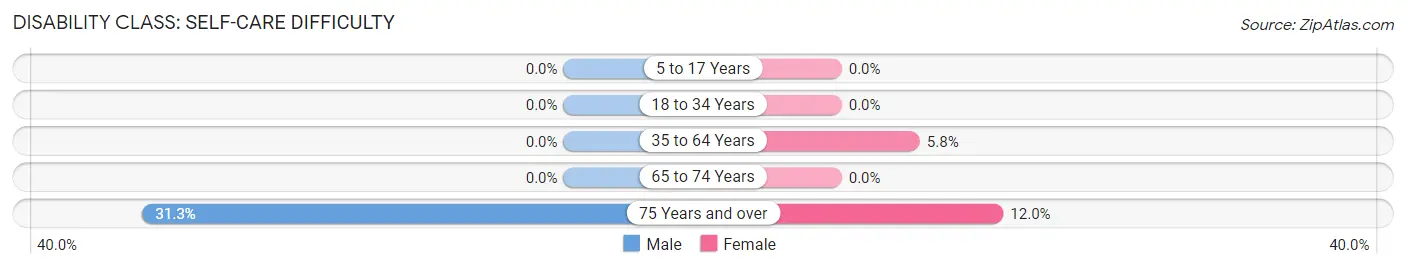
| Age Bracket | Male | Female |
| 5 to 17 Years | 0 (0.0%) | 0 (0.0%) |
| 18 to 34 Years | 0 (0.0%) | 0 (0.0%) |
| 35 to 64 Years | 0 (0.0%) | 13 (5.8%) |
| 65 to 74 Years | 0 (0.0%) | 0 (0.0%) |
| 75 Years and over | 5 (31.2%) | 3 (12.0%) |
Technology Access in Tenaha
Computing Device Access in Tenaha
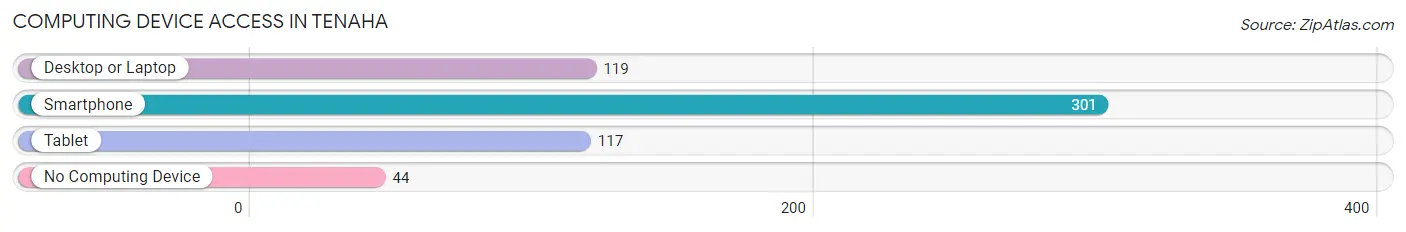
| Device Type | # Households | % Households |
| Desktop or Laptop | 119 | 33.3% |
| Smartphone | 301 | 84.3% |
| Tablet | 117 | 32.8% |
| No Computing Device | 44 | 12.3% |
| Total | 357 | 100.0% |
Internet Access in Tenaha
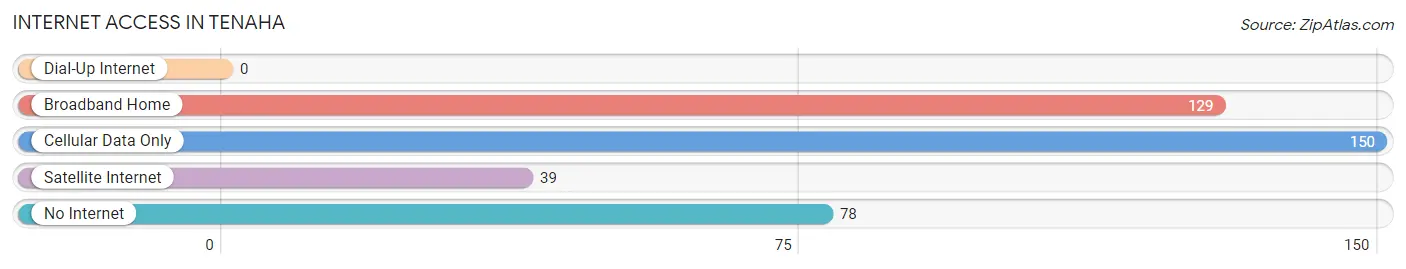
| Internet Type | # Households | % Households |
| Dial-Up Internet | 0 | 0.0% |
| Broadband Home | 129 | 36.1% |
| Cellular Data Only | 150 | 42.0% |
| Satellite Internet | 39 | 10.9% |
| No Internet | 78 | 21.8% |
| Total | 357 | 100.0% |
Tenaha Summary
History
The small town of Tenaha, Texas is located in the northeastern corner of Shelby County, Texas. It is situated on the banks of the Sabine River, which forms the border between Texas and Louisiana. The town was founded in 1882 and was named after a Choctaw Indian chief, Chief Tenaha. The town was originally a trading post and was a popular stop for travelers and settlers heading west.
The town was incorporated in 1887 and the first mayor was J.W. Smith. The town grew quickly and by the early 1900s, it had become a thriving community with a population of over 1,000 people. The town was home to several businesses, including a cotton gin, a sawmill, a gristmill, and a blacksmith shop.
The town was also home to several churches, including the First Baptist Church, which was founded in 1883. The town also had a school, which was established in 1884.
In the early 1900s, Tenaha was a major stop on the Texas and Pacific Railway. The railroad brought many new people to the town and helped to spur economic growth. The town also had a post office, which was established in 1887.
The town continued to grow and by the mid-1900s, it had become a major center for cotton production. The town was also home to several other businesses, including a bank, a grocery store, and a movie theater.
In the late 1900s, the town began to decline as the cotton industry moved away from the area. The population of the town began to decline as well, and by the 2000 census, the population had dropped to just over 1,000 people.
Geography
Tenaha is located in the northeastern corner of Shelby County, Texas. It is situated on the banks of the Sabine River, which forms the border between Texas and Louisiana. The town is located about 80 miles east of Dallas and about 40 miles west of Shreveport, Louisiana.
The town is located in a flat, open area of the state. The terrain is mostly flat with some rolling hills. The climate is humid subtropical, with hot summers and mild winters.
Economy
The economy of Tenaha is largely based on agriculture. The town is home to several cotton farms, as well as other crops such as corn, soybeans, and wheat. The town is also home to several businesses, including a bank, a grocery store, and a movie theater.
The town is also home to several manufacturing companies, including a furniture factory and a plastics factory. The town is also home to several oil and gas companies, which are involved in the exploration and production of oil and gas in the area.
Demographics
As of the 2000 census, the population of Tenaha was 1,072. The racial makeup of the town was 79.3% White, 17.2% African American, 0.7% Native American, 0.3% Asian, 0.1% Pacific Islander, and 2.4% from other races. Hispanic or Latino of any race were 4.2% of the population.
The median income for a household in the town was $25,625, and the median income for a family was $31,250. The per capita income for the town was $14,845. About 18.2% of families and 22.2% of the population were below the poverty line, including 28.3% of those under age 18 and 15.2% of those age 65 or over.
Common Questions
What is Per Capita Income in Tenaha?
Per Capita income in Tenaha is $13,580.
What is the Median Family Income in Tenaha?
Median Family Income in Tenaha is $32,800.
What is the Median Household income in Tenaha?
Median Household Income in Tenaha is $24,702.
What is Income or Wage Gap in Tenaha?
Income or Wage Gap in Tenaha is 15.7%.
Women in Tenaha earn 84.3 cents for every dollar earned by a man.
What is Inequality or Gini Index in Tenaha?
Inequality or Gini Index in Tenaha is 0.51.
What is the Total Population of Tenaha?
Total Population of Tenaha is 1,091.
What is the Total Male Population of Tenaha?
Total Male Population of Tenaha is 500.
What is the Total Female Population of Tenaha?
Total Female Population of Tenaha is 591.
What is the Ratio of Males per 100 Females in Tenaha?
There are 84.60 Males per 100 Females in Tenaha.
What is the Ratio of Females per 100 Males in Tenaha?
There are 118.20 Females per 100 Males in Tenaha.
What is the Median Population Age in Tenaha?
Median Population Age in Tenaha is 33.0 Years.
What is the Average Family Size in Tenaha
Average Family Size in Tenaha is 3.8 People.
What is the Average Household Size in Tenaha
Average Household Size in Tenaha is 3.1 People.
How Large is the Labor Force in Tenaha?
There are 341 People in the Labor Forcein in Tenaha.
What is the Percentage of People in the Labor Force in Tenaha?
45.1% of People are in the Labor Force in Tenaha.