Teague, TX Map & Demographics
Teague Map
Teague Overview
$22,779
PER CAPITA INCOME
$69,611
AVG FAMILY INCOME
$63,640
AVG HOUSEHOLD INCOME
19.8%
WAGE / INCOME GAP [ % ]
80.2¢/ $1
WAGE / INCOME GAP [ $ ]
0.39
INEQUALITY / GINI INDEX
3,409
TOTAL POPULATION
1,631
MALE POPULATION
1,778
FEMALE POPULATION
91.73
MALES / 100 FEMALES
109.01
FEMALES / 100 MALES
31.4
MEDIAN AGE
4.2
AVG FAMILY SIZE
3.6
AVG HOUSEHOLD SIZE
1,326
LABOR FORCE [ PEOPLE ]
57.4%
PERCENT IN LABOR FORCE
2.0%
UNEMPLOYMENT RATE
Teague Zip Codes
Teague Area Codes
Income in Teague
Income Overview in Teague
Per Capita Income in Teague is $22,779, while median incomes of families and households are $69,611 and $63,640 respectively.
| Characteristic | Number | Measure |
| Per Capita Income | 3,409 | $22,779 |
| Median Family Income | 704 | $69,611 |
| Mean Family Income | 704 | $84,310 |
| Median Household Income | 931 | $63,640 |
| Mean Household Income | 931 | $77,577 |
| Income Deficit | 704 | $0 |
| Wage / Income Gap (%) | 3,409 | 19.80% |
| Wage / Income Gap ($) | 3,409 | 80.20¢ per $1 |
| Gini / Inequality Index | 3,409 | 0.39 |
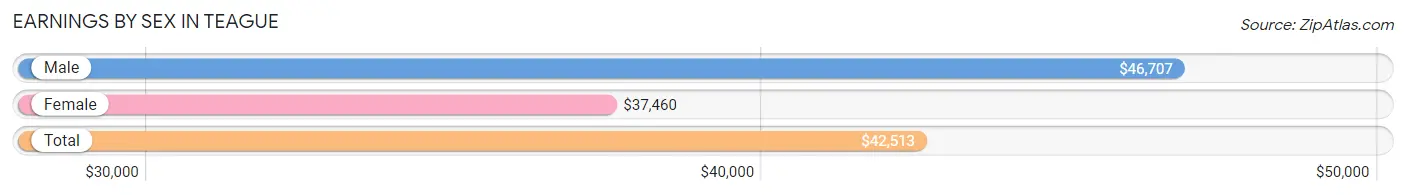
Earnings by Sex in Teague
Average Earnings in Teague are $42,513, $46,707 for men and $37,460 for women, a difference of 19.8%.
| Sex | Number | Average Earnings |
| Male | 690 (50.5%) | $46,707 |
| Female | 675 (49.4%) | $37,460 |
| Total | 1,365 (100.0%) | $42,513 |
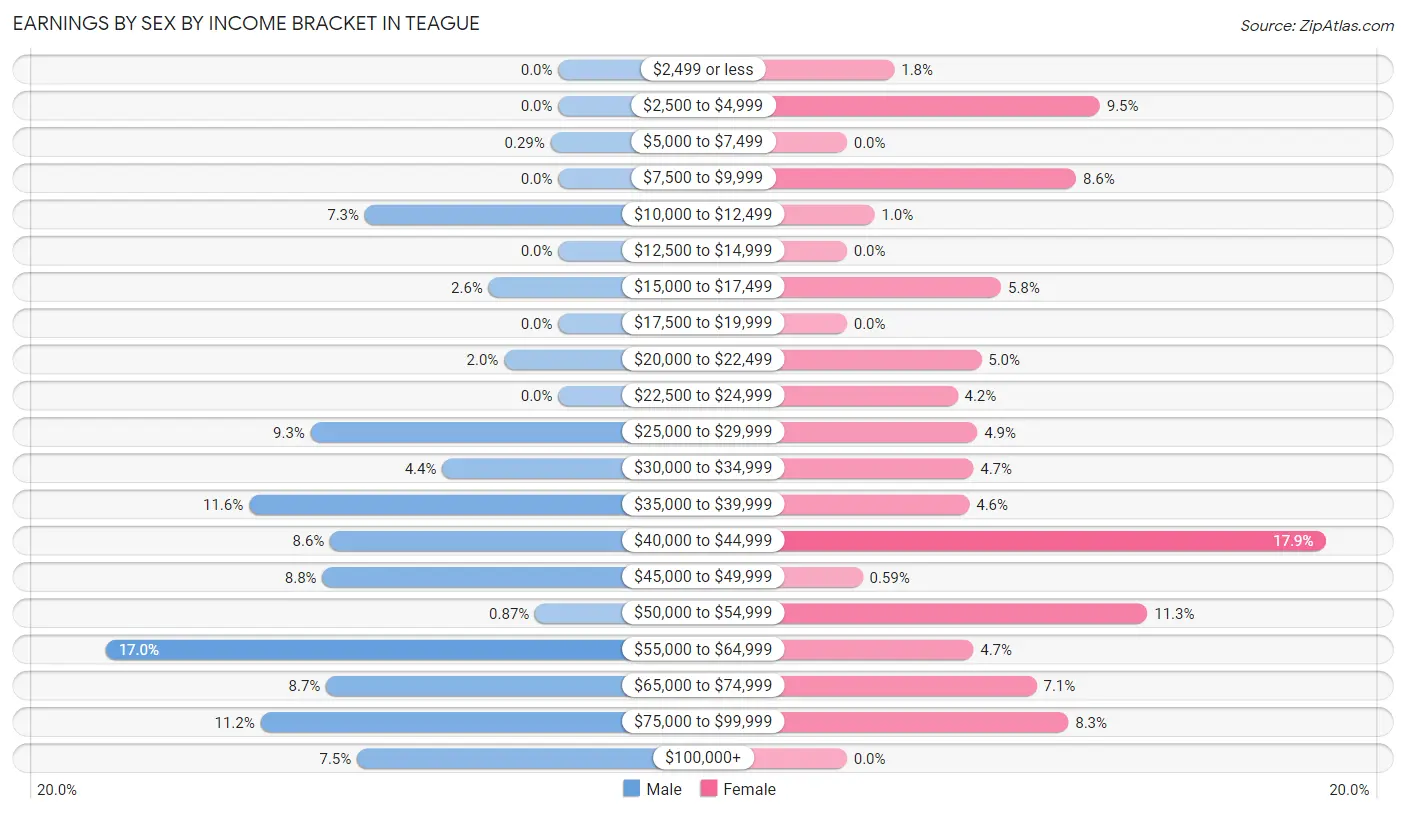
Earnings by Sex by Income Bracket in Teague
The most common earnings brackets in Teague are $55,000 to $64,999 for men (117 | 17.0%) and $40,000 to $44,999 for women (121 | 17.9%).
| Income | Male | Female |
| $2,499 or less | 0 (0.0%) | 12 (1.8%) |
| $2,500 to $4,999 | 0 (0.0%) | 64 (9.5%) |
| $5,000 to $7,499 | 2 (0.3%) | 0 (0.0%) |
| $7,500 to $9,999 | 0 (0.0%) | 58 (8.6%) |
| $10,000 to $12,499 | 50 (7.2%) | 7 (1.0%) |
| $12,500 to $14,999 | 0 (0.0%) | 0 (0.0%) |
| $15,000 to $17,499 | 18 (2.6%) | 39 (5.8%) |
| $17,500 to $19,999 | 0 (0.0%) | 0 (0.0%) |
| $20,000 to $22,499 | 14 (2.0%) | 34 (5.0%) |
| $22,500 to $24,999 | 0 (0.0%) | 28 (4.2%) |
| $25,000 to $29,999 | 64 (9.3%) | 33 (4.9%) |
| $30,000 to $34,999 | 30 (4.3%) | 32 (4.7%) |
| $35,000 to $39,999 | 80 (11.6%) | 31 (4.6%) |
| $40,000 to $44,999 | 59 (8.6%) | 121 (17.9%) |
| $45,000 to $49,999 | 61 (8.8%) | 4 (0.6%) |
| $50,000 to $54,999 | 6 (0.9%) | 76 (11.3%) |
| $55,000 to $64,999 | 117 (17.0%) | 32 (4.7%) |
| $65,000 to $74,999 | 60 (8.7%) | 48 (7.1%) |
| $75,000 to $99,999 | 77 (11.2%) | 56 (8.3%) |
| $100,000+ | 52 (7.5%) | 0 (0.0%) |
| Total | 690 (100.0%) | 675 (100.0%) |
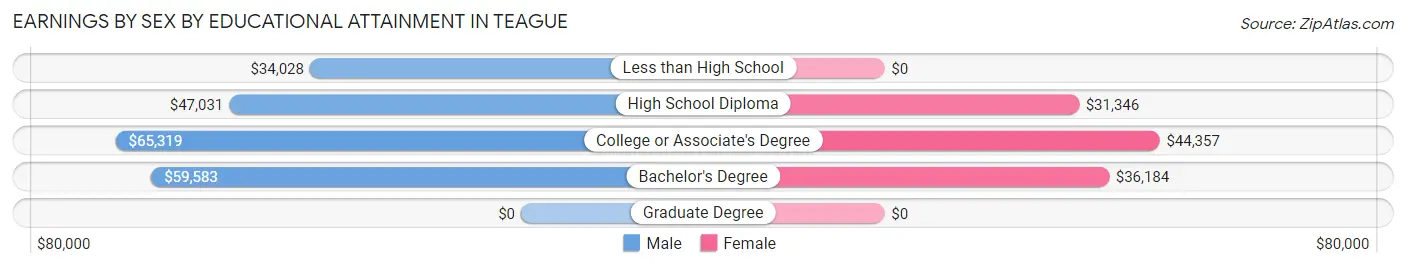
Earnings by Sex by Educational Attainment in Teague
Average earnings in Teague are $58,443 for men and $40,974 for women, a difference of 29.9%. Men with an educational attainment of college or associate's degree enjoy the highest average annual earnings of $65,319, while those with less than high school education earn the least with $34,028. Women with an educational attainment of college or associate's degree earn the most with the average annual earnings of $44,357, while those with high school diploma education have the smallest earnings of $31,346.
| Educational Attainment | Male Income | Female Income |
| Less than High School | $34,028 | $0 |
| High School Diploma | $47,031 | $31,346 |
| College or Associate's Degree | $65,319 | $44,357 |
| Bachelor's Degree | $59,583 | $36,184 |
| Graduate Degree | - | - |
| Total | $58,443 | $40,974 |
Family Income in Teague
Family Income Brackets in Teague
According to the Teague family income data, there are 248 families falling into the $50,000 to $74,999 income range, which is the most common income bracket and makes up 35.2% of all families.
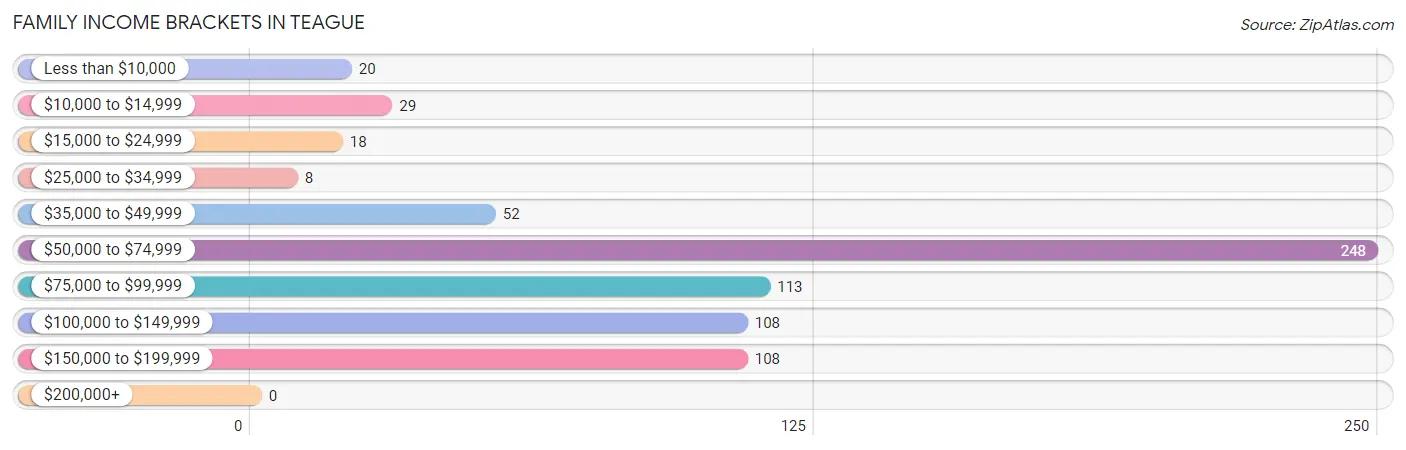
| Income Bracket | # Families | % Families |
| Less than $10,000 | 20 | 2.8% |
| $10,000 to $14,999 | 29 | 4.1% |
| $15,000 to $24,999 | 18 | 2.6% |
| $25,000 to $34,999 | 8 | 1.1% |
| $35,000 to $49,999 | 52 | 7.4% |
| $50,000 to $74,999 | 248 | 35.2% |
| $75,000 to $99,999 | 113 | 16.1% |
| $100,000 to $149,999 | 108 | 15.3% |
| $150,000 to $199,999 | 108 | 15.3% |
| $200,000+ | 0 | 0.0% |
Family Income by Famaliy Size in Teague
4-person families (72 | 10.2%) account for the highest median family income in Teague with $161,389 per family, while 4-person families (72 | 10.2%) have the highest median income of $40,347 per family member.
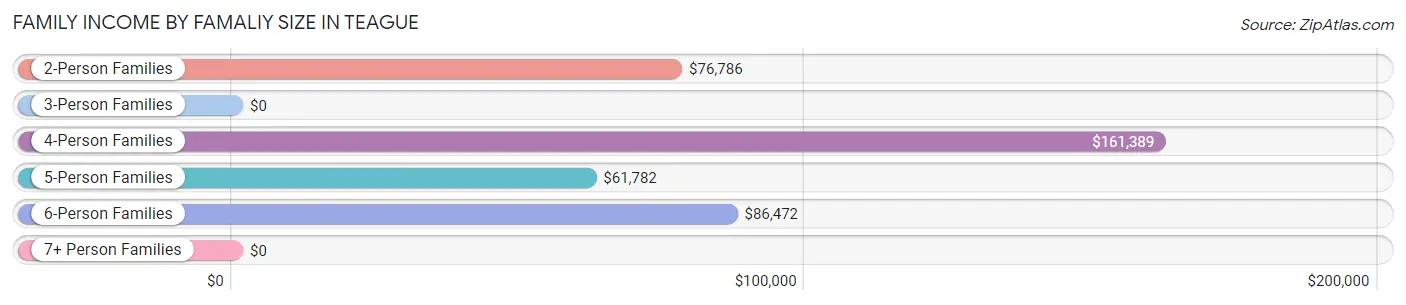
| Income Bracket | # Families | Median Income |
| 2-Person Families | 228 (32.4%) | $76,786 |
| 3-Person Families | 86 (12.2%) | $0 |
| 4-Person Families | 72 (10.2%) | $161,389 |
| 5-Person Families | 195 (27.7%) | $61,782 |
| 6-Person Families | 65 (9.2%) | $86,472 |
| 7+ Person Families | 58 (8.2%) | $0 |
| Total | 704 (100.0%) | $69,611 |
Family Income by Number of Earners in Teague
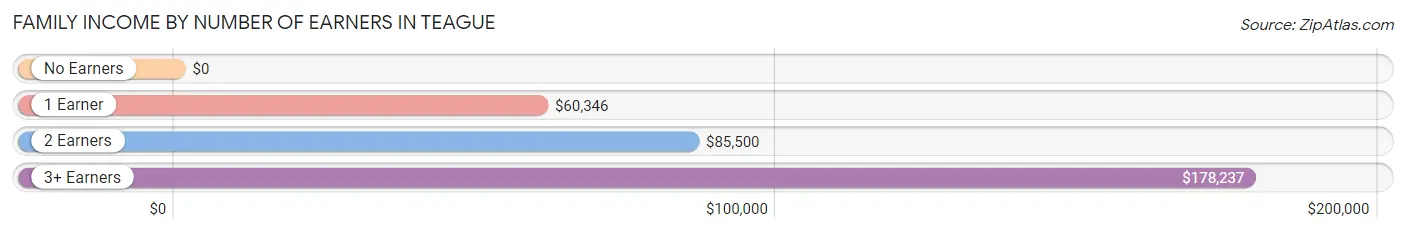
| Number of Earners | # Families | Median Income |
| No Earners | 112 (15.9%) | $0 |
| 1 Earner | 167 (23.7%) | $60,346 |
| 2 Earners | 350 (49.7%) | $85,500 |
| 3+ Earners | 75 (10.6%) | $178,237 |
| Total | 704 (100.0%) | $69,611 |
Household Income in Teague
Household Income Brackets in Teague
With 267 households falling in the category, the $50,000 to $74,999 income range is the most frequent in Teague, accounting for 28.7% of all households.
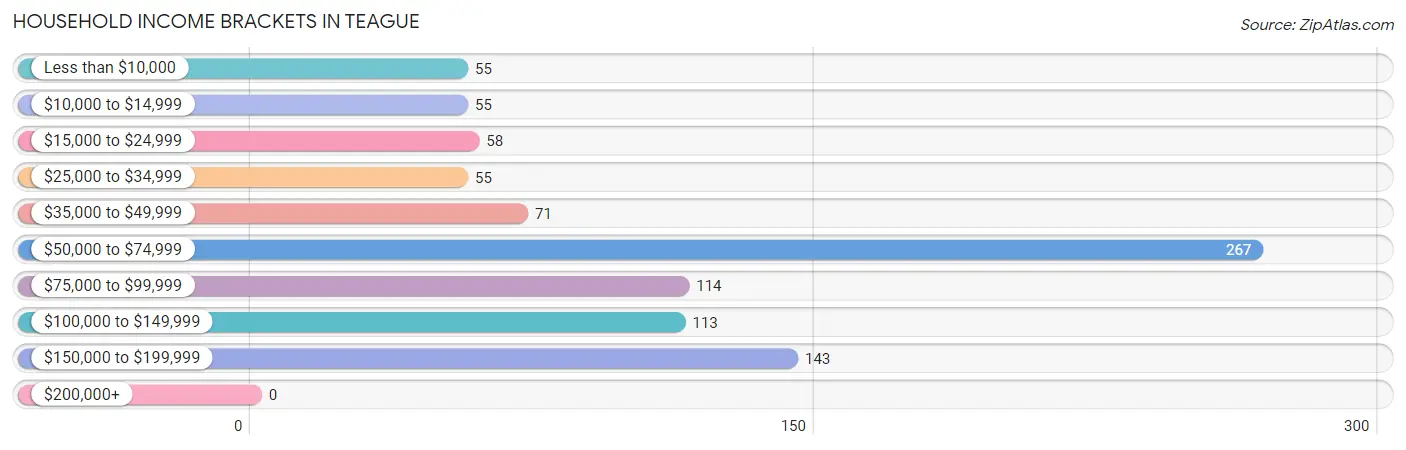
| Income Bracket | # Households | % Households |
| Less than $10,000 | 55 | 5.9% |
| $10,000 to $14,999 | 55 | 5.9% |
| $15,000 to $24,999 | 58 | 6.2% |
| $25,000 to $34,999 | 55 | 5.9% |
| $35,000 to $49,999 | 71 | 7.6% |
| $50,000 to $74,999 | 267 | 28.7% |
| $75,000 to $99,999 | 114 | 12.2% |
| $100,000 to $149,999 | 113 | 12.1% |
| $150,000 to $199,999 | 143 | 15.4% |
| $200,000+ | 0 | 0.0% |
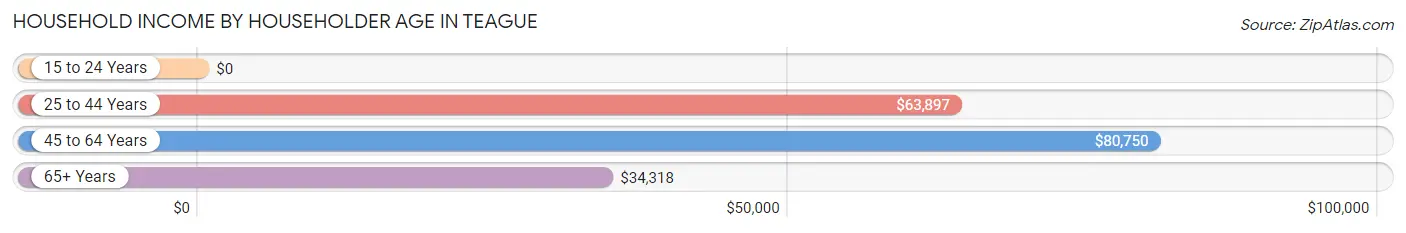
Household Income by Householder Age in Teague
The median household income in Teague is $63,640, with the highest median household income of $80,750 found in the 45 to 64 years age bracket for the primary householder. A total of 267 households (28.7%) fall into this category.
| Income Bracket | # Households | Median Income |
| 15 to 24 Years | 0 (0.0%) | $0 |
| 25 to 44 Years | 432 (46.4%) | $63,897 |
| 45 to 64 Years | 267 (28.7%) | $80,750 |
| 65+ Years | 232 (24.9%) | $34,318 |
| Total | 931 (100.0%) | $63,640 |
Poverty in Teague
Income Below Poverty by Sex and Age in Teague
With 18.1% poverty level for males and 13.0% for females among the residents of Teague, 35 to 44 year old males and 5 year old females are the most vulnerable to poverty, with 149 males (59.6%) and 25 females (100.0%) in their respective age groups living below the poverty level.
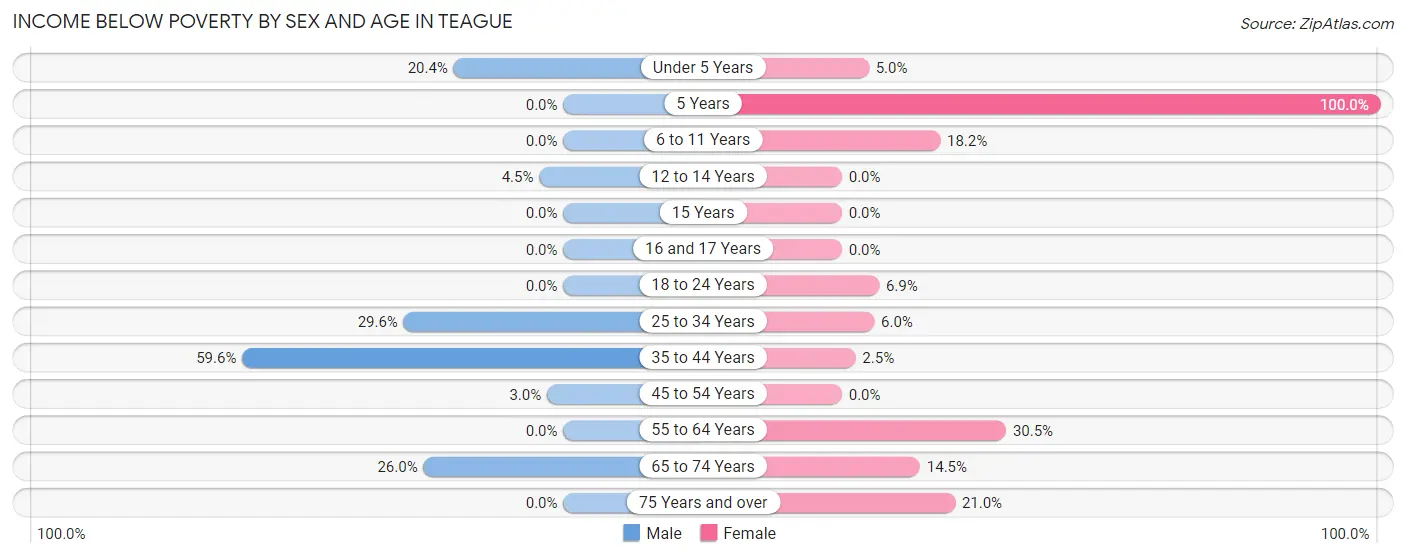
| Age Bracket | Male | Female |
| Under 5 Years | 46 (20.3%) | 7 (5.0%) |
| 5 Years | 0 (0.0%) | 25 (100.0%) |
| 6 to 11 Years | 0 (0.0%) | 54 (18.2%) |
| 12 to 14 Years | 5 (4.5%) | 0 (0.0%) |
| 15 Years | 0 (0.0%) | 0 (0.0%) |
| 16 and 17 Years | 0 (0.0%) | 0 (0.0%) |
| 18 to 24 Years | 0 (0.0%) | 6 (6.9%) |
| 25 to 34 Years | 64 (29.6%) | 20 (6.0%) |
| 35 to 44 Years | 149 (59.6%) | 4 (2.5%) |
| 45 to 54 Years | 4 (3.0%) | 0 (0.0%) |
| 55 to 64 Years | 0 (0.0%) | 71 (30.5%) |
| 65 to 74 Years | 27 (26.0%) | 20 (14.5%) |
| 75 Years and over | 0 (0.0%) | 21 (21.0%) |
| Total | 295 (18.1%) | 228 (13.0%) |
Income Above Poverty by Sex and Age in Teague
According to the poverty statistics in Teague, males aged 6 to 11 years and females aged 12 to 14 years are the age groups that are most secure financially, with 100.0% of males and 100.0% of females in these age groups living above the poverty line.
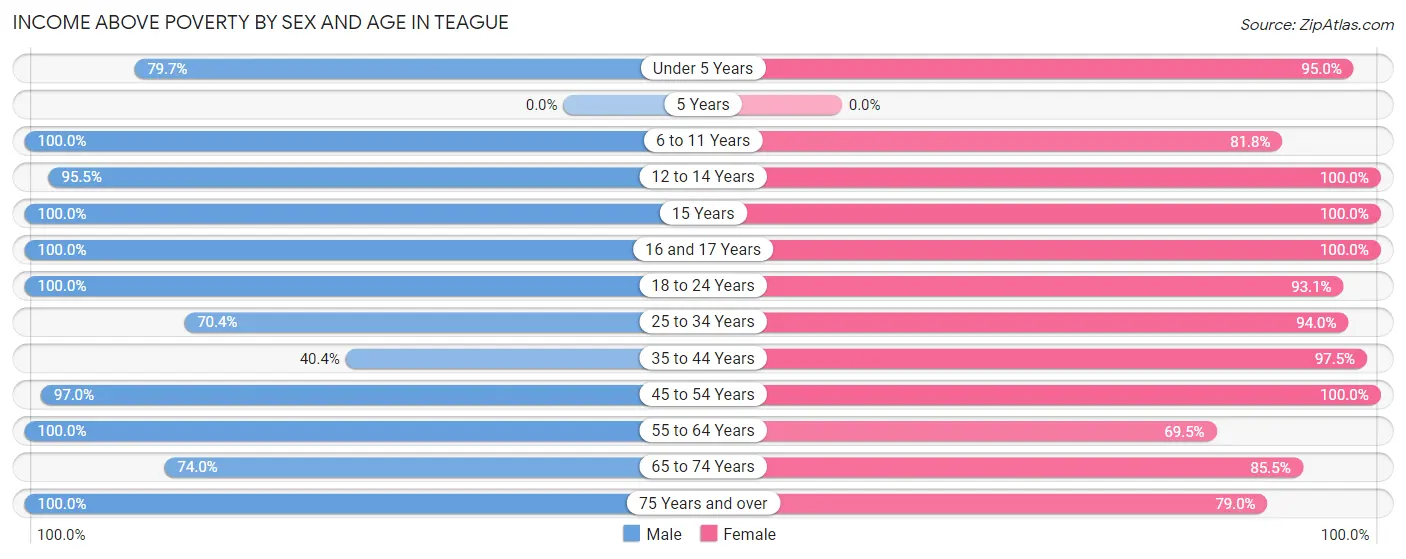
| Age Bracket | Male | Female |
| Under 5 Years | 180 (79.6%) | 133 (95.0%) |
| 5 Years | 0 (0.0%) | 0 (0.0%) |
| 6 to 11 Years | 182 (100.0%) | 242 (81.8%) |
| 12 to 14 Years | 107 (95.5%) | 45 (100.0%) |
| 15 Years | 53 (100.0%) | 20 (100.0%) |
| 16 and 17 Years | 26 (100.0%) | 45 (100.0%) |
| 18 to 24 Years | 158 (100.0%) | 81 (93.1%) |
| 25 to 34 Years | 152 (70.4%) | 314 (94.0%) |
| 35 to 44 Years | 101 (40.4%) | 154 (97.5%) |
| 45 to 54 Years | 128 (97.0%) | 130 (100.0%) |
| 55 to 64 Years | 154 (100.0%) | 162 (69.5%) |
| 65 to 74 Years | 77 (74.0%) | 118 (85.5%) |
| 75 Years and over | 12 (100.0%) | 79 (79.0%) |
| Total | 1,330 (81.9%) | 1,523 (87.0%) |
Income Below Poverty Among Married-Couple Families in Teague
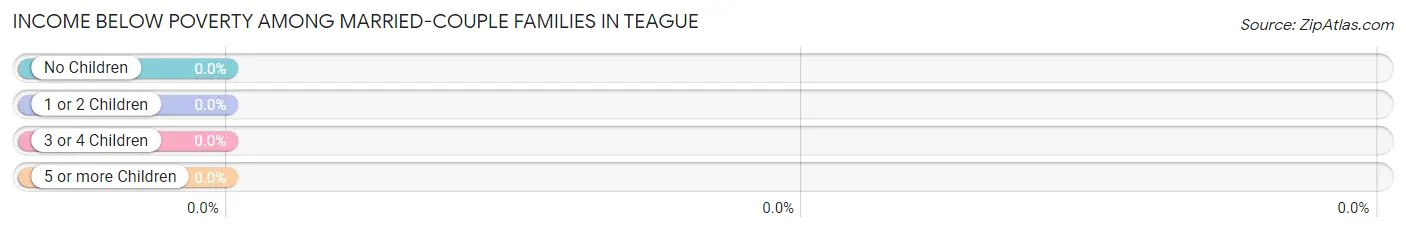
| Children | Above Poverty | Below Poverty |
| No Children | 175 (100.0%) | 0 (0.0%) |
| 1 or 2 Children | 218 (100.0%) | 0 (0.0%) |
| 3 or 4 Children | 122 (100.0%) | 0 (0.0%) |
| 5 or more Children | 34 (100.0%) | 0 (0.0%) |
| Total | 549 (100.0%) | 0 (0.0%) |
Income Below Poverty Among Single-Parent Households in Teague
According to the poverty data in Teague, 76.6% or 36 single-father households and 22.2% or 24 single-mother households are living below the poverty line. Among single-father households, those with 1 or 2 children have the highest poverty rate, with 36 households (97.3%) experiencing poverty. Likewise, among single-mother households, those with 1 or 2 children have the highest poverty rate, with 20 households (32.3%) falling below the poverty line.
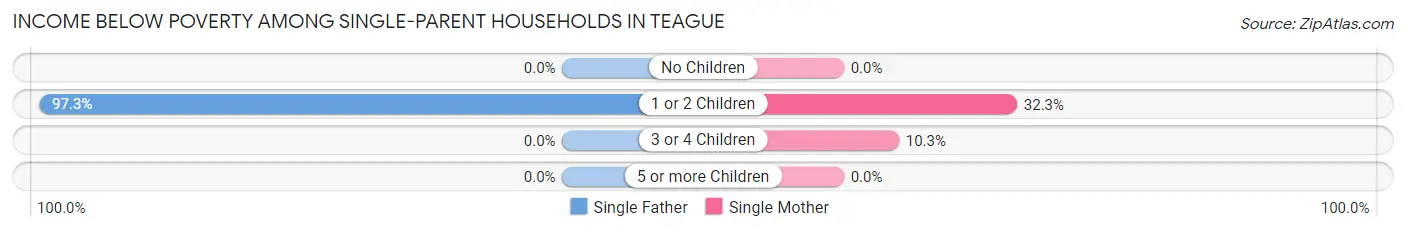
| Children | Single Father | Single Mother |
| No Children | 0 (0.0%) | 0 (0.0%) |
| 1 or 2 Children | 36 (97.3%) | 20 (32.3%) |
| 3 or 4 Children | 0 (0.0%) | 4 (10.3%) |
| 5 or more Children | 0 (0.0%) | 0 (0.0%) |
| Total | 36 (76.6%) | 24 (22.2%) |
Income Below Poverty Among Married-Couple vs Single-Parent Households in Teague
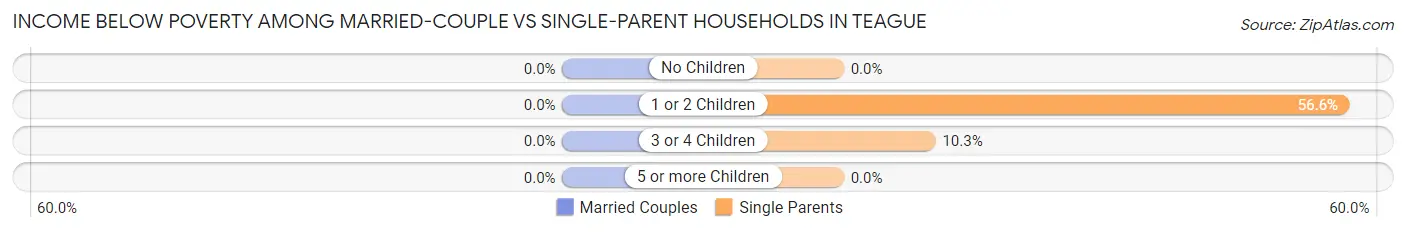
| Children | Married-Couple Families | Single-Parent Households |
| No Children | 0 (0.0%) | 0 (0.0%) |
| 1 or 2 Children | 0 (0.0%) | 56 (56.6%) |
| 3 or 4 Children | 0 (0.0%) | 4 (10.3%) |
| 5 or more Children | 0 (0.0%) | 0 (0.0%) |
| Total | 0 (0.0%) | 60 (38.7%) |
Race in Teague
The most populous races in Teague are White / Caucasian (1,808 | 53.0%), Hispanic or Latino (1,453 | 42.6%), and Two or more Races (736 | 21.6%).
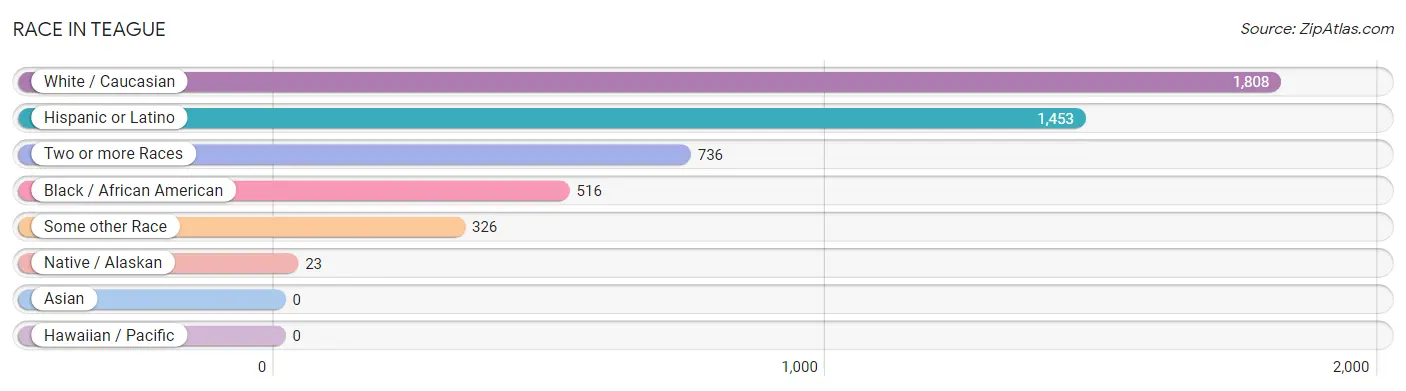
| Race | # Population | % Population |
| Asian | 0 | 0.0% |
| Black / African American | 516 | 15.1% |
| Hawaiian / Pacific | 0 | 0.0% |
| Hispanic or Latino | 1,453 | 42.6% |
| Native / Alaskan | 23 | 0.7% |
| White / Caucasian | 1,808 | 53.0% |
| Two or more Races | 736 | 21.6% |
| Some other Race | 326 | 9.6% |
| Total | 3,409 | 100.0% |
Ancestry in Teague
The most populous ancestries reported in Teague are Mexican (1,268 | 37.2%), English (216 | 6.3%), Central American (185 | 5.4%), Guatemalan (185 | 5.4%), and African (172 | 5.1%), together accounting for 59.5% of all Teague residents.
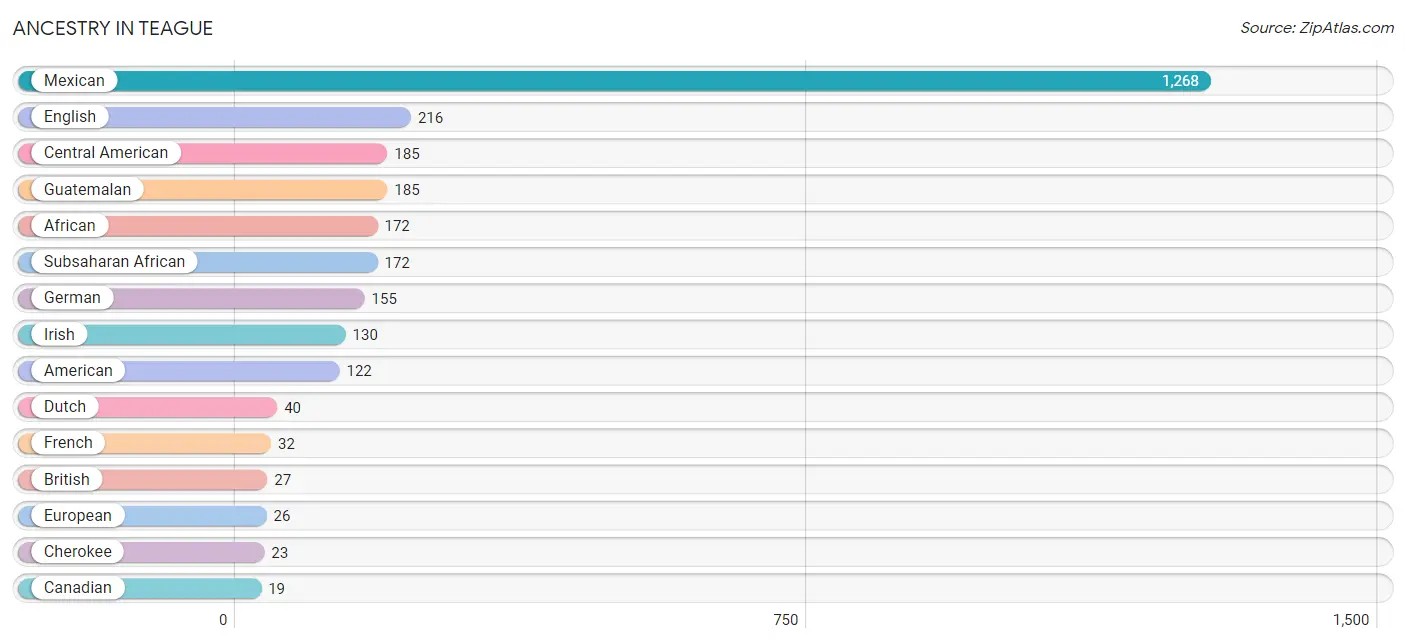
| Ancestry | # Population | % Population |
| African | 172 | 5.1% |
| American | 122 | 3.6% |
| British | 27 | 0.8% |
| Canadian | 19 | 0.6% |
| Central American | 185 | 5.4% |
| Cherokee | 23 | 0.7% |
| Dutch | 40 | 1.2% |
| English | 216 | 6.3% |
| European | 26 | 0.8% |
| French | 32 | 0.9% |
| German | 155 | 4.5% |
| Guatemalan | 185 | 5.4% |
| Irish | 130 | 3.8% |
| Italian | 11 | 0.3% |
| Mexican | 1,268 | 37.2% |
| New Zealander | 7 | 0.2% |
| Pennsylvania German | 3 | 0.1% |
| Polish | 4 | 0.1% |
| Scottish | 3 | 0.1% |
| Subsaharan African | 172 | 5.1% | View All 20 Rows |
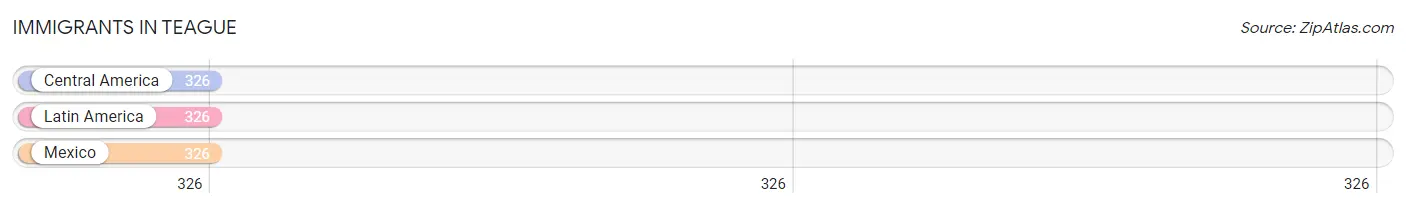
Immigrants in Teague
The most numerous immigrant groups reported in Teague came from Central America (326 | 9.6%), Latin America (326 | 9.6%), and Mexico (326 | 9.6%), together accounting for 28.7% of all Teague residents.
| Immigration Origin | # Population | % Population |
| Central America | 326 | 9.6% |
| Latin America | 326 | 9.6% |
| Mexico | 326 | 9.6% | View All 3 Rows |
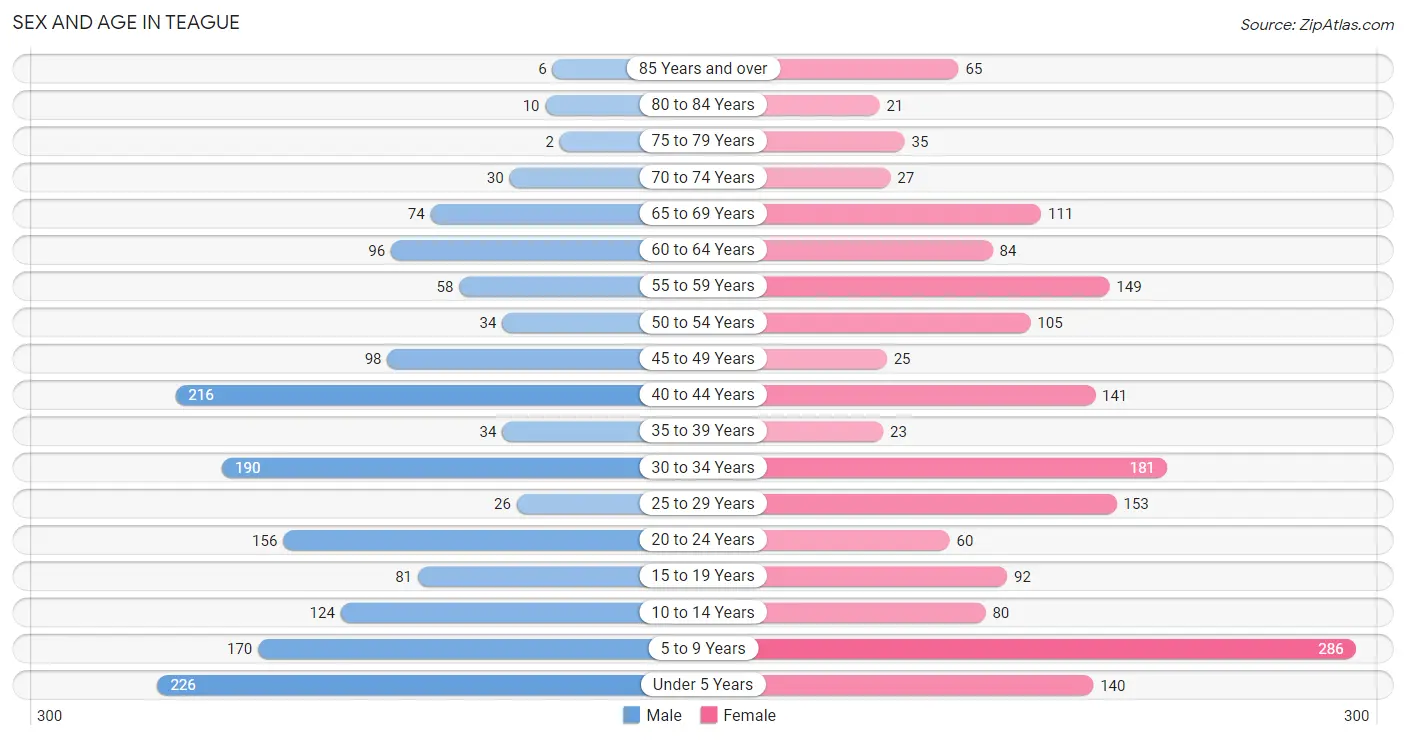
Sex and Age in Teague
Sex and Age in Teague
The most populous age groups in Teague are Under 5 Years (226 | 13.9%) for men and 5 to 9 Years (286 | 16.1%) for women.
| Age Bracket | Male | Female |
| Under 5 Years | 226 (13.9%) | 140 (7.9%) |
| 5 to 9 Years | 170 (10.4%) | 286 (16.1%) |
| 10 to 14 Years | 124 (7.6%) | 80 (4.5%) |
| 15 to 19 Years | 81 (5.0%) | 92 (5.2%) |
| 20 to 24 Years | 156 (9.6%) | 60 (3.4%) |
| 25 to 29 Years | 26 (1.6%) | 153 (8.6%) |
| 30 to 34 Years | 190 (11.7%) | 181 (10.2%) |
| 35 to 39 Years | 34 (2.1%) | 23 (1.3%) |
| 40 to 44 Years | 216 (13.2%) | 141 (7.9%) |
| 45 to 49 Years | 98 (6.0%) | 25 (1.4%) |
| 50 to 54 Years | 34 (2.1%) | 105 (5.9%) |
| 55 to 59 Years | 58 (3.6%) | 149 (8.4%) |
| 60 to 64 Years | 96 (5.9%) | 84 (4.7%) |
| 65 to 69 Years | 74 (4.5%) | 111 (6.2%) |
| 70 to 74 Years | 30 (1.8%) | 27 (1.5%) |
| 75 to 79 Years | 2 (0.1%) | 35 (2.0%) |
| 80 to 84 Years | 10 (0.6%) | 21 (1.2%) |
| 85 Years and over | 6 (0.4%) | 65 (3.7%) |
| Total | 1,631 (100.0%) | 1,778 (100.0%) |
Families and Households in Teague
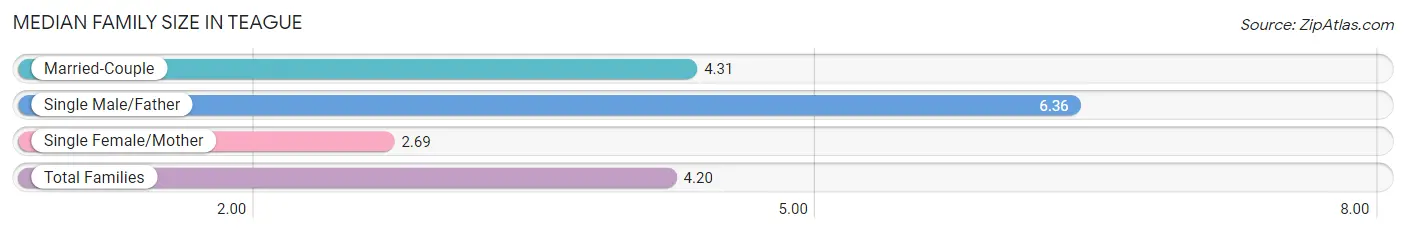
Median Family Size in Teague
The median family size in Teague is 4.20 persons per family, with single male/father families (47 | 6.7%) accounting for the largest median family size of 6.36 persons per family. On the other hand, single female/mother families (108 | 15.3%) represent the smallest median family size with 2.69 persons per family.
| Family Type | # Families | Family Size |
| Married-Couple | 549 (78.0%) | 4.31 |
| Single Male/Father | 47 (6.7%) | 6.36 |
| Single Female/Mother | 108 (15.3%) | 2.69 |
| Total Families | 704 (100.0%) | 4.20 |
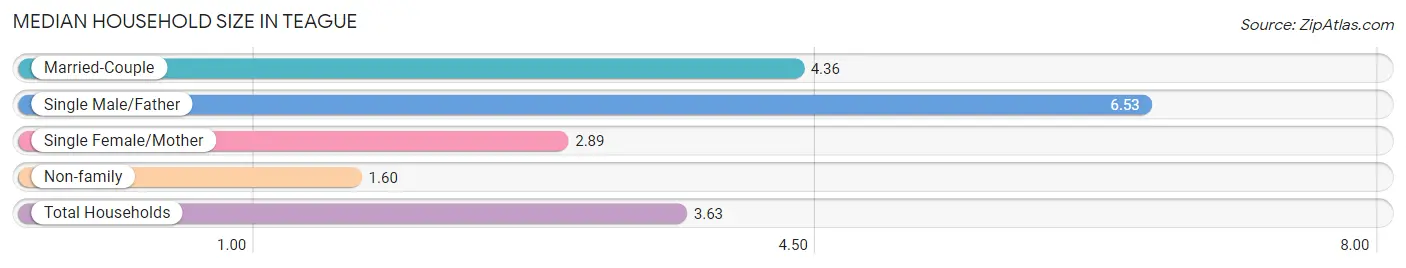
Median Household Size in Teague
The median household size in Teague is 3.63 persons per household, with single male/father households (47 | 5.1%) accounting for the largest median household size of 6.53 persons per household. non-family households (227 | 24.4%) represent the smallest median household size with 1.60 persons per household.
| Household Type | # Households | Household Size |
| Married-Couple | 549 (59.0%) | 4.36 |
| Single Male/Father | 47 (5.1%) | 6.53 |
| Single Female/Mother | 108 (11.6%) | 2.89 |
| Non-family | 227 (24.4%) | 1.60 |
| Total Households | 931 (100.0%) | 3.63 |
Household Size by Marriage Status in Teague
Out of a total of 931 households in Teague, 704 (75.6%) are family households, while 227 (24.4%) are nonfamily households. The most numerous type of family households are 2-person households, comprising 208, and the most common type of nonfamily households are 1-person households, comprising 171.
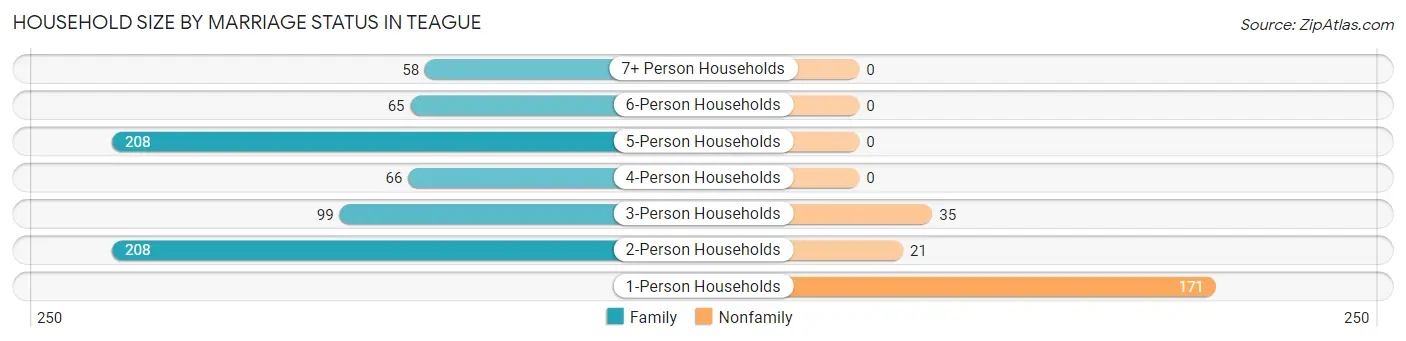
| Household Size | Family Households | Nonfamily Households |
| 1-Person Households | - | 171 (18.4%) |
| 2-Person Households | 208 (22.3%) | 21 (2.3%) |
| 3-Person Households | 99 (10.6%) | 35 (3.8%) |
| 4-Person Households | 66 (7.1%) | 0 (0.0%) |
| 5-Person Households | 208 (22.3%) | 0 (0.0%) |
| 6-Person Households | 65 (7.0%) | 0 (0.0%) |
| 7+ Person Households | 58 (6.2%) | 0 (0.0%) |
| Total | 704 (75.6%) | 227 (24.4%) |
Female Fertility in Teague
Fertility by Age in Teague
Average fertility rate in Teague is 122.0 births per 1,000 women. Women in the age bracket of 20 to 34 years have the highest fertility rate with 228.0 births per 1,000 women. Women in the age bracket of 20 to 34 years acount for 100.0% of all women with births.
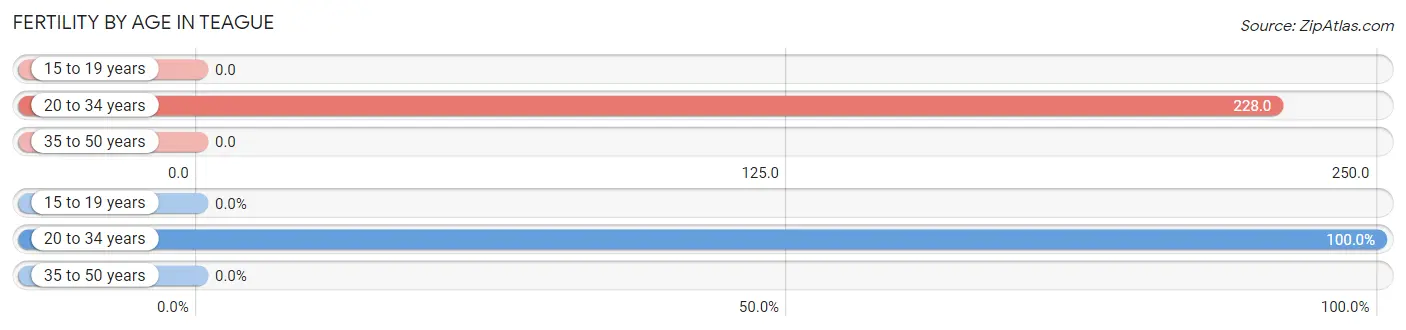
| Age Bracket | Women with Births | Births / 1,000 Women |
| 15 to 19 years | 0 (0.0%) | 0.0 |
| 20 to 34 years | 90 (100.0%) | 228.0 |
| 35 to 50 years | 0 (0.0%) | 0.0 |
| Total | 90 (100.0%) | 122.0 |
Fertility by Age by Marriage Status in Teague
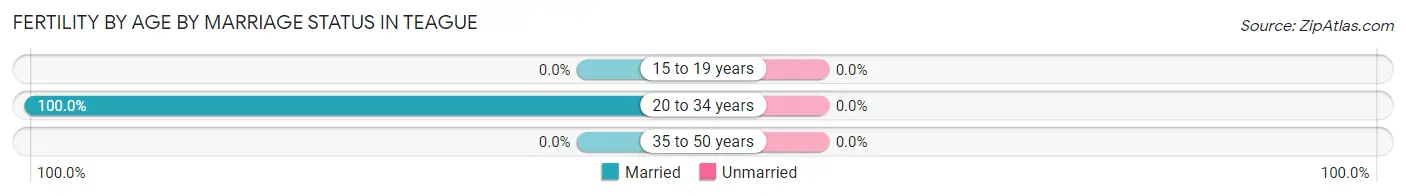
| Age Bracket | Married | Unmarried |
| 15 to 19 years | 0 (0.0%) | 0 (0.0%) |
| 20 to 34 years | 90 (100.0%) | 0 (0.0%) |
| 35 to 50 years | 0 (0.0%) | 0 (0.0%) |
| Total | 90 (100.0%) | 0 (0.0%) |
Fertility by Education in Teague
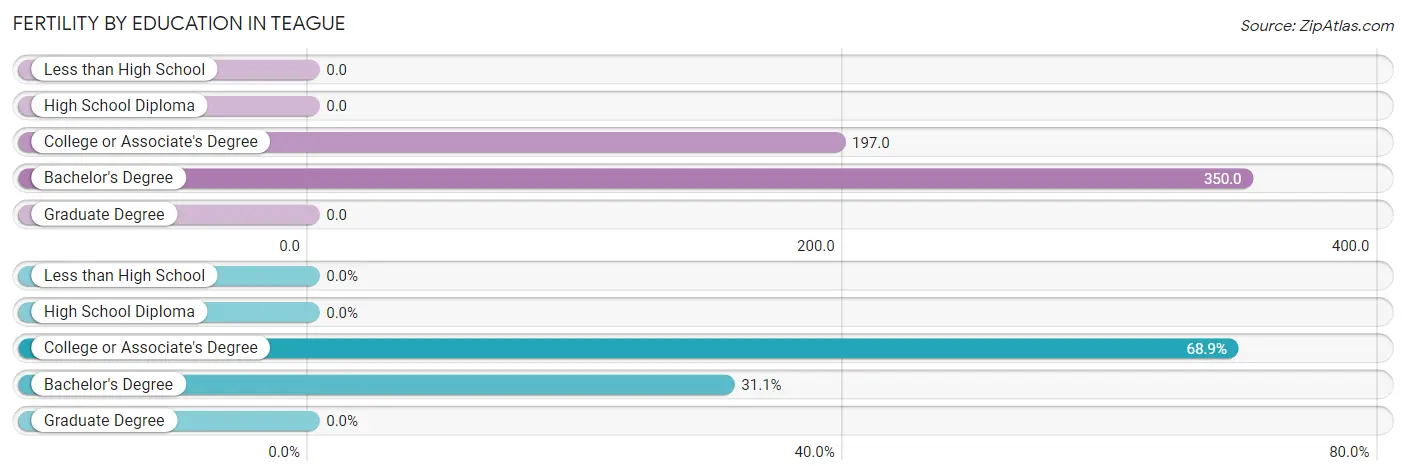
| Educational Attainment | Women with Births | Births / 1,000 Women |
| Less than High School | 0 (0.0%) | 0.0 |
| High School Diploma | 0 (0.0%) | 0.0 |
| College or Associate's Degree | 62 (68.9%) | 197.0 |
| Bachelor's Degree | 28 (31.1%) | 350.0 |
| Graduate Degree | 0 (0.0%) | 0.0 |
| Total | 90 (100.0%) | 122.0 |
Fertility by Education by Marriage Status in Teague
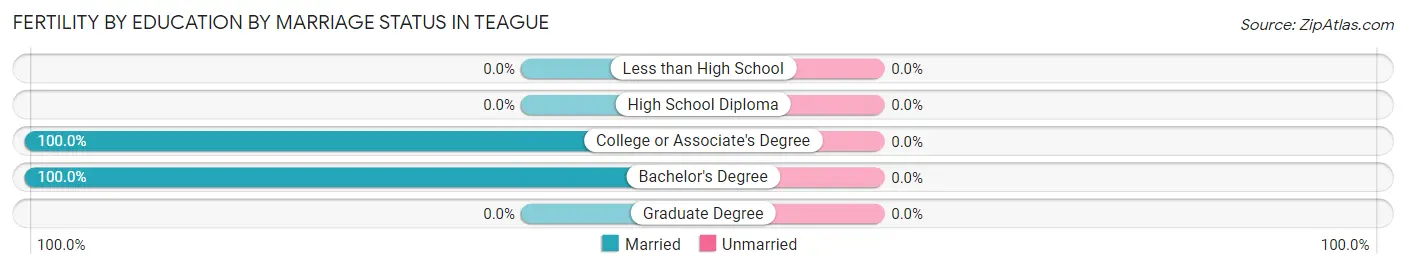
| Educational Attainment | Married | Unmarried |
| Less than High School | 0 (0.0%) | 0 (0.0%) |
| High School Diploma | 0 (0.0%) | 0 (0.0%) |
| College or Associate's Degree | 62 (100.0%) | 0 (0.0%) |
| Bachelor's Degree | 28 (100.0%) | 0 (0.0%) |
| Graduate Degree | 0 (0.0%) | 0 (0.0%) |
| Total | 90 (100.0%) | 0 (0.0%) |
Employment Characteristics in Teague
Employment by Class of Employer in Teague
Among the 1,299 employed individuals in Teague, private company employees (961 | 74.0%), state government employees (166 | 12.8%), and self-employed (not incorporated) (103 | 7.9%) make up the most common classes of employment.
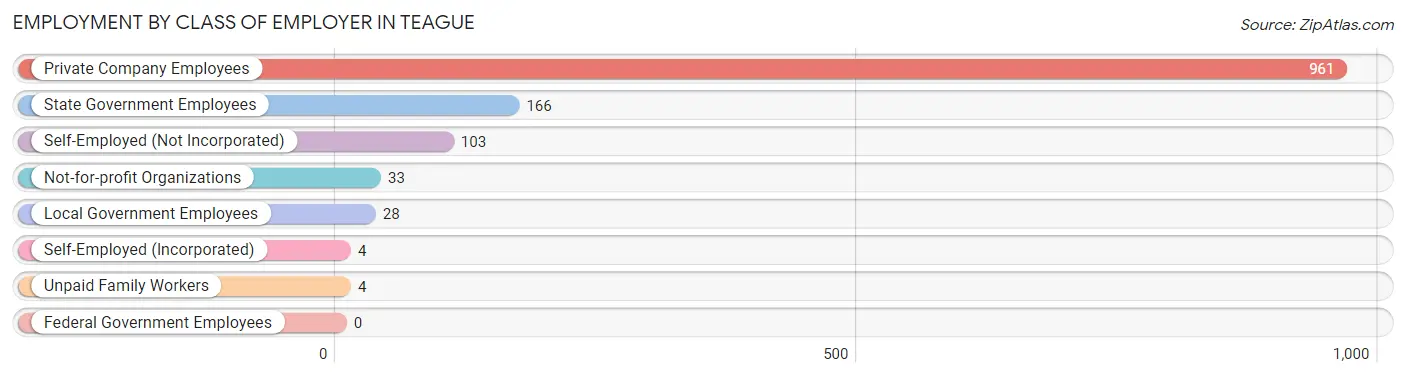
| Employer Class | # Employees | % Employees |
| Private Company Employees | 961 | 74.0% |
| Self-Employed (Incorporated) | 4 | 0.3% |
| Self-Employed (Not Incorporated) | 103 | 7.9% |
| Not-for-profit Organizations | 33 | 2.5% |
| Local Government Employees | 28 | 2.2% |
| State Government Employees | 166 | 12.8% |
| Federal Government Employees | 0 | 0.0% |
| Unpaid Family Workers | 4 | 0.3% |
| Total | 1,299 | 100.0% |
Employment Status by Age in Teague
According to the labor force statistics for Teague, out of the total population over 16 years of age (2,310), 57.4% or 1,326 individuals are in the labor force, with 2.0% or 27 of them unemployed. The age group with the highest labor force participation rate is 20 to 24 years, with 89.8% or 194 individuals in the labor force. Within the labor force, the 16 to 19 years age range has the highest percentage of unemployed individuals, with 100.0% or 2 of them being unemployed.
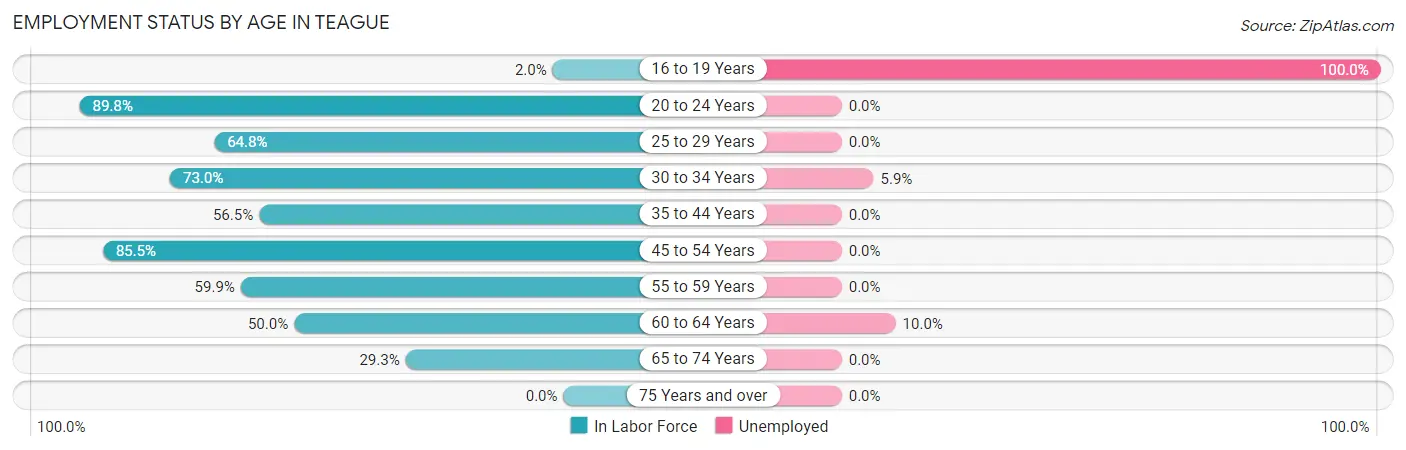
| Age Bracket | In Labor Force | Unemployed |
| 16 to 19 Years | 2 (2.0%) | 2 (100.0%) |
| 20 to 24 Years | 194 (89.8%) | 0 (0.0%) |
| 25 to 29 Years | 116 (64.8%) | 0 (0.0%) |
| 30 to 34 Years | 271 (73.0%) | 16 (5.9%) |
| 35 to 44 Years | 234 (56.5%) | 0 (0.0%) |
| 45 to 54 Years | 224 (85.5%) | 0 (0.0%) |
| 55 to 59 Years | 124 (59.9%) | 0 (0.0%) |
| 60 to 64 Years | 90 (50.0%) | 9 (10.0%) |
| 65 to 74 Years | 71 (29.3%) | 0 (0.0%) |
| 75 Years and over | 0 (0.0%) | 0 (0.0%) |
| Total | 1,326 (57.4%) | 27 (2.0%) |
Employment Status by Educational Attainment in Teague
According to labor force statistics for Teague, 65.7% of individuals (1,060) out of the total population between 25 and 64 years of age (1,613) are in the labor force, with 2.4% or 25 of them being unemployed. The group with the highest labor force participation rate are those with the educational attainment of less than high school, with 84.0% or 168 individuals in the labor force. Within the labor force, individuals with high school diploma education have the highest percentage of unemployment, with 16.3% or 25 of them being unemployed.
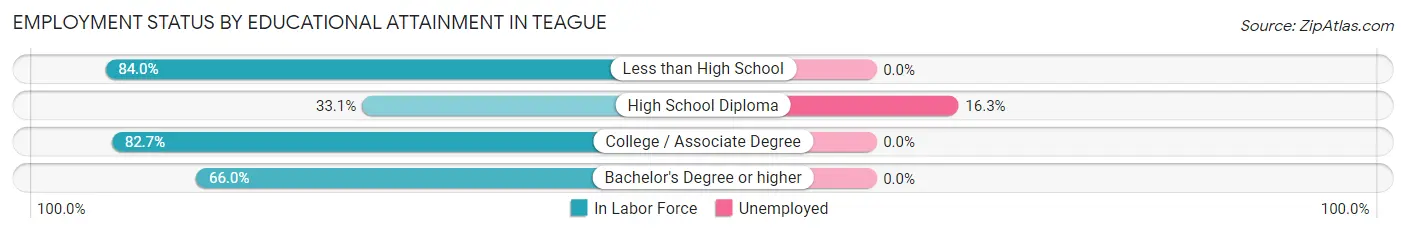
| Educational Attainment | In Labor Force | Unemployed |
| Less than High School | 168 (84.0%) | 0 (0.0%) |
| High School Diploma | 153 (33.1%) | 75 (16.3%) |
| College / Associate Degree | 548 (82.7%) | 0 (0.0%) |
| Bachelor's Degree or higher | 190 (66.0%) | 0 (0.0%) |
| Total | 1,060 (65.7%) | 39 (2.4%) |
Employment Occupations by Sex in Teague
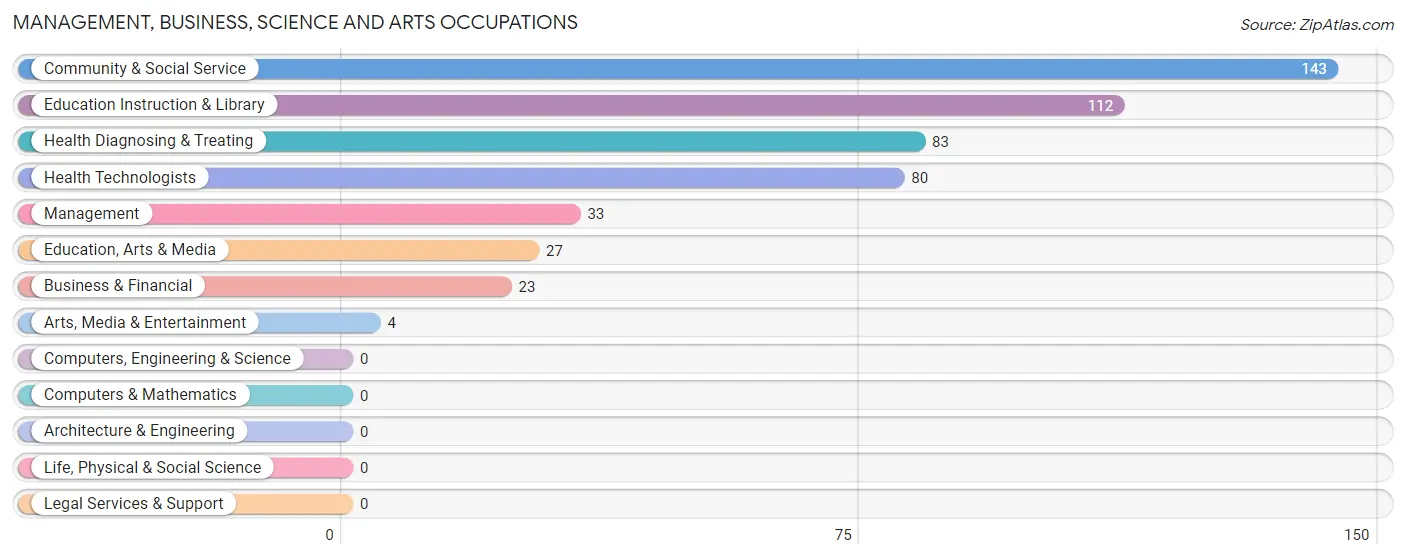
Management, Business, Science and Arts Occupations
The most common Management, Business, Science and Arts occupations in Teague are Community & Social Service (143 | 11.0%), Education Instruction & Library (112 | 8.6%), Health Diagnosing & Treating (83 | 6.4%), Health Technologists (80 | 6.2%), and Management (33 | 2.5%).
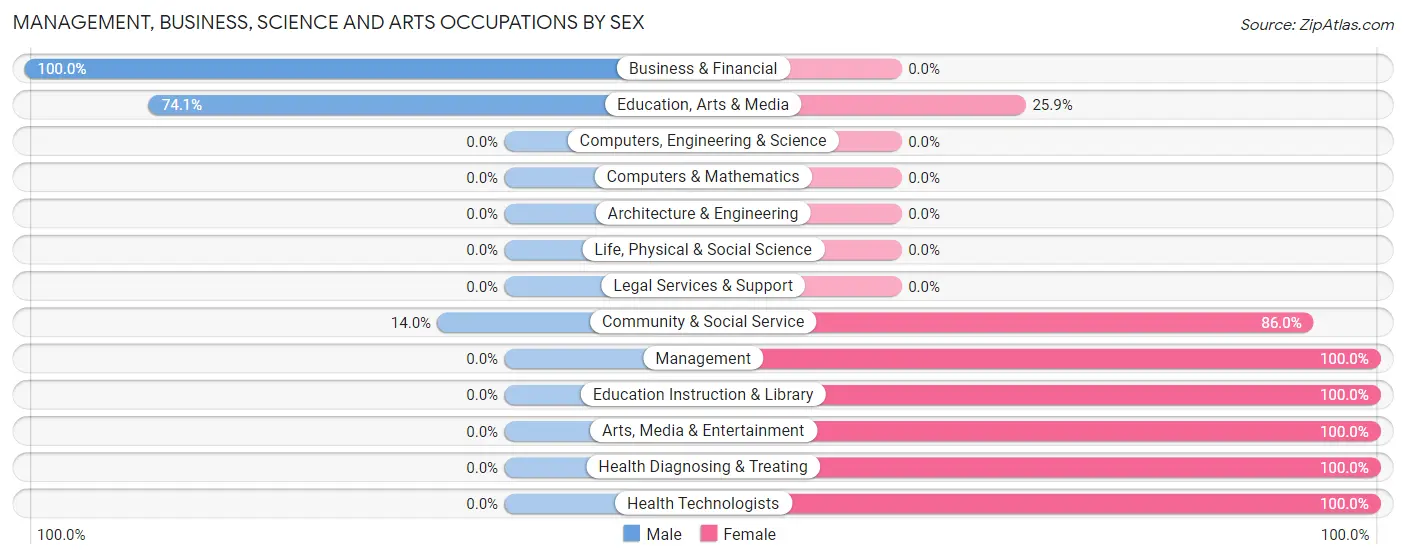
Management, Business, Science and Arts Occupations by Sex
Within the Management, Business, Science and Arts occupations in Teague, the most male-oriented occupations are Business & Financial (100.0%), Education, Arts & Media (74.1%), and Community & Social Service (14.0%), while the most female-oriented occupations are Management (100.0%), Education Instruction & Library (100.0%), and Arts, Media & Entertainment (100.0%).
| Occupation | Male | Female |
| Management | 0 (0.0%) | 33 (100.0%) |
| Business & Financial | 23 (100.0%) | 0 (0.0%) |
| Computers, Engineering & Science | 0 (0.0%) | 0 (0.0%) |
| Computers & Mathematics | 0 (0.0%) | 0 (0.0%) |
| Architecture & Engineering | 0 (0.0%) | 0 (0.0%) |
| Life, Physical & Social Science | 0 (0.0%) | 0 (0.0%) |
| Community & Social Service | 20 (14.0%) | 123 (86.0%) |
| Education, Arts & Media | 20 (74.1%) | 7 (25.9%) |
| Legal Services & Support | 0 (0.0%) | 0 (0.0%) |
| Education Instruction & Library | 0 (0.0%) | 112 (100.0%) |
| Arts, Media & Entertainment | 0 (0.0%) | 4 (100.0%) |
| Health Diagnosing & Treating | 0 (0.0%) | 83 (100.0%) |
| Health Technologists | 0 (0.0%) | 80 (100.0%) |
| Total (Category) | 43 (15.2%) | 239 (84.8%) |
| Total (Overall) | 663 (51.0%) | 636 (49.0%) |
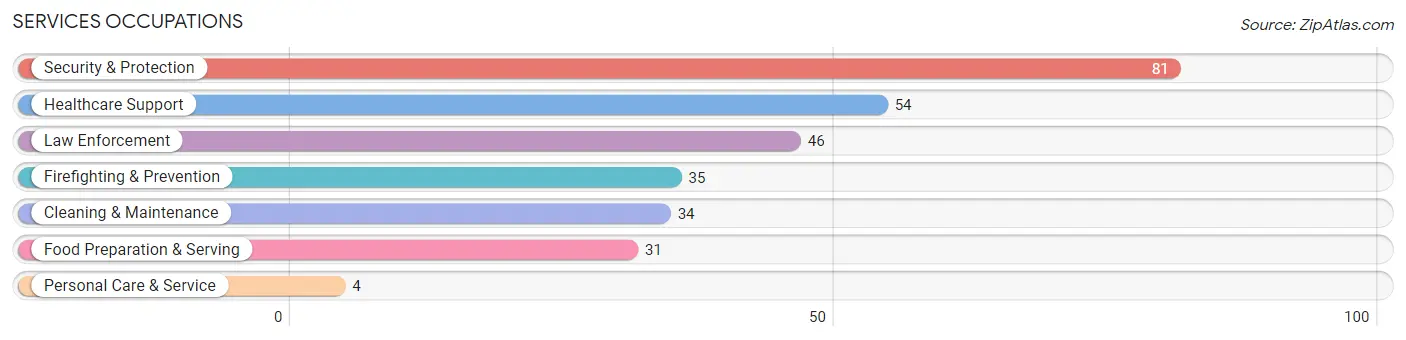
Services Occupations
The most common Services occupations in Teague are Security & Protection (81 | 6.2%), Healthcare Support (54 | 4.2%), Law Enforcement (46 | 3.5%), Firefighting & Prevention (35 | 2.7%), and Cleaning & Maintenance (34 | 2.6%).
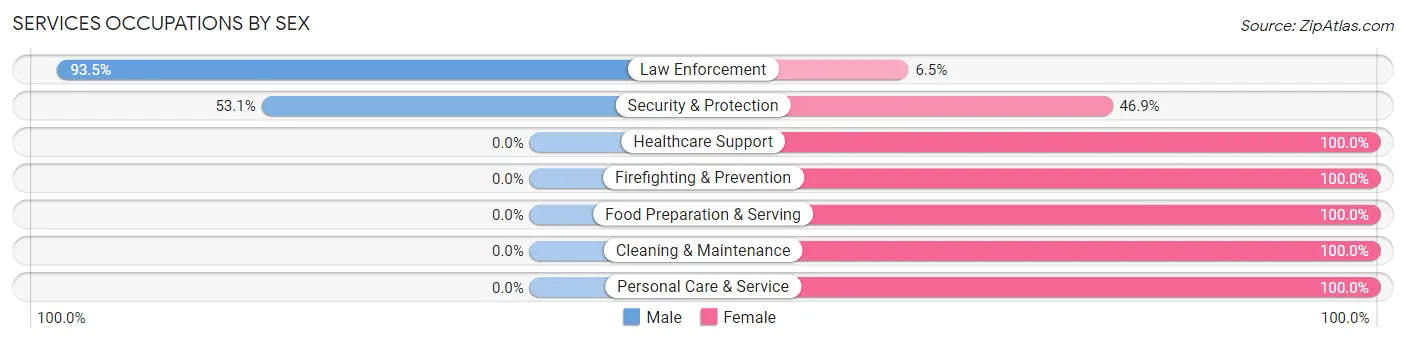
Services Occupations by Sex
Within the Services occupations in Teague, the most male-oriented occupations are Law Enforcement (93.5%), and Security & Protection (53.1%), while the most female-oriented occupations are Healthcare Support (100.0%), Firefighting & Prevention (100.0%), and Food Preparation & Serving (100.0%).
| Occupation | Male | Female |
| Healthcare Support | 0 (0.0%) | 54 (100.0%) |
| Security & Protection | 43 (53.1%) | 38 (46.9%) |
| Firefighting & Prevention | 0 (0.0%) | 35 (100.0%) |
| Law Enforcement | 43 (93.5%) | 3 (6.5%) |
| Food Preparation & Serving | 0 (0.0%) | 31 (100.0%) |
| Cleaning & Maintenance | 0 (0.0%) | 34 (100.0%) |
| Personal Care & Service | 0 (0.0%) | 4 (100.0%) |
| Total (Category) | 43 (21.1%) | 161 (78.9%) |
| Total (Overall) | 663 (51.0%) | 636 (49.0%) |
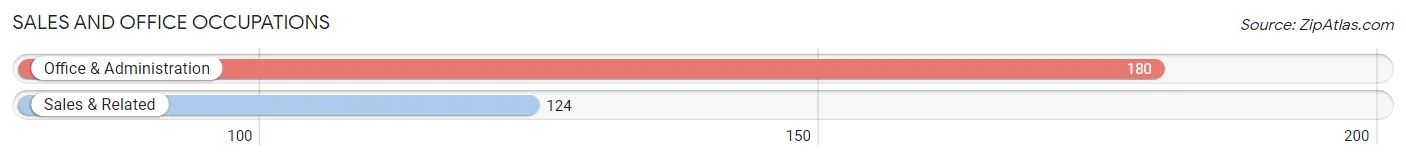
Sales and Office Occupations
The most common Sales and Office occupations in Teague are Office & Administration (180 | 13.9%), and Sales & Related (124 | 9.6%).
Sales and Office Occupations by Sex
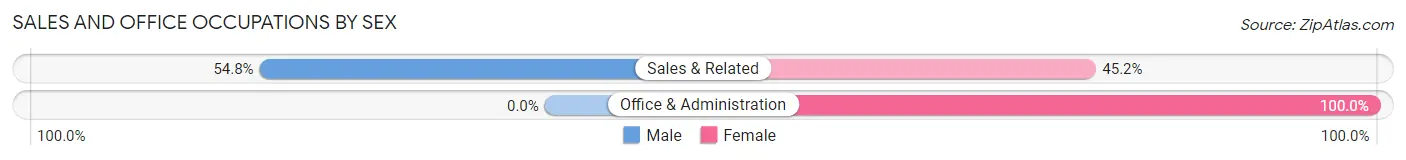
| Occupation | Male | Female |
| Sales & Related | 68 (54.8%) | 56 (45.2%) |
| Office & Administration | 0 (0.0%) | 180 (100.0%) |
| Total (Category) | 68 (22.4%) | 236 (77.6%) |
| Total (Overall) | 663 (51.0%) | 636 (49.0%) |
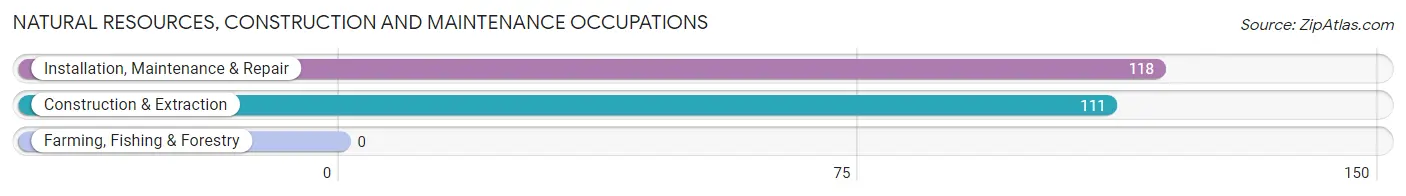
Natural Resources, Construction and Maintenance Occupations
The most common Natural Resources, Construction and Maintenance occupations in Teague are Installation, Maintenance & Repair (118 | 9.1%), and Construction & Extraction (111 | 8.6%).
Natural Resources, Construction and Maintenance Occupations by Sex
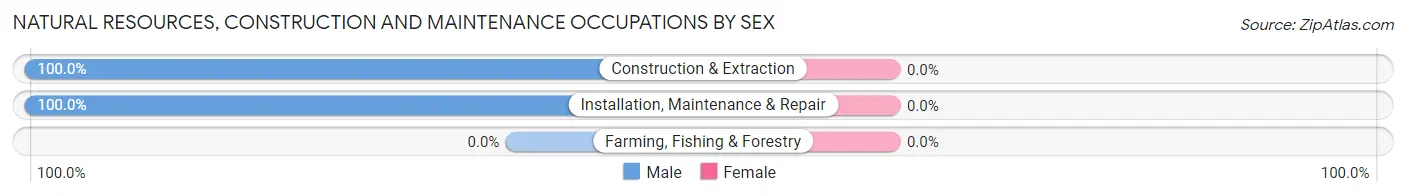
| Occupation | Male | Female |
| Farming, Fishing & Forestry | 0 (0.0%) | 0 (0.0%) |
| Construction & Extraction | 111 (100.0%) | 0 (0.0%) |
| Installation, Maintenance & Repair | 118 (100.0%) | 0 (0.0%) |
| Total (Category) | 229 (100.0%) | 0 (0.0%) |
| Total (Overall) | 663 (51.0%) | 636 (49.0%) |
Production, Transportation and Moving Occupations
The most common Production, Transportation and Moving occupations in Teague are Production (142 | 10.9%), and Transportation (138 | 10.6%).
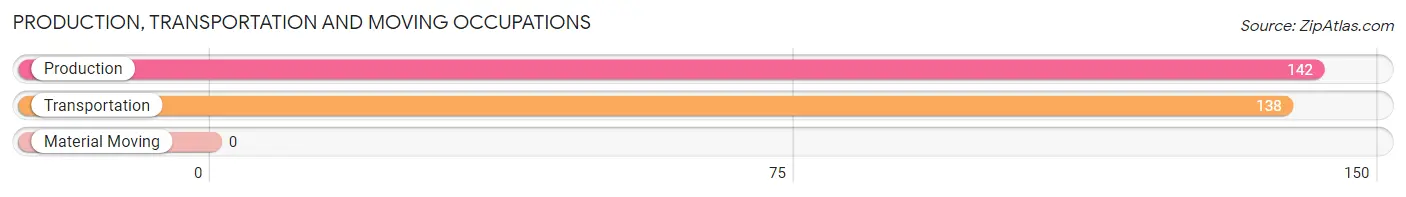
Production, Transportation and Moving Occupations by Sex
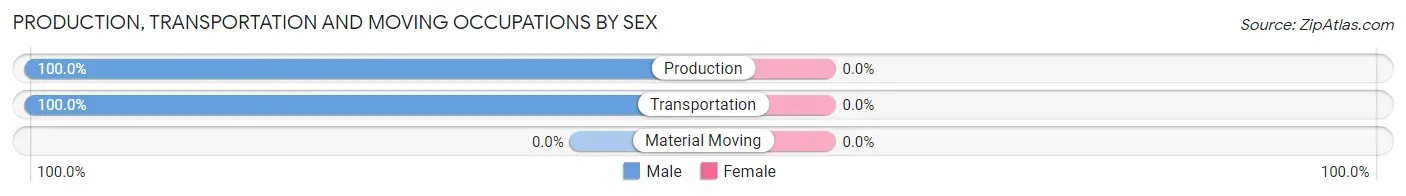
| Occupation | Male | Female |
| Production | 142 (100.0%) | 0 (0.0%) |
| Transportation | 138 (100.0%) | 0 (0.0%) |
| Material Moving | 0 (0.0%) | 0 (0.0%) |
| Total (Category) | 280 (100.0%) | 0 (0.0%) |
| Total (Overall) | 663 (51.0%) | 636 (49.0%) |
Employment Industries by Sex in Teague
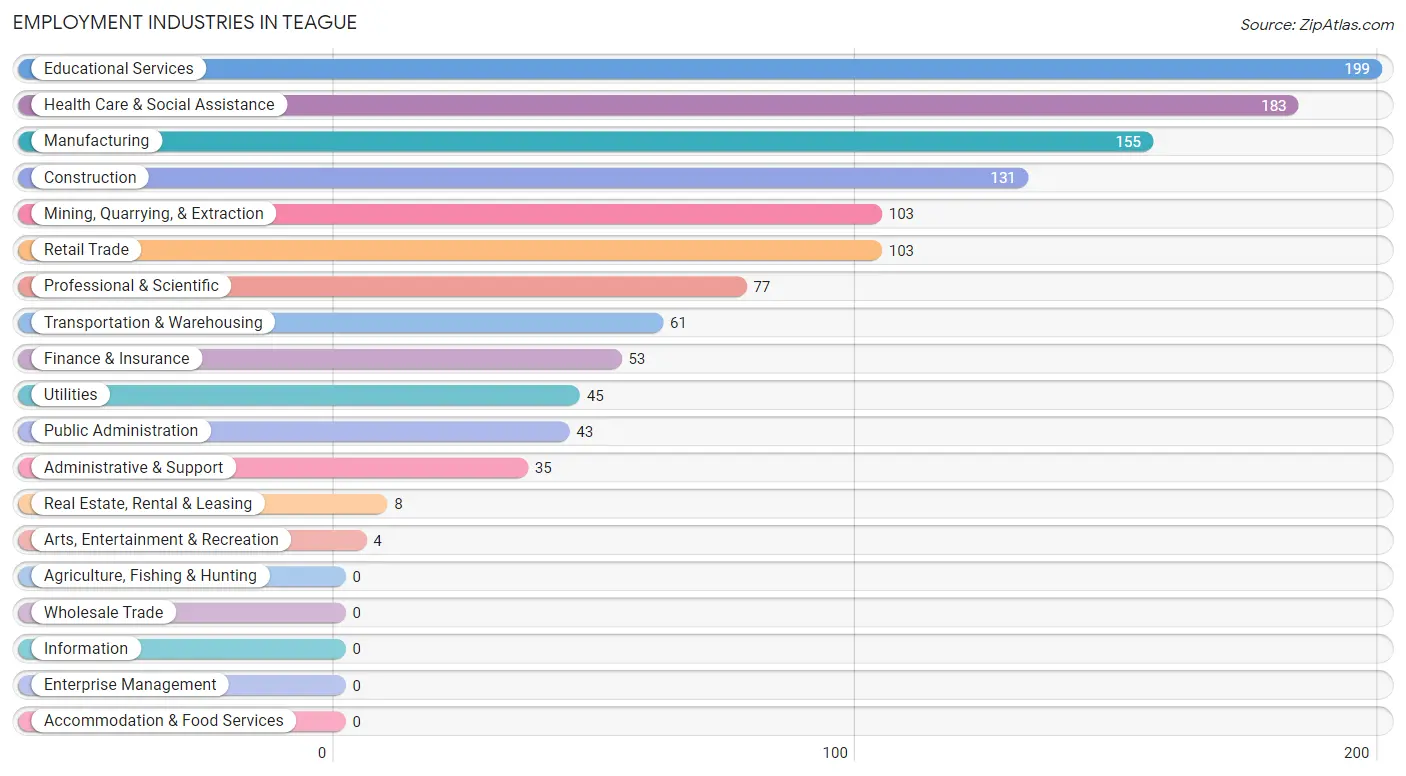
Employment Industries in Teague
The major employment industries in Teague include Educational Services (199 | 15.3%), Health Care & Social Assistance (183 | 14.1%), Manufacturing (155 | 11.9%), Construction (131 | 10.1%), and Mining, Quarrying, & Extraction (103 | 7.9%).
Employment Industries by Sex in Teague
The Teague industries that see more men than women are Transportation & Warehousing (100.0%), Real Estate, Rental & Leasing (100.0%), and Public Administration (100.0%), whereas the industries that tend to have a higher number of women are Administrative & Support (100.0%), Educational Services (100.0%), and Arts, Entertainment & Recreation (100.0%).
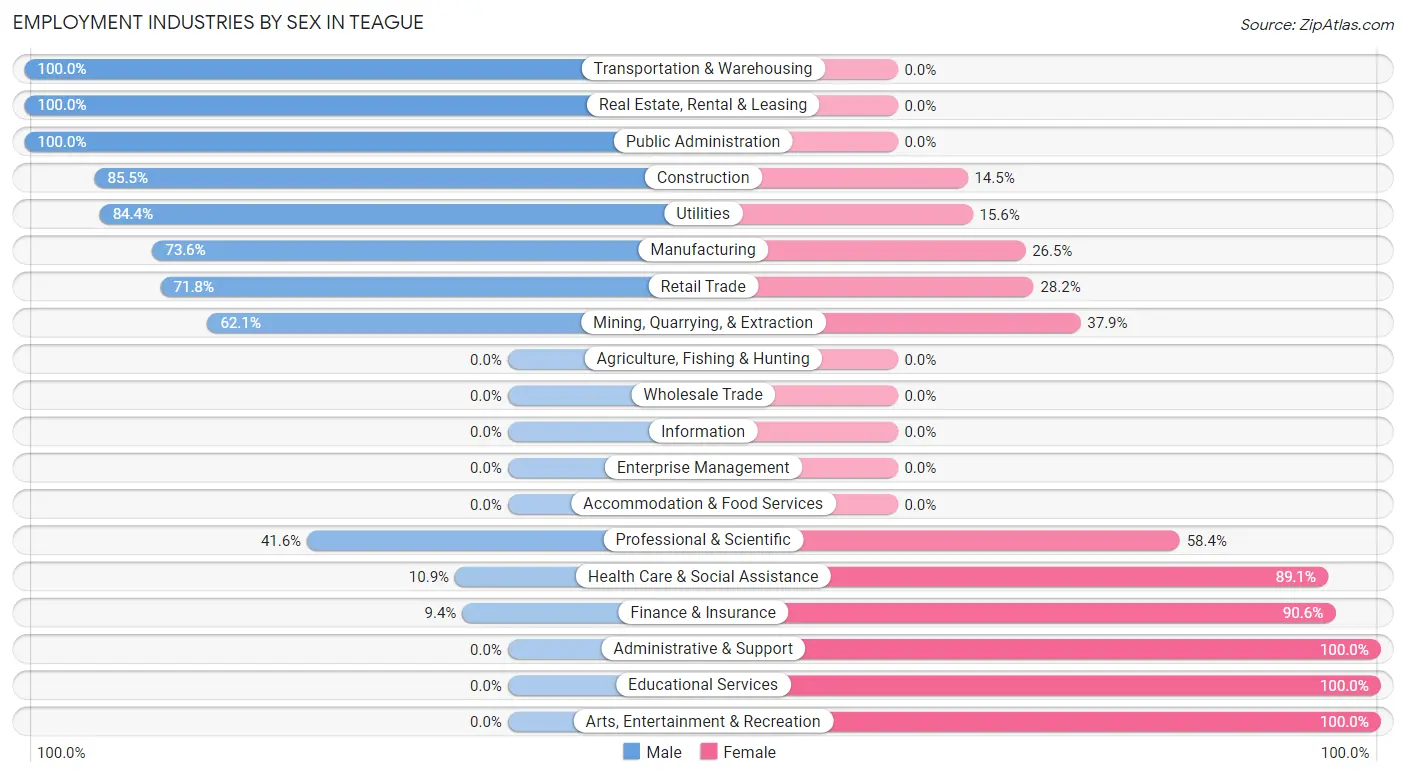
| Industry | Male | Female |
| Agriculture, Fishing & Hunting | 0 (0.0%) | 0 (0.0%) |
| Mining, Quarrying, & Extraction | 64 (62.1%) | 39 (37.9%) |
| Construction | 112 (85.5%) | 19 (14.5%) |
| Manufacturing | 114 (73.6%) | 41 (26.5%) |
| Wholesale Trade | 0 (0.0%) | 0 (0.0%) |
| Retail Trade | 74 (71.8%) | 29 (28.2%) |
| Transportation & Warehousing | 61 (100.0%) | 0 (0.0%) |
| Utilities | 38 (84.4%) | 7 (15.6%) |
| Information | 0 (0.0%) | 0 (0.0%) |
| Finance & Insurance | 5 (9.4%) | 48 (90.6%) |
| Real Estate, Rental & Leasing | 8 (100.0%) | 0 (0.0%) |
| Professional & Scientific | 32 (41.6%) | 45 (58.4%) |
| Enterprise Management | 0 (0.0%) | 0 (0.0%) |
| Administrative & Support | 0 (0.0%) | 35 (100.0%) |
| Educational Services | 0 (0.0%) | 199 (100.0%) |
| Health Care & Social Assistance | 20 (10.9%) | 163 (89.1%) |
| Arts, Entertainment & Recreation | 0 (0.0%) | 4 (100.0%) |
| Accommodation & Food Services | 0 (0.0%) | 0 (0.0%) |
| Public Administration | 43 (100.0%) | 0 (0.0%) |
| Total | 663 (51.0%) | 636 (49.0%) |
Education in Teague
School Enrollment in Teague
The most common levels of schooling among the 923 students in Teague are elementary school (428 | 46.4%), high school (184 | 19.9%), and middle school (168 | 18.2%).
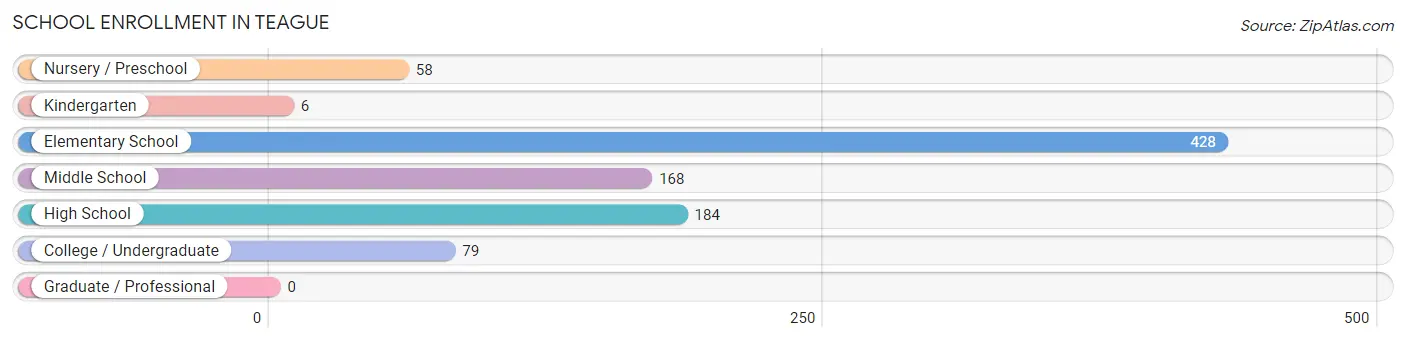
| School Level | # Students | % Students |
| Nursery / Preschool | 58 | 6.3% |
| Kindergarten | 6 | 0.6% |
| Elementary School | 428 | 46.4% |
| Middle School | 168 | 18.2% |
| High School | 184 | 19.9% |
| College / Undergraduate | 79 | 8.6% |
| Graduate / Professional | 0 | 0.0% |
| Total | 923 | 100.0% |
School Enrollment by Age by Funding Source in Teague
Out of a total of 923 students who are enrolled in schools in Teague, 10 (1.1%) attend a private institution, while the remaining 913 (98.9%) are enrolled in public schools. The age group of 3 to 4 year olds has the highest likelihood of being enrolled in private schools, with 5 (15.1% in the age bracket) enrolled. Conversely, the age group of 5 to 9 year old has the lowest likelihood of being enrolled in a private school, with 456 (100.0% in the age bracket) attending a public institution.
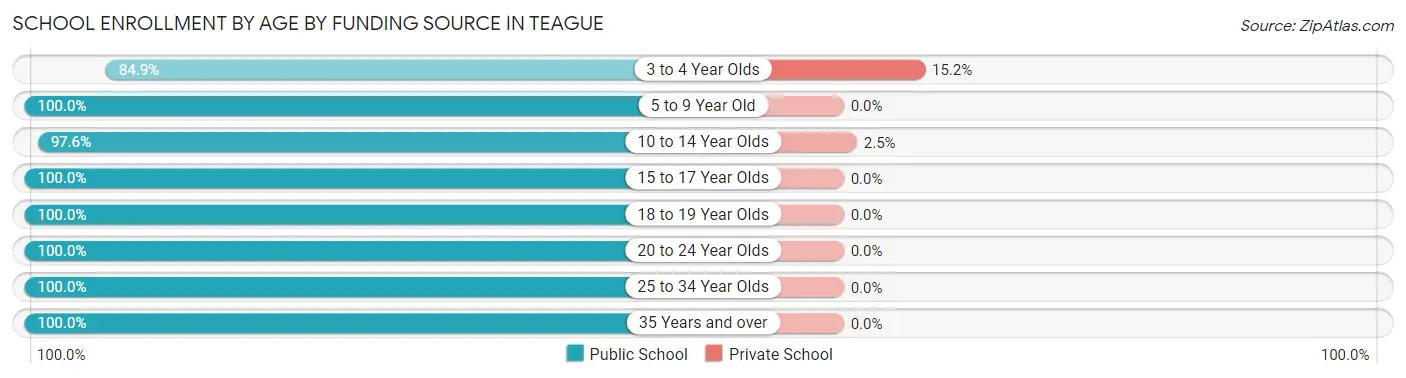
| Age Bracket | Public School | Private School |
| 3 to 4 Year Olds | 28 (84.9%) | 5 (15.1%) |
| 5 to 9 Year Old | 456 (100.0%) | 0 (0.0%) |
| 10 to 14 Year Olds | 199 (97.6%) | 5 (2.5%) |
| 15 to 17 Year Olds | 124 (100.0%) | 0 (0.0%) |
| 18 to 19 Year Olds | 27 (100.0%) | 0 (0.0%) |
| 20 to 24 Year Olds | 14 (100.0%) | 0 (0.0%) |
| 25 to 34 Year Olds | 62 (100.0%) | 0 (0.0%) |
| 35 Years and over | 3 (100.0%) | 0 (0.0%) |
| Total | 913 (98.9%) | 10 (1.1%) |
Educational Attainment by Field of Study in Teague
Social sciences (71 | 19.8%), education (62 | 17.3%), liberal arts & history (60 | 16.7%), business (59 | 16.4%), and arts & humanities (58 | 16.2%) are the most common fields of study among 359 individuals in Teague who have obtained a bachelor's degree or higher.
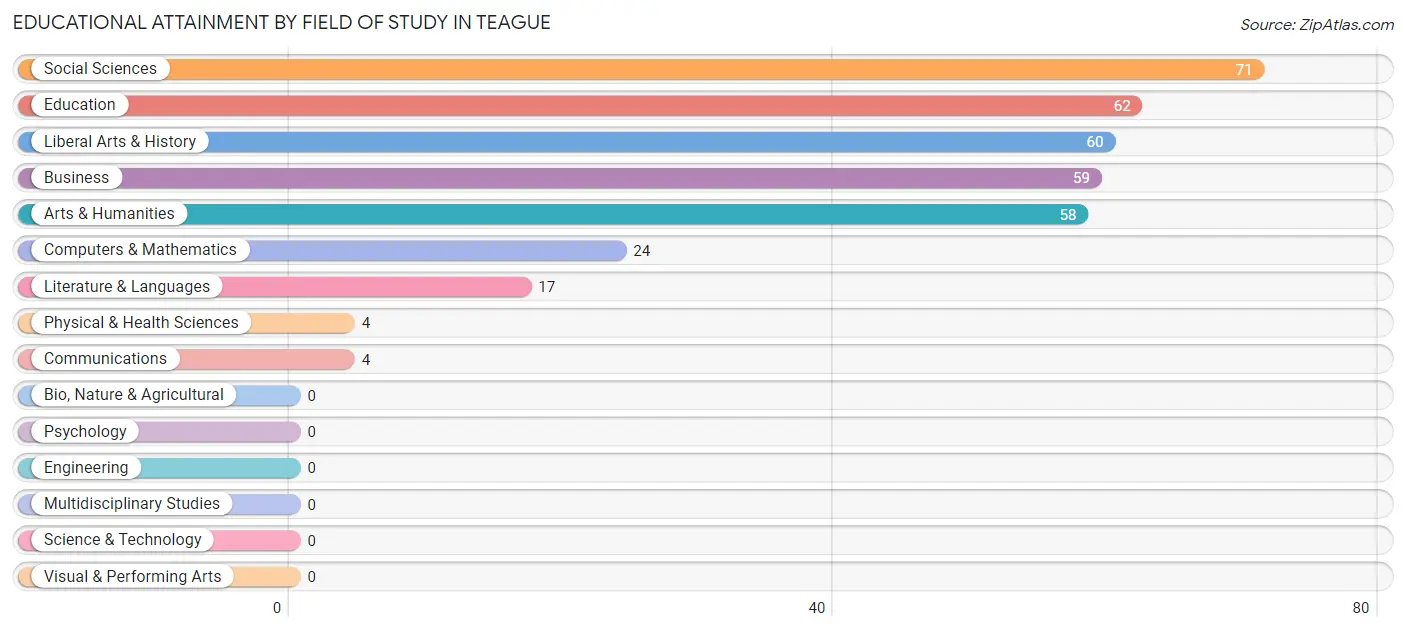
| Field of Study | # Graduates | % Graduates |
| Computers & Mathematics | 24 | 6.7% |
| Bio, Nature & Agricultural | 0 | 0.0% |
| Physical & Health Sciences | 4 | 1.1% |
| Psychology | 0 | 0.0% |
| Social Sciences | 71 | 19.8% |
| Engineering | 0 | 0.0% |
| Multidisciplinary Studies | 0 | 0.0% |
| Science & Technology | 0 | 0.0% |
| Business | 59 | 16.4% |
| Education | 62 | 17.3% |
| Literature & Languages | 17 | 4.7% |
| Liberal Arts & History | 60 | 16.7% |
| Visual & Performing Arts | 0 | 0.0% |
| Communications | 4 | 1.1% |
| Arts & Humanities | 58 | 16.2% |
| Total | 359 | 100.0% |
Transportation & Commute in Teague
Vehicle Availability by Sex in Teague
The most prevalent vehicle ownership categories in Teague are males with 3 vehicles (246, accounting for 37.1%) and females with 3 vehicles (179, making up 38.7%).
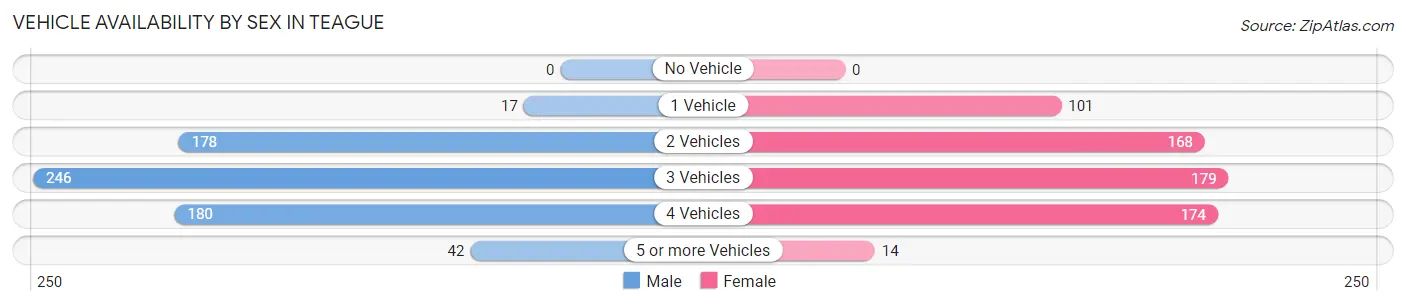
| Vehicles Available | Male | Female |
| No Vehicle | 0 (0.0%) | 0 (0.0%) |
| 1 Vehicle | 17 (2.6%) | 101 (15.9%) |
| 2 Vehicles | 178 (26.9%) | 168 (26.4%) |
| 3 Vehicles | 246 (37.1%) | 179 (28.1%) |
| 4 Vehicles | 180 (27.2%) | 174 (27.4%) |
| 5 or more Vehicles | 42 (6.3%) | 14 (2.2%) |
| Total | 663 (100.0%) | 636 (100.0%) |
Commute Time in Teague
The most frequently occuring commute durations in Teague are 5 to 9 minutes (207 commuters, 16.4%), 10 to 14 minutes (183 commuters, 14.5%), and 45 to 59 minutes (159 commuters, 12.6%).
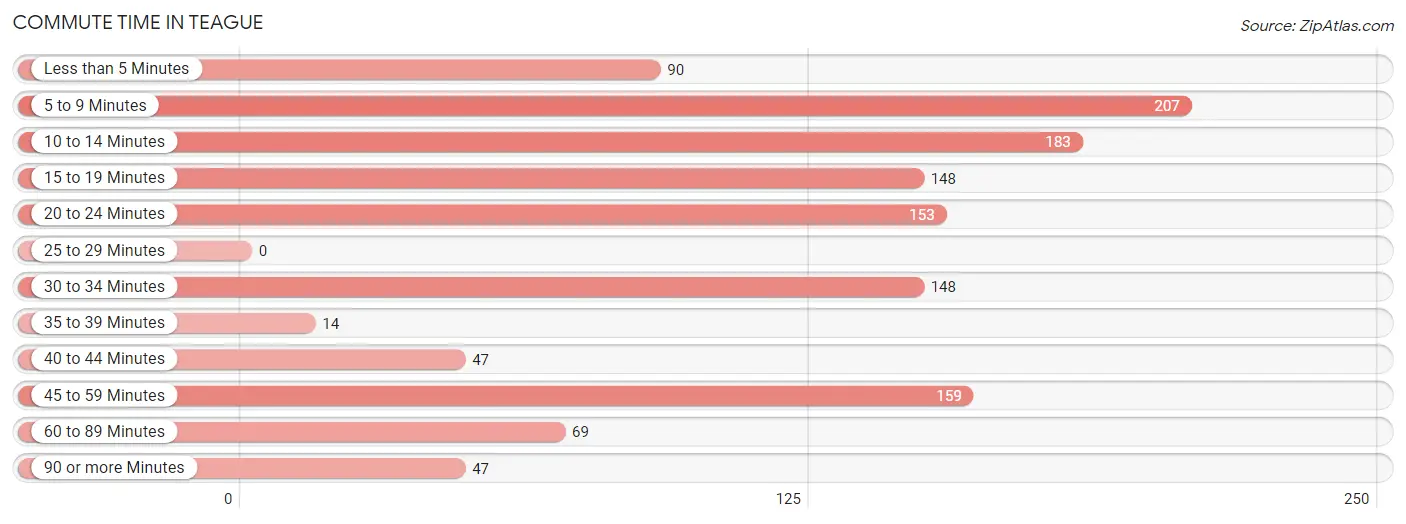
| Commute Time | # Commuters | % Commuters |
| Less than 5 Minutes | 90 | 7.1% |
| 5 to 9 Minutes | 207 | 16.4% |
| 10 to 14 Minutes | 183 | 14.5% |
| 15 to 19 Minutes | 148 | 11.7% |
| 20 to 24 Minutes | 153 | 12.1% |
| 25 to 29 Minutes | 0 | 0.0% |
| 30 to 34 Minutes | 148 | 11.7% |
| 35 to 39 Minutes | 14 | 1.1% |
| 40 to 44 Minutes | 47 | 3.7% |
| 45 to 59 Minutes | 159 | 12.6% |
| 60 to 89 Minutes | 69 | 5.4% |
| 90 or more Minutes | 47 | 3.7% |
Commute Time by Sex in Teague
The most common commute times in Teague are 5 to 9 minutes (119 commuters, 18.4%) for males and 10 to 14 minutes (152 commuters, 24.6%) for females.
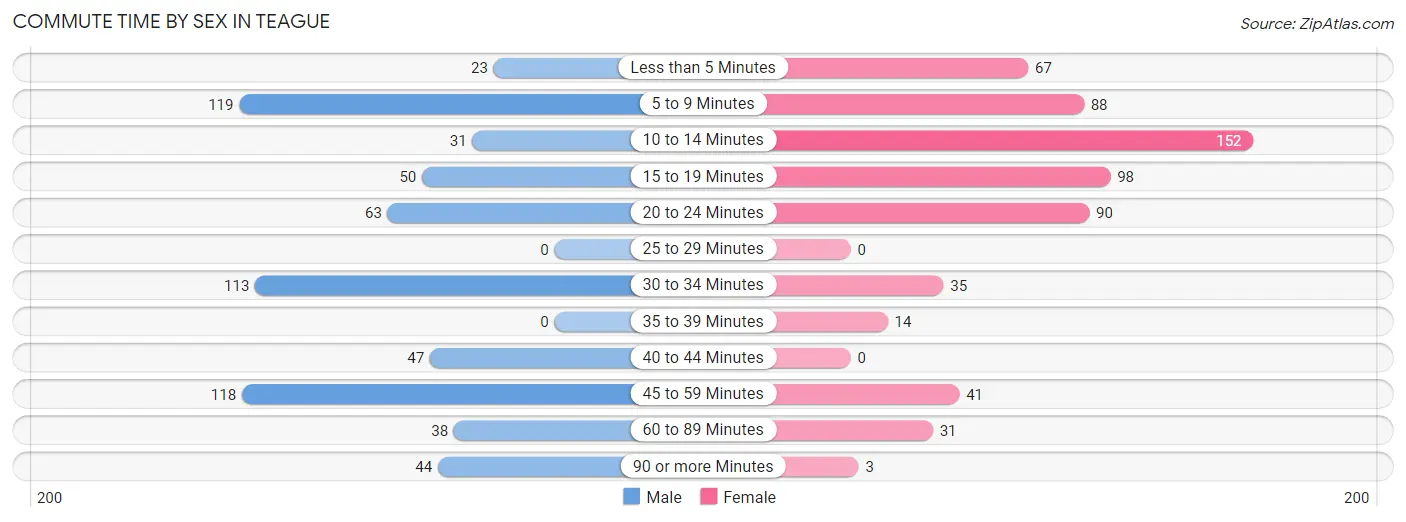
| Commute Time | Male | Female |
| Less than 5 Minutes | 23 (3.6%) | 67 (10.8%) |
| 5 to 9 Minutes | 119 (18.4%) | 88 (14.2%) |
| 10 to 14 Minutes | 31 (4.8%) | 152 (24.6%) |
| 15 to 19 Minutes | 50 (7.7%) | 98 (15.8%) |
| 20 to 24 Minutes | 63 (9.8%) | 90 (14.5%) |
| 25 to 29 Minutes | 0 (0.0%) | 0 (0.0%) |
| 30 to 34 Minutes | 113 (17.5%) | 35 (5.7%) |
| 35 to 39 Minutes | 0 (0.0%) | 14 (2.3%) |
| 40 to 44 Minutes | 47 (7.3%) | 0 (0.0%) |
| 45 to 59 Minutes | 118 (18.3%) | 41 (6.6%) |
| 60 to 89 Minutes | 38 (5.9%) | 31 (5.0%) |
| 90 or more Minutes | 44 (6.8%) | 3 (0.5%) |
Time of Departure to Work by Sex in Teague
The most frequent times of departure to work in Teague are 6:00 AM to 6:29 AM (105, 16.3%) for males and 7:00 AM to 7:29 AM (207, 33.4%) for females.
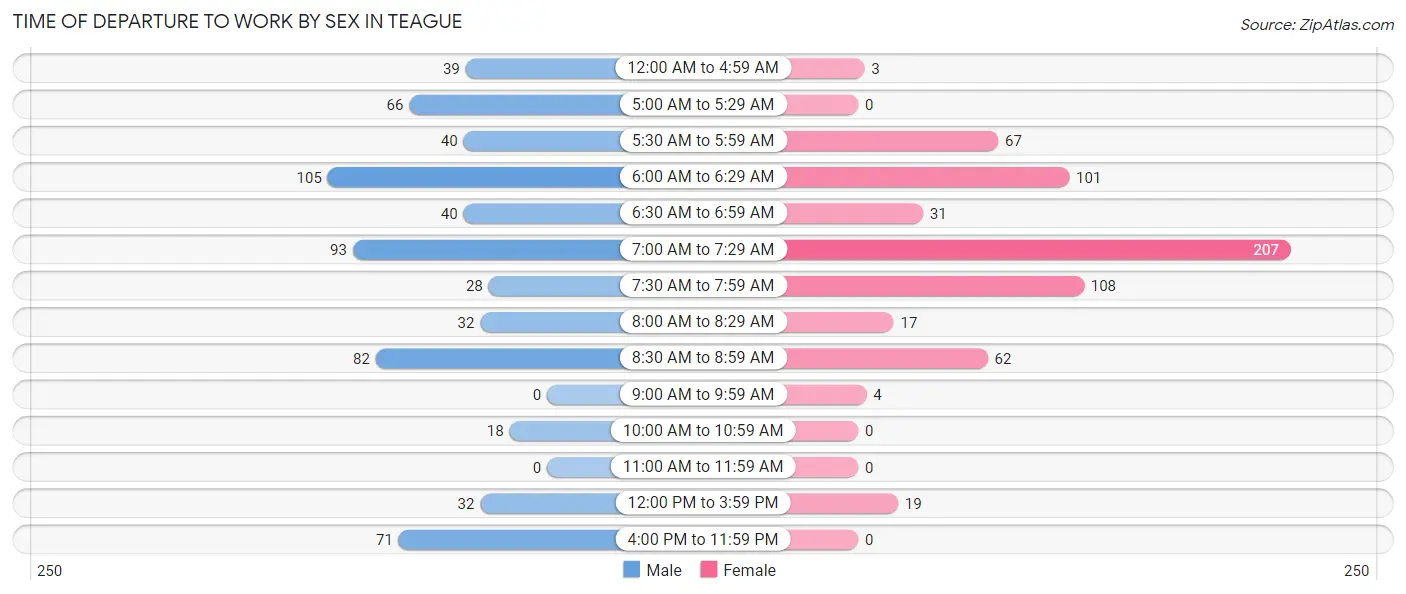
| Time of Departure | Male | Female |
| 12:00 AM to 4:59 AM | 39 (6.0%) | 3 (0.5%) |
| 5:00 AM to 5:29 AM | 66 (10.2%) | 0 (0.0%) |
| 5:30 AM to 5:59 AM | 40 (6.2%) | 67 (10.8%) |
| 6:00 AM to 6:29 AM | 105 (16.3%) | 101 (16.3%) |
| 6:30 AM to 6:59 AM | 40 (6.2%) | 31 (5.0%) |
| 7:00 AM to 7:29 AM | 93 (14.4%) | 207 (33.4%) |
| 7:30 AM to 7:59 AM | 28 (4.3%) | 108 (17.4%) |
| 8:00 AM to 8:29 AM | 32 (5.0%) | 17 (2.8%) |
| 8:30 AM to 8:59 AM | 82 (12.7%) | 62 (10.0%) |
| 9:00 AM to 9:59 AM | 0 (0.0%) | 4 (0.6%) |
| 10:00 AM to 10:59 AM | 18 (2.8%) | 0 (0.0%) |
| 11:00 AM to 11:59 AM | 0 (0.0%) | 0 (0.0%) |
| 12:00 PM to 3:59 PM | 32 (5.0%) | 19 (3.1%) |
| 4:00 PM to 11:59 PM | 71 (11.0%) | 0 (0.0%) |
| Total | 646 (100.0%) | 619 (100.0%) |
Housing Occupancy in Teague
Occupancy by Ownership in Teague
Of the total 931 dwellings in Teague, owner-occupied units account for 733 (78.7%), while renter-occupied units make up 198 (21.3%).
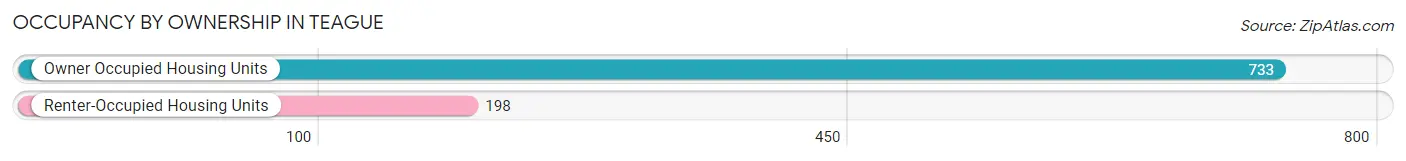
| Occupancy | # Housing Units | % Housing Units |
| Owner Occupied Housing Units | 733 | 78.7% |
| Renter-Occupied Housing Units | 198 | 21.3% |
| Total Occupied Housing Units | 931 | 100.0% |
Occupancy by Household Size in Teague
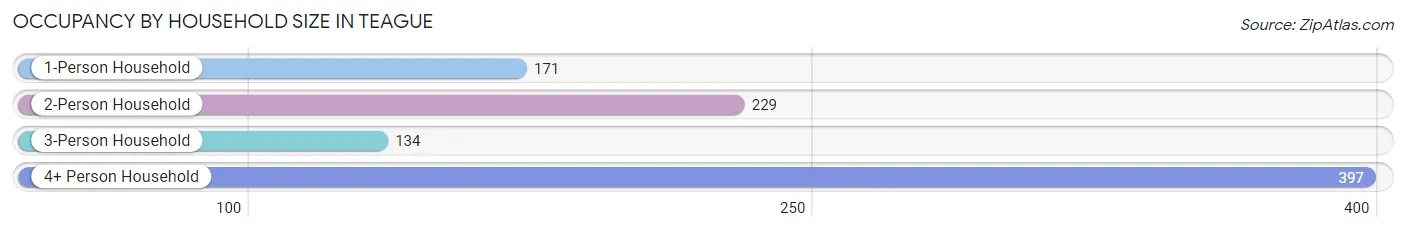
| Household Size | # Housing Units | % Housing Units |
| 1-Person Household | 171 | 18.4% |
| 2-Person Household | 229 | 24.6% |
| 3-Person Household | 134 | 14.4% |
| 4+ Person Household | 397 | 42.6% |
| Total Housing Units | 931 | 100.0% |
Occupancy by Ownership by Household Size in Teague
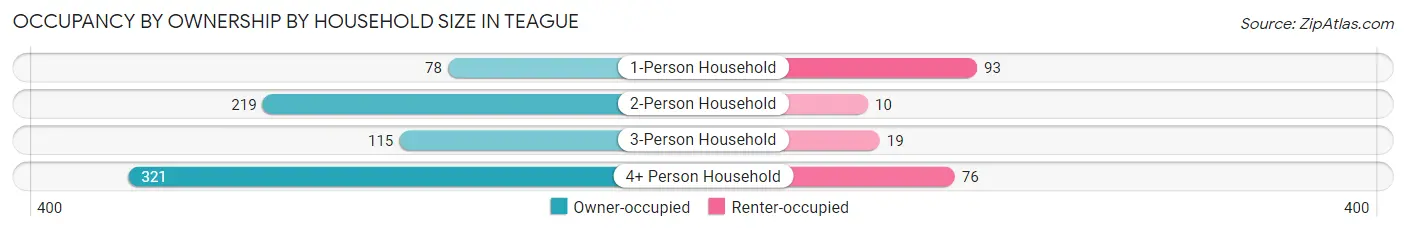
| Household Size | Owner-occupied | Renter-occupied |
| 1-Person Household | 78 (45.6%) | 93 (54.4%) |
| 2-Person Household | 219 (95.6%) | 10 (4.4%) |
| 3-Person Household | 115 (85.8%) | 19 (14.2%) |
| 4+ Person Household | 321 (80.9%) | 76 (19.1%) |
| Total Housing Units | 733 (78.7%) | 198 (21.3%) |
Occupancy by Educational Attainment in Teague
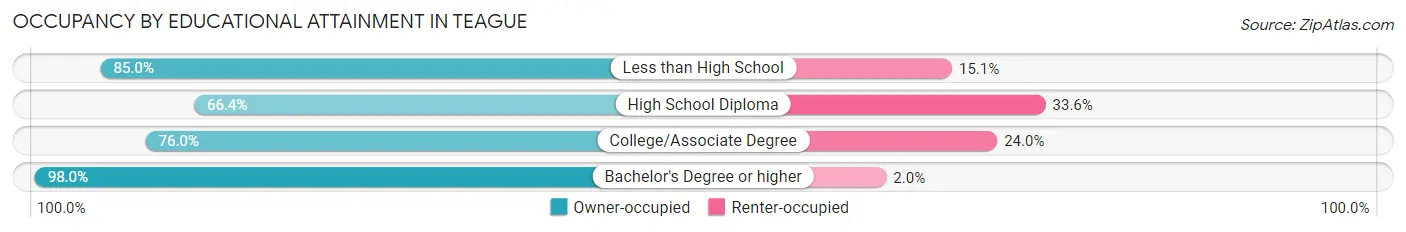
| Household Size | Owner-occupied | Renter-occupied |
| Less than High School | 158 (85.0%) | 28 (15.0%) |
| High School Diploma | 164 (66.4%) | 83 (33.6%) |
| College/Associate Degree | 266 (76.0%) | 84 (24.0%) |
| Bachelor's Degree or higher | 145 (98.0%) | 3 (2.0%) |
Occupancy by Age of Householder in Teague
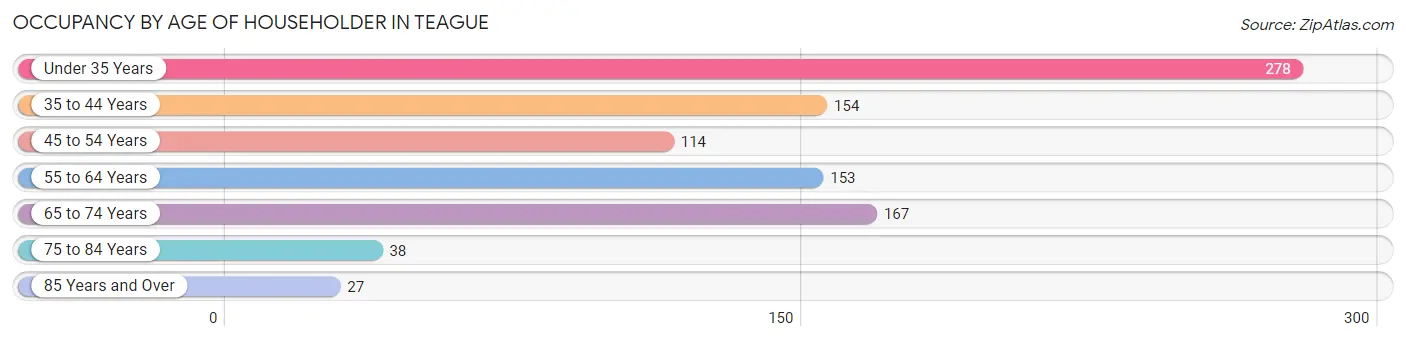
| Age Bracket | # Households | % Households |
| Under 35 Years | 278 | 29.9% |
| 35 to 44 Years | 154 | 16.5% |
| 45 to 54 Years | 114 | 12.2% |
| 55 to 64 Years | 153 | 16.4% |
| 65 to 74 Years | 167 | 17.9% |
| 75 to 84 Years | 38 | 4.1% |
| 85 Years and Over | 27 | 2.9% |
| Total | 931 | 100.0% |
Housing Finances in Teague
Median Income by Occupancy in Teague
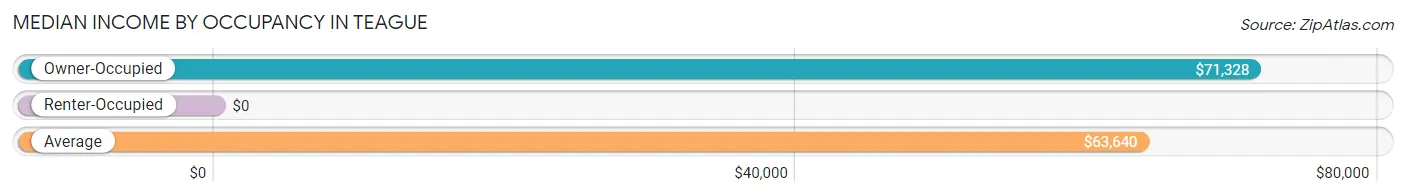
| Occupancy Type | # Households | Median Income |
| Owner-Occupied | 733 (78.7%) | $71,328 |
| Renter-Occupied | 198 (21.3%) | $0 |
| Average | 931 (100.0%) | $63,640 |
Occupancy by Householder Income Bracket in Teague
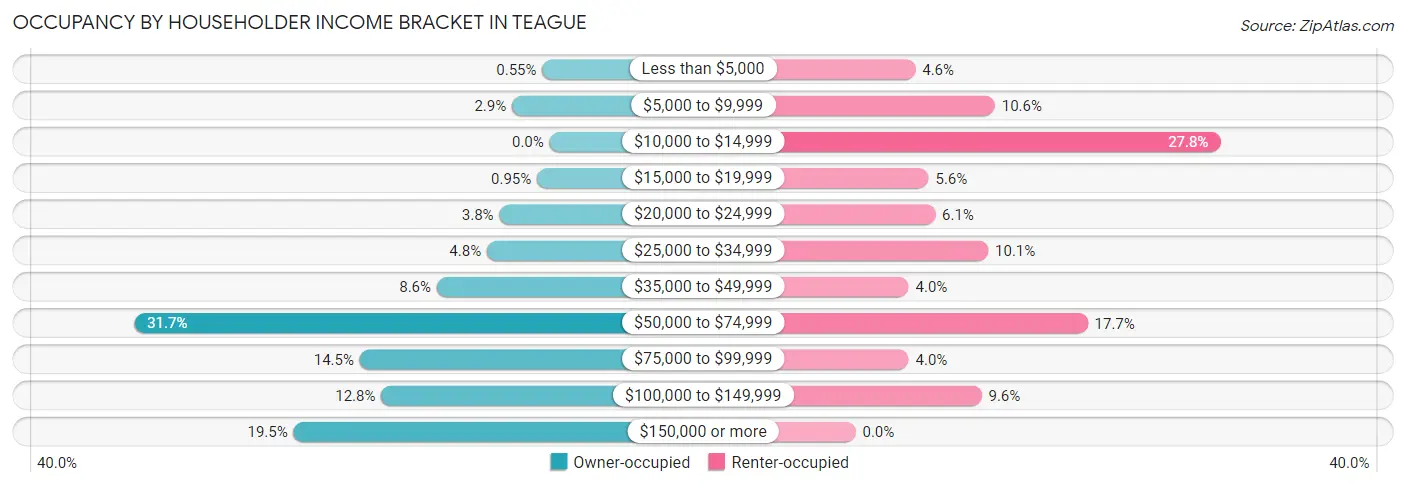
| Income Bracket | Owner-occupied | Renter-occupied |
| Less than $5,000 | 4 (0.5%) | 9 (4.5%) |
| $5,000 to $9,999 | 21 (2.9%) | 21 (10.6%) |
| $10,000 to $14,999 | 0 (0.0%) | 55 (27.8%) |
| $15,000 to $19,999 | 7 (0.9%) | 11 (5.6%) |
| $20,000 to $24,999 | 28 (3.8%) | 12 (6.1%) |
| $25,000 to $34,999 | 35 (4.8%) | 20 (10.1%) |
| $35,000 to $49,999 | 63 (8.6%) | 8 (4.0%) |
| $50,000 to $74,999 | 232 (31.7%) | 35 (17.7%) |
| $75,000 to $99,999 | 106 (14.5%) | 8 (4.0%) |
| $100,000 to $149,999 | 94 (12.8%) | 19 (9.6%) |
| $150,000 or more | 143 (19.5%) | 0 (0.0%) |
| Total | 733 (100.0%) | 198 (100.0%) |
Monthly Housing Cost Tiers in Teague
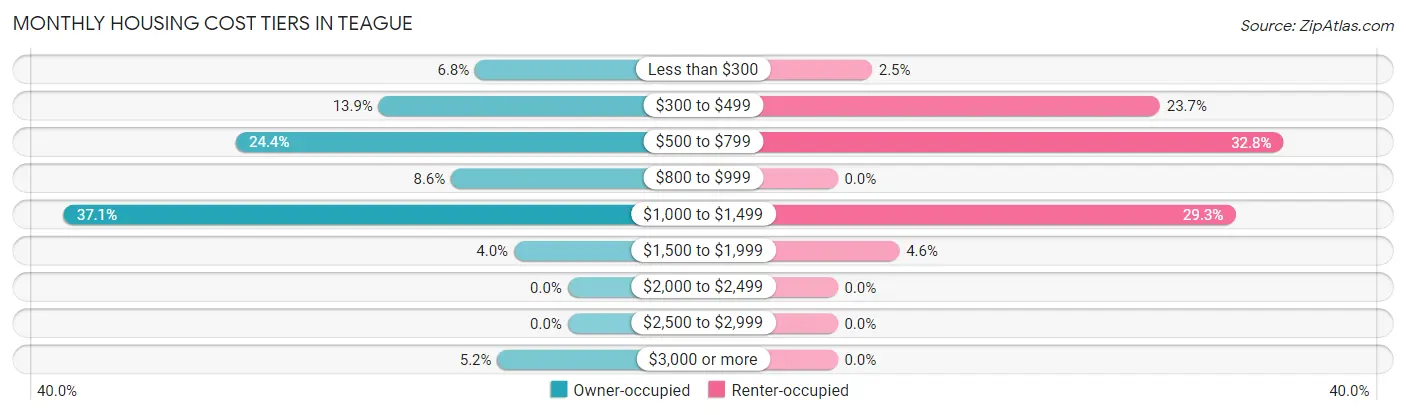
| Monthly Cost | Owner-occupied | Renter-occupied |
| Less than $300 | 50 (6.8%) | 5 (2.5%) |
| $300 to $499 | 102 (13.9%) | 47 (23.7%) |
| $500 to $799 | 179 (24.4%) | 65 (32.8%) |
| $800 to $999 | 63 (8.6%) | 0 (0.0%) |
| $1,000 to $1,499 | 272 (37.1%) | 58 (29.3%) |
| $1,500 to $1,999 | 29 (4.0%) | 9 (4.5%) |
| $2,000 to $2,499 | 0 (0.0%) | 0 (0.0%) |
| $2,500 to $2,999 | 0 (0.0%) | 0 (0.0%) |
| $3,000 or more | 38 (5.2%) | 0 (0.0%) |
| Total | 733 (100.0%) | 198 (100.0%) |
Physical Housing Characteristics in Teague
Housing Structures in Teague
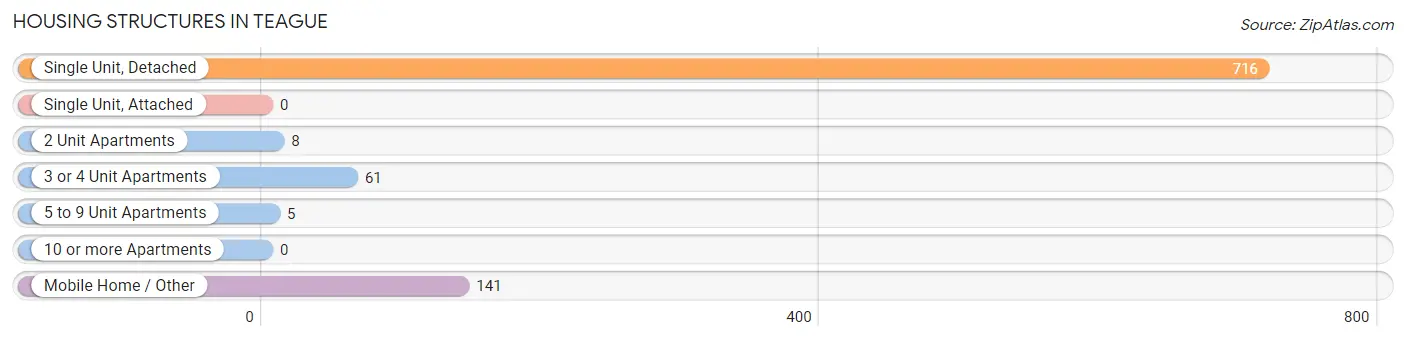
| Structure Type | # Housing Units | % Housing Units |
| Single Unit, Detached | 716 | 76.9% |
| Single Unit, Attached | 0 | 0.0% |
| 2 Unit Apartments | 8 | 0.9% |
| 3 or 4 Unit Apartments | 61 | 6.6% |
| 5 to 9 Unit Apartments | 5 | 0.5% |
| 10 or more Apartments | 0 | 0.0% |
| Mobile Home / Other | 141 | 15.1% |
| Total | 931 | 100.0% |
Housing Structures by Occupancy in Teague
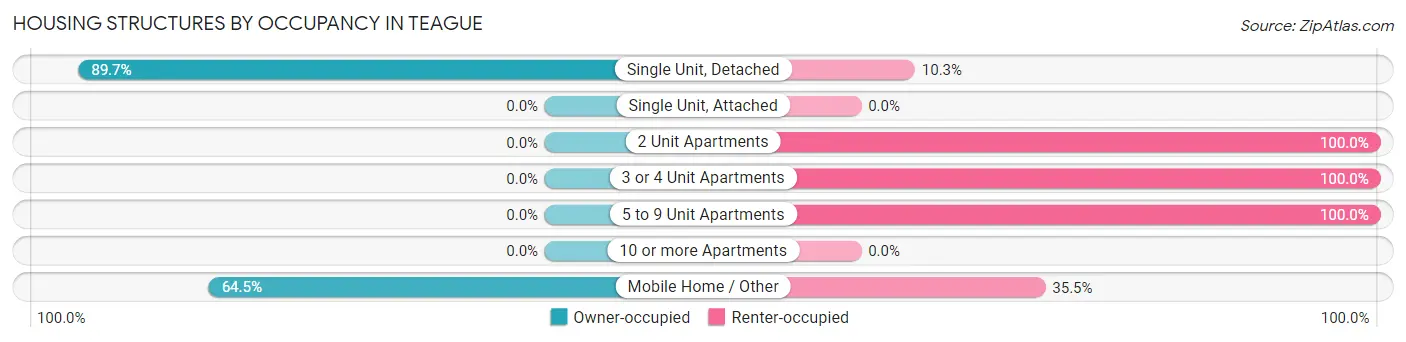
| Structure Type | Owner-occupied | Renter-occupied |
| Single Unit, Detached | 642 (89.7%) | 74 (10.3%) |
| Single Unit, Attached | 0 (0.0%) | 0 (0.0%) |
| 2 Unit Apartments | 0 (0.0%) | 8 (100.0%) |
| 3 or 4 Unit Apartments | 0 (0.0%) | 61 (100.0%) |
| 5 to 9 Unit Apartments | 0 (0.0%) | 5 (100.0%) |
| 10 or more Apartments | 0 (0.0%) | 0 (0.0%) |
| Mobile Home / Other | 91 (64.5%) | 50 (35.5%) |
| Total | 733 (78.7%) | 198 (21.3%) |
Housing Structures by Number of Rooms in Teague
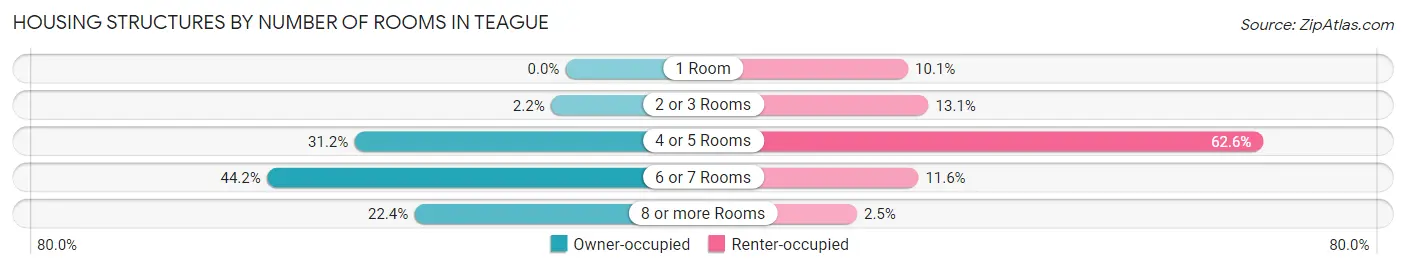
| Number of Rooms | Owner-occupied | Renter-occupied |
| 1 Room | 0 (0.0%) | 20 (10.1%) |
| 2 or 3 Rooms | 16 (2.2%) | 26 (13.1%) |
| 4 or 5 Rooms | 229 (31.2%) | 124 (62.6%) |
| 6 or 7 Rooms | 324 (44.2%) | 23 (11.6%) |
| 8 or more Rooms | 164 (22.4%) | 5 (2.5%) |
| Total | 733 (100.0%) | 198 (100.0%) |
Housing Structure by Heating Type in Teague
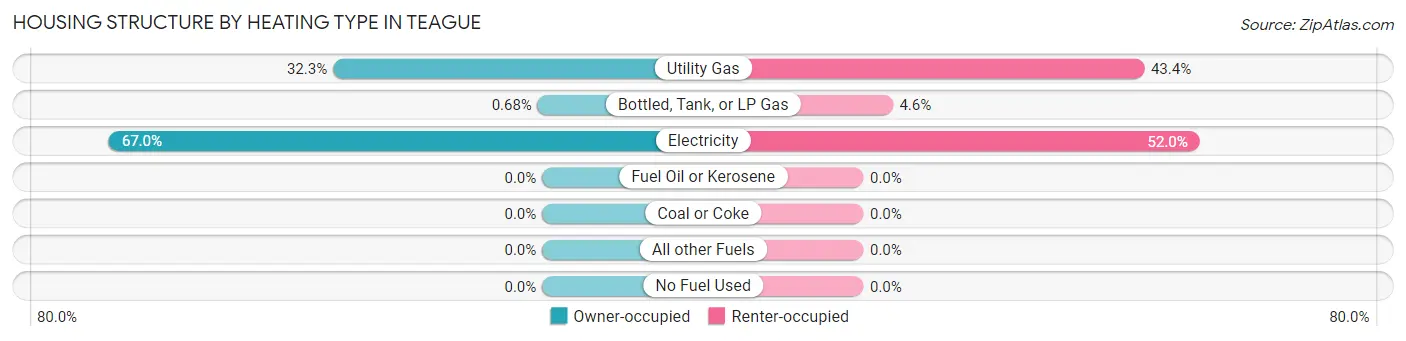
| Heating Type | Owner-occupied | Renter-occupied |
| Utility Gas | 237 (32.3%) | 86 (43.4%) |
| Bottled, Tank, or LP Gas | 5 (0.7%) | 9 (4.5%) |
| Electricity | 491 (67.0%) | 103 (52.0%) |
| Fuel Oil or Kerosene | 0 (0.0%) | 0 (0.0%) |
| Coal or Coke | 0 (0.0%) | 0 (0.0%) |
| All other Fuels | 0 (0.0%) | 0 (0.0%) |
| No Fuel Used | 0 (0.0%) | 0 (0.0%) |
| Total | 733 (100.0%) | 198 (100.0%) |
Household Vehicle Usage in Teague
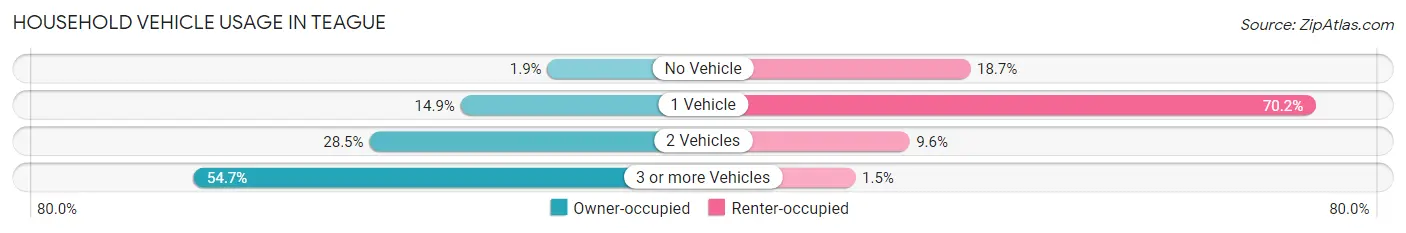
| Vehicles per Household | Owner-occupied | Renter-occupied |
| No Vehicle | 14 (1.9%) | 37 (18.7%) |
| 1 Vehicle | 109 (14.9%) | 139 (70.2%) |
| 2 Vehicles | 209 (28.5%) | 19 (9.6%) |
| 3 or more Vehicles | 401 (54.7%) | 3 (1.5%) |
| Total | 733 (100.0%) | 198 (100.0%) |
Real Estate & Mortgages in Teague
Real Estate and Mortgage Overview in Teague
| Characteristic | Without Mortgage | With Mortgage |
| Housing Units | 329 | 404 |
| Median Property Value | $105,500 | $116,400 |
| Median Household Income | $56,969 | $105 |
| Monthly Housing Costs | $532 | $38 |
| Real Estate Taxes | $1,310 | $11 |
Property Value by Mortgage Status in Teague
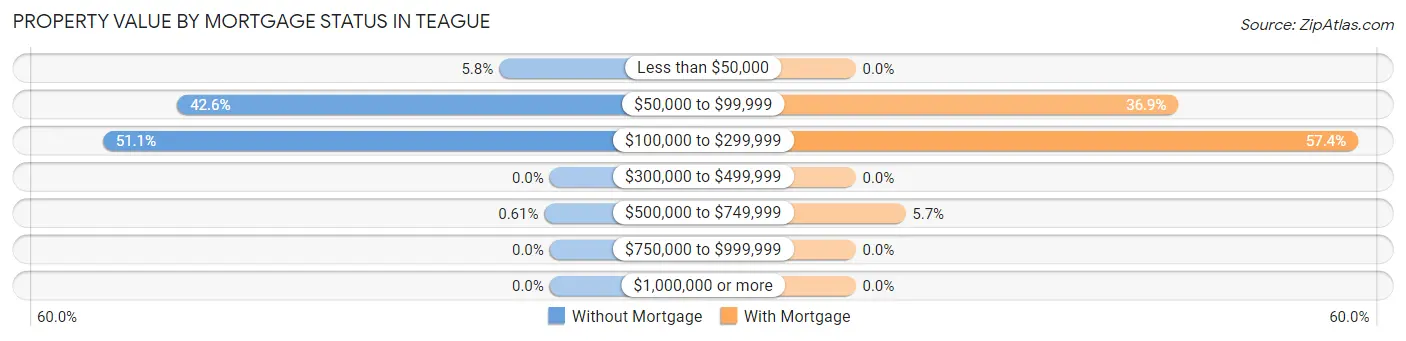
| Property Value | Without Mortgage | With Mortgage |
| Less than $50,000 | 19 (5.8%) | 0 (0.0%) |
| $50,000 to $99,999 | 140 (42.5%) | 149 (36.9%) |
| $100,000 to $299,999 | 168 (51.1%) | 232 (57.4%) |
| $300,000 to $499,999 | 0 (0.0%) | 0 (0.0%) |
| $500,000 to $749,999 | 2 (0.6%) | 23 (5.7%) |
| $750,000 to $999,999 | 0 (0.0%) | 0 (0.0%) |
| $1,000,000 or more | 0 (0.0%) | 0 (0.0%) |
| Total | 329 (100.0%) | 404 (100.0%) |
Household Income by Mortgage Status in Teague
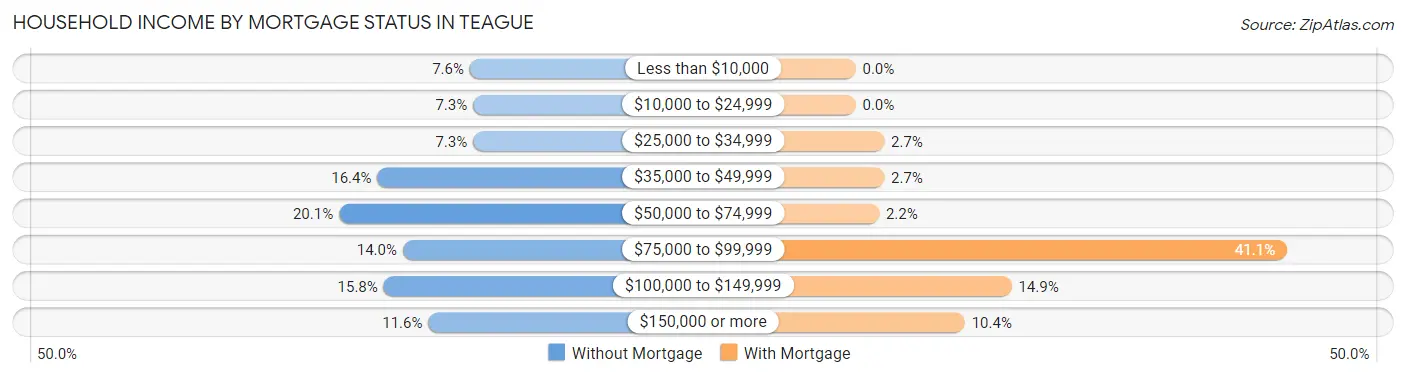
| Household Income | Without Mortgage | With Mortgage |
| Less than $10,000 | 25 (7.6%) | 0 (0.0%) |
| $10,000 to $24,999 | 24 (7.3%) | 0 (0.0%) |
| $25,000 to $34,999 | 24 (7.3%) | 11 (2.7%) |
| $35,000 to $49,999 | 54 (16.4%) | 11 (2.7%) |
| $50,000 to $74,999 | 66 (20.1%) | 9 (2.2%) |
| $75,000 to $99,999 | 46 (14.0%) | 166 (41.1%) |
| $100,000 to $149,999 | 52 (15.8%) | 60 (14.8%) |
| $150,000 or more | 38 (11.6%) | 42 (10.4%) |
| Total | 329 (100.0%) | 404 (100.0%) |
Property Value to Household Income Ratio in Teague
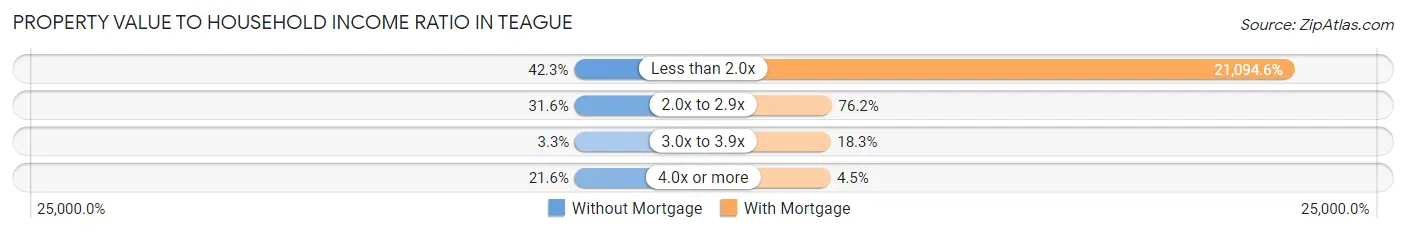
| Value-to-Income Ratio | Without Mortgage | With Mortgage |
| Less than 2.0x | 139 (42.2%) | 85,222 (21,094.6%) |
| 2.0x to 2.9x | 104 (31.6%) | 308 (76.2%) |
| 3.0x to 3.9x | 11 (3.3%) | 74 (18.3%) |
| 4.0x or more | 71 (21.6%) | 18 (4.5%) |
| Total | 329 (100.0%) | 404 (100.0%) |
Real Estate Taxes by Mortgage Status in Teague
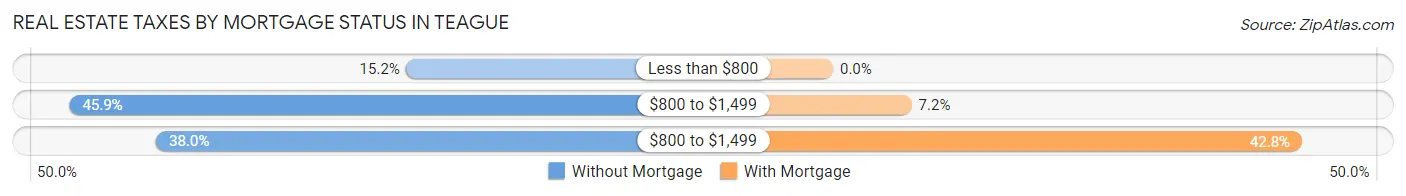
| Property Taxes | Without Mortgage | With Mortgage |
| Less than $800 | 50 (15.2%) | 0 (0.0%) |
| $800 to $1,499 | 151 (45.9%) | 29 (7.2%) |
| $800 to $1,499 | 125 (38.0%) | 173 (42.8%) |
| Total | 329 (100.0%) | 404 (100.0%) |
Health & Disability in Teague
Health Insurance Coverage by Age in Teague
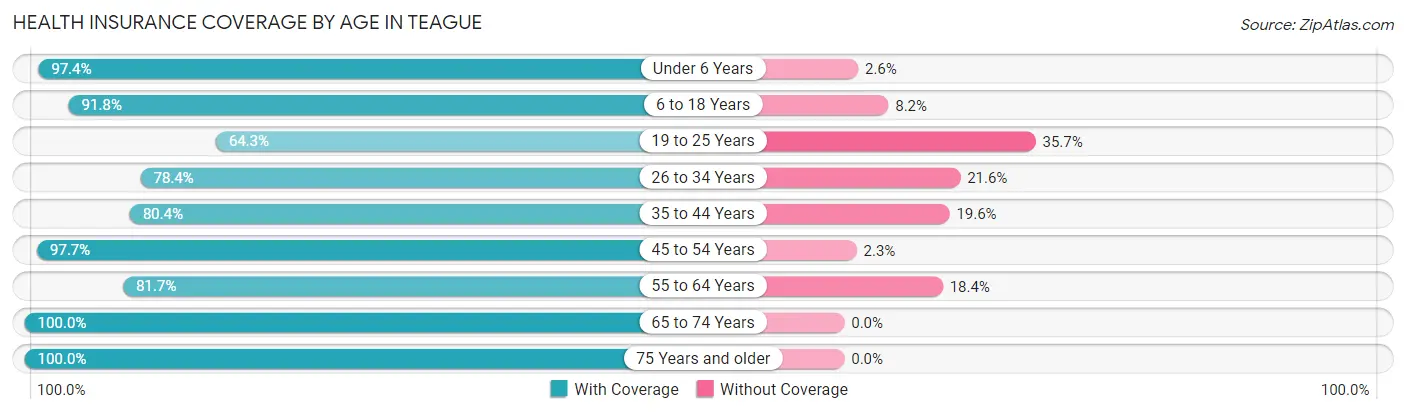
| Age Bracket | With Coverage | Without Coverage |
| Under 6 Years | 381 (97.4%) | 10 (2.6%) |
| 6 to 18 Years | 728 (91.8%) | 65 (8.2%) |
| 19 to 25 Years | 175 (64.3%) | 97 (35.7%) |
| 26 to 34 Years | 399 (78.4%) | 110 (21.6%) |
| 35 to 44 Years | 328 (80.4%) | 80 (19.6%) |
| 45 to 54 Years | 256 (97.7%) | 6 (2.3%) |
| 55 to 64 Years | 316 (81.7%) | 71 (18.3%) |
| 65 to 74 Years | 242 (100.0%) | 0 (0.0%) |
| 75 Years and older | 112 (100.0%) | 0 (0.0%) |
| Total | 2,937 (87.0%) | 439 (13.0%) |
Health Insurance Coverage by Citizenship Status in Teague
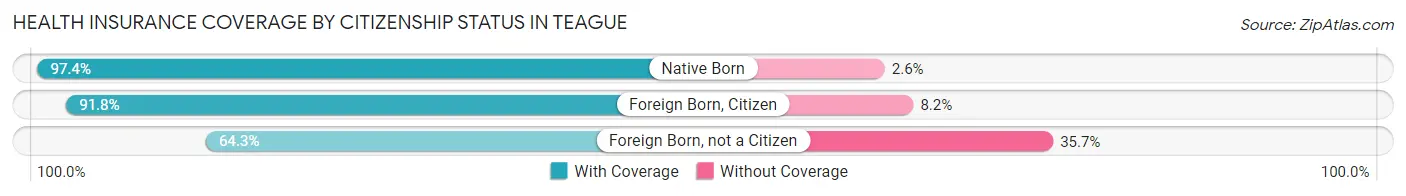
| Citizenship Status | With Coverage | Without Coverage |
| Native Born | 381 (97.4%) | 10 (2.6%) |
| Foreign Born, Citizen | 728 (91.8%) | 65 (8.2%) |
| Foreign Born, not a Citizen | 175 (64.3%) | 97 (35.7%) |
Health Insurance Coverage by Household Income in Teague
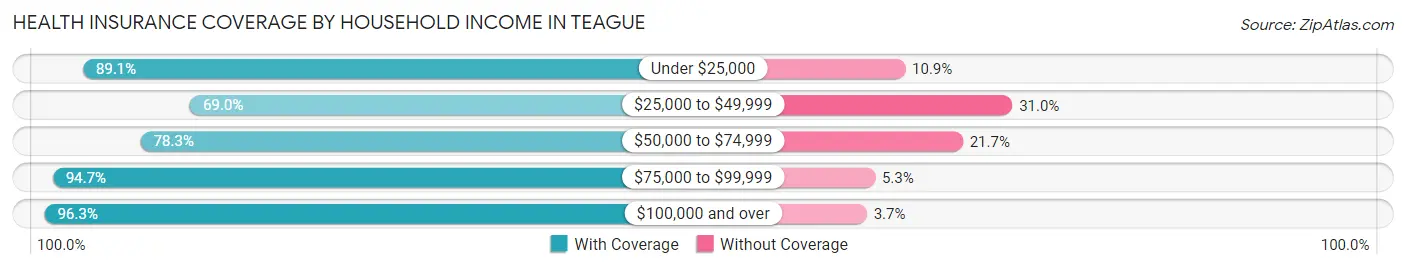
| Household Income | With Coverage | Without Coverage |
| Under $25,000 | 367 (89.1%) | 45 (10.9%) |
| $25,000 to $49,999 | 167 (69.0%) | 75 (31.0%) |
| $50,000 to $74,999 | 908 (78.3%) | 252 (21.7%) |
| $75,000 to $99,999 | 539 (94.7%) | 30 (5.3%) |
| $100,000 and over | 956 (96.3%) | 37 (3.7%) |
Public vs Private Health Insurance Coverage by Age in Teague
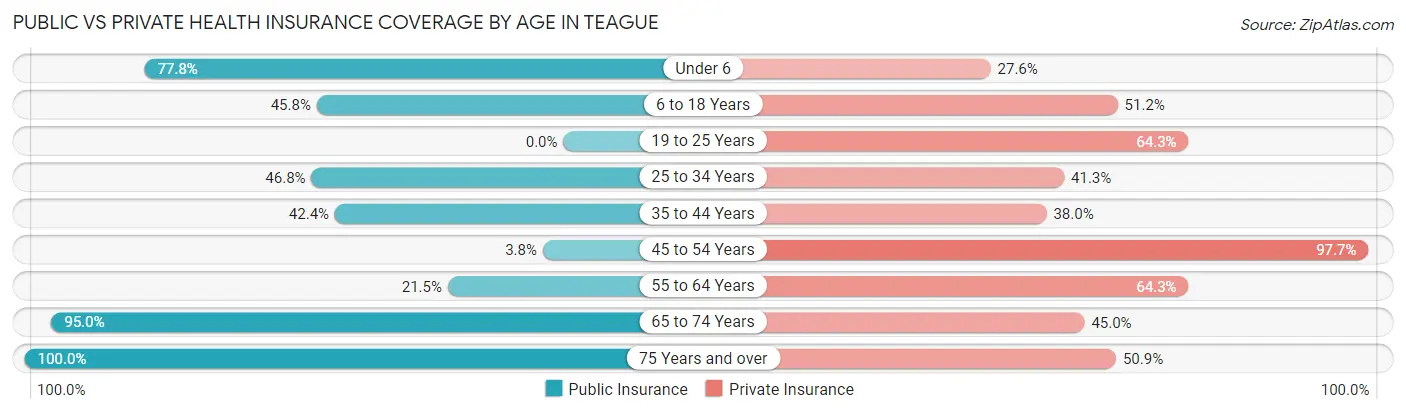
| Age Bracket | Public Insurance | Private Insurance |
| Under 6 | 304 (77.7%) | 108 (27.6%) |
| 6 to 18 Years | 363 (45.8%) | 406 (51.2%) |
| 19 to 25 Years | 0 (0.0%) | 175 (64.3%) |
| 25 to 34 Years | 238 (46.8%) | 210 (41.3%) |
| 35 to 44 Years | 173 (42.4%) | 155 (38.0%) |
| 45 to 54 Years | 10 (3.8%) | 256 (97.7%) |
| 55 to 64 Years | 83 (21.4%) | 249 (64.3%) |
| 65 to 74 Years | 230 (95.0%) | 109 (45.0%) |
| 75 Years and over | 112 (100.0%) | 57 (50.9%) |
| Total | 1,513 (44.8%) | 1,725 (51.1%) |
Disability Status by Sex by Age in Teague
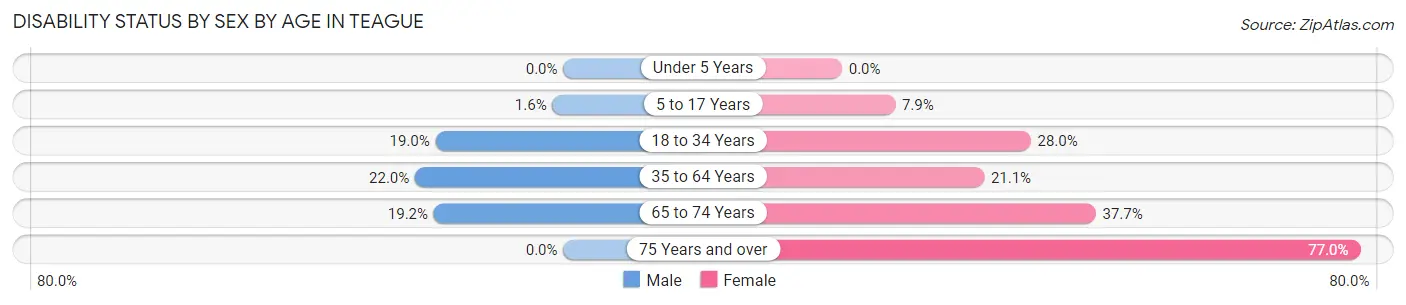
| Age Bracket | Male | Female |
| Under 5 Years | 0 (0.0%) | 0 (0.0%) |
| 5 to 17 Years | 6 (1.6%) | 34 (7.9%) |
| 18 to 34 Years | 71 (19.0%) | 118 (28.0%) |
| 35 to 64 Years | 118 (22.0%) | 110 (21.1%) |
| 65 to 74 Years | 20 (19.2%) | 52 (37.7%) |
| 75 Years and over | 0 (0.0%) | 77 (77.0%) |
Disability Class by Sex by Age in Teague
Disability Class: Hearing Difficulty
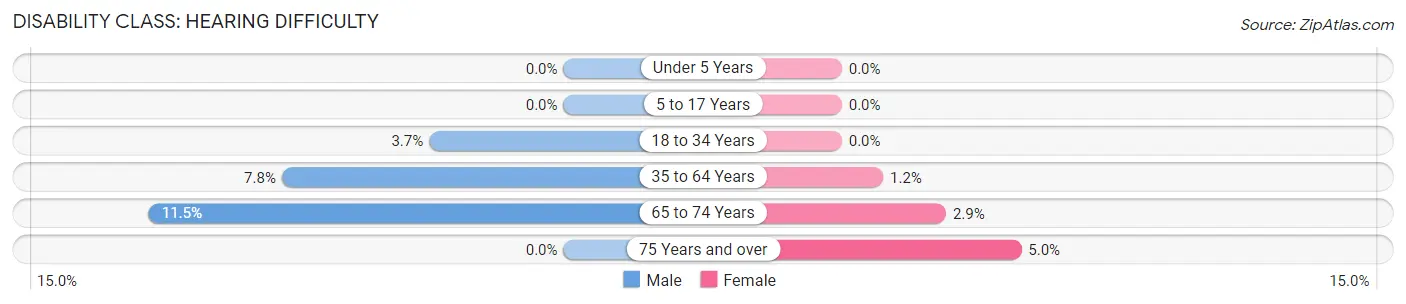
| Age Bracket | Male | Female |
| Under 5 Years | 0 (0.0%) | 0 (0.0%) |
| 5 to 17 Years | 0 (0.0%) | 0 (0.0%) |
| 18 to 34 Years | 14 (3.7%) | 0 (0.0%) |
| 35 to 64 Years | 42 (7.8%) | 6 (1.1%) |
| 65 to 74 Years | 12 (11.5%) | 4 (2.9%) |
| 75 Years and over | 0 (0.0%) | 5 (5.0%) |
Disability Class: Vision Difficulty
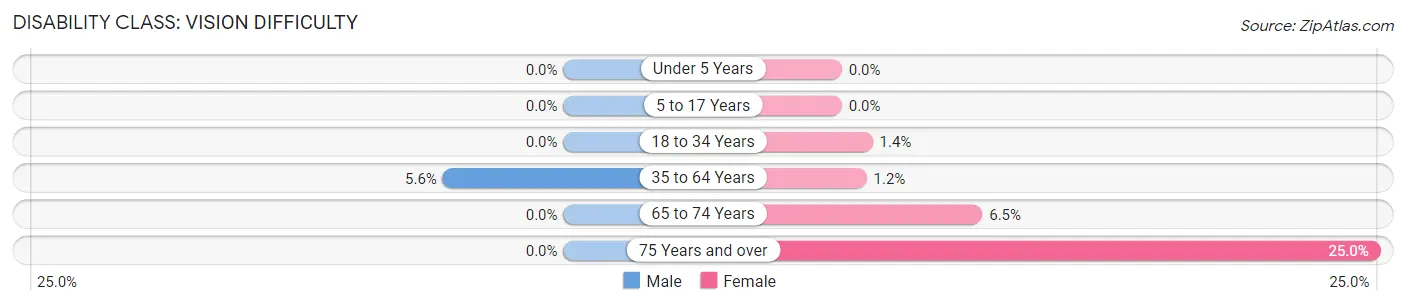
| Age Bracket | Male | Female |
| Under 5 Years | 0 (0.0%) | 0 (0.0%) |
| 5 to 17 Years | 0 (0.0%) | 0 (0.0%) |
| 18 to 34 Years | 0 (0.0%) | 6 (1.4%) |
| 35 to 64 Years | 30 (5.6%) | 6 (1.1%) |
| 65 to 74 Years | 0 (0.0%) | 9 (6.5%) |
| 75 Years and over | 0 (0.0%) | 25 (25.0%) |
Disability Class: Cognitive Difficulty
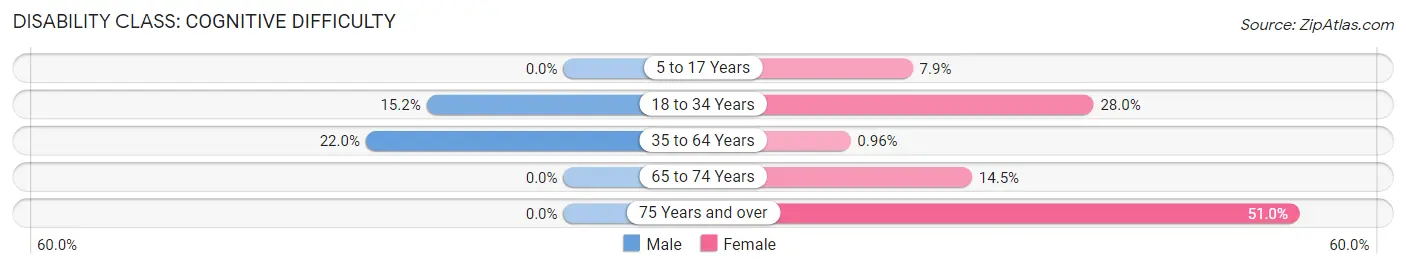
| Age Bracket | Male | Female |
| 5 to 17 Years | 0 (0.0%) | 34 (7.9%) |
| 18 to 34 Years | 57 (15.2%) | 118 (28.0%) |
| 35 to 64 Years | 118 (22.0%) | 5 (1.0%) |
| 65 to 74 Years | 0 (0.0%) | 20 (14.5%) |
| 75 Years and over | 0 (0.0%) | 51 (51.0%) |
Disability Class: Ambulatory Difficulty
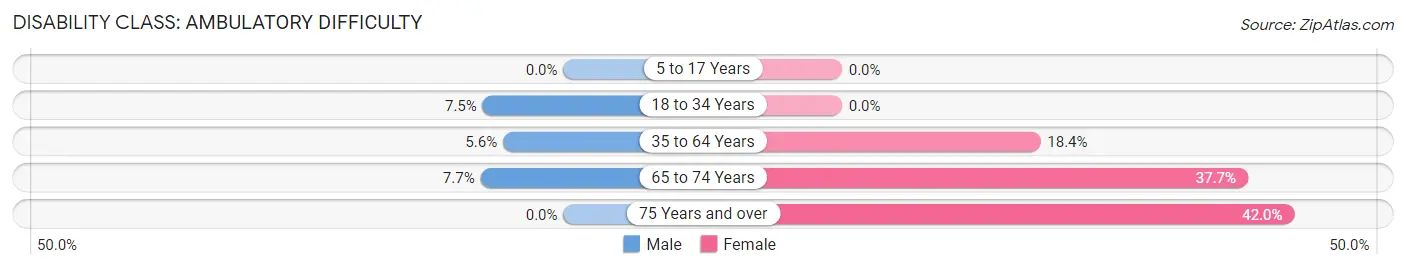
| Age Bracket | Male | Female |
| 5 to 17 Years | 0 (0.0%) | 0 (0.0%) |
| 18 to 34 Years | 28 (7.5%) | 0 (0.0%) |
| 35 to 64 Years | 30 (5.6%) | 96 (18.4%) |
| 65 to 74 Years | 8 (7.7%) | 52 (37.7%) |
| 75 Years and over | 0 (0.0%) | 42 (42.0%) |
Disability Class: Self-Care Difficulty
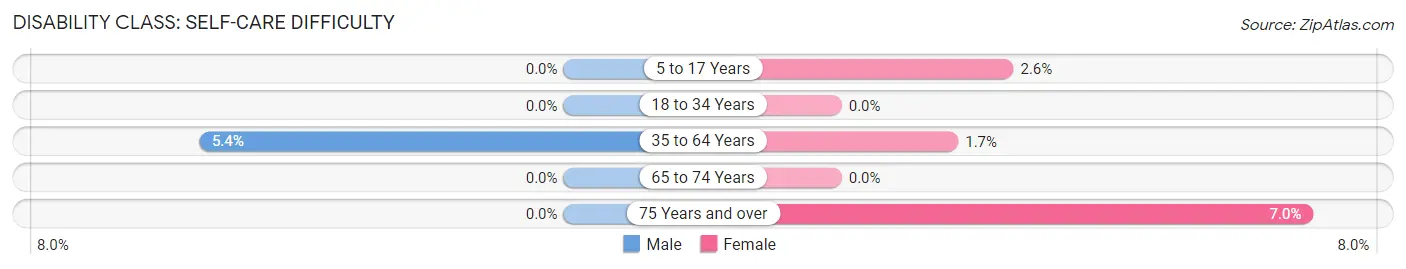
| Age Bracket | Male | Female |
| 5 to 17 Years | 0 (0.0%) | 11 (2.5%) |
| 18 to 34 Years | 0 (0.0%) | 0 (0.0%) |
| 35 to 64 Years | 29 (5.4%) | 9 (1.7%) |
| 65 to 74 Years | 0 (0.0%) | 0 (0.0%) |
| 75 Years and over | 0 (0.0%) | 7 (7.0%) |
Technology Access in Teague
Computing Device Access in Teague
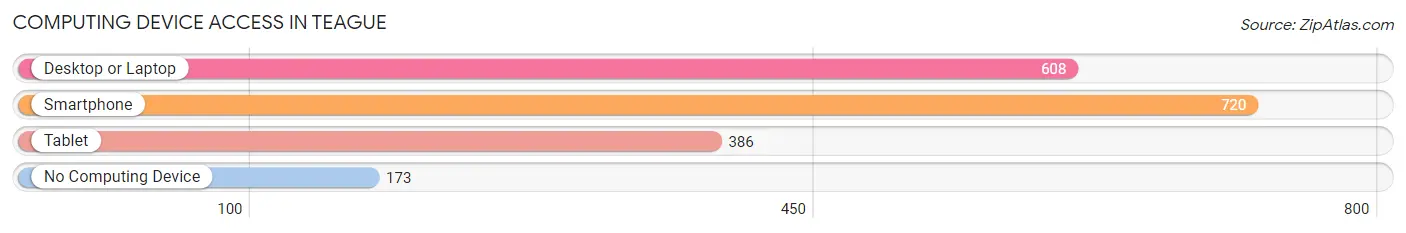
| Device Type | # Households | % Households |
| Desktop or Laptop | 608 | 65.3% |
| Smartphone | 720 | 77.3% |
| Tablet | 386 | 41.5% |
| No Computing Device | 173 | 18.6% |
| Total | 931 | 100.0% |
Internet Access in Teague
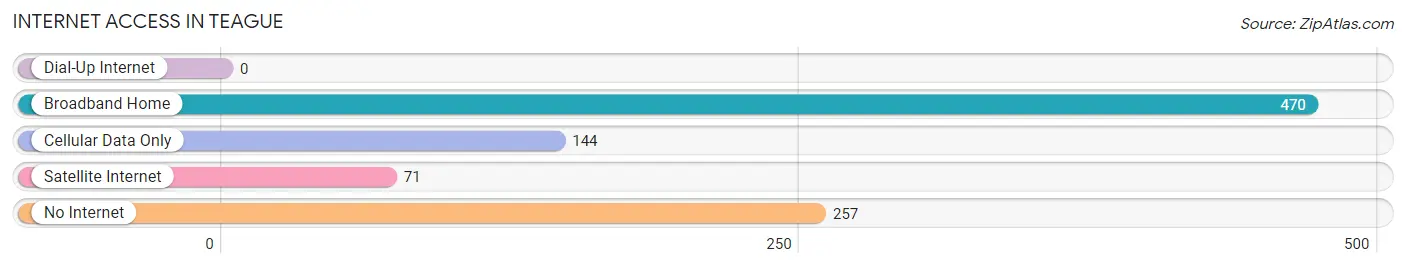
| Internet Type | # Households | % Households |
| Dial-Up Internet | 0 | 0.0% |
| Broadband Home | 470 | 50.5% |
| Cellular Data Only | 144 | 15.5% |
| Satellite Internet | 71 | 7.6% |
| No Internet | 257 | 27.6% |
| Total | 931 | 100.0% |
Teague Summary
Teague, Texas is a small town located in Freestone County, Texas. It is situated about halfway between Dallas and Houston, and is part of the Waco Metropolitan Statistical Area. The town was founded in 1873 and has a population of 2,541 as of the 2010 census.
History
Teague was founded in 1873 by the Teague family, who had moved to the area from Tennessee. The town was named after the family, and the first post office was established in 1875. The town was incorporated in 1882, and the first mayor was elected in 1883.
The town grew slowly but steadily, and by the early 1900s, it had become a thriving agricultural center. Cotton was the main crop, and the town was home to several cotton gins and other businesses related to the cotton industry.
In the 1920s, the town began to diversify its economy, and the first oil well was drilled in 1923. This led to a boom in the oil industry, and the town became a major center for oil production.
The Great Depression hit the town hard, and many businesses closed. However, the town was able to recover, and by the 1950s, it had become a major center for the production of cotton and oil.
Geography
Teague is located in Freestone County, Texas, about halfway between Dallas and Houston. It is situated at the intersection of U.S. Highway 84 and State Highway 171. The town is located in the Blackland Prairie region of Texas, and the terrain is mostly flat.
The climate in Teague is humid subtropical, with hot summers and mild winters. The average annual temperature is around 68 degrees Fahrenheit, and the average annual precipitation is around 40 inches.
Economy
The economy of Teague is largely based on agriculture and oil production. Cotton is still the main crop, and the town is home to several cotton gins. The oil industry is also a major part of the economy, and there are several oil wells in the area.
In addition, the town is home to several small businesses, including restaurants, retail stores, and service providers. The town also has a small industrial park, which is home to several manufacturing companies.
Demographics
As of the 2010 census, the population of Teague was 2,541. The racial makeup of the town was 79.3% White, 17.2% Hispanic or Latino, 1.3% African American, 0.7% Native American, 0.2% Asian, and 1.5% from other races.
The median household income in Teague was $31,250, and the median family income was $37,500. The per capita income was $17,845. About 17.2% of the population was below the poverty line.
Conclusion
Teague, Texas is a small town located in Freestone County, Texas. It was founded in 1873 and has a population of 2,541 as of the 2010 census. The town is situated halfway between Dallas and Houston, and is part of the Waco Metropolitan Statistical Area. The economy of Teague is largely based on agriculture and oil production, and the town is home to several small businesses. The racial makeup of the town is 79.3% White, 17.2% Hispanic or Latino, 1.3% African American, 0.7% Native American, 0.2% Asian, and 1.5% from other races. The median household income in Teague was $31,250, and the median family income was $37,500.
Common Questions
What is Per Capita Income in Teague?
Per Capita income in Teague is $22,779.
What is the Median Family Income in Teague?
Median Family Income in Teague is $69,611.
What is the Median Household income in Teague?
Median Household Income in Teague is $63,640.
What is Income or Wage Gap in Teague?
Income or Wage Gap in Teague is 19.8%.
Women in Teague earn 80.2 cents for every dollar earned by a man.
What is Inequality or Gini Index in Teague?
Inequality or Gini Index in Teague is 0.39.
What is the Total Population of Teague?
Total Population of Teague is 3,409.
What is the Total Male Population of Teague?
Total Male Population of Teague is 1,631.
What is the Total Female Population of Teague?
Total Female Population of Teague is 1,778.
What is the Ratio of Males per 100 Females in Teague?
There are 91.73 Males per 100 Females in Teague.
What is the Ratio of Females per 100 Males in Teague?
There are 109.01 Females per 100 Males in Teague.
What is the Median Population Age in Teague?
Median Population Age in Teague is 31.4 Years.
What is the Average Family Size in Teague
Average Family Size in Teague is 4.2 People.
What is the Average Household Size in Teague
Average Household Size in Teague is 3.6 People.
How Large is the Labor Force in Teague?
There are 1,326 People in the Labor Forcein in Teague.
What is the Percentage of People in the Labor Force in Teague?
57.4% of People are in the Labor Force in Teague.
What is the Unemployment Rate in Teague?
Unemployment Rate in Teague is 2.0%.