Sweetwater, TX Map & Demographics
Sweetwater Map
Sweetwater Overview
$25,087
PER CAPITA INCOME
$54,167
AVG FAMILY INCOME
$44,306
AVG HOUSEHOLD INCOME
24.7%
WAGE / INCOME GAP [ % ]
75.3¢/ $1
WAGE / INCOME GAP [ $ ]
$8,687
FAMILY INCOME DEFICIT
0.48
INEQUALITY / GINI INDEX
10,546
TOTAL POPULATION
5,228
MALE POPULATION
5,318
FEMALE POPULATION
98.31
MALES / 100 FEMALES
101.72
FEMALES / 100 MALES
35.7
MEDIAN AGE
3.3
AVG FAMILY SIZE
2.6
AVG HOUSEHOLD SIZE
4,889
LABOR FORCE [ PEOPLE ]
61.1%
PERCENT IN LABOR FORCE
6.3%
UNEMPLOYMENT RATE
Sweetwater Zip Codes
Sweetwater Area Codes
Income in Sweetwater
Income Overview in Sweetwater
Per Capita Income in Sweetwater is $25,087, while median incomes of families and households are $54,167 and $44,306 respectively.
| Characteristic | Number | Measure |
| Per Capita Income | 10,546 | $25,087 |
| Median Family Income | 2,408 | $54,167 |
| Mean Family Income | 2,408 | $74,394 |
| Median Household Income | 4,040 | $44,306 |
| Mean Household Income | 4,040 | $61,972 |
| Income Deficit | 2,408 | $8,687 |
| Wage / Income Gap (%) | 10,546 | 24.69% |
| Wage / Income Gap ($) | 10,546 | 75.31¢ per $1 |
| Gini / Inequality Index | 10,546 | 0.48 |
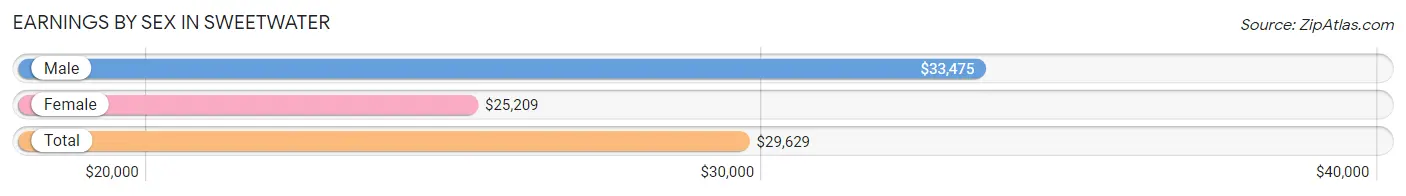
Earnings by Sex in Sweetwater
Average Earnings in Sweetwater are $29,629, $33,475 for men and $25,209 for women, a difference of 24.7%.
| Sex | Number | Average Earnings |
| Male | 2,849 (55.3%) | $33,475 |
| Female | 2,301 (44.7%) | $25,209 |
| Total | 5,150 (100.0%) | $29,629 |
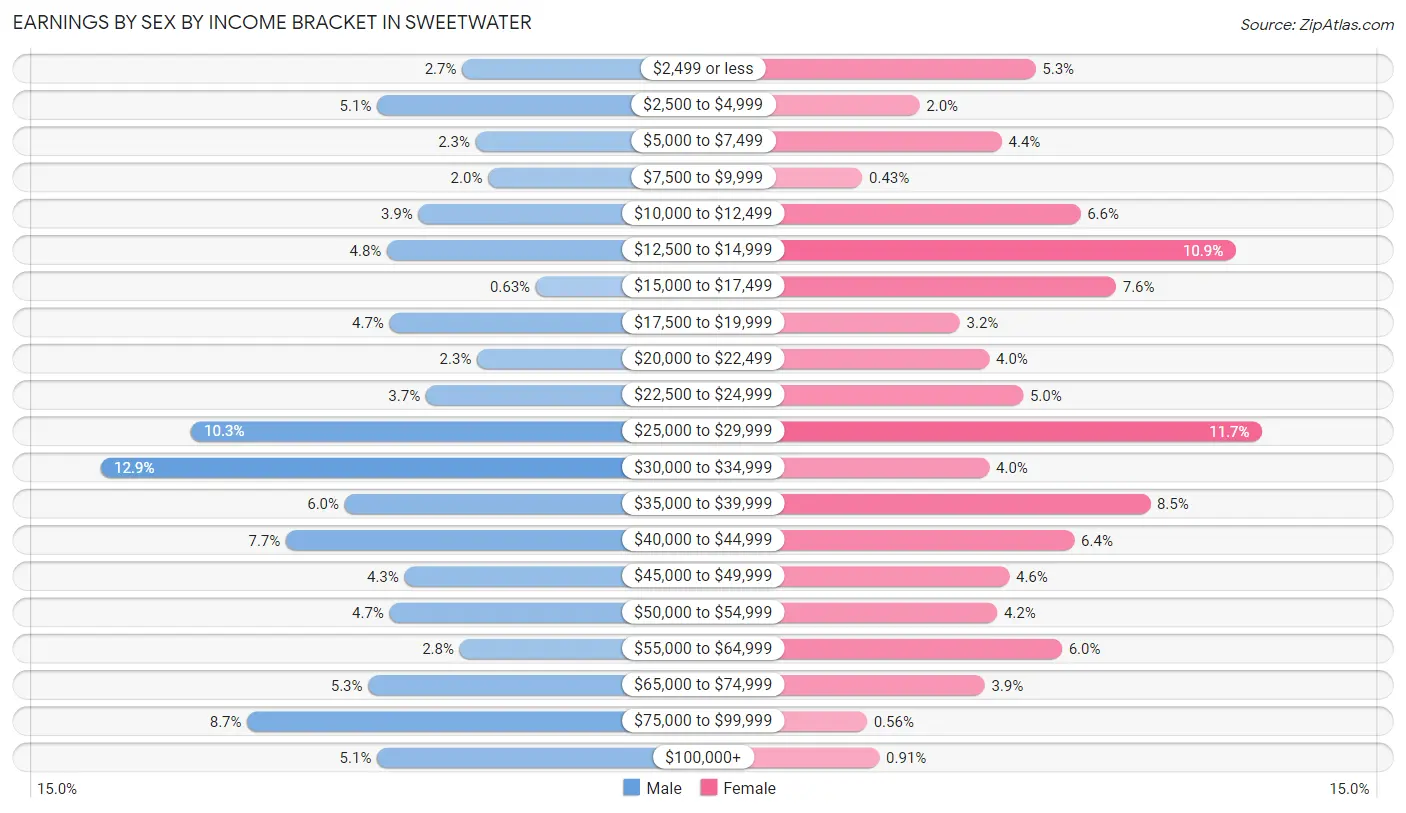
Earnings by Sex by Income Bracket in Sweetwater
The most common earnings brackets in Sweetwater are $30,000 to $34,999 for men (366 | 12.9%) and $25,000 to $29,999 for women (268 | 11.7%).
| Income | Male | Female |
| $2,499 or less | 77 (2.7%) | 122 (5.3%) |
| $2,500 to $4,999 | 145 (5.1%) | 47 (2.0%) |
| $5,000 to $7,499 | 66 (2.3%) | 100 (4.3%) |
| $7,500 to $9,999 | 56 (2.0%) | 10 (0.4%) |
| $10,000 to $12,499 | 112 (3.9%) | 151 (6.6%) |
| $12,500 to $14,999 | 137 (4.8%) | 251 (10.9%) |
| $15,000 to $17,499 | 18 (0.6%) | 174 (7.6%) |
| $17,500 to $19,999 | 135 (4.7%) | 73 (3.2%) |
| $20,000 to $22,499 | 65 (2.3%) | 92 (4.0%) |
| $22,500 to $24,999 | 106 (3.7%) | 114 (5.0%) |
| $25,000 to $29,999 | 294 (10.3%) | 268 (11.7%) |
| $30,000 to $34,999 | 366 (12.9%) | 92 (4.0%) |
| $35,000 to $39,999 | 171 (6.0%) | 196 (8.5%) |
| $40,000 to $44,999 | 218 (7.6%) | 147 (6.4%) |
| $45,000 to $49,999 | 123 (4.3%) | 105 (4.6%) |
| $50,000 to $54,999 | 135 (4.7%) | 97 (4.2%) |
| $55,000 to $64,999 | 79 (2.8%) | 139 (6.0%) |
| $65,000 to $74,999 | 152 (5.3%) | 89 (3.9%) |
| $75,000 to $99,999 | 249 (8.7%) | 13 (0.6%) |
| $100,000+ | 145 (5.1%) | 21 (0.9%) |
| Total | 2,849 (100.0%) | 2,301 (100.0%) |
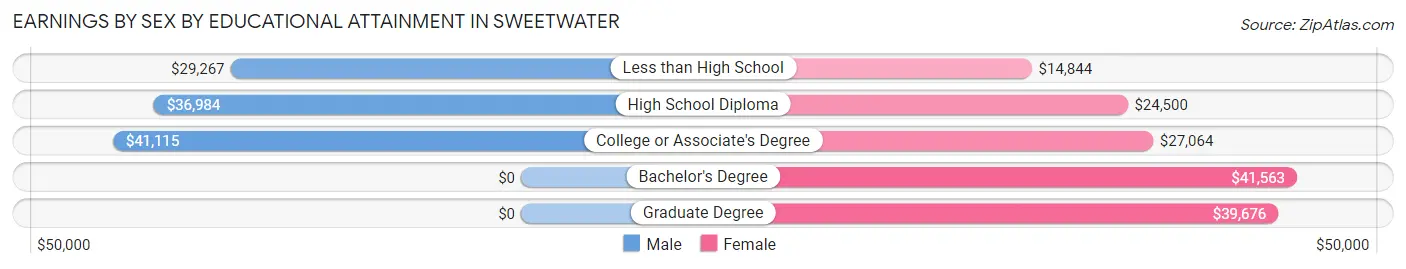
Earnings by Sex by Educational Attainment in Sweetwater
Average earnings in Sweetwater are $37,053 for men and $26,430 for women, a difference of 28.7%. Men with an educational attainment of college or associate's degree enjoy the highest average annual earnings of $41,115, while those with less than high school education earn the least with $29,267. Women with an educational attainment of bachelor's degree earn the most with the average annual earnings of $41,563, while those with less than high school education have the smallest earnings of $14,844.
| Educational Attainment | Male Income | Female Income |
| Less than High School | $29,267 | $14,844 |
| High School Diploma | $36,984 | $24,500 |
| College or Associate's Degree | $41,115 | $27,064 |
| Bachelor's Degree | - | - |
| Graduate Degree | - | - |
| Total | $37,053 | $26,430 |
Family Income in Sweetwater
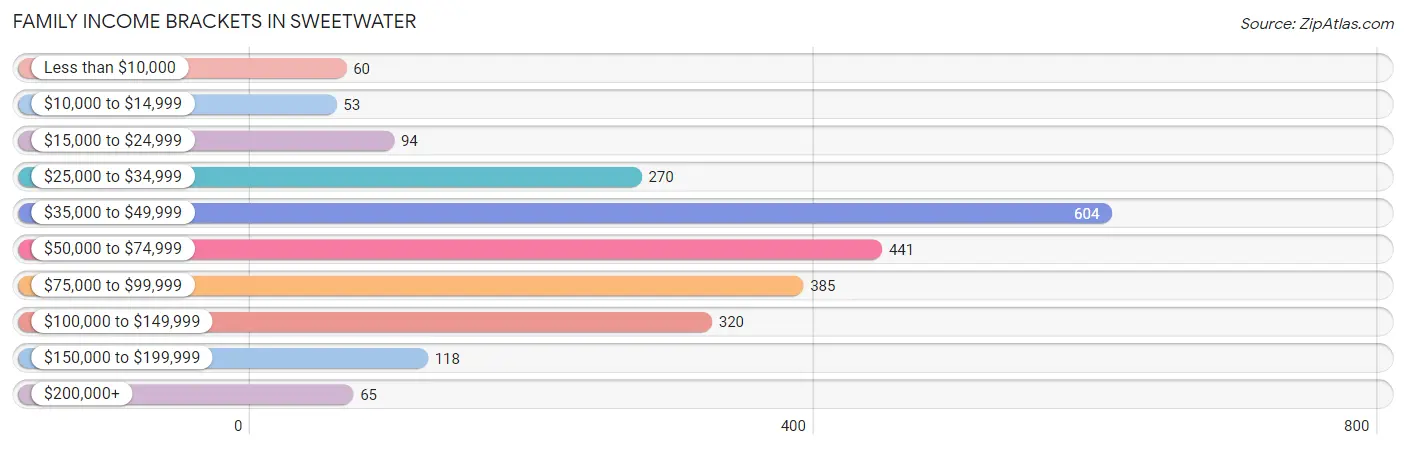
Family Income Brackets in Sweetwater
According to the Sweetwater family income data, there are 604 families falling into the $35,000 to $49,999 income range, which is the most common income bracket and makes up 25.1% of all families. Conversely, the $10,000 to $14,999 income bracket is the least frequent group with only 53 families (2.2%) belonging to this category.
| Income Bracket | # Families | % Families |
| Less than $10,000 | 60 | 2.5% |
| $10,000 to $14,999 | 53 | 2.2% |
| $15,000 to $24,999 | 94 | 3.9% |
| $25,000 to $34,999 | 270 | 11.2% |
| $35,000 to $49,999 | 604 | 25.1% |
| $50,000 to $74,999 | 441 | 18.3% |
| $75,000 to $99,999 | 385 | 16.0% |
| $100,000 to $149,999 | 320 | 13.3% |
| $150,000 to $199,999 | 118 | 4.9% |
| $200,000+ | 65 | 2.7% |
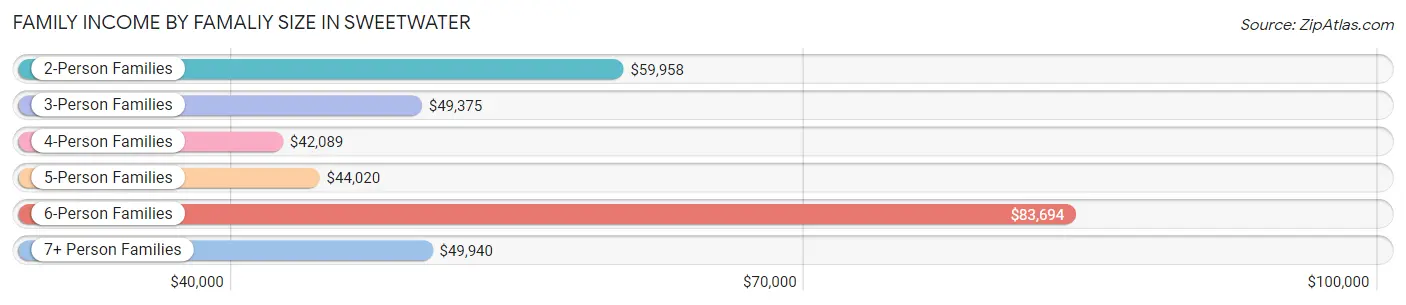
Family Income by Famaliy Size in Sweetwater
6-person families (96 | 4.0%) account for the highest median family income in Sweetwater with $83,694 per family, while 2-person families (980 | 40.7%) have the highest median income of $29,979 per family member.
| Income Bracket | # Families | Median Income |
| 2-Person Families | 980 (40.7%) | $59,958 |
| 3-Person Families | 573 (23.8%) | $49,375 |
| 4-Person Families | 366 (15.2%) | $42,089 |
| 5-Person Families | 270 (11.2%) | $44,020 |
| 6-Person Families | 96 (4.0%) | $83,694 |
| 7+ Person Families | 123 (5.1%) | $49,940 |
| Total | 2,408 (100.0%) | $54,167 |
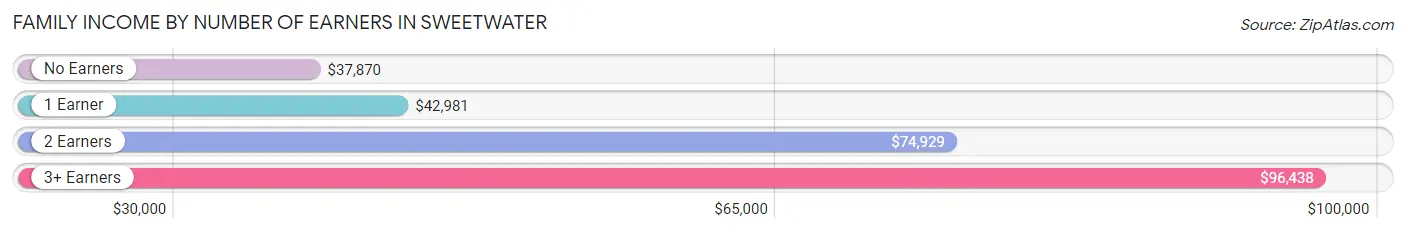
Family Income by Number of Earners in Sweetwater
The median family income in Sweetwater is $54,167, with families comprising 3+ earners (137) having the highest median family income of $96,438, while families with no earners (282) have the lowest median family income of $37,870, accounting for 5.7% and 11.7% of families, respectively.
| Number of Earners | # Families | Median Income |
| No Earners | 282 (11.7%) | $37,870 |
| 1 Earner | 848 (35.2%) | $42,981 |
| 2 Earners | 1,141 (47.4%) | $74,929 |
| 3+ Earners | 137 (5.7%) | $96,438 |
| Total | 2,408 (100.0%) | $54,167 |
Household Income in Sweetwater
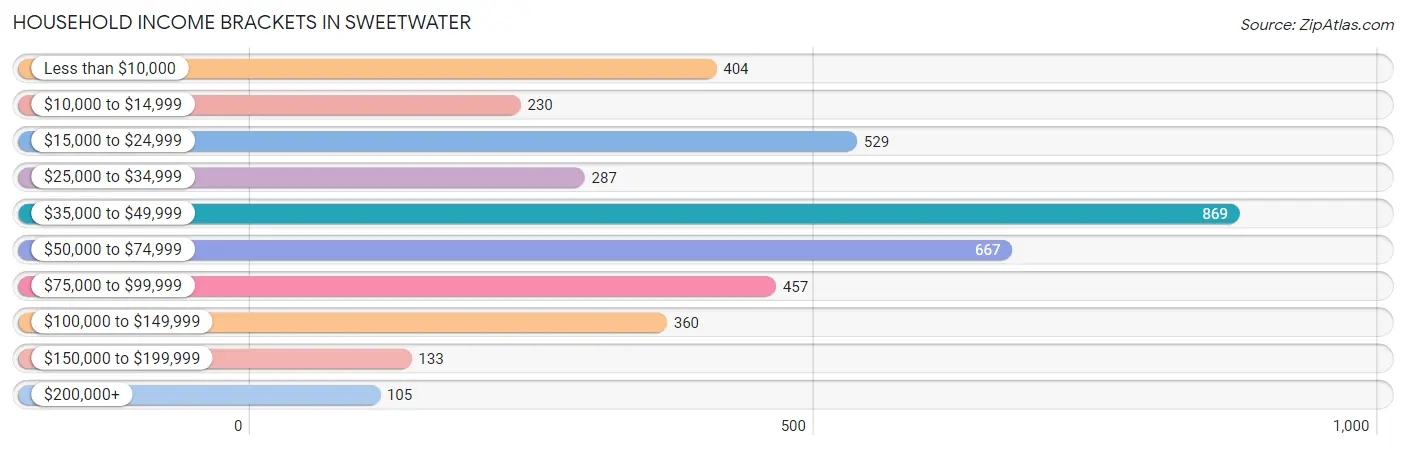
Household Income Brackets in Sweetwater
With 869 households falling in the category, the $35,000 to $49,999 income range is the most frequent in Sweetwater, accounting for 21.5% of all households. In contrast, only 105 households (2.6%) fall into the $200,000+ income bracket, making it the least populous group.
| Income Bracket | # Households | % Households |
| Less than $10,000 | 404 | 10.0% |
| $10,000 to $14,999 | 230 | 5.7% |
| $15,000 to $24,999 | 529 | 13.1% |
| $25,000 to $34,999 | 287 | 7.1% |
| $35,000 to $49,999 | 869 | 21.5% |
| $50,000 to $74,999 | 667 | 16.5% |
| $75,000 to $99,999 | 457 | 11.3% |
| $100,000 to $149,999 | 360 | 8.9% |
| $150,000 to $199,999 | 133 | 3.3% |
| $200,000+ | 105 | 2.6% |
Household Income by Householder Age in Sweetwater
The median household income in Sweetwater is $44,306, with the highest median household income of $49,797 found in the 15 to 24 years age bracket for the primary householder. A total of 100 households (2.5%) fall into this category. Meanwhile, the 65+ years age bracket for the primary householder has the lowest median household income of $37,336, with 1,176 households (29.1%) in this group.
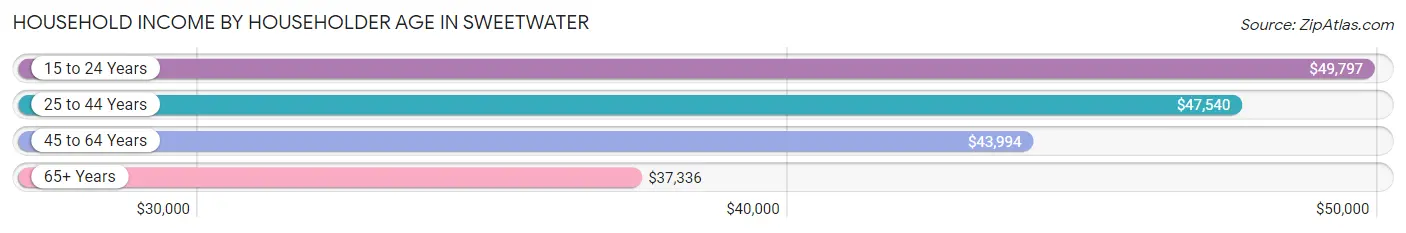
| Income Bracket | # Households | Median Income |
| 15 to 24 Years | 100 (2.5%) | $49,797 |
| 25 to 44 Years | 1,310 (32.4%) | $47,540 |
| 45 to 64 Years | 1,454 (36.0%) | $43,994 |
| 65+ Years | 1,176 (29.1%) | $37,336 |
| Total | 4,040 (100.0%) | $44,306 |
Poverty in Sweetwater
Income Below Poverty by Sex and Age in Sweetwater
With 13.5% poverty level for males and 23.1% for females among the residents of Sweetwater, 5 year old males and 16 and 17 year old females are the most vulnerable to poverty, with 10 males (100.0%) and 93 females (73.8%) in their respective age groups living below the poverty level.
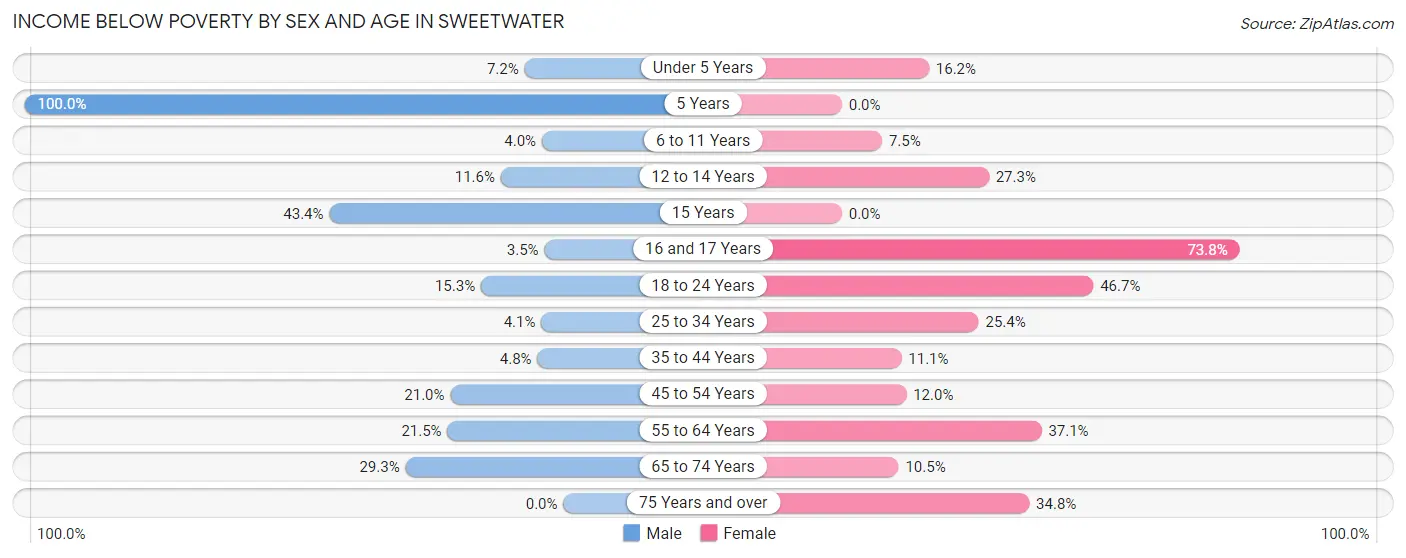
| Age Bracket | Male | Female |
| Under 5 Years | 26 (7.2%) | 79 (16.2%) |
| 5 Years | 10 (100.0%) | 0 (0.0%) |
| 6 to 11 Years | 20 (4.0%) | 31 (7.4%) |
| 12 to 14 Years | 26 (11.6%) | 81 (27.3%) |
| 15 Years | 43 (43.4%) | 0 (0.0%) |
| 16 and 17 Years | 8 (3.5%) | 93 (73.8%) |
| 18 to 24 Years | 85 (15.3%) | 196 (46.7%) |
| 25 to 34 Years | 21 (4.1%) | 178 (25.4%) |
| 35 to 44 Years | 31 (4.8%) | 60 (11.1%) |
| 45 to 54 Years | 126 (21.0%) | 69 (12.0%) |
| 55 to 64 Years | 128 (21.5%) | 219 (37.1%) |
| 65 to 74 Years | 167 (29.3%) | 57 (10.5%) |
| 75 Years and over | 0 (0.0%) | 136 (34.8%) |
| Total | 691 (13.5%) | 1,199 (23.1%) |
Income Above Poverty by Sex and Age in Sweetwater
According to the poverty statistics in Sweetwater, males aged 75 years and over and females aged 5 years are the age groups that are most secure financially, with 100.0% of males and 100.0% of females in these age groups living above the poverty line.
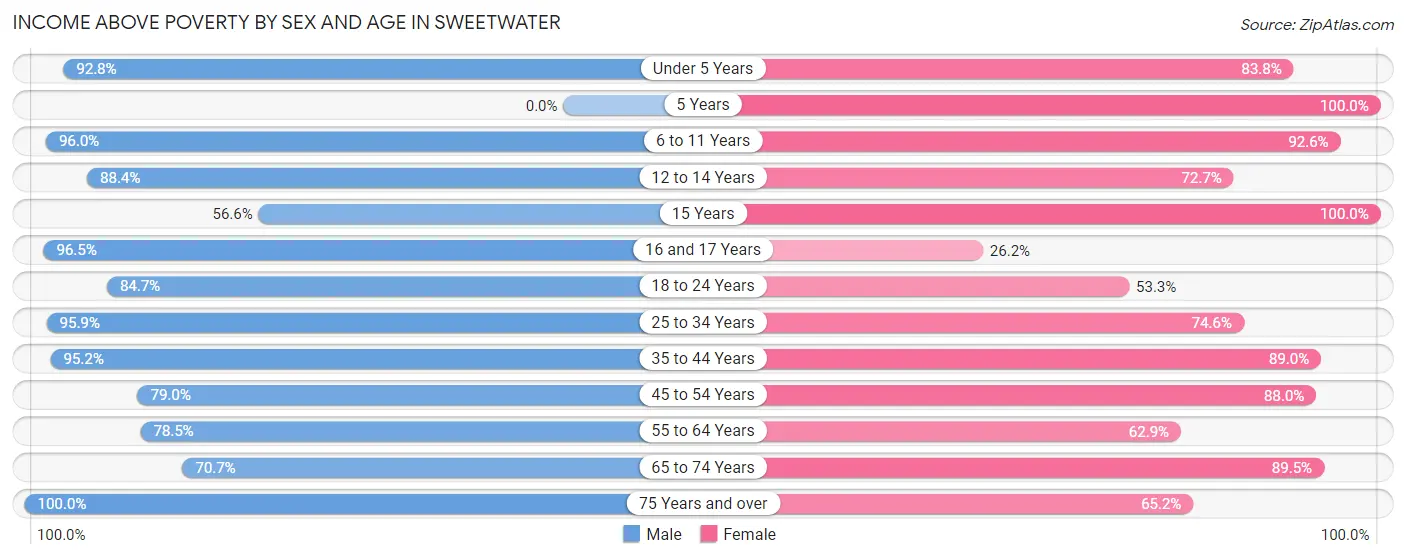
| Age Bracket | Male | Female |
| Under 5 Years | 335 (92.8%) | 410 (83.8%) |
| 5 Years | 0 (0.0%) | 70 (100.0%) |
| 6 to 11 Years | 484 (96.0%) | 385 (92.5%) |
| 12 to 14 Years | 198 (88.4%) | 216 (72.7%) |
| 15 Years | 56 (56.6%) | 30 (100.0%) |
| 16 and 17 Years | 220 (96.5%) | 33 (26.2%) |
| 18 to 24 Years | 471 (84.7%) | 224 (53.3%) |
| 25 to 34 Years | 493 (95.9%) | 523 (74.6%) |
| 35 to 44 Years | 614 (95.2%) | 483 (88.9%) |
| 45 to 54 Years | 475 (79.0%) | 508 (88.0%) |
| 55 to 64 Years | 467 (78.5%) | 372 (62.9%) |
| 65 to 74 Years | 403 (70.7%) | 485 (89.5%) |
| 75 Years and over | 224 (100.0%) | 255 (65.2%) |
| Total | 4,440 (86.5%) | 3,994 (76.9%) |
Income Below Poverty Among Married-Couple Families in Sweetwater
The poverty statistics for married-couple families in Sweetwater show that 4.1% or 64 of the total 1,553 families live below the poverty line. Families with 1 or 2 children have the highest poverty rate of 10.1%, comprising of 44 families. On the other hand, families with 3 or 4 children have the lowest poverty rate of 0.0%, which includes 0 families.
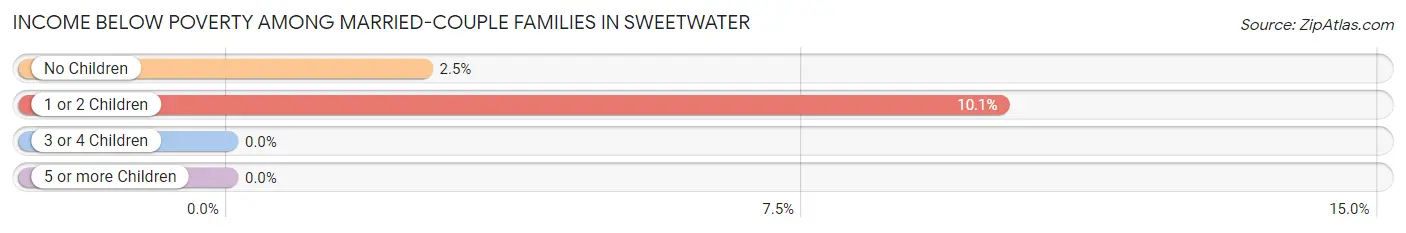
| Children | Above Poverty | Below Poverty |
| No Children | 767 (97.5%) | 20 (2.5%) |
| 1 or 2 Children | 393 (89.9%) | 44 (10.1%) |
| 3 or 4 Children | 206 (100.0%) | 0 (0.0%) |
| 5 or more Children | 123 (100.0%) | 0 (0.0%) |
| Total | 1,489 (95.9%) | 64 (4.1%) |
Income Below Poverty Among Single-Parent Households in Sweetwater
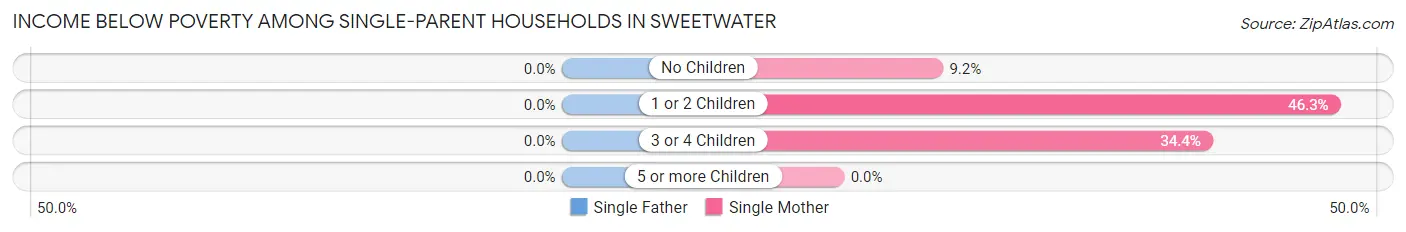
| Children | Single Father | Single Mother |
| No Children | 0 (0.0%) | 15 (9.2%) |
| 1 or 2 Children | 0 (0.0%) | 130 (46.3%) |
| 3 or 4 Children | 0 (0.0%) | 56 (34.4%) |
| 5 or more Children | 0 (0.0%) | 0 (0.0%) |
| Total | 0 (0.0%) | 201 (33.1%) |
Income Below Poverty Among Married-Couple vs Single-Parent Households in Sweetwater
The poverty data for Sweetwater shows that 64 of the married-couple family households (4.1%) and 201 of the single-parent households (23.5%) are living below the poverty level. Within the married-couple family households, those with 1 or 2 children have the highest poverty rate, with 44 households (10.1%) falling below the poverty line. Among the single-parent households, those with 3 or 4 children have the highest poverty rate, with 56 household (30.9%) living below poverty.
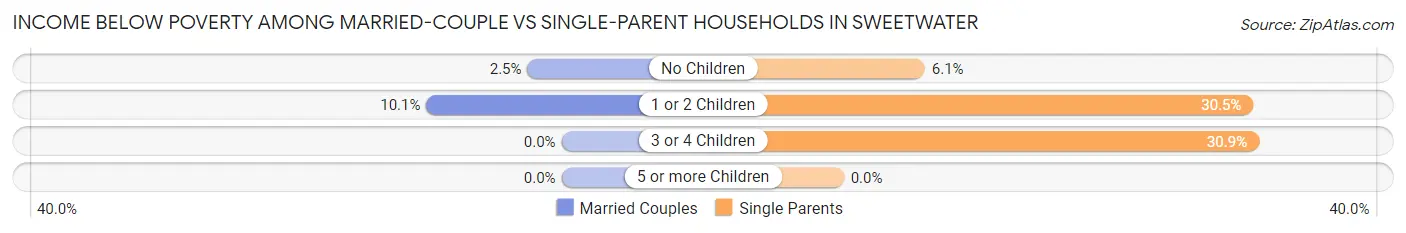
| Children | Married-Couple Families | Single-Parent Households |
| No Children | 20 (2.5%) | 15 (6.0%) |
| 1 or 2 Children | 44 (10.1%) | 130 (30.5%) |
| 3 or 4 Children | 0 (0.0%) | 56 (30.9%) |
| 5 or more Children | 0 (0.0%) | 0 (0.0%) |
| Total | 64 (4.1%) | 201 (23.5%) |
Race in Sweetwater
The most populous races in Sweetwater are White / Caucasian (7,476 | 70.9%), Hispanic or Latino (4,744 | 45.0%), and Two or more Races (1,405 | 13.3%).
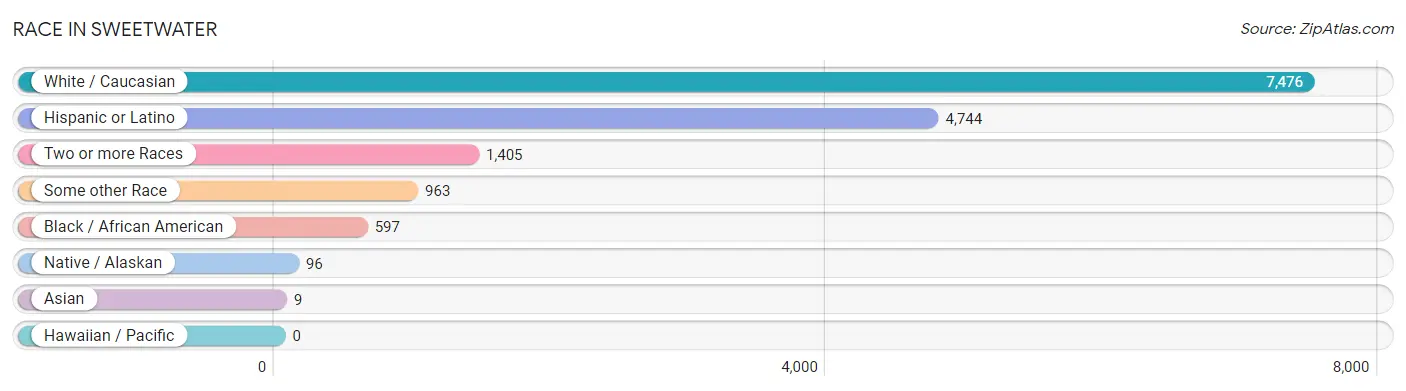
| Race | # Population | % Population |
| Asian | 9 | 0.1% |
| Black / African American | 597 | 5.7% |
| Hawaiian / Pacific | 0 | 0.0% |
| Hispanic or Latino | 4,744 | 45.0% |
| Native / Alaskan | 96 | 0.9% |
| White / Caucasian | 7,476 | 70.9% |
| Two or more Races | 1,405 | 13.3% |
| Some other Race | 963 | 9.1% |
| Total | 10,546 | 100.0% |
Ancestry in Sweetwater
The most populous ancestries reported in Sweetwater are Mexican (4,495 | 42.6%), English (891 | 8.5%), German (829 | 7.9%), American (775 | 7.3%), and Irish (668 | 6.3%), together accounting for 72.6% of all Sweetwater residents.
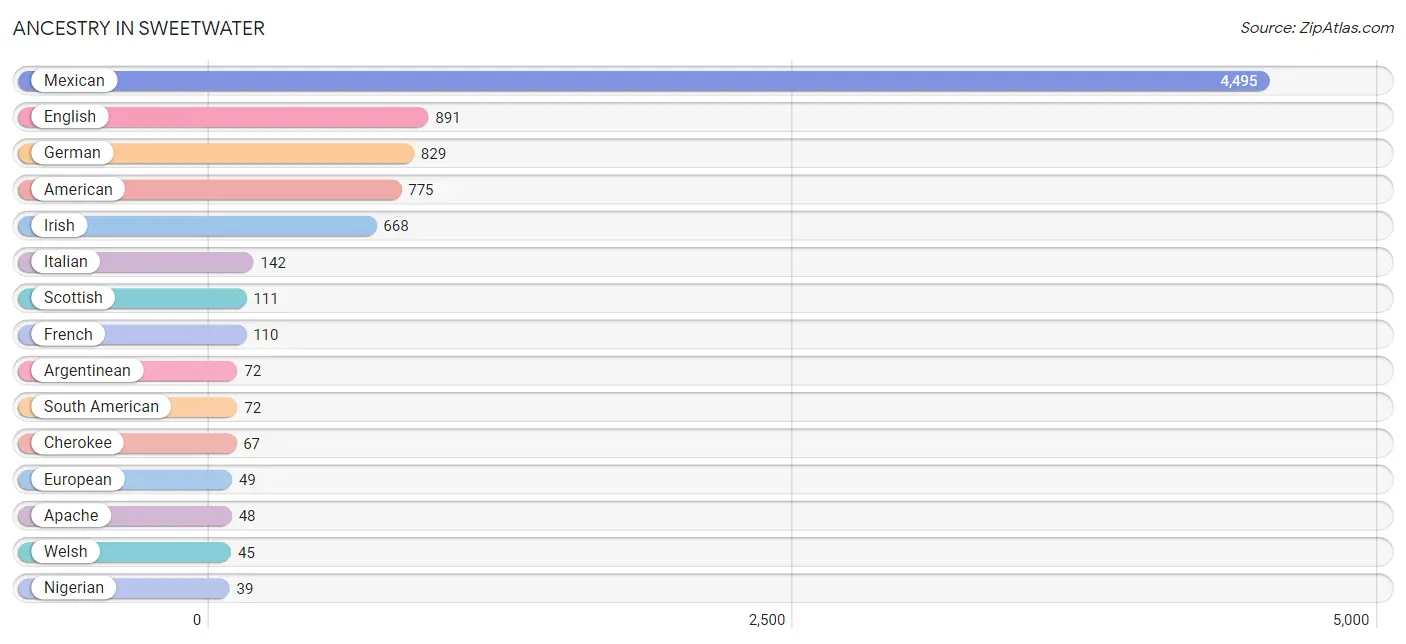
| Ancestry | # Population | % Population |
| American | 775 | 7.3% |
| Apache | 48 | 0.5% |
| Arab | 11 | 0.1% |
| Argentinean | 72 | 0.7% |
| Bhutanese | 17 | 0.2% |
| British | 31 | 0.3% |
| Canadian | 11 | 0.1% |
| Cherokee | 67 | 0.6% |
| Comanche | 38 | 0.4% |
| English | 891 | 8.5% |
| European | 49 | 0.5% |
| French | 110 | 1.0% |
| French Canadian | 24 | 0.2% |
| German | 829 | 7.9% |
| Iranian | 33 | 0.3% |
| Irish | 668 | 6.3% |
| Italian | 142 | 1.3% |
| Mexican | 4,495 | 42.6% |
| Mexican American Indian | 24 | 0.2% |
| Nigerian | 39 | 0.4% |
| Norwegian | 25 | 0.2% |
| Puerto Rican | 9 | 0.1% |
| Scotch-Irish | 28 | 0.3% |
| Scottish | 111 | 1.1% |
| Slovak | 10 | 0.1% |
| South American | 72 | 0.7% |
| Spaniard | 27 | 0.3% |
| Subsaharan African | 39 | 0.4% |
| Swedish | 5 | 0.1% |
| Syrian | 11 | 0.1% |
| Turkish | 5 | 0.1% |
| Ukrainian | 10 | 0.1% |
| Welsh | 45 | 0.4% | View All 33 Rows |
Immigrants in Sweetwater
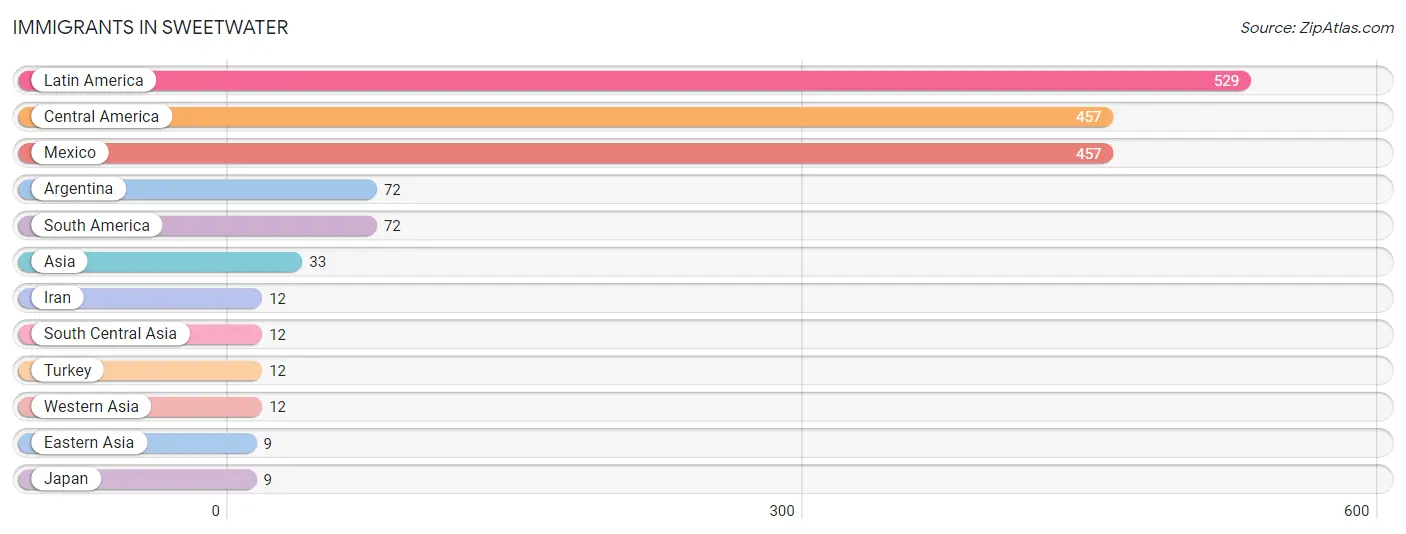
The most numerous immigrant groups reported in Sweetwater came from Latin America (529 | 5.0%), Central America (457 | 4.3%), Mexico (457 | 4.3%), Argentina (72 | 0.7%), and South America (72 | 0.7%), together accounting for 15.0% of all Sweetwater residents.
| Immigration Origin | # Population | % Population |
| Argentina | 72 | 0.7% |
| Asia | 33 | 0.3% |
| Central America | 457 | 4.3% |
| Eastern Asia | 9 | 0.1% |
| Iran | 12 | 0.1% |
| Japan | 9 | 0.1% |
| Latin America | 529 | 5.0% |
| Mexico | 457 | 4.3% |
| South America | 72 | 0.7% |
| South Central Asia | 12 | 0.1% |
| Turkey | 12 | 0.1% |
| Western Asia | 12 | 0.1% | View All 12 Rows |
Sex and Age in Sweetwater
Sex and Age in Sweetwater
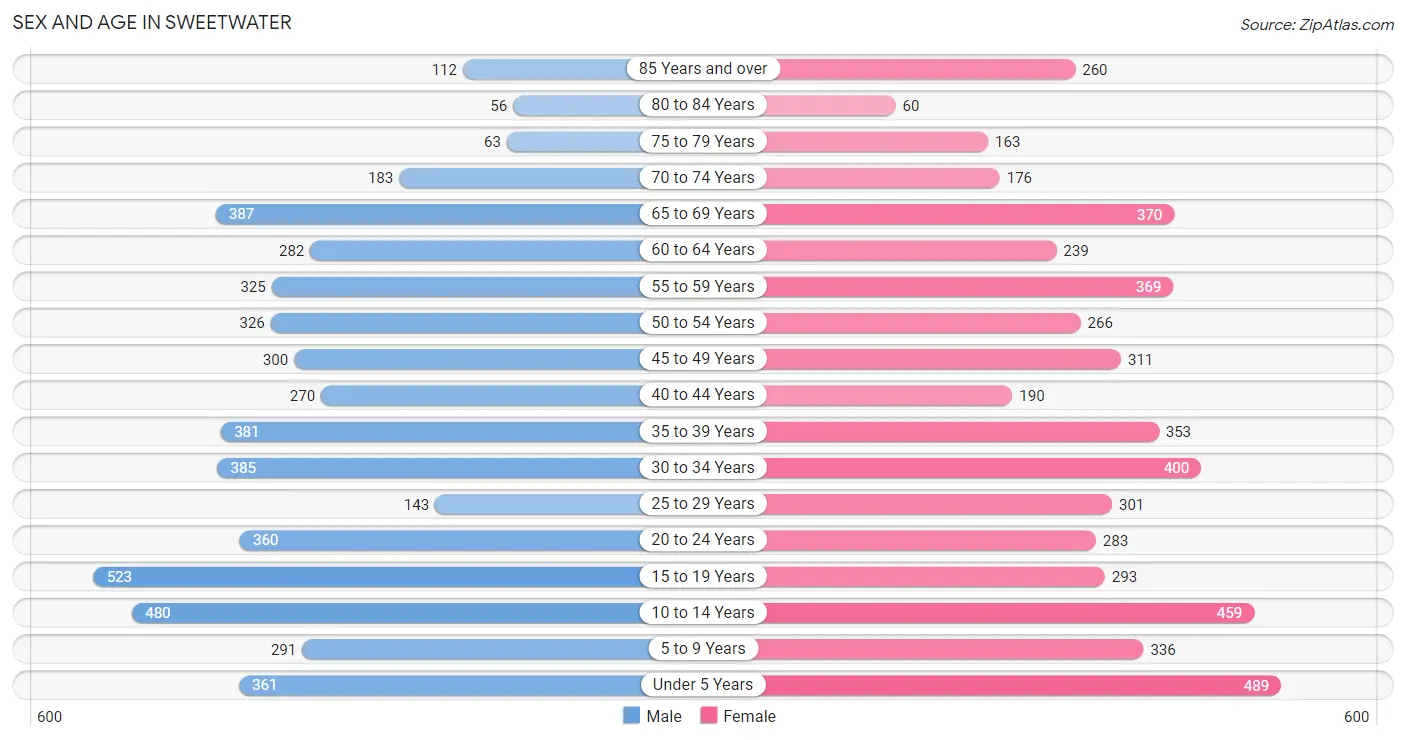
The most populous age groups in Sweetwater are 15 to 19 Years (523 | 10.0%) for men and Under 5 Years (489 | 9.2%) for women.
| Age Bracket | Male | Female |
| Under 5 Years | 361 (6.9%) | 489 (9.2%) |
| 5 to 9 Years | 291 (5.6%) | 336 (6.3%) |
| 10 to 14 Years | 480 (9.2%) | 459 (8.6%) |
| 15 to 19 Years | 523 (10.0%) | 293 (5.5%) |
| 20 to 24 Years | 360 (6.9%) | 283 (5.3%) |
| 25 to 29 Years | 143 (2.7%) | 301 (5.7%) |
| 30 to 34 Years | 385 (7.4%) | 400 (7.5%) |
| 35 to 39 Years | 381 (7.3%) | 353 (6.6%) |
| 40 to 44 Years | 270 (5.2%) | 190 (3.6%) |
| 45 to 49 Years | 300 (5.7%) | 311 (5.9%) |
| 50 to 54 Years | 326 (6.2%) | 266 (5.0%) |
| 55 to 59 Years | 325 (6.2%) | 369 (6.9%) |
| 60 to 64 Years | 282 (5.4%) | 239 (4.5%) |
| 65 to 69 Years | 387 (7.4%) | 370 (7.0%) |
| 70 to 74 Years | 183 (3.5%) | 176 (3.3%) |
| 75 to 79 Years | 63 (1.2%) | 163 (3.1%) |
| 80 to 84 Years | 56 (1.1%) | 60 (1.1%) |
| 85 Years and over | 112 (2.1%) | 260 (4.9%) |
| Total | 5,228 (100.0%) | 5,318 (100.0%) |
Families and Households in Sweetwater
Median Family Size in Sweetwater
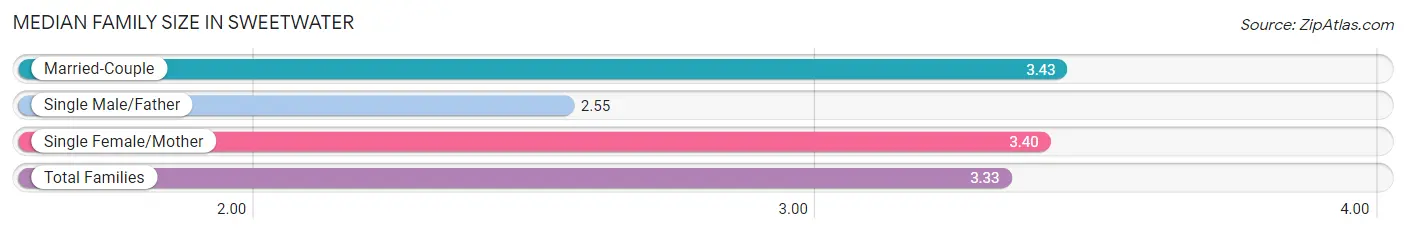
The median family size in Sweetwater is 3.33 persons per family, with married-couple families (1,553 | 64.5%) accounting for the largest median family size of 3.43 persons per family. On the other hand, single male/father families (248 | 10.3%) represent the smallest median family size with 2.55 persons per family.
| Family Type | # Families | Family Size |
| Married-Couple | 1,553 (64.5%) | 3.43 |
| Single Male/Father | 248 (10.3%) | 2.55 |
| Single Female/Mother | 607 (25.2%) | 3.40 |
| Total Families | 2,408 (100.0%) | 3.33 |
Median Household Size in Sweetwater
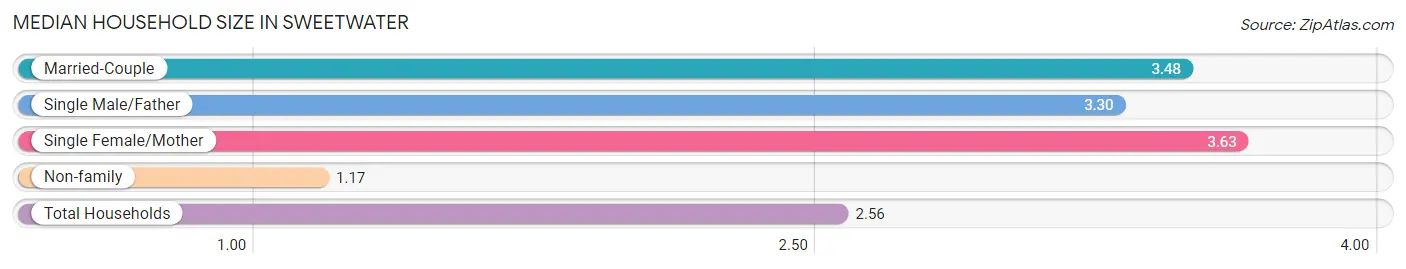
The median household size in Sweetwater is 2.56 persons per household, with single female/mother households (607 | 15.0%) accounting for the largest median household size of 3.63 persons per household. non-family households (1,632 | 40.4%) represent the smallest median household size with 1.17 persons per household.
| Household Type | # Households | Household Size |
| Married-Couple | 1,553 (38.4%) | 3.48 |
| Single Male/Father | 248 (6.1%) | 3.30 |
| Single Female/Mother | 607 (15.0%) | 3.63 |
| Non-family | 1,632 (40.4%) | 1.17 |
| Total Households | 4,040 (100.0%) | 2.56 |
Household Size by Marriage Status in Sweetwater
Out of a total of 4,040 households in Sweetwater, 2,408 (59.6%) are family households, while 1,632 (40.4%) are nonfamily households. The most numerous type of family households are 2-person households, comprising 857, and the most common type of nonfamily households are 1-person households, comprising 1,451.
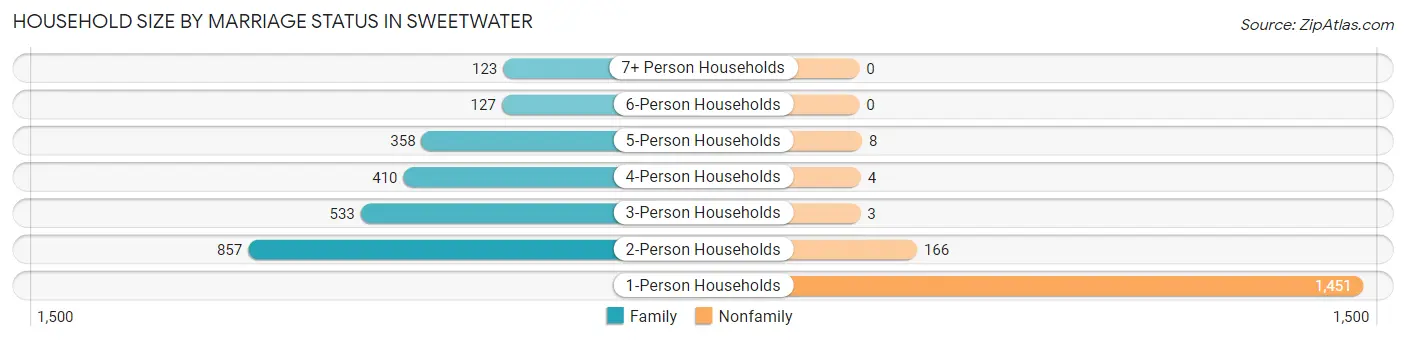
| Household Size | Family Households | Nonfamily Households |
| 1-Person Households | - | 1,451 (35.9%) |
| 2-Person Households | 857 (21.2%) | 166 (4.1%) |
| 3-Person Households | 533 (13.2%) | 3 (0.1%) |
| 4-Person Households | 410 (10.2%) | 4 (0.1%) |
| 5-Person Households | 358 (8.9%) | 8 (0.2%) |
| 6-Person Households | 127 (3.1%) | 0 (0.0%) |
| 7+ Person Households | 123 (3.0%) | 0 (0.0%) |
| Total | 2,408 (59.6%) | 1,632 (40.4%) |
Female Fertility in Sweetwater
Fertility by Age in Sweetwater
Average fertility rate in Sweetwater is 77.0 births per 1,000 women. Women in the age bracket of 20 to 34 years have the highest fertility rate with 143.0 births per 1,000 women. Women in the age bracket of 20 to 34 years acount for 84.4% of all women with births.
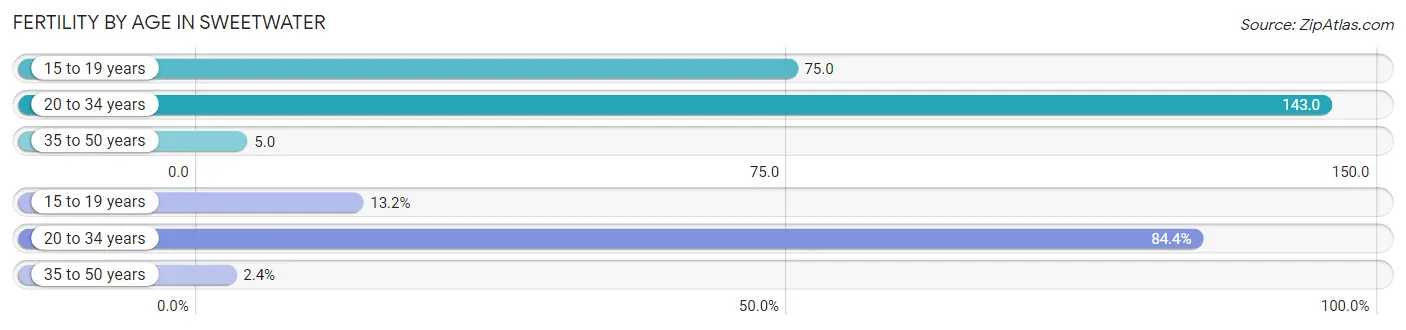
| Age Bracket | Women with Births | Births / 1,000 Women |
| 15 to 19 years | 22 (13.2%) | 75.0 |
| 20 to 34 years | 141 (84.4%) | 143.0 |
| 35 to 50 years | 4 (2.4%) | 5.0 |
| Total | 167 (100.0%) | 77.0 |
Fertility by Age by Marriage Status in Sweetwater
56.3% of women with births (167) in Sweetwater are married. The highest percentage of unmarried women with births falls into 15 to 19 years age bracket with 100.0% of them unmarried at the time of birth, while the lowest percentage of unmarried women with births belong to 35 to 50 years age bracket with 0.0% of them unmarried.
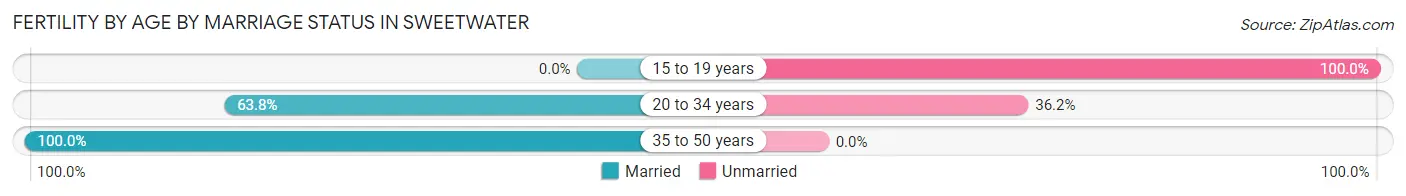
| Age Bracket | Married | Unmarried |
| 15 to 19 years | 0 (0.0%) | 22 (100.0%) |
| 20 to 34 years | 90 (63.8%) | 51 (36.2%) |
| 35 to 50 years | 4 (100.0%) | 0 (0.0%) |
| Total | 94 (56.3%) | 73 (43.7%) |
Fertility by Education in Sweetwater
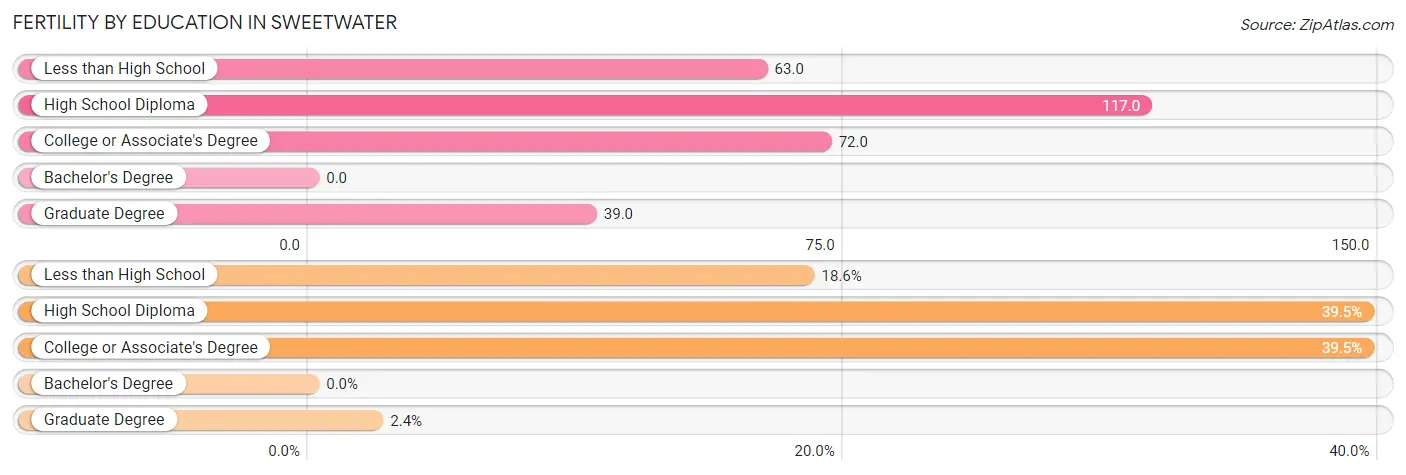
| Educational Attainment | Women with Births | Births / 1,000 Women |
| Less than High School | 31 (18.6%) | 63.0 |
| High School Diploma | 66 (39.5%) | 117.0 |
| College or Associate's Degree | 66 (39.5%) | 72.0 |
| Bachelor's Degree | 0 (0.0%) | 0.0 |
| Graduate Degree | 4 (2.4%) | 39.0 |
| Total | 167 (100.0%) | 77.0 |
Fertility by Education by Marriage Status in Sweetwater
43.7% of women with births in Sweetwater are unmarried. Women with the educational attainment of graduate degree are most likely to be married with 100.0% of them married at childbirth, while women with the educational attainment of less than high school are least likely to be married with 100.0% of them unmarried at childbirth.
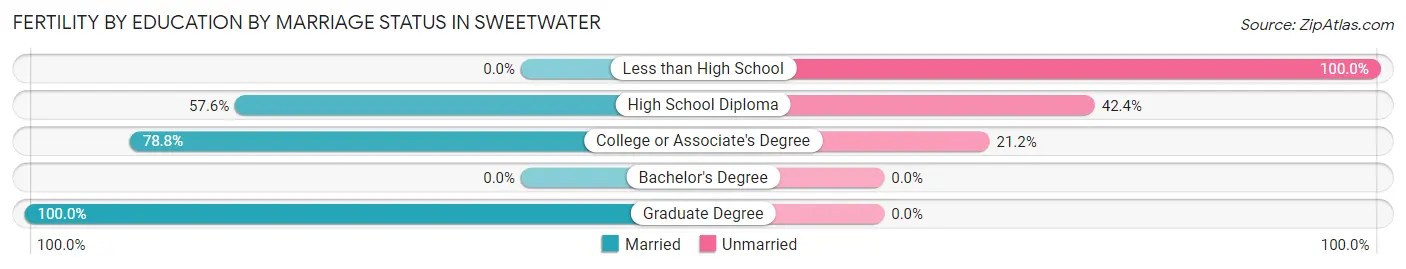
| Educational Attainment | Married | Unmarried |
| Less than High School | 0 (0.0%) | 31 (100.0%) |
| High School Diploma | 38 (57.6%) | 28 (42.4%) |
| College or Associate's Degree | 52 (78.8%) | 14 (21.2%) |
| Bachelor's Degree | 0 (0.0%) | 0 (0.0%) |
| Graduate Degree | 4 (100.0%) | 0 (0.0%) |
| Total | 94 (56.3%) | 73 (43.7%) |
Employment Characteristics in Sweetwater
Employment by Class of Employer in Sweetwater
Among the 4,483 employed individuals in Sweetwater, private company employees (3,188 | 71.1%), local government employees (475 | 10.6%), and self-employed (not incorporated) (259 | 5.8%) make up the most common classes of employment.
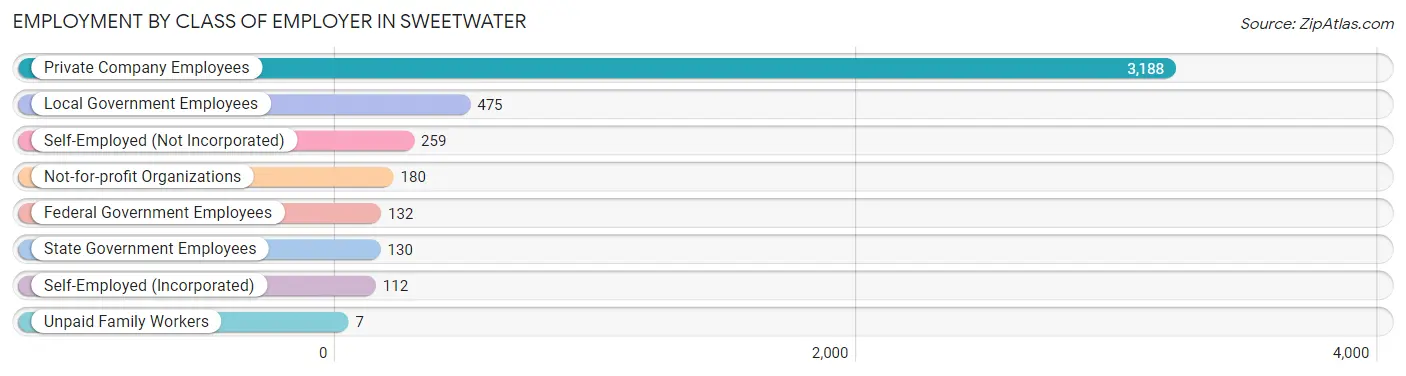
| Employer Class | # Employees | % Employees |
| Private Company Employees | 3,188 | 71.1% |
| Self-Employed (Incorporated) | 112 | 2.5% |
| Self-Employed (Not Incorporated) | 259 | 5.8% |
| Not-for-profit Organizations | 180 | 4.0% |
| Local Government Employees | 475 | 10.6% |
| State Government Employees | 130 | 2.9% |
| Federal Government Employees | 132 | 2.9% |
| Unpaid Family Workers | 7 | 0.2% |
| Total | 4,483 | 100.0% |
Employment Status by Age in Sweetwater
According to the labor force statistics for Sweetwater, out of the total population over 16 years of age (8,001), 61.1% or 4,889 individuals are in the labor force, with 6.3% or 308 of them unemployed. The age group with the highest labor force participation rate is 35 to 44 years, with 87.0% or 1,039 individuals in the labor force. Within the labor force, the 16 to 19 years age range has the highest percentage of unemployed individuals, with 21.3% or 67 of them being unemployed.
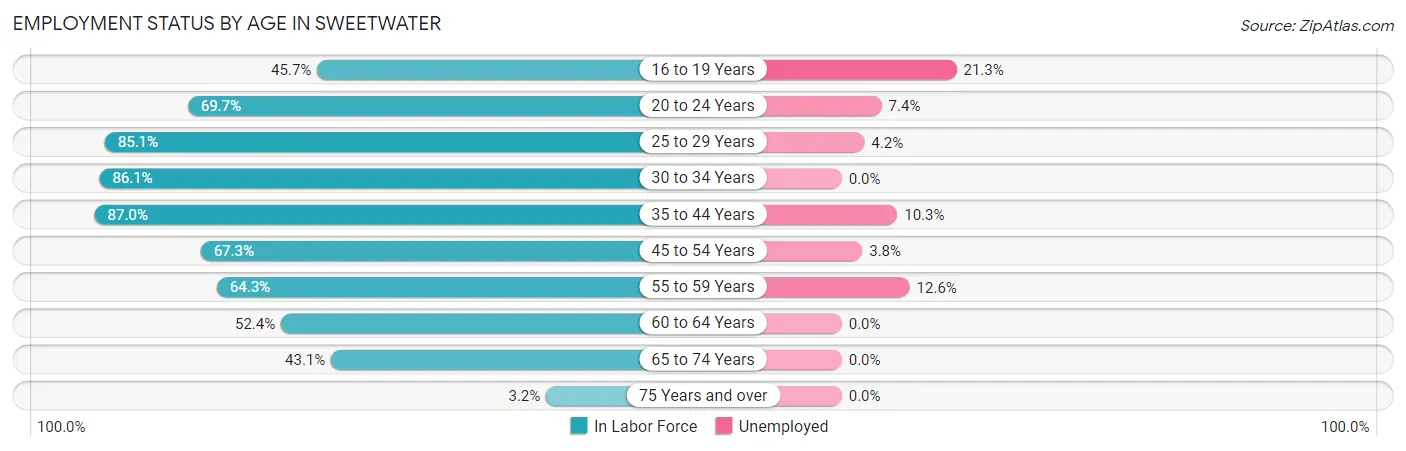
| Age Bracket | In Labor Force | Unemployed |
| 16 to 19 Years | 314 (45.7%) | 67 (21.3%) |
| 20 to 24 Years | 448 (69.7%) | 33 (7.4%) |
| 25 to 29 Years | 378 (85.1%) | 16 (4.2%) |
| 30 to 34 Years | 676 (86.1%) | 0 (0.0%) |
| 35 to 44 Years | 1,039 (87.0%) | 107 (10.3%) |
| 45 to 54 Years | 810 (67.3%) | 31 (3.8%) |
| 55 to 59 Years | 446 (64.3%) | 56 (12.6%) |
| 60 to 64 Years | 273 (52.4%) | 0 (0.0%) |
| 65 to 74 Years | 481 (43.1%) | 0 (0.0%) |
| 75 Years and over | 23 (3.2%) | 0 (0.0%) |
| Total | 4,889 (61.1%) | 308 (6.3%) |
Employment Status by Educational Attainment in Sweetwater
According to labor force statistics for Sweetwater, 74.8% of individuals (3,621) out of the total population between 25 and 64 years of age (4,841) are in the labor force, with 5.8% or 210 of them being unemployed. The group with the highest labor force participation rate are those with the educational attainment of bachelor's degree or higher, with 84.5% or 476 individuals in the labor force. Within the labor force, individuals with high school diploma education have the highest percentage of unemployment, with 10.7% or 129 of them being unemployed.
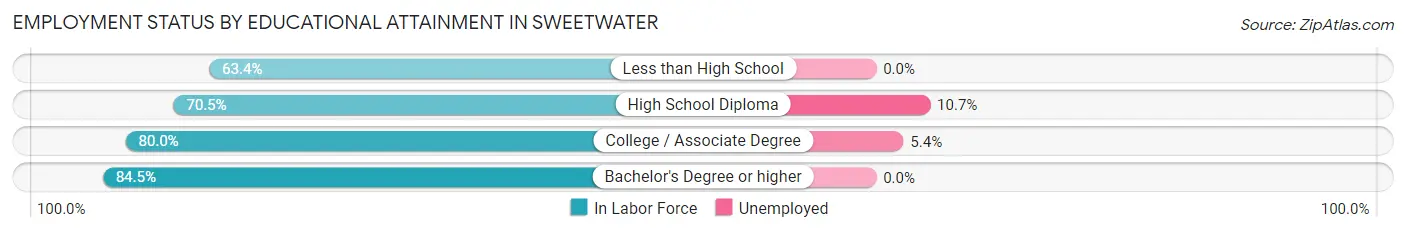
| Educational Attainment | In Labor Force | Unemployed |
| Less than High School | 429 (63.4%) | 0 (0.0%) |
| High School Diploma | 1,208 (70.5%) | 183 (10.7%) |
| College / Associate Degree | 1,510 (80.0%) | 102 (5.4%) |
| Bachelor's Degree or higher | 476 (84.5%) | 0 (0.0%) |
| Total | 3,621 (74.8%) | 281 (5.8%) |
Employment Occupations by Sex in Sweetwater
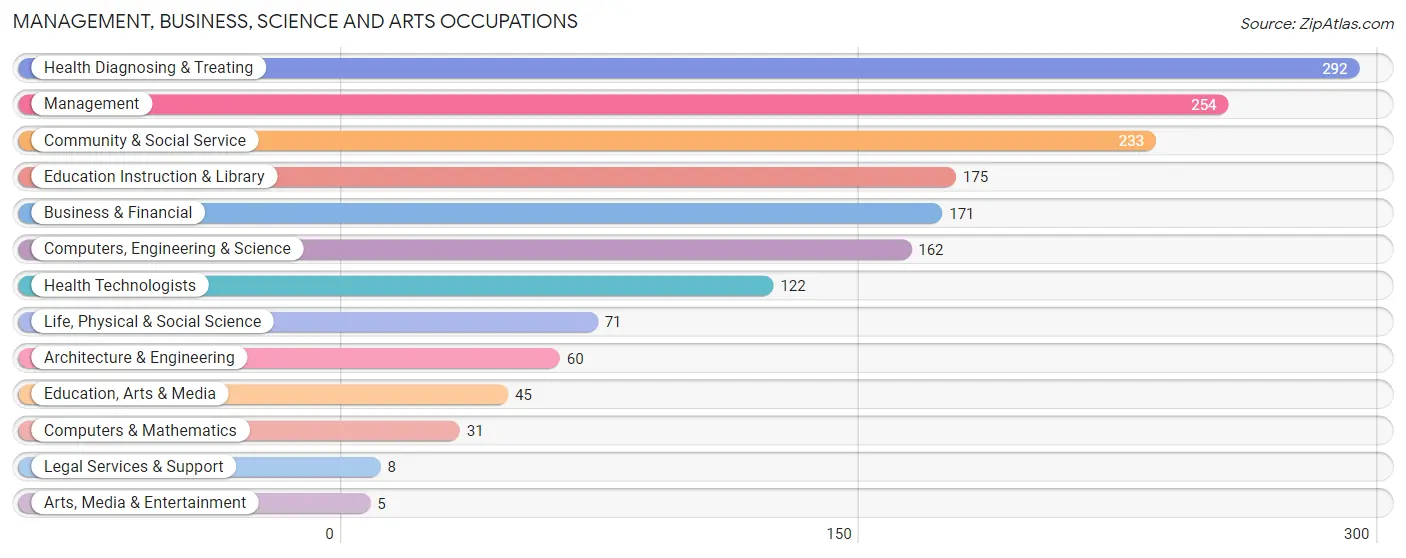
Management, Business, Science and Arts Occupations
The most common Management, Business, Science and Arts occupations in Sweetwater are Health Diagnosing & Treating (292 | 6.4%), Management (254 | 5.6%), Community & Social Service (233 | 5.1%), Education Instruction & Library (175 | 3.8%), and Business & Financial (171 | 3.7%).
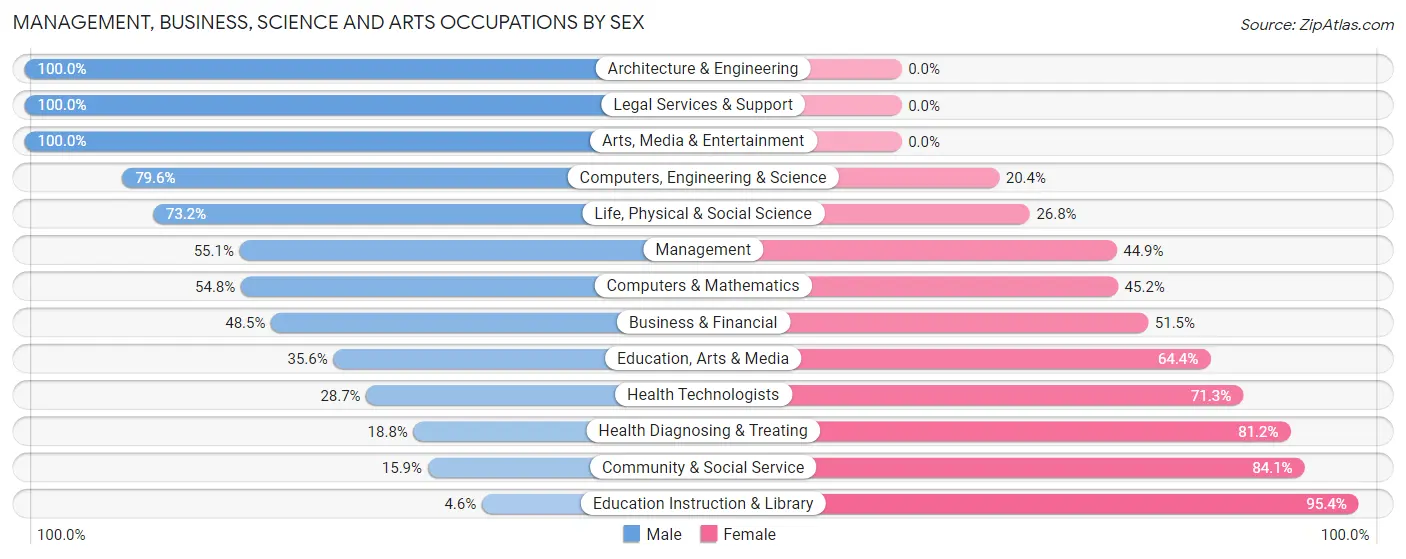
Management, Business, Science and Arts Occupations by Sex
Within the Management, Business, Science and Arts occupations in Sweetwater, the most male-oriented occupations are Architecture & Engineering (100.0%), Legal Services & Support (100.0%), and Arts, Media & Entertainment (100.0%), while the most female-oriented occupations are Education Instruction & Library (95.4%), Community & Social Service (84.1%), and Health Diagnosing & Treating (81.2%).
| Occupation | Male | Female |
| Management | 140 (55.1%) | 114 (44.9%) |
| Business & Financial | 83 (48.5%) | 88 (51.5%) |
| Computers, Engineering & Science | 129 (79.6%) | 33 (20.4%) |
| Computers & Mathematics | 17 (54.8%) | 14 (45.2%) |
| Architecture & Engineering | 60 (100.0%) | 0 (0.0%) |
| Life, Physical & Social Science | 52 (73.2%) | 19 (26.8%) |
| Community & Social Service | 37 (15.9%) | 196 (84.1%) |
| Education, Arts & Media | 16 (35.6%) | 29 (64.4%) |
| Legal Services & Support | 8 (100.0%) | 0 (0.0%) |
| Education Instruction & Library | 8 (4.6%) | 167 (95.4%) |
| Arts, Media & Entertainment | 5 (100.0%) | 0 (0.0%) |
| Health Diagnosing & Treating | 55 (18.8%) | 237 (81.2%) |
| Health Technologists | 35 (28.7%) | 87 (71.3%) |
| Total (Category) | 444 (39.9%) | 668 (60.1%) |
| Total (Overall) | 2,597 (56.7%) | 1,981 (43.3%) |
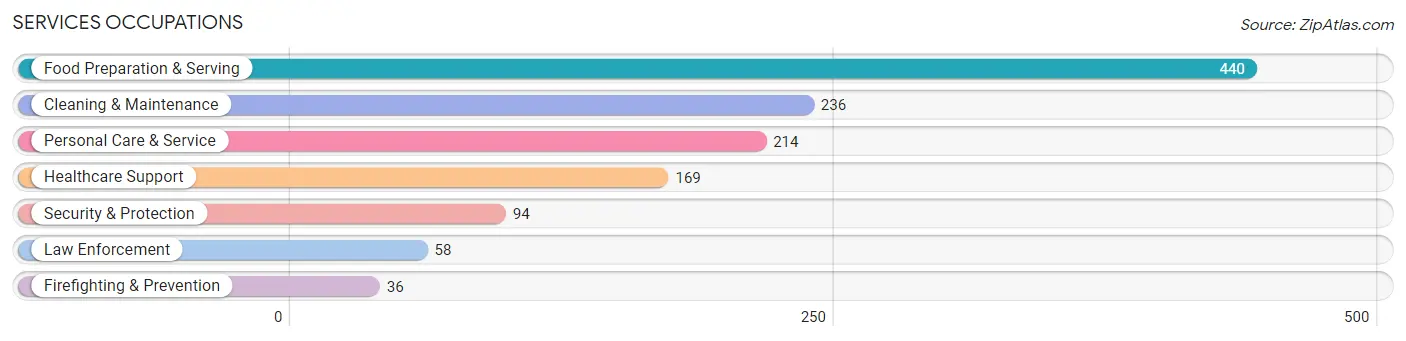
Services Occupations
The most common Services occupations in Sweetwater are Food Preparation & Serving (440 | 9.6%), Cleaning & Maintenance (236 | 5.2%), Personal Care & Service (214 | 4.7%), Healthcare Support (169 | 3.7%), and Security & Protection (94 | 2.1%).
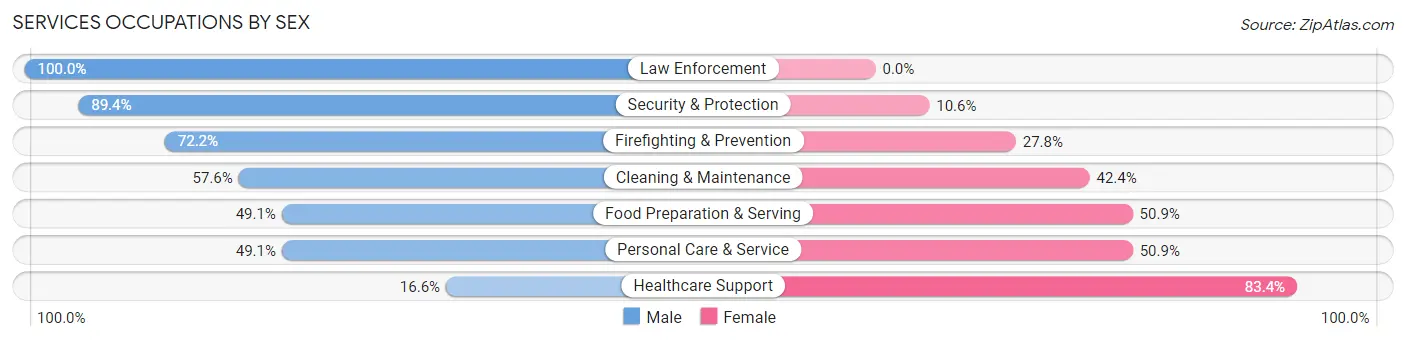
Services Occupations by Sex
Within the Services occupations in Sweetwater, the most male-oriented occupations are Law Enforcement (100.0%), Security & Protection (89.4%), and Firefighting & Prevention (72.2%), while the most female-oriented occupations are Healthcare Support (83.4%), Personal Care & Service (50.9%), and Food Preparation & Serving (50.9%).
| Occupation | Male | Female |
| Healthcare Support | 28 (16.6%) | 141 (83.4%) |
| Security & Protection | 84 (89.4%) | 10 (10.6%) |
| Firefighting & Prevention | 26 (72.2%) | 10 (27.8%) |
| Law Enforcement | 58 (100.0%) | 0 (0.0%) |
| Food Preparation & Serving | 216 (49.1%) | 224 (50.9%) |
| Cleaning & Maintenance | 136 (57.6%) | 100 (42.4%) |
| Personal Care & Service | 105 (49.1%) | 109 (50.9%) |
| Total (Category) | 569 (49.3%) | 584 (50.6%) |
| Total (Overall) | 2,597 (56.7%) | 1,981 (43.3%) |
Sales and Office Occupations
The most common Sales and Office occupations in Sweetwater are Sales & Related (473 | 10.3%), and Office & Administration (387 | 8.5%).
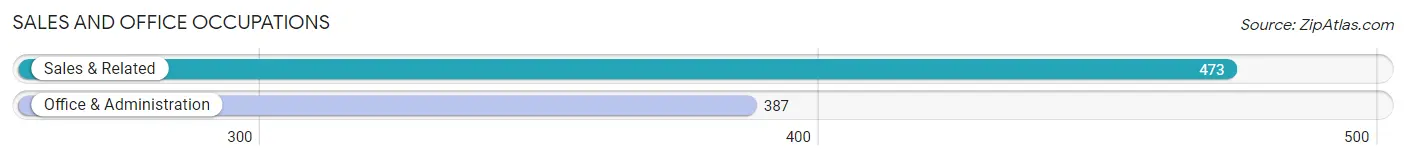
Sales and Office Occupations by Sex
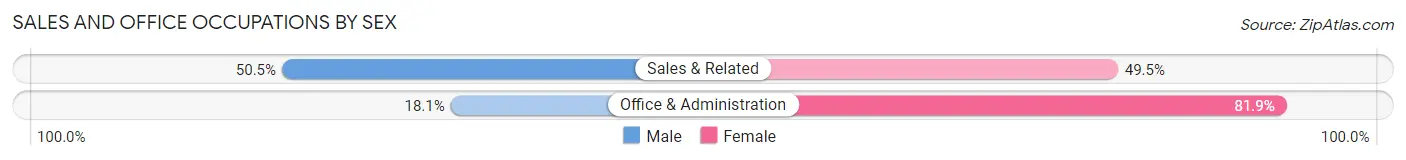
| Occupation | Male | Female |
| Sales & Related | 239 (50.5%) | 234 (49.5%) |
| Office & Administration | 70 (18.1%) | 317 (81.9%) |
| Total (Category) | 309 (35.9%) | 551 (64.1%) |
| Total (Overall) | 2,597 (56.7%) | 1,981 (43.3%) |
Natural Resources, Construction and Maintenance Occupations
The most common Natural Resources, Construction and Maintenance occupations in Sweetwater are Construction & Extraction (306 | 6.7%), Installation, Maintenance & Repair (183 | 4.0%), and Farming, Fishing & Forestry (75 | 1.6%).
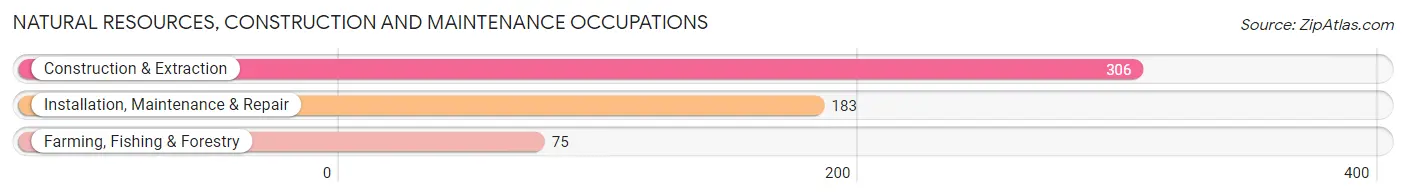
Natural Resources, Construction and Maintenance Occupations by Sex
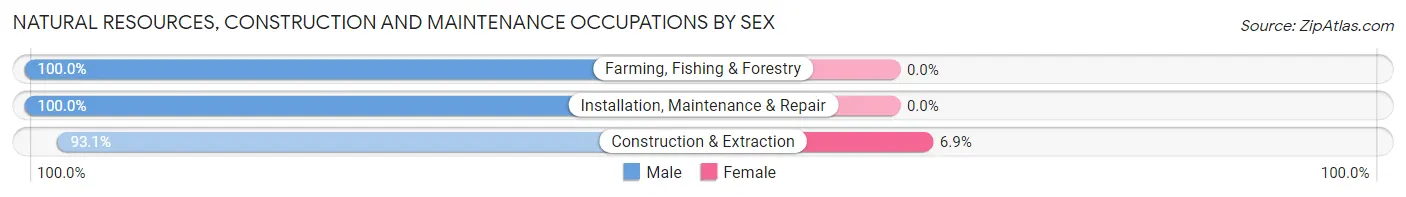
| Occupation | Male | Female |
| Farming, Fishing & Forestry | 75 (100.0%) | 0 (0.0%) |
| Construction & Extraction | 285 (93.1%) | 21 (6.9%) |
| Installation, Maintenance & Repair | 183 (100.0%) | 0 (0.0%) |
| Total (Category) | 543 (96.3%) | 21 (3.7%) |
| Total (Overall) | 2,597 (56.7%) | 1,981 (43.3%) |
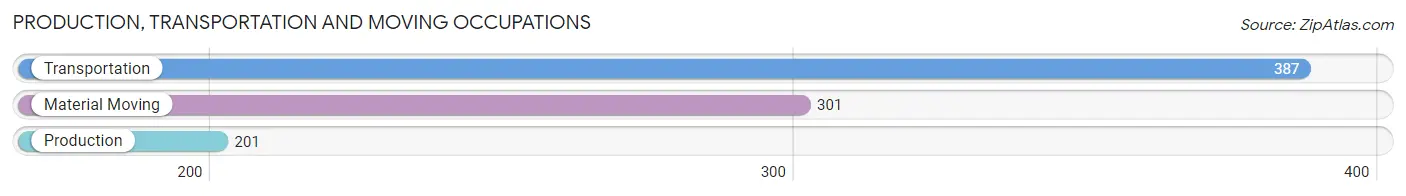
Production, Transportation and Moving Occupations
The most common Production, Transportation and Moving occupations in Sweetwater are Transportation (387 | 8.5%), Material Moving (301 | 6.6%), and Production (201 | 4.4%).
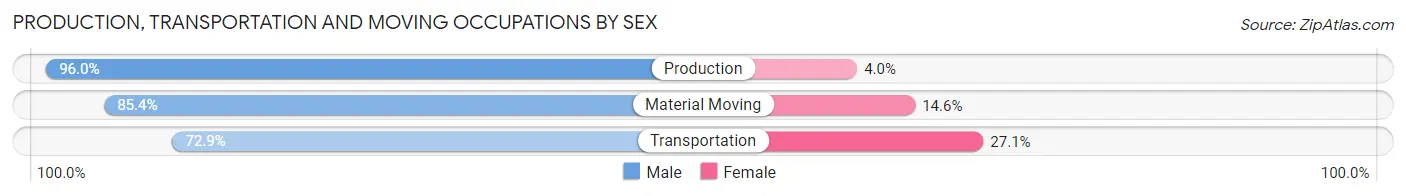
Production, Transportation and Moving Occupations by Sex
| Occupation | Male | Female |
| Production | 193 (96.0%) | 8 (4.0%) |
| Transportation | 282 (72.9%) | 105 (27.1%) |
| Material Moving | 257 (85.4%) | 44 (14.6%) |
| Total (Category) | 732 (82.3%) | 157 (17.7%) |
| Total (Overall) | 2,597 (56.7%) | 1,981 (43.3%) |
Employment Industries by Sex in Sweetwater
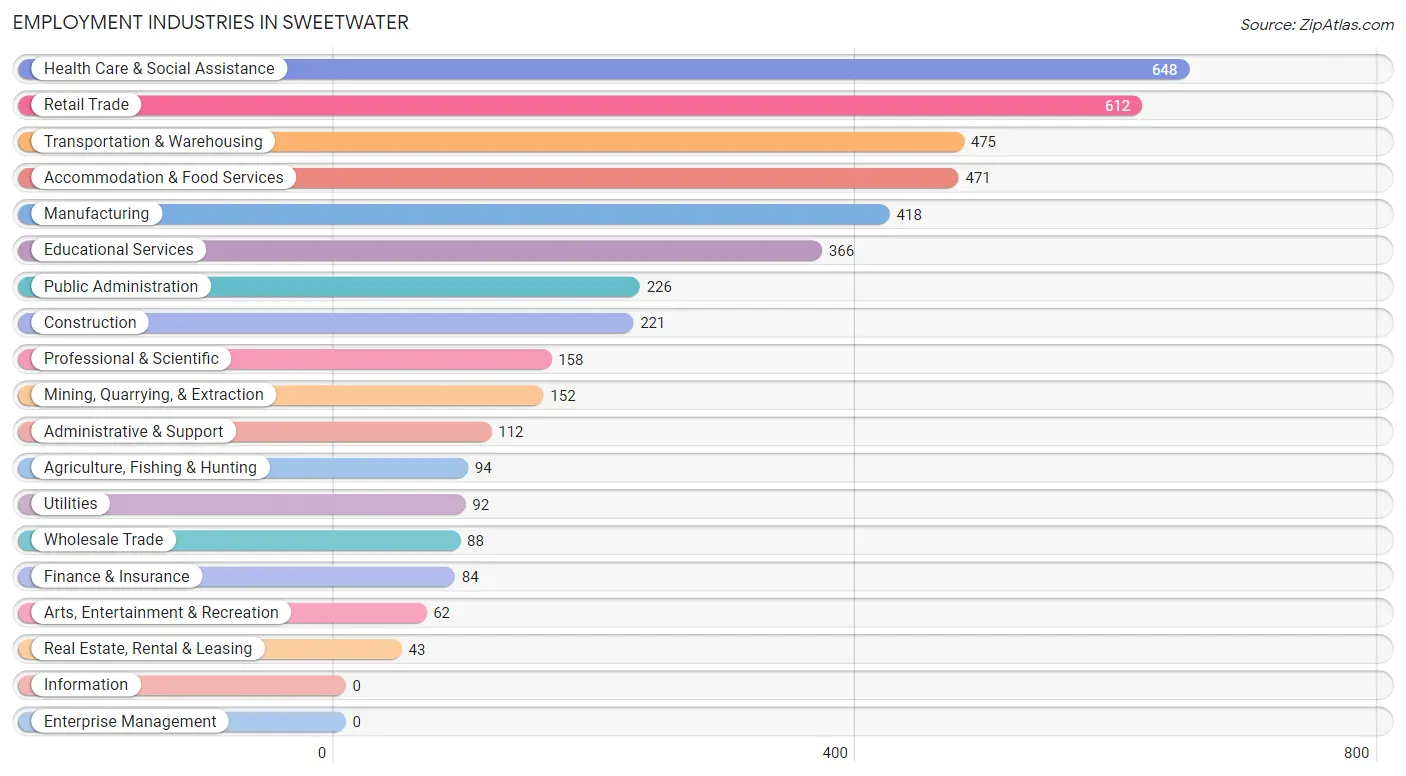
Employment Industries in Sweetwater
The major employment industries in Sweetwater include Health Care & Social Assistance (648 | 14.1%), Retail Trade (612 | 13.4%), Transportation & Warehousing (475 | 10.4%), Accommodation & Food Services (471 | 10.3%), and Manufacturing (418 | 9.1%).
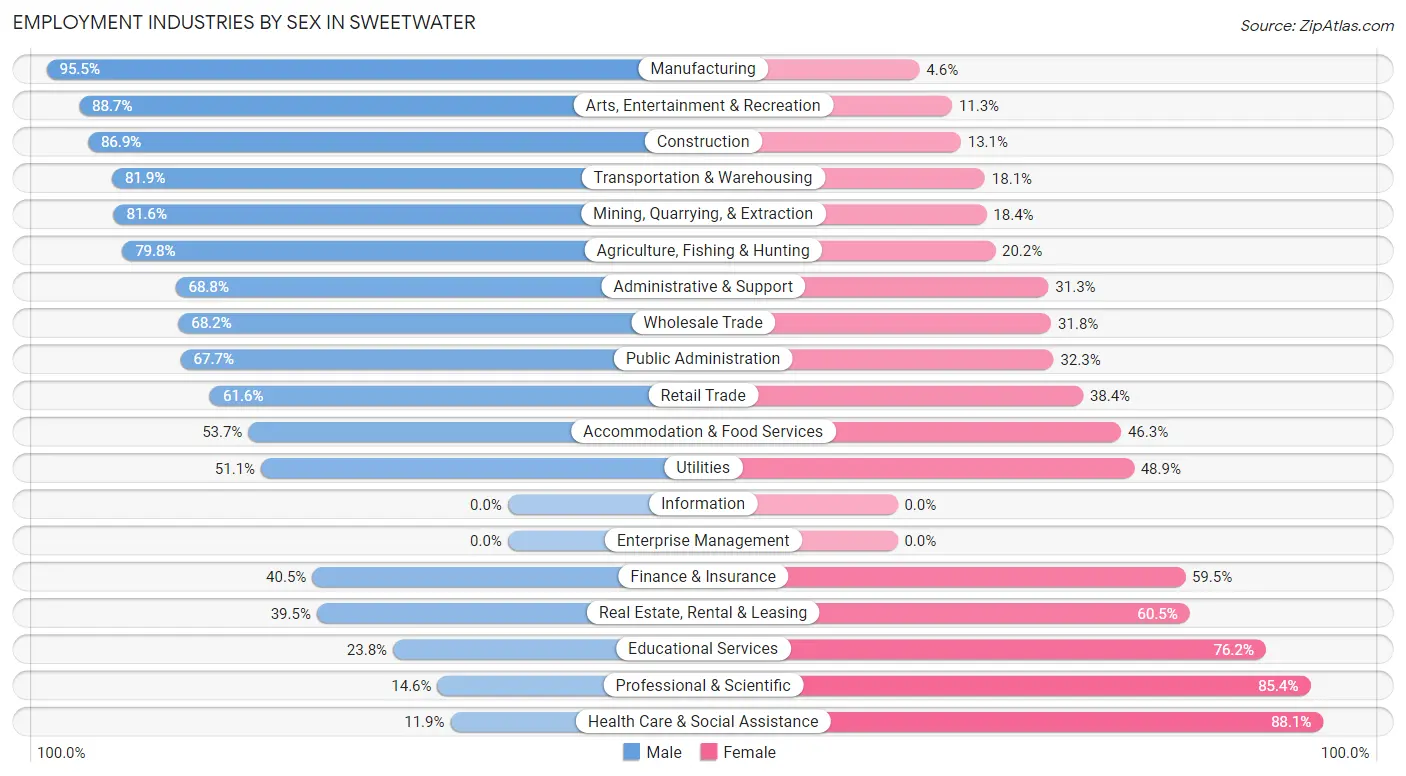
Employment Industries by Sex in Sweetwater
The Sweetwater industries that see more men than women are Manufacturing (95.5%), Arts, Entertainment & Recreation (88.7%), and Construction (86.9%), whereas the industries that tend to have a higher number of women are Health Care & Social Assistance (88.1%), Professional & Scientific (85.4%), and Educational Services (76.2%).
| Industry | Male | Female |
| Agriculture, Fishing & Hunting | 75 (79.8%) | 19 (20.2%) |
| Mining, Quarrying, & Extraction | 124 (81.6%) | 28 (18.4%) |
| Construction | 192 (86.9%) | 29 (13.1%) |
| Manufacturing | 399 (95.5%) | 19 (4.5%) |
| Wholesale Trade | 60 (68.2%) | 28 (31.8%) |
| Retail Trade | 377 (61.6%) | 235 (38.4%) |
| Transportation & Warehousing | 389 (81.9%) | 86 (18.1%) |
| Utilities | 47 (51.1%) | 45 (48.9%) |
| Information | 0 (0.0%) | 0 (0.0%) |
| Finance & Insurance | 34 (40.5%) | 50 (59.5%) |
| Real Estate, Rental & Leasing | 17 (39.5%) | 26 (60.5%) |
| Professional & Scientific | 23 (14.6%) | 135 (85.4%) |
| Enterprise Management | 0 (0.0%) | 0 (0.0%) |
| Administrative & Support | 77 (68.8%) | 35 (31.2%) |
| Educational Services | 87 (23.8%) | 279 (76.2%) |
| Health Care & Social Assistance | 77 (11.9%) | 571 (88.1%) |
| Arts, Entertainment & Recreation | 55 (88.7%) | 7 (11.3%) |
| Accommodation & Food Services | 253 (53.7%) | 218 (46.3%) |
| Public Administration | 153 (67.7%) | 73 (32.3%) |
| Total | 2,597 (56.7%) | 1,981 (43.3%) |
Education in Sweetwater
School Enrollment in Sweetwater
The most common levels of schooling among the 2,455 students in Sweetwater are high school (748 | 30.5%), middle school (659 | 26.8%), and elementary school (539 | 22.0%).
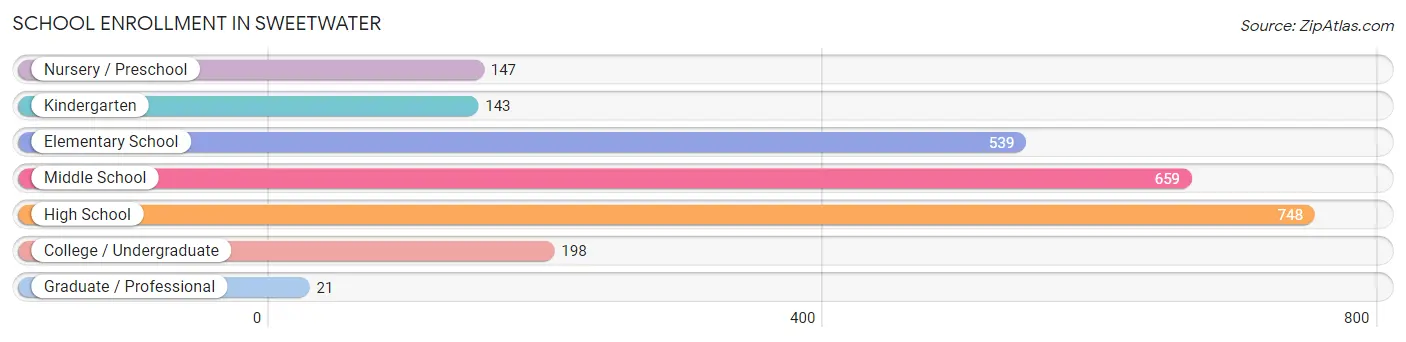
| School Level | # Students | % Students |
| Nursery / Preschool | 147 | 6.0% |
| Kindergarten | 143 | 5.8% |
| Elementary School | 539 | 22.0% |
| Middle School | 659 | 26.8% |
| High School | 748 | 30.5% |
| College / Undergraduate | 198 | 8.1% |
| Graduate / Professional | 21 | 0.9% |
| Total | 2,455 | 100.0% |
School Enrollment by Age by Funding Source in Sweetwater
Out of a total of 2,455 students who are enrolled in schools in Sweetwater, 64 (2.6%) attend a private institution, while the remaining 2,391 (97.4%) are enrolled in public schools. The age group of 35 years and over has the highest likelihood of being enrolled in private schools, with 8 (9.1% in the age bracket) enrolled. Conversely, the age group of 3 to 4 year olds has the lowest likelihood of being enrolled in a private school, with 134 (100.0% in the age bracket) attending a public institution.
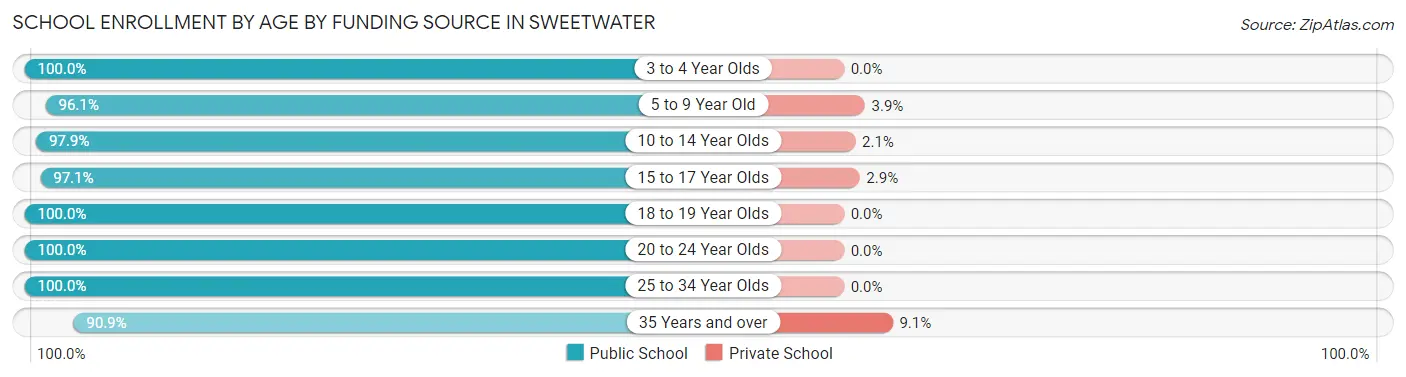
| Age Bracket | Public School | Private School |
| 3 to 4 Year Olds | 134 (100.0%) | 0 (0.0%) |
| 5 to 9 Year Old | 592 (96.1%) | 24 (3.9%) |
| 10 to 14 Year Olds | 919 (97.9%) | 20 (2.1%) |
| 15 to 17 Year Olds | 430 (97.1%) | 13 (2.9%) |
| 18 to 19 Year Olds | 133 (100.0%) | 0 (0.0%) |
| 20 to 24 Year Olds | 74 (100.0%) | 0 (0.0%) |
| 25 to 34 Year Olds | 28 (100.0%) | 0 (0.0%) |
| 35 Years and over | 80 (90.9%) | 8 (9.1%) |
| Total | 2,391 (97.4%) | 64 (2.6%) |
Educational Attainment by Field of Study in Sweetwater
Business (295 | 39.0%), education (166 | 21.9%), science & technology (51 | 6.7%), visual & performing arts (48 | 6.3%), and arts & humanities (47 | 6.2%) are the most common fields of study among 757 individuals in Sweetwater who have obtained a bachelor's degree or higher.
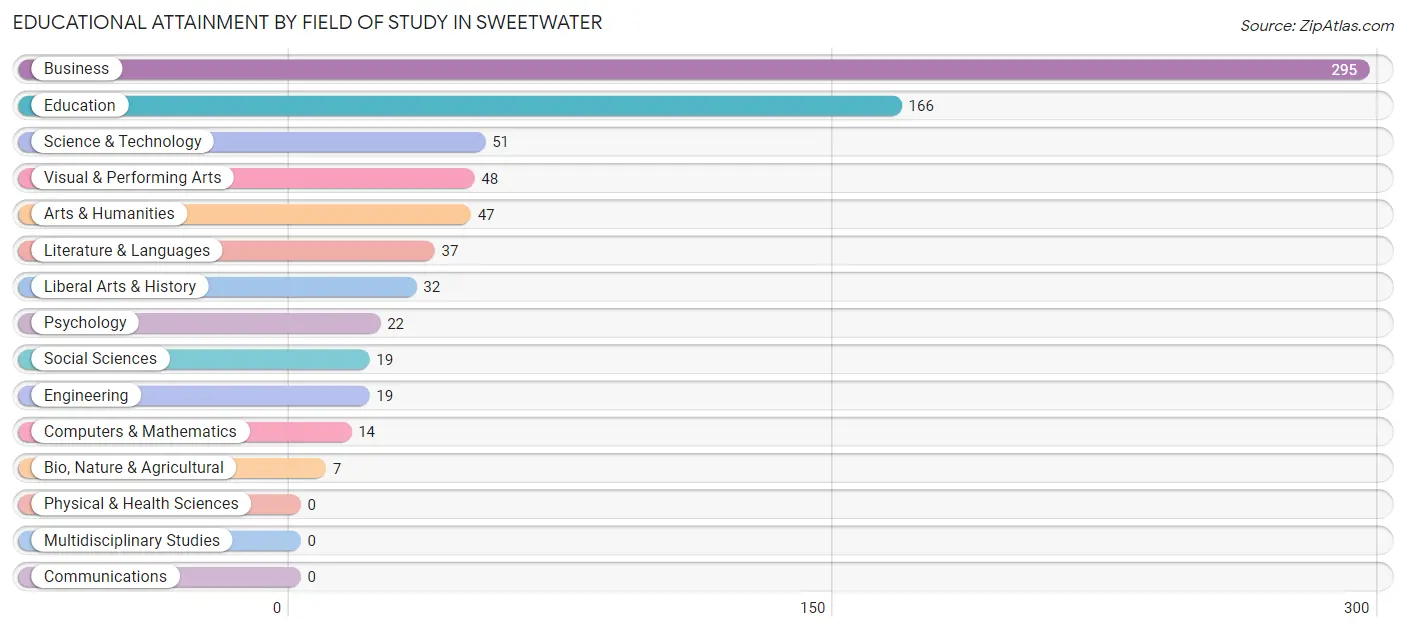
| Field of Study | # Graduates | % Graduates |
| Computers & Mathematics | 14 | 1.8% |
| Bio, Nature & Agricultural | 7 | 0.9% |
| Physical & Health Sciences | 0 | 0.0% |
| Psychology | 22 | 2.9% |
| Social Sciences | 19 | 2.5% |
| Engineering | 19 | 2.5% |
| Multidisciplinary Studies | 0 | 0.0% |
| Science & Technology | 51 | 6.7% |
| Business | 295 | 39.0% |
| Education | 166 | 21.9% |
| Literature & Languages | 37 | 4.9% |
| Liberal Arts & History | 32 | 4.2% |
| Visual & Performing Arts | 48 | 6.3% |
| Communications | 0 | 0.0% |
| Arts & Humanities | 47 | 6.2% |
| Total | 757 | 100.0% |
Transportation & Commute in Sweetwater
Vehicle Availability by Sex in Sweetwater
The most prevalent vehicle ownership categories in Sweetwater are males with 1 vehicle (943, accounting for 37.0%) and females with 1 vehicle (665, making up 49.0%).
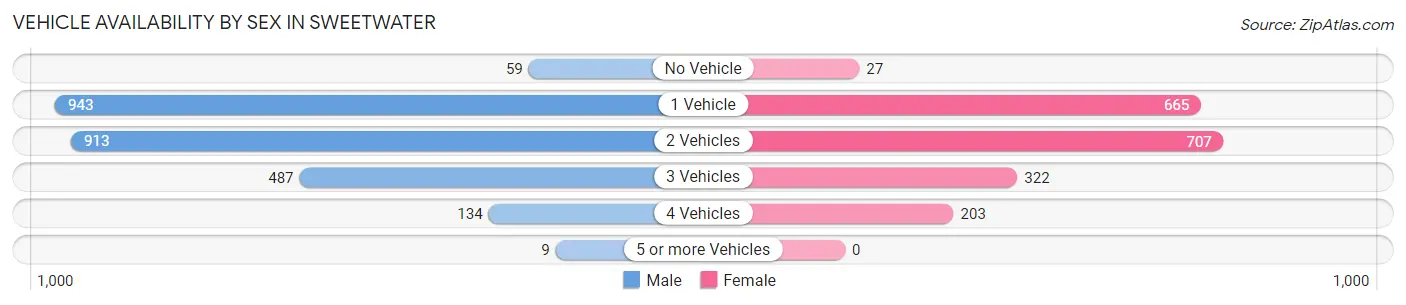
| Vehicles Available | Male | Female |
| No Vehicle | 59 (2.3%) | 27 (1.4%) |
| 1 Vehicle | 943 (37.0%) | 665 (34.6%) |
| 2 Vehicles | 913 (35.9%) | 707 (36.7%) |
| 3 Vehicles | 487 (19.1%) | 322 (16.7%) |
| 4 Vehicles | 134 (5.3%) | 203 (10.5%) |
| 5 or more Vehicles | 9 (0.4%) | 0 (0.0%) |
| Total | 2,545 (100.0%) | 1,924 (100.0%) |
Commute Time in Sweetwater
The most frequently occuring commute durations in Sweetwater are 5 to 9 minutes (1,374 commuters, 31.8%), 10 to 14 minutes (1,064 commuters, 24.6%), and 15 to 19 minutes (576 commuters, 13.3%).
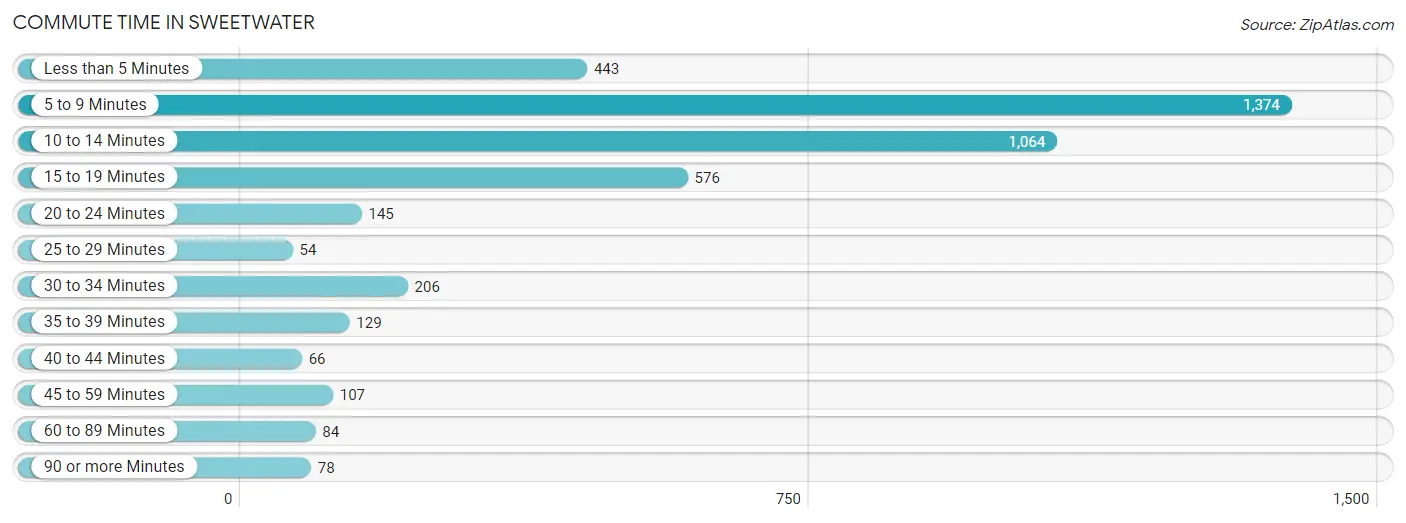
| Commute Time | # Commuters | % Commuters |
| Less than 5 Minutes | 443 | 10.2% |
| 5 to 9 Minutes | 1,374 | 31.8% |
| 10 to 14 Minutes | 1,064 | 24.6% |
| 15 to 19 Minutes | 576 | 13.3% |
| 20 to 24 Minutes | 145 | 3.4% |
| 25 to 29 Minutes | 54 | 1.3% |
| 30 to 34 Minutes | 206 | 4.8% |
| 35 to 39 Minutes | 129 | 3.0% |
| 40 to 44 Minutes | 66 | 1.5% |
| 45 to 59 Minutes | 107 | 2.5% |
| 60 to 89 Minutes | 84 | 1.9% |
| 90 or more Minutes | 78 | 1.8% |
Commute Time by Sex in Sweetwater
The most common commute times in Sweetwater are 5 to 9 minutes (689 commuters, 28.0%) for males and 5 to 9 minutes (685 commuters, 36.8%) for females.
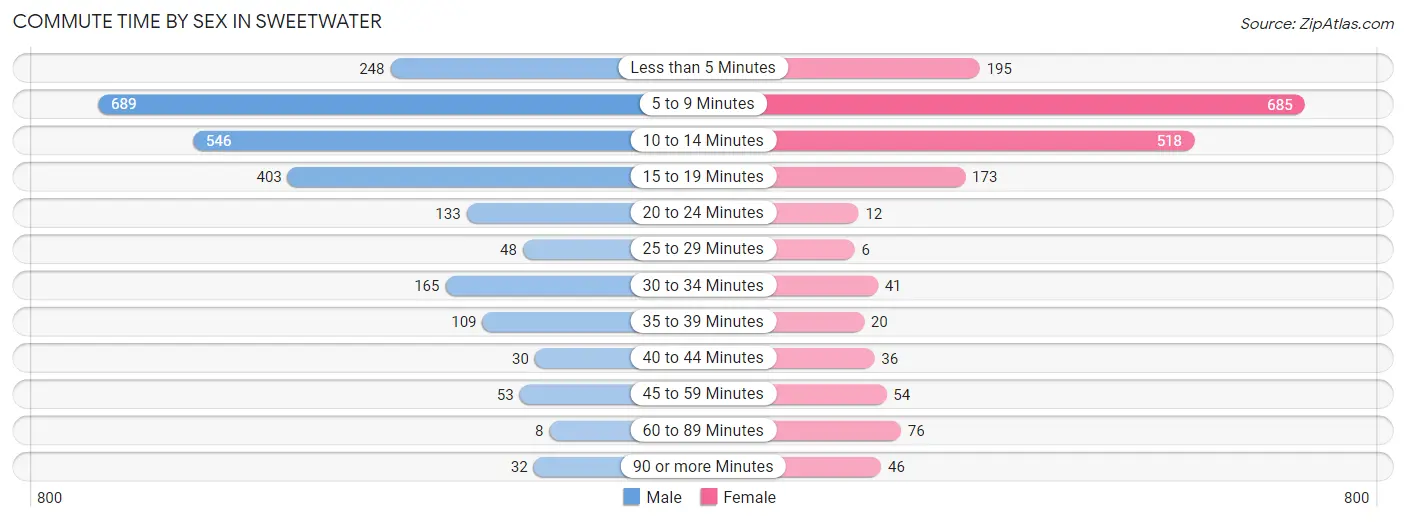
| Commute Time | Male | Female |
| Less than 5 Minutes | 248 (10.1%) | 195 (10.5%) |
| 5 to 9 Minutes | 689 (28.0%) | 685 (36.8%) |
| 10 to 14 Minutes | 546 (22.2%) | 518 (27.8%) |
| 15 to 19 Minutes | 403 (16.4%) | 173 (9.3%) |
| 20 to 24 Minutes | 133 (5.4%) | 12 (0.6%) |
| 25 to 29 Minutes | 48 (1.9%) | 6 (0.3%) |
| 30 to 34 Minutes | 165 (6.7%) | 41 (2.2%) |
| 35 to 39 Minutes | 109 (4.4%) | 20 (1.1%) |
| 40 to 44 Minutes | 30 (1.2%) | 36 (1.9%) |
| 45 to 59 Minutes | 53 (2.1%) | 54 (2.9%) |
| 60 to 89 Minutes | 8 (0.3%) | 76 (4.1%) |
| 90 or more Minutes | 32 (1.3%) | 46 (2.5%) |
Time of Departure to Work by Sex in Sweetwater
The most frequent times of departure to work in Sweetwater are 7:00 AM to 7:29 AM (530, 21.5%) for males and 8:00 AM to 8:29 AM (275, 14.8%) for females.
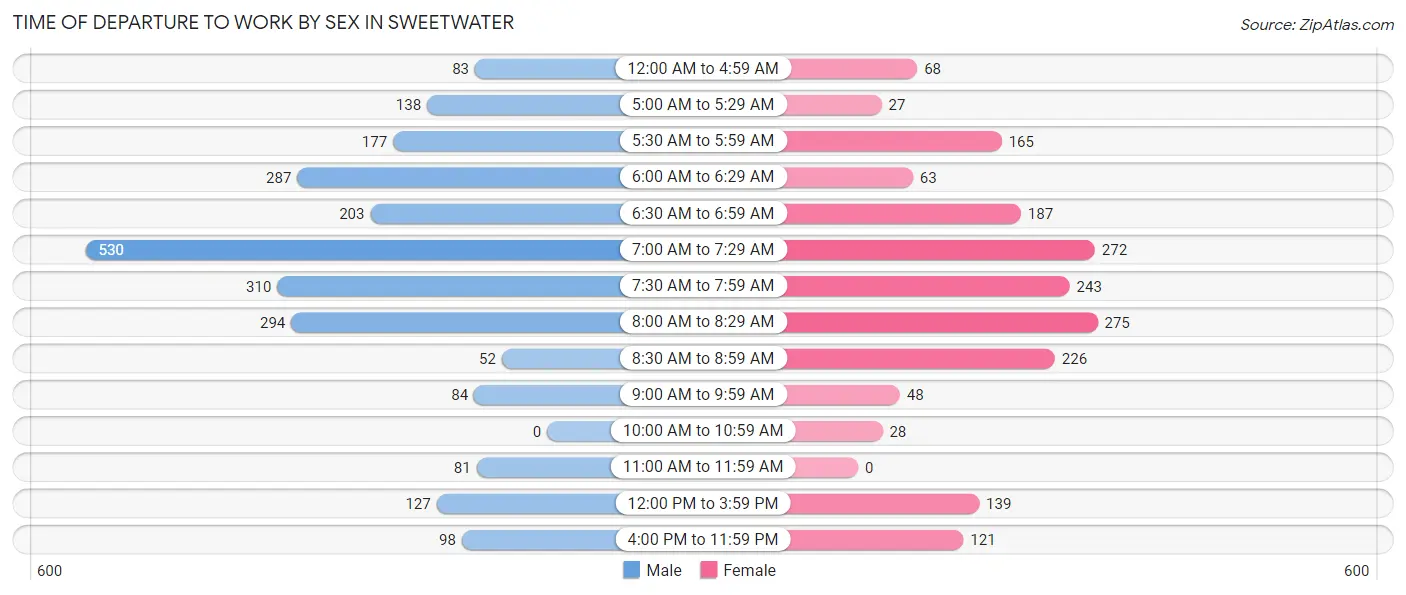
| Time of Departure | Male | Female |
| 12:00 AM to 4:59 AM | 83 (3.4%) | 68 (3.6%) |
| 5:00 AM to 5:29 AM | 138 (5.6%) | 27 (1.5%) |
| 5:30 AM to 5:59 AM | 177 (7.2%) | 165 (8.9%) |
| 6:00 AM to 6:29 AM | 287 (11.7%) | 63 (3.4%) |
| 6:30 AM to 6:59 AM | 203 (8.2%) | 187 (10.0%) |
| 7:00 AM to 7:29 AM | 530 (21.5%) | 272 (14.6%) |
| 7:30 AM to 7:59 AM | 310 (12.6%) | 243 (13.1%) |
| 8:00 AM to 8:29 AM | 294 (11.9%) | 275 (14.8%) |
| 8:30 AM to 8:59 AM | 52 (2.1%) | 226 (12.1%) |
| 9:00 AM to 9:59 AM | 84 (3.4%) | 48 (2.6%) |
| 10:00 AM to 10:59 AM | 0 (0.0%) | 28 (1.5%) |
| 11:00 AM to 11:59 AM | 81 (3.3%) | 0 (0.0%) |
| 12:00 PM to 3:59 PM | 127 (5.1%) | 139 (7.5%) |
| 4:00 PM to 11:59 PM | 98 (4.0%) | 121 (6.5%) |
| Total | 2,464 (100.0%) | 1,862 (100.0%) |
Housing Occupancy in Sweetwater
Occupancy by Ownership in Sweetwater
Of the total 4,040 dwellings in Sweetwater, owner-occupied units account for 2,298 (56.9%), while renter-occupied units make up 1,742 (43.1%).
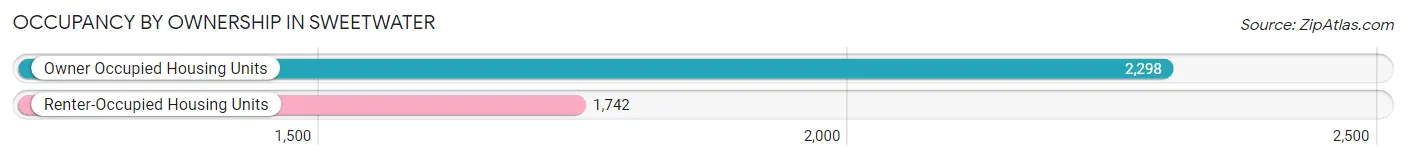
| Occupancy | # Housing Units | % Housing Units |
| Owner Occupied Housing Units | 2,298 | 56.9% |
| Renter-Occupied Housing Units | 1,742 | 43.1% |
| Total Occupied Housing Units | 4,040 | 100.0% |
Occupancy by Household Size in Sweetwater
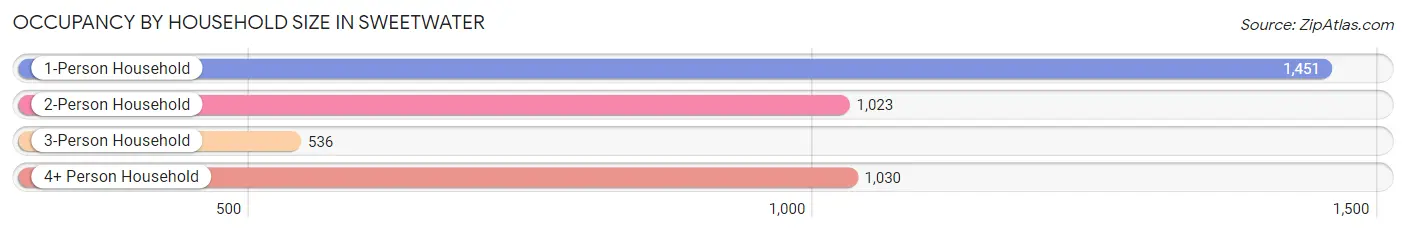
| Household Size | # Housing Units | % Housing Units |
| 1-Person Household | 1,451 | 35.9% |
| 2-Person Household | 1,023 | 25.3% |
| 3-Person Household | 536 | 13.3% |
| 4+ Person Household | 1,030 | 25.5% |
| Total Housing Units | 4,040 | 100.0% |
Occupancy by Ownership by Household Size in Sweetwater
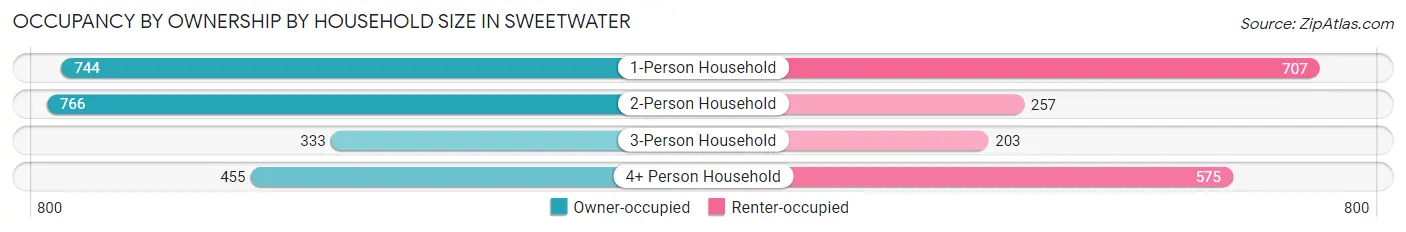
| Household Size | Owner-occupied | Renter-occupied |
| 1-Person Household | 744 (51.3%) | 707 (48.7%) |
| 2-Person Household | 766 (74.9%) | 257 (25.1%) |
| 3-Person Household | 333 (62.1%) | 203 (37.9%) |
| 4+ Person Household | 455 (44.2%) | 575 (55.8%) |
| Total Housing Units | 2,298 (56.9%) | 1,742 (43.1%) |
Occupancy by Educational Attainment in Sweetwater
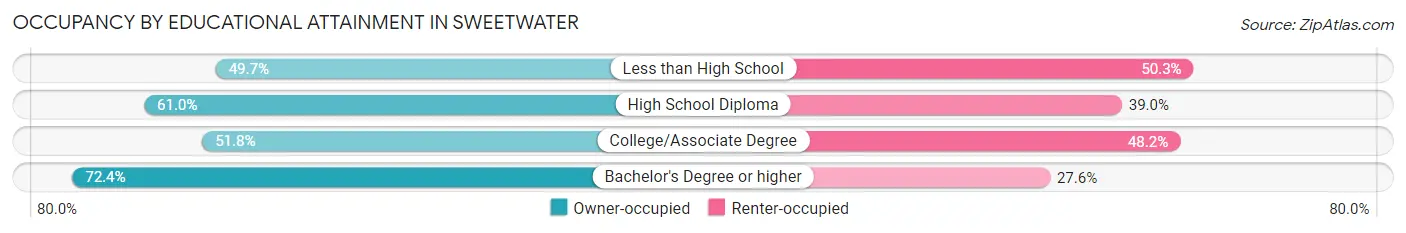
| Household Size | Owner-occupied | Renter-occupied |
| Less than High School | 391 (49.7%) | 396 (50.3%) |
| High School Diploma | 802 (61.0%) | 512 (39.0%) |
| College/Associate Degree | 753 (51.8%) | 700 (48.2%) |
| Bachelor's Degree or higher | 352 (72.4%) | 134 (27.6%) |
Occupancy by Age of Householder in Sweetwater
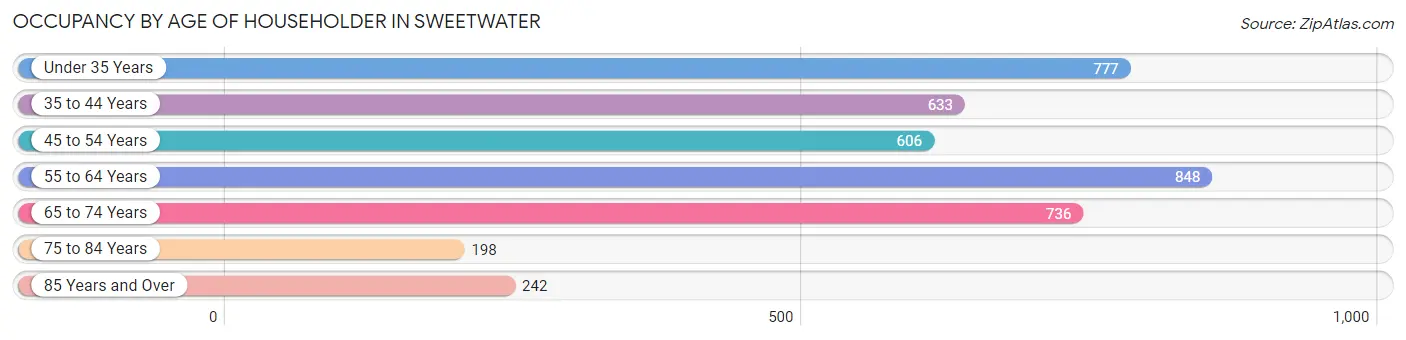
| Age Bracket | # Households | % Households |
| Under 35 Years | 777 | 19.2% |
| 35 to 44 Years | 633 | 15.7% |
| 45 to 54 Years | 606 | 15.0% |
| 55 to 64 Years | 848 | 21.0% |
| 65 to 74 Years | 736 | 18.2% |
| 75 to 84 Years | 198 | 4.9% |
| 85 Years and Over | 242 | 6.0% |
| Total | 4,040 | 100.0% |
Housing Finances in Sweetwater
Median Income by Occupancy in Sweetwater
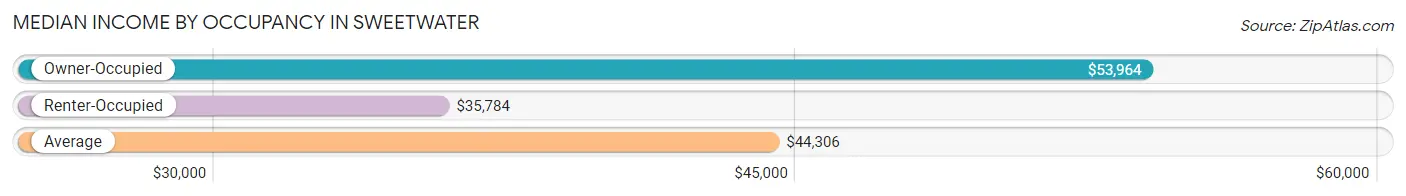
| Occupancy Type | # Households | Median Income |
| Owner-Occupied | 2,298 (56.9%) | $53,964 |
| Renter-Occupied | 1,742 (43.1%) | $35,784 |
| Average | 4,040 (100.0%) | $44,306 |
Occupancy by Householder Income Bracket in Sweetwater
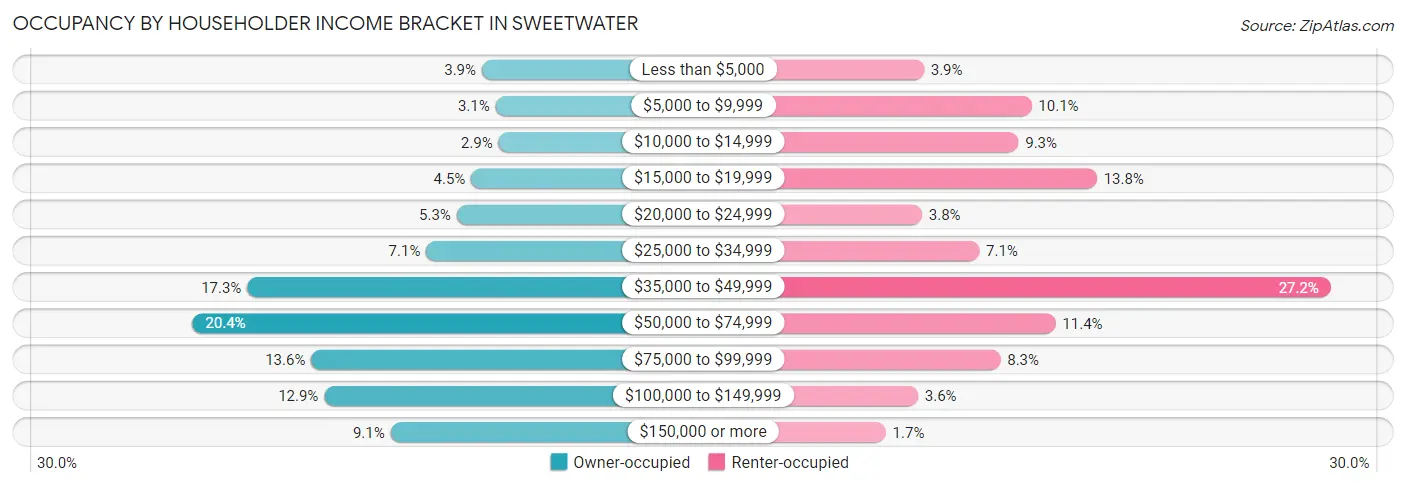
| Income Bracket | Owner-occupied | Renter-occupied |
| Less than $5,000 | 89 (3.9%) | 68 (3.9%) |
| $5,000 to $9,999 | 71 (3.1%) | 175 (10.1%) |
| $10,000 to $14,999 | 67 (2.9%) | 162 (9.3%) |
| $15,000 to $19,999 | 103 (4.5%) | 240 (13.8%) |
| $20,000 to $24,999 | 122 (5.3%) | 66 (3.8%) |
| $25,000 to $34,999 | 162 (7.0%) | 123 (7.1%) |
| $35,000 to $49,999 | 397 (17.3%) | 473 (27.2%) |
| $50,000 to $74,999 | 469 (20.4%) | 199 (11.4%) |
| $75,000 to $99,999 | 313 (13.6%) | 144 (8.3%) |
| $100,000 to $149,999 | 296 (12.9%) | 62 (3.6%) |
| $150,000 or more | 209 (9.1%) | 30 (1.7%) |
| Total | 2,298 (100.0%) | 1,742 (100.0%) |
Monthly Housing Cost Tiers in Sweetwater
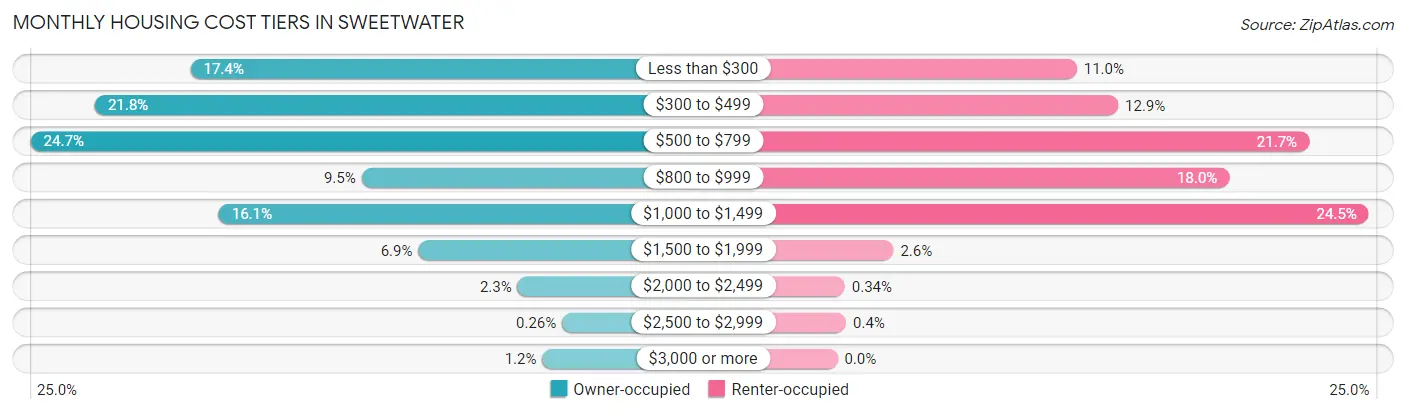
| Monthly Cost | Owner-occupied | Renter-occupied |
| Less than $300 | 399 (17.4%) | 192 (11.0%) |
| $300 to $499 | 500 (21.8%) | 225 (12.9%) |
| $500 to $799 | 568 (24.7%) | 378 (21.7%) |
| $800 to $999 | 218 (9.5%) | 314 (18.0%) |
| $1,000 to $1,499 | 369 (16.1%) | 426 (24.4%) |
| $1,500 to $1,999 | 158 (6.9%) | 45 (2.6%) |
| $2,000 to $2,499 | 53 (2.3%) | 6 (0.3%) |
| $2,500 to $2,999 | 6 (0.3%) | 7 (0.4%) |
| $3,000 or more | 27 (1.2%) | 0 (0.0%) |
| Total | 2,298 (100.0%) | 1,742 (100.0%) |
Physical Housing Characteristics in Sweetwater
Housing Structures in Sweetwater
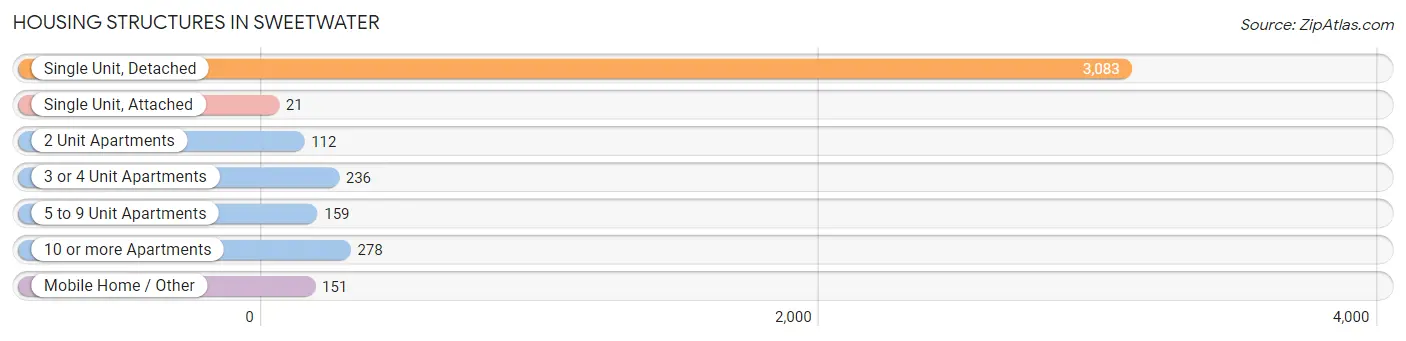
| Structure Type | # Housing Units | % Housing Units |
| Single Unit, Detached | 3,083 | 76.3% |
| Single Unit, Attached | 21 | 0.5% |
| 2 Unit Apartments | 112 | 2.8% |
| 3 or 4 Unit Apartments | 236 | 5.8% |
| 5 to 9 Unit Apartments | 159 | 3.9% |
| 10 or more Apartments | 278 | 6.9% |
| Mobile Home / Other | 151 | 3.7% |
| Total | 4,040 | 100.0% |
Housing Structures by Occupancy in Sweetwater
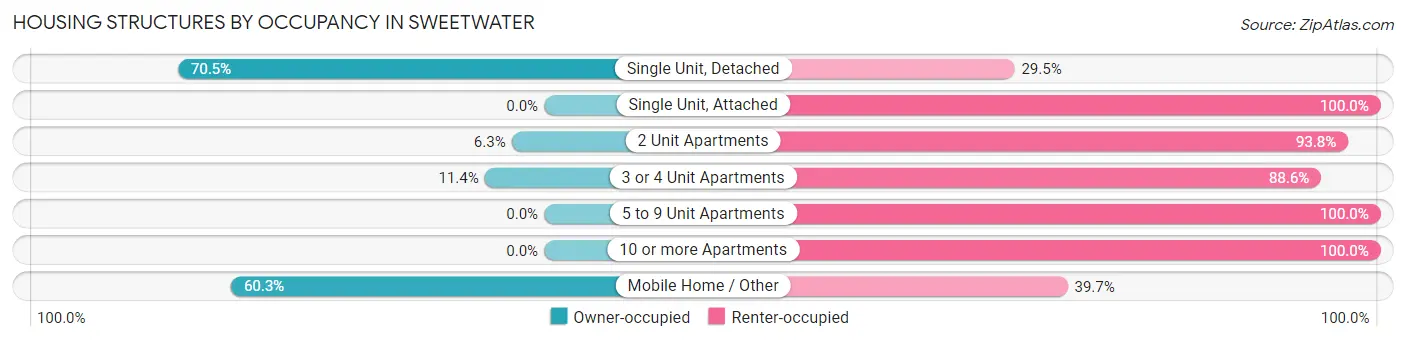
| Structure Type | Owner-occupied | Renter-occupied |
| Single Unit, Detached | 2,173 (70.5%) | 910 (29.5%) |
| Single Unit, Attached | 0 (0.0%) | 21 (100.0%) |
| 2 Unit Apartments | 7 (6.2%) | 105 (93.8%) |
| 3 or 4 Unit Apartments | 27 (11.4%) | 209 (88.6%) |
| 5 to 9 Unit Apartments | 0 (0.0%) | 159 (100.0%) |
| 10 or more Apartments | 0 (0.0%) | 278 (100.0%) |
| Mobile Home / Other | 91 (60.3%) | 60 (39.7%) |
| Total | 2,298 (56.9%) | 1,742 (43.1%) |
Housing Structures by Number of Rooms in Sweetwater
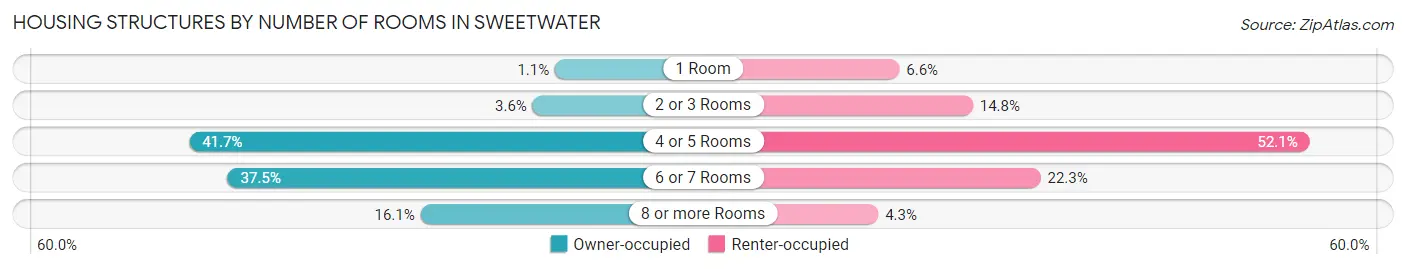
| Number of Rooms | Owner-occupied | Renter-occupied |
| 1 Room | 26 (1.1%) | 115 (6.6%) |
| 2 or 3 Rooms | 83 (3.6%) | 257 (14.7%) |
| 4 or 5 Rooms | 959 (41.7%) | 908 (52.1%) |
| 6 or 7 Rooms | 861 (37.5%) | 388 (22.3%) |
| 8 or more Rooms | 369 (16.1%) | 74 (4.3%) |
| Total | 2,298 (100.0%) | 1,742 (100.0%) |
Housing Structure by Heating Type in Sweetwater
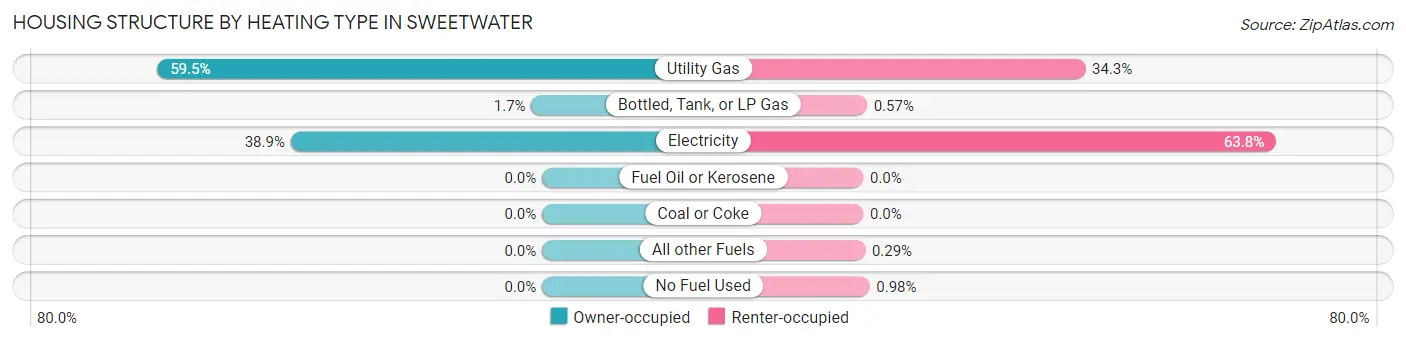
| Heating Type | Owner-occupied | Renter-occupied |
| Utility Gas | 1,367 (59.5%) | 598 (34.3%) |
| Bottled, Tank, or LP Gas | 38 (1.7%) | 10 (0.6%) |
| Electricity | 893 (38.9%) | 1,112 (63.8%) |
| Fuel Oil or Kerosene | 0 (0.0%) | 0 (0.0%) |
| Coal or Coke | 0 (0.0%) | 0 (0.0%) |
| All other Fuels | 0 (0.0%) | 5 (0.3%) |
| No Fuel Used | 0 (0.0%) | 17 (1.0%) |
| Total | 2,298 (100.0%) | 1,742 (100.0%) |
Household Vehicle Usage in Sweetwater
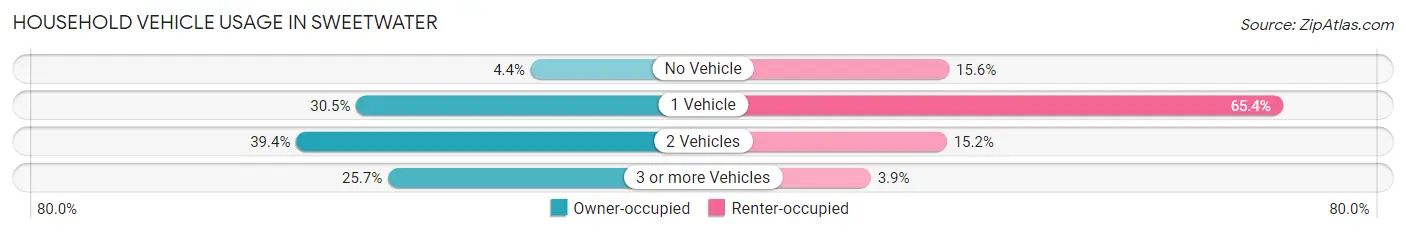
| Vehicles per Household | Owner-occupied | Renter-occupied |
| No Vehicle | 101 (4.4%) | 271 (15.6%) |
| 1 Vehicle | 700 (30.5%) | 1,139 (65.4%) |
| 2 Vehicles | 906 (39.4%) | 265 (15.2%) |
| 3 or more Vehicles | 591 (25.7%) | 67 (3.8%) |
| Total | 2,298 (100.0%) | 1,742 (100.0%) |
Real Estate & Mortgages in Sweetwater
Real Estate and Mortgage Overview in Sweetwater
| Characteristic | Without Mortgage | With Mortgage |
| Housing Units | 1,668 | 630 |
| Median Property Value | $72,800 | $104,900 |
| Median Household Income | $49,167 | $92 |
| Monthly Housing Costs | $484 | $21 |
| Real Estate Taxes | $782 | $21 |
Property Value by Mortgage Status in Sweetwater
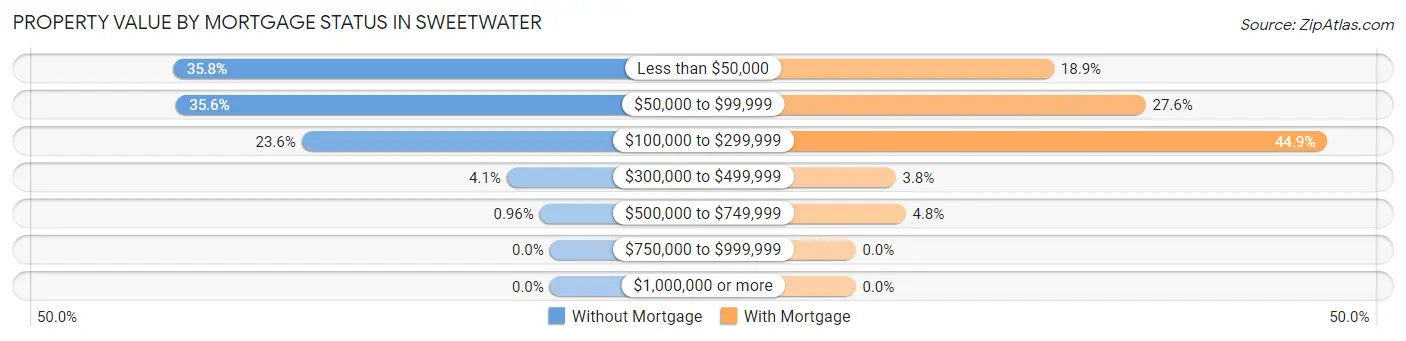
| Property Value | Without Mortgage | With Mortgage |
| Less than $50,000 | 597 (35.8%) | 119 (18.9%) |
| $50,000 to $99,999 | 593 (35.5%) | 174 (27.6%) |
| $100,000 to $299,999 | 394 (23.6%) | 283 (44.9%) |
| $300,000 to $499,999 | 68 (4.1%) | 24 (3.8%) |
| $500,000 to $749,999 | 16 (1.0%) | 30 (4.8%) |
| $750,000 to $999,999 | 0 (0.0%) | 0 (0.0%) |
| $1,000,000 or more | 0 (0.0%) | 0 (0.0%) |
| Total | 1,668 (100.0%) | 630 (100.0%) |
Household Income by Mortgage Status in Sweetwater
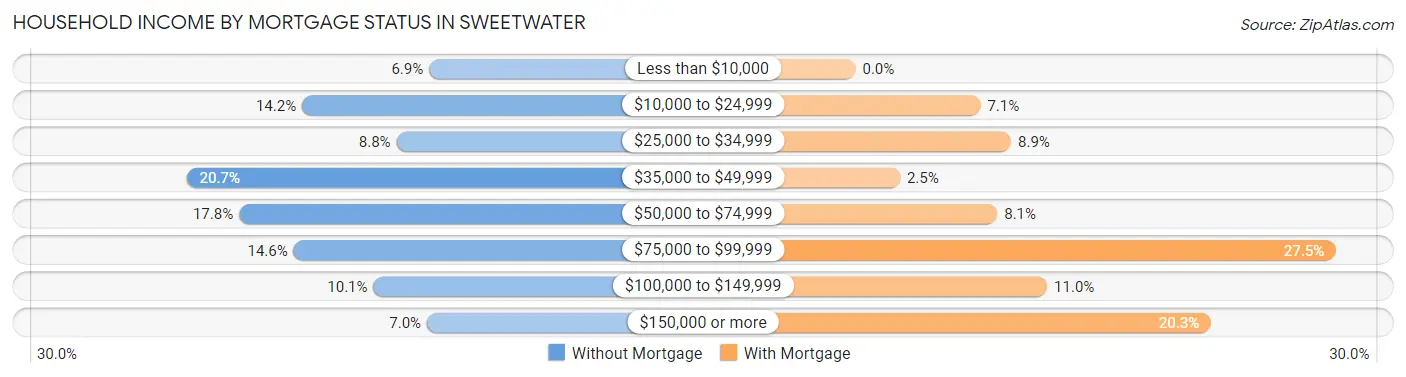
| Household Income | Without Mortgage | With Mortgage |
| Less than $10,000 | 115 (6.9%) | 0 (0.0%) |
| $10,000 to $24,999 | 236 (14.1%) | 45 (7.1%) |
| $25,000 to $34,999 | 146 (8.7%) | 56 (8.9%) |
| $35,000 to $49,999 | 346 (20.7%) | 16 (2.5%) |
| $50,000 to $74,999 | 296 (17.7%) | 51 (8.1%) |
| $75,000 to $99,999 | 244 (14.6%) | 173 (27.5%) |
| $100,000 to $149,999 | 168 (10.1%) | 69 (11.0%) |
| $150,000 or more | 117 (7.0%) | 128 (20.3%) |
| Total | 1,668 (100.0%) | 630 (100.0%) |
Property Value to Household Income Ratio in Sweetwater
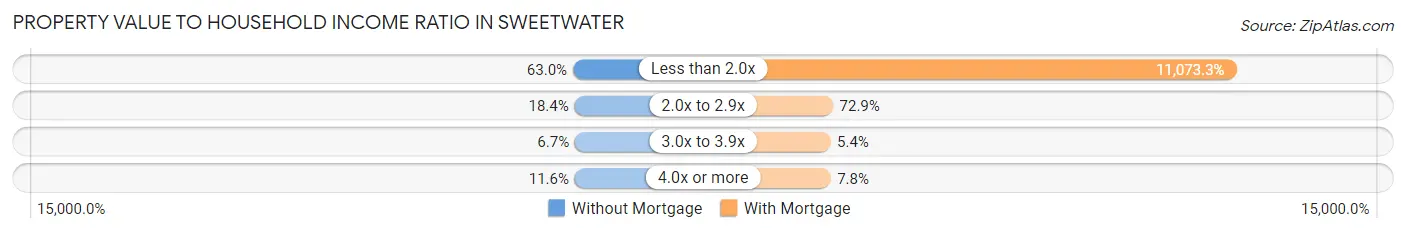
| Value-to-Income Ratio | Without Mortgage | With Mortgage |
| Less than 2.0x | 1,050 (62.9%) | 69,762 (11,073.3%) |
| 2.0x to 2.9x | 307 (18.4%) | 459 (72.9%) |
| 3.0x to 3.9x | 112 (6.7%) | 34 (5.4%) |
| 4.0x or more | 193 (11.6%) | 49 (7.8%) |
| Total | 1,668 (100.0%) | 630 (100.0%) |
Real Estate Taxes by Mortgage Status in Sweetwater
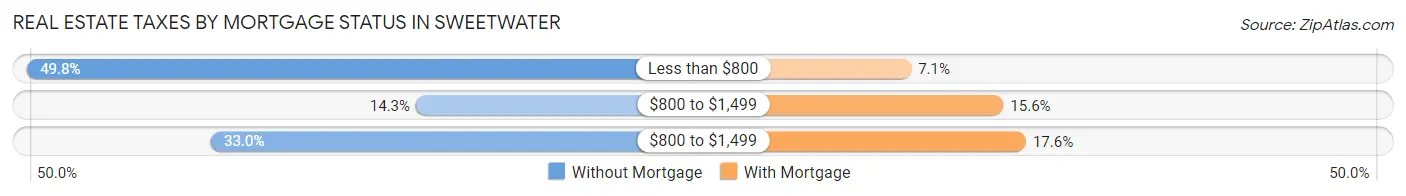
| Property Taxes | Without Mortgage | With Mortgage |
| Less than $800 | 830 (49.8%) | 45 (7.1%) |
| $800 to $1,499 | 238 (14.3%) | 98 (15.6%) |
| $800 to $1,499 | 550 (33.0%) | 111 (17.6%) |
| Total | 1,668 (100.0%) | 630 (100.0%) |
Health & Disability in Sweetwater
Health Insurance Coverage by Age in Sweetwater
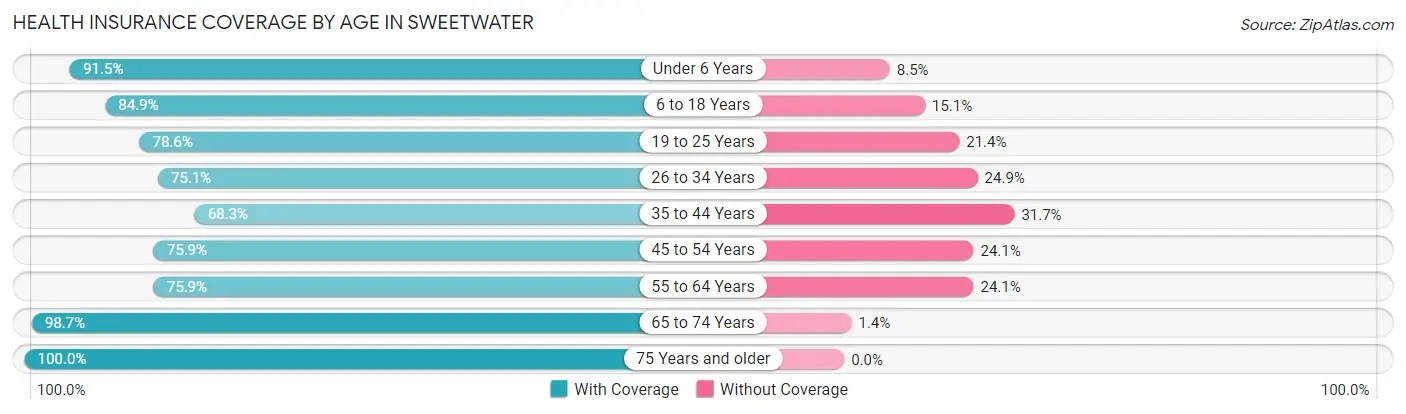
| Age Bracket | With Coverage | Without Coverage |
| Under 6 Years | 851 (91.5%) | 79 (8.5%) |
| 6 to 18 Years | 1,810 (84.9%) | 321 (15.1%) |
| 19 to 25 Years | 656 (78.6%) | 179 (21.4%) |
| 26 to 34 Years | 897 (75.1%) | 297 (24.9%) |
| 35 to 44 Years | 811 (68.3%) | 377 (31.7%) |
| 45 to 54 Years | 894 (75.9%) | 284 (24.1%) |
| 55 to 64 Years | 900 (75.9%) | 286 (24.1%) |
| 65 to 74 Years | 1,097 (98.7%) | 15 (1.3%) |
| 75 Years and older | 615 (100.0%) | 0 (0.0%) |
| Total | 8,531 (82.3%) | 1,838 (17.7%) |
Health Insurance Coverage by Citizenship Status in Sweetwater
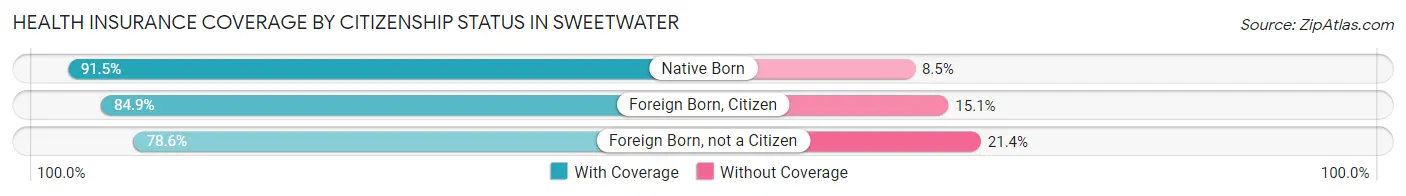
| Citizenship Status | With Coverage | Without Coverage |
| Native Born | 851 (91.5%) | 79 (8.5%) |
| Foreign Born, Citizen | 1,810 (84.9%) | 321 (15.1%) |
| Foreign Born, not a Citizen | 656 (78.6%) | 179 (21.4%) |
Health Insurance Coverage by Household Income in Sweetwater
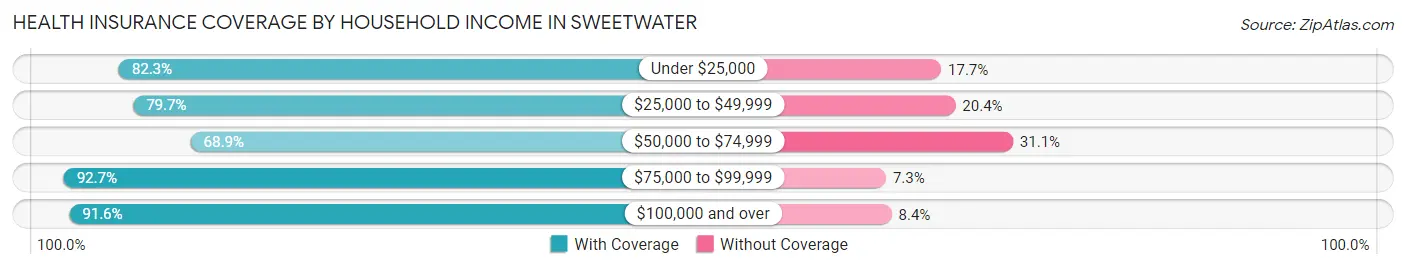
| Household Income | With Coverage | Without Coverage |
| Under $25,000 | 1,305 (82.3%) | 280 (17.7%) |
| $25,000 to $49,999 | 2,603 (79.6%) | 665 (20.3%) |
| $50,000 to $74,999 | 1,350 (68.9%) | 610 (31.1%) |
| $75,000 to $99,999 | 1,629 (92.7%) | 129 (7.3%) |
| $100,000 and over | 1,605 (91.6%) | 147 (8.4%) |
Public vs Private Health Insurance Coverage by Age in Sweetwater
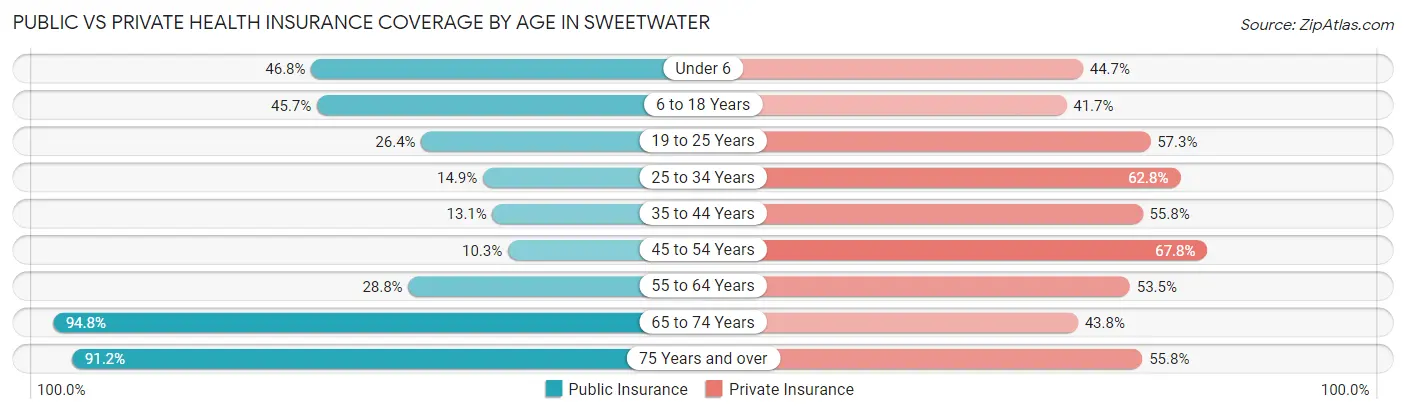
| Age Bracket | Public Insurance | Private Insurance |
| Under 6 | 435 (46.8%) | 416 (44.7%) |
| 6 to 18 Years | 974 (45.7%) | 888 (41.7%) |
| 19 to 25 Years | 220 (26.4%) | 478 (57.3%) |
| 25 to 34 Years | 178 (14.9%) | 750 (62.8%) |
| 35 to 44 Years | 156 (13.1%) | 663 (55.8%) |
| 45 to 54 Years | 121 (10.3%) | 799 (67.8%) |
| 55 to 64 Years | 341 (28.7%) | 634 (53.5%) |
| 65 to 74 Years | 1,054 (94.8%) | 487 (43.8%) |
| 75 Years and over | 561 (91.2%) | 343 (55.8%) |
| Total | 4,040 (39.0%) | 5,458 (52.6%) |
Disability Status by Sex by Age in Sweetwater
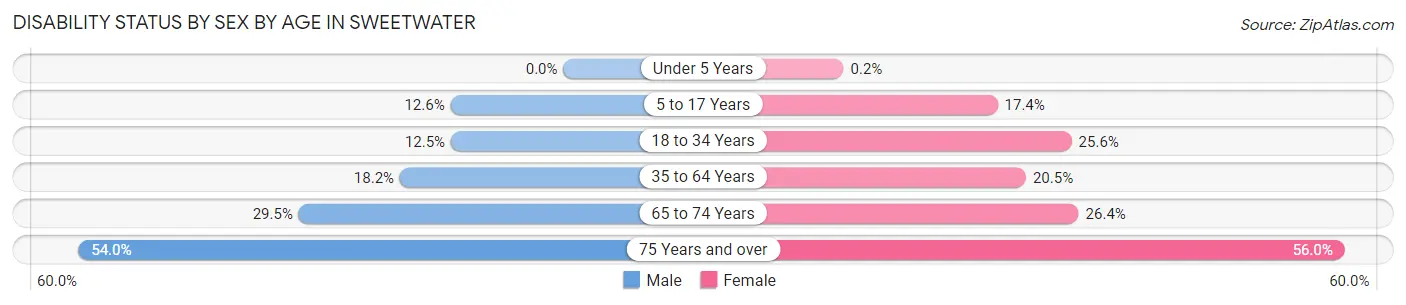
| Age Bracket | Male | Female |
| Under 5 Years | 0 (0.0%) | 1 (0.2%) |
| 5 to 17 Years | 138 (12.6%) | 165 (17.3%) |
| 18 to 34 Years | 134 (12.5%) | 287 (25.6%) |
| 35 to 64 Years | 335 (18.2%) | 351 (20.5%) |
| 65 to 74 Years | 168 (29.5%) | 143 (26.4%) |
| 75 Years and over | 121 (54.0%) | 219 (56.0%) |
Disability Class by Sex by Age in Sweetwater
Disability Class: Hearing Difficulty
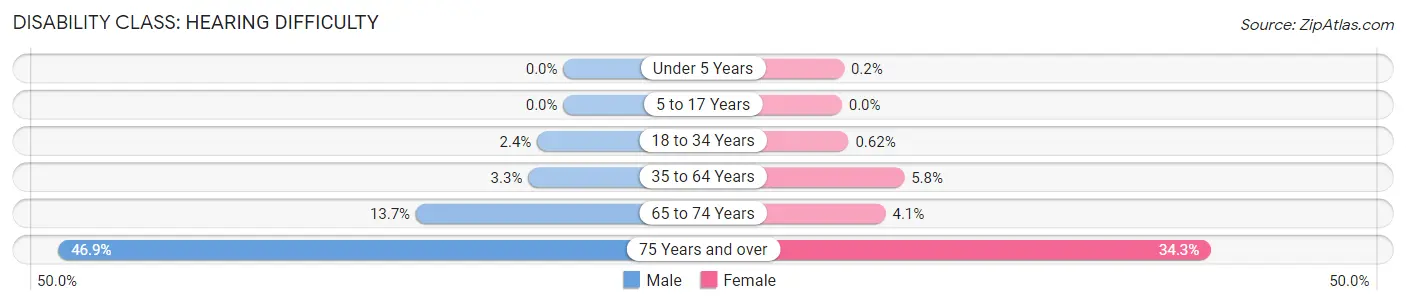
| Age Bracket | Male | Female |
| Under 5 Years | 0 (0.0%) | 1 (0.2%) |
| 5 to 17 Years | 0 (0.0%) | 0 (0.0%) |
| 18 to 34 Years | 26 (2.4%) | 7 (0.6%) |
| 35 to 64 Years | 60 (3.3%) | 99 (5.8%) |
| 65 to 74 Years | 78 (13.7%) | 22 (4.1%) |
| 75 Years and over | 105 (46.9%) | 134 (34.3%) |
Disability Class: Vision Difficulty
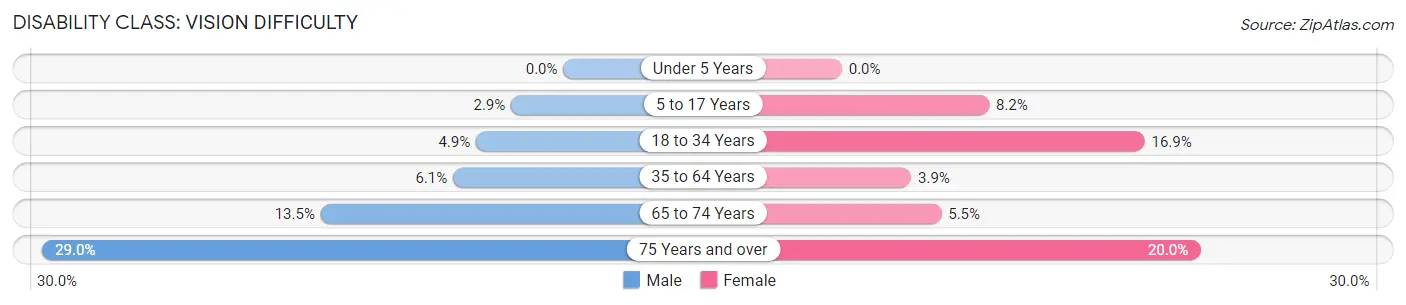
| Age Bracket | Male | Female |
| Under 5 Years | 0 (0.0%) | 0 (0.0%) |
| 5 to 17 Years | 32 (2.9%) | 78 (8.2%) |
| 18 to 34 Years | 52 (4.9%) | 189 (16.9%) |
| 35 to 64 Years | 113 (6.1%) | 66 (3.9%) |
| 65 to 74 Years | 77 (13.5%) | 30 (5.5%) |
| 75 Years and over | 65 (29.0%) | 78 (20.0%) |
Disability Class: Cognitive Difficulty
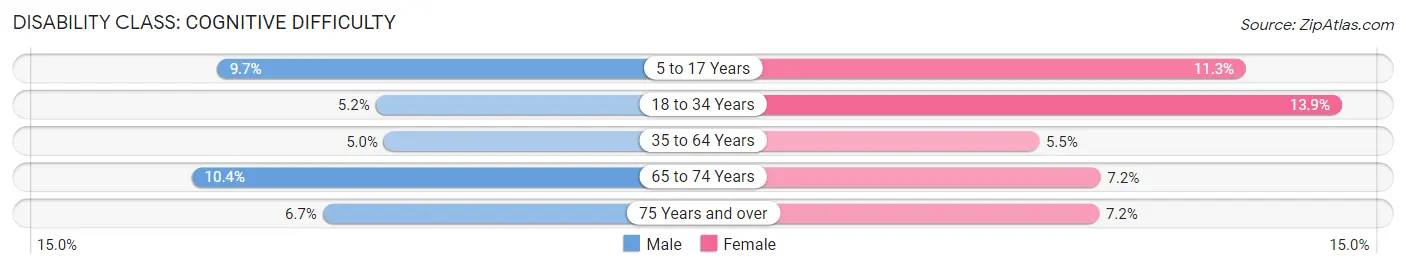
| Age Bracket | Male | Female |
| 5 to 17 Years | 106 (9.7%) | 107 (11.3%) |
| 18 to 34 Years | 56 (5.2%) | 156 (13.9%) |
| 35 to 64 Years | 92 (5.0%) | 94 (5.5%) |
| 65 to 74 Years | 59 (10.3%) | 39 (7.2%) |
| 75 Years and over | 15 (6.7%) | 28 (7.2%) |
Disability Class: Ambulatory Difficulty
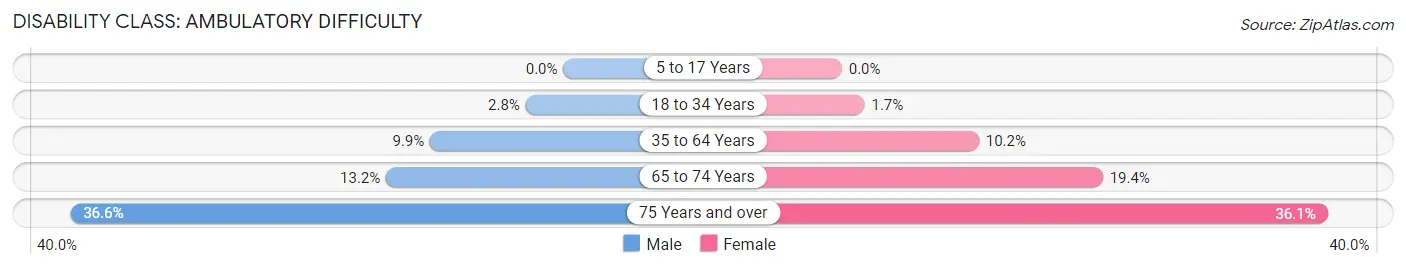
| Age Bracket | Male | Female |
| 5 to 17 Years | 0 (0.0%) | 0 (0.0%) |
| 18 to 34 Years | 30 (2.8%) | 19 (1.7%) |
| 35 to 64 Years | 182 (9.9%) | 174 (10.2%) |
| 65 to 74 Years | 75 (13.2%) | 105 (19.4%) |
| 75 Years and over | 82 (36.6%) | 141 (36.1%) |
Disability Class: Self-Care Difficulty
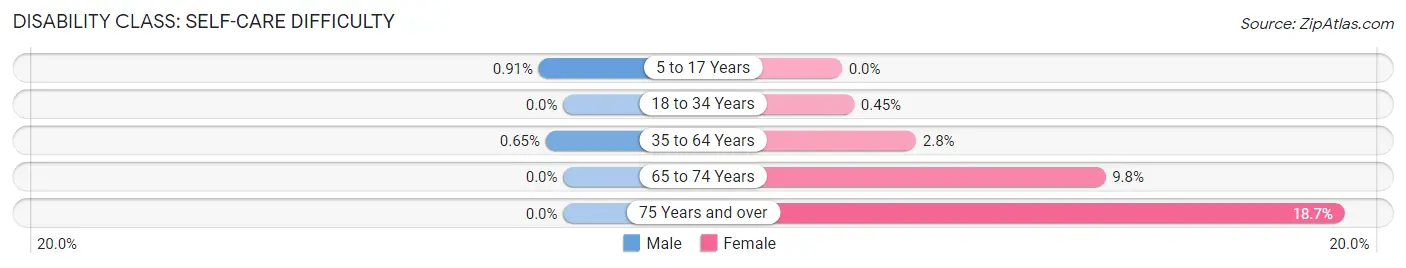
| Age Bracket | Male | Female |
| 5 to 17 Years | 10 (0.9%) | 0 (0.0%) |
| 18 to 34 Years | 0 (0.0%) | 5 (0.4%) |
| 35 to 64 Years | 12 (0.6%) | 47 (2.8%) |
| 65 to 74 Years | 0 (0.0%) | 53 (9.8%) |
| 75 Years and over | 0 (0.0%) | 73 (18.7%) |
Technology Access in Sweetwater
Computing Device Access in Sweetwater
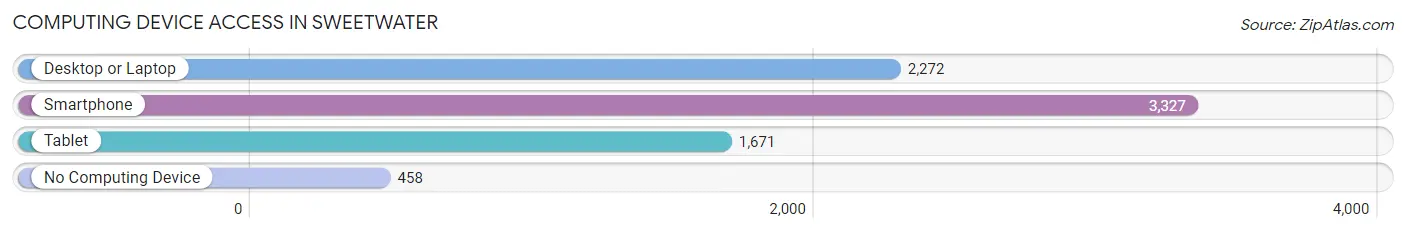
| Device Type | # Households | % Households |
| Desktop or Laptop | 2,272 | 56.2% |
| Smartphone | 3,327 | 82.4% |
| Tablet | 1,671 | 41.4% |
| No Computing Device | 458 | 11.3% |
| Total | 4,040 | 100.0% |
Internet Access in Sweetwater
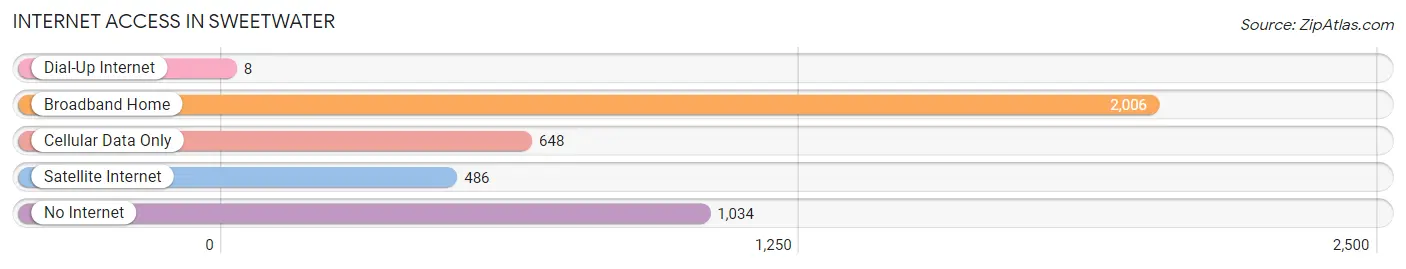
| Internet Type | # Households | % Households |
| Dial-Up Internet | 8 | 0.2% |
| Broadband Home | 2,006 | 49.6% |
| Cellular Data Only | 648 | 16.0% |
| Satellite Internet | 486 | 12.0% |
| No Internet | 1,034 | 25.6% |
| Total | 4,040 | 100.0% |
Sweetwater Summary
Watertown, Texas is a small town located in the western part of Nolan County, Texas. It is situated on the banks of the Sweetwater Creek, which is a tributary of the Colorado River. The town was founded in 1881 and was named after the creek. It is the county seat of Nolan County and has a population of approximately 11,000 people.
History
The area around Sweetwater was first settled in the late 1870s by ranchers and farmers. The town was officially founded in 1881 and was named after the Sweetwater Creek. The town was incorporated in 1882 and the first mayor was elected in 1883. The town quickly grew and by the early 1900s, it had become a major center for the cattle industry. The town was also home to several cotton gins and other businesses.
In the early 1900s, Sweetwater was a major stop on the Texas and Pacific Railway. This allowed the town to become a major shipping center for the region. The town also became a major center for oil production in the 1920s. This led to a population boom and the town grew rapidly.
In the 1950s, Sweetwater was the site of a major uranium processing plant. This plant was responsible for the production of uranium for the United States' nuclear weapons program. The plant closed in the late 1960s and the town's population began to decline.
Geography
Sweetwater is located in the western part of Nolan County, Texas. It is situated on the banks of the Sweetwater Creek, which is a tributary of the Colorado River. The town is located at an elevation of 1,845 feet and has an area of 8.3 square miles. The climate is semi-arid and the average temperature is around 70 degrees Fahrenheit.
Economy
The economy of Sweetwater is largely based on agriculture and oil production. The town is home to several cotton gins and other agricultural businesses. The town is also home to several oil and gas companies. The town is also home to several manufacturing companies, including a large wind turbine manufacturing plant.
Demographics
As of the 2010 census, Sweetwater had a population of 11,000 people. The racial makeup of the town was 75.3% White, 0.7% African American, 0.3% Native American, 0.2% Asian, 0.1% Pacific Islander, and 22.4% from other races. The median household income was $31,000 and the median family income was $37,000. The per capita income was $17,000.
Conclusion
Sweetwater, Texas is a small town located in the western part of Nolan County, Texas. It is situated on the banks of the Sweetwater Creek, which is a tributary of the Colorado River. The town was founded in 1881 and was named after the creek. It is the county seat of Nolan County and has a population of approximately 11,000 people. The economy of Sweetwater is largely based on agriculture and oil production. The town is also home to several manufacturing companies, including a large wind turbine manufacturing plant. As of the 2010 census, Sweetwater had a population of 11,000 people. The racial makeup of the town was 75.3% White, 0.7% African American, 0.3% Native American, 0.2% Asian, 0.1% Pacific Islander, and 22.4% from other races. The median household income was $31,000 and the median family income was $37,000. The per capita income was $17,000.
Common Questions
What is Per Capita Income in Sweetwater?
Per Capita income in Sweetwater is $25,087.
What is the Median Family Income in Sweetwater?
Median Family Income in Sweetwater is $54,167.
What is the Median Household income in Sweetwater?
Median Household Income in Sweetwater is $44,306.
What is Income or Wage Gap in Sweetwater?
Income or Wage Gap in Sweetwater is 24.7%.
Women in Sweetwater earn 75.3 cents for every dollar earned by a man.
What is Family Income Deficit in Sweetwater?
Family Income Deficit in Sweetwater is $8,687.
Families that are below poverty line in Sweetwater earn $8,687 less on average than the poverty threshold level.
What is Inequality or Gini Index in Sweetwater?
Inequality or Gini Index in Sweetwater is 0.48.
What is the Total Population of Sweetwater?
Total Population of Sweetwater is 10,546.
What is the Total Male Population of Sweetwater?
Total Male Population of Sweetwater is 5,228.
What is the Total Female Population of Sweetwater?
Total Female Population of Sweetwater is 5,318.
What is the Ratio of Males per 100 Females in Sweetwater?
There are 98.31 Males per 100 Females in Sweetwater.
What is the Ratio of Females per 100 Males in Sweetwater?
There are 101.72 Females per 100 Males in Sweetwater.
What is the Median Population Age in Sweetwater?
Median Population Age in Sweetwater is 35.7 Years.
What is the Average Family Size in Sweetwater
Average Family Size in Sweetwater is 3.3 People.
What is the Average Household Size in Sweetwater
Average Household Size in Sweetwater is 2.6 People.
How Large is the Labor Force in Sweetwater?
There are 4,889 People in the Labor Forcein in Sweetwater.
What is the Percentage of People in the Labor Force in Sweetwater?
61.1% of People are in the Labor Force in Sweetwater.
What is the Unemployment Rate in Sweetwater?
Unemployment Rate in Sweetwater is 6.3%.