Sweeny, TX Map & Demographics
Sweeny Map
Sweeny Overview
$35,250
PER CAPITA INCOME
$78,415
AVG FAMILY INCOME
$63,125
AVG HOUSEHOLD INCOME
72.3%
WAGE / INCOME GAP [ % ]
27.7¢/ $1
WAGE / INCOME GAP [ $ ]
$12,816
FAMILY INCOME DEFICIT
0.44
INEQUALITY / GINI INDEX
3,602
TOTAL POPULATION
1,806
MALE POPULATION
1,796
FEMALE POPULATION
100.56
MALES / 100 FEMALES
99.45
FEMALES / 100 MALES
32.7
MEDIAN AGE
3.4
AVG FAMILY SIZE
2.6
AVG HOUSEHOLD SIZE
1,491
LABOR FORCE [ PEOPLE ]
56.9%
PERCENT IN LABOR FORCE
5.1%
UNEMPLOYMENT RATE
Sweeny Zip Codes
Sweeny Area Codes
Income in Sweeny
Income Overview in Sweeny
Per Capita Income in Sweeny is $35,250, while median incomes of families and households are $78,415 and $63,125 respectively.
| Characteristic | Number | Measure |
| Per Capita Income | 3,602 | $35,250 |
| Median Family Income | 856 | $78,415 |
| Mean Family Income | 856 | $112,995 |
| Median Household Income | 1,357 | $63,125 |
| Mean Household Income | 1,357 | $92,238 |
| Income Deficit | 856 | $12,816 |
| Wage / Income Gap (%) | 3,602 | 72.27% |
| Wage / Income Gap ($) | 3,602 | 27.73¢ per $1 |
| Gini / Inequality Index | 3,602 | 0.44 |
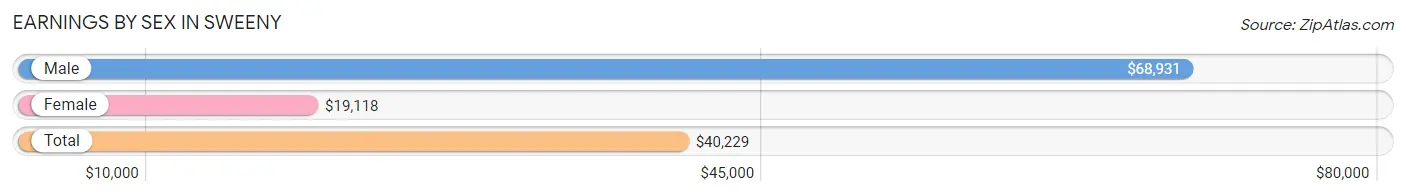
Earnings by Sex in Sweeny
Average Earnings in Sweeny are $40,229, $68,931 for men and $19,118 for women, a difference of 72.3%.
| Sex | Number | Average Earnings |
| Male | 931 (61.8%) | $68,931 |
| Female | 576 (38.2%) | $19,118 |
| Total | 1,507 (100.0%) | $40,229 |
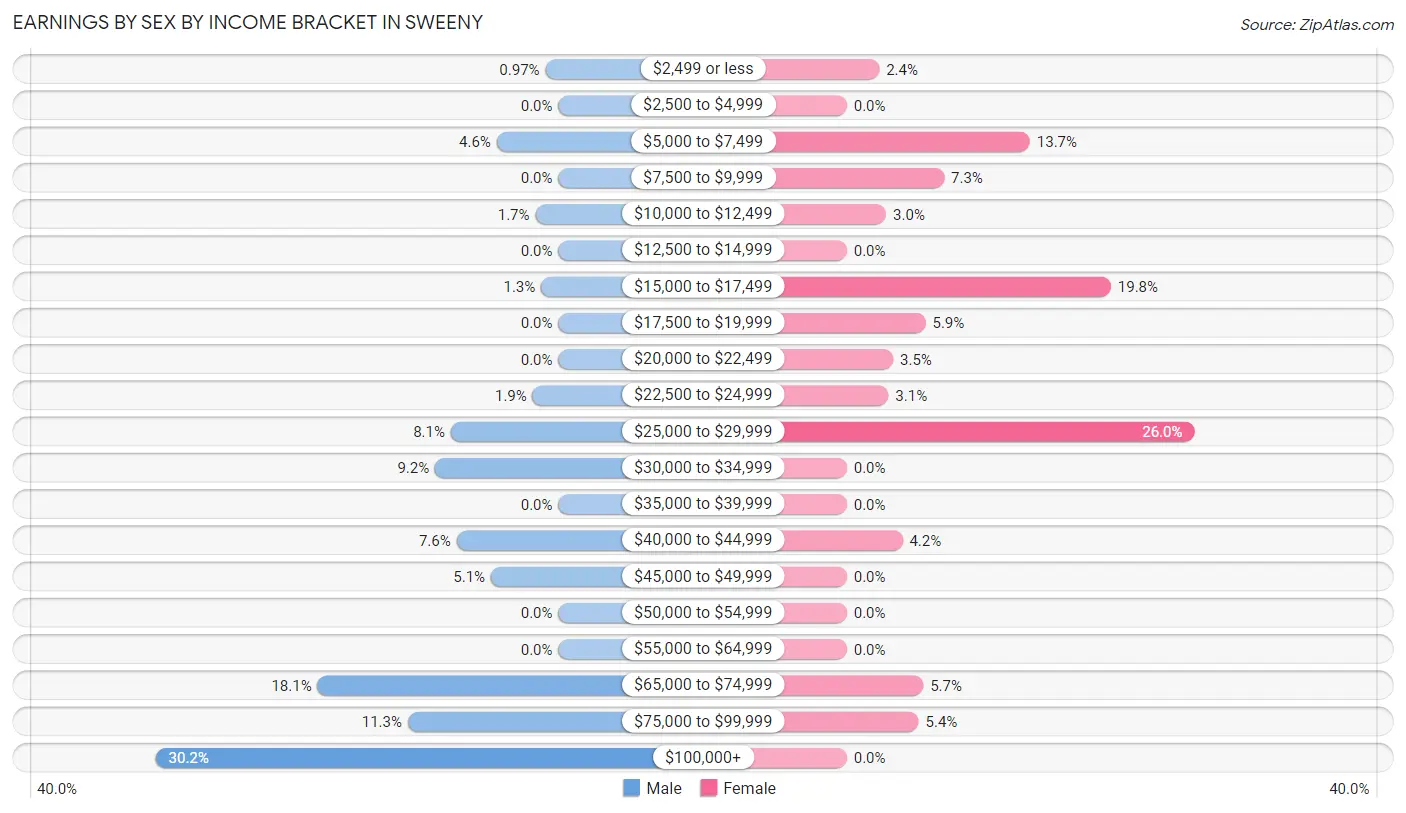
Earnings by Sex by Income Bracket in Sweeny
The most common earnings brackets in Sweeny are $100,000+ for men (281 | 30.2%) and $25,000 to $29,999 for women (150 | 26.0%).
| Income | Male | Female |
| $2,499 or less | 9 (1.0%) | 14 (2.4%) |
| $2,500 to $4,999 | 0 (0.0%) | 0 (0.0%) |
| $5,000 to $7,499 | 43 (4.6%) | 79 (13.7%) |
| $7,500 to $9,999 | 0 (0.0%) | 42 (7.3%) |
| $10,000 to $12,499 | 16 (1.7%) | 17 (2.9%) |
| $12,500 to $14,999 | 0 (0.0%) | 0 (0.0%) |
| $15,000 to $17,499 | 12 (1.3%) | 114 (19.8%) |
| $17,500 to $19,999 | 0 (0.0%) | 34 (5.9%) |
| $20,000 to $22,499 | 0 (0.0%) | 20 (3.5%) |
| $22,500 to $24,999 | 18 (1.9%) | 18 (3.1%) |
| $25,000 to $29,999 | 75 (8.1%) | 150 (26.0%) |
| $30,000 to $34,999 | 86 (9.2%) | 0 (0.0%) |
| $35,000 to $39,999 | 0 (0.0%) | 0 (0.0%) |
| $40,000 to $44,999 | 71 (7.6%) | 24 (4.2%) |
| $45,000 to $49,999 | 47 (5.1%) | 0 (0.0%) |
| $50,000 to $54,999 | 0 (0.0%) | 0 (0.0%) |
| $55,000 to $64,999 | 0 (0.0%) | 0 (0.0%) |
| $65,000 to $74,999 | 168 (18.0%) | 33 (5.7%) |
| $75,000 to $99,999 | 105 (11.3%) | 31 (5.4%) |
| $100,000+ | 281 (30.2%) | 0 (0.0%) |
| Total | 931 (100.0%) | 576 (100.0%) |
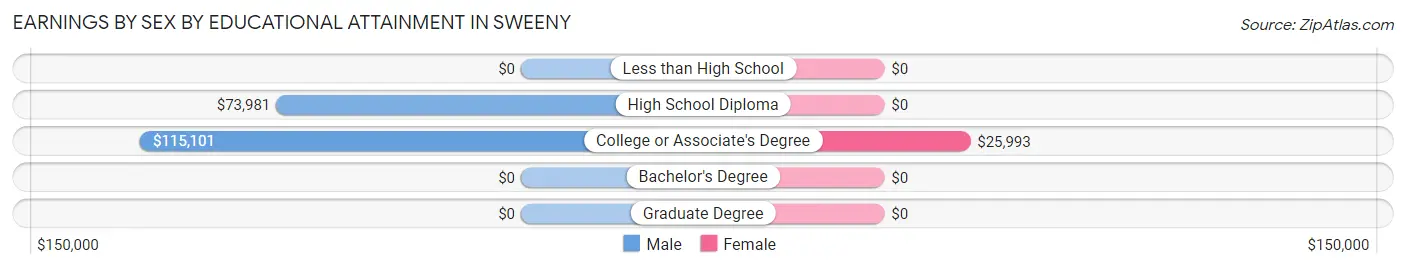
Earnings by Sex by Educational Attainment in Sweeny
Average earnings in Sweeny are $72,877 for men and $19,559 for women, a difference of 73.2%. Men with an educational attainment of college or associate's degree enjoy the highest average annual earnings of $115,101, while those with high school diploma education earn the least with $73,981. Women with an educational attainment of college or associate's degree earn the most with the average annual earnings of $25,993, while those with college or associate's degree education have the smallest earnings of $25,993.
| Educational Attainment | Male Income | Female Income |
| Less than High School | - | - |
| High School Diploma | $73,981 | $0 |
| College or Associate's Degree | $115,101 | $25,993 |
| Bachelor's Degree | - | - |
| Graduate Degree | - | - |
| Total | $72,877 | $19,559 |
Family Income in Sweeny
Family Income Brackets in Sweeny
According to the Sweeny family income data, there are 183 families falling into the $50,000 to $74,999 income range, which is the most common income bracket and makes up 21.4% of all families.

| Income Bracket | # Families | % Families |
| Less than $10,000 | 61 | 7.1% |
| $10,000 to $14,999 | 0 | 0.0% |
| $15,000 to $24,999 | 34 | 4.0% |
| $25,000 to $34,999 | 17 | 2.0% |
| $35,000 to $49,999 | 83 | 9.7% |
| $50,000 to $74,999 | 183 | 21.4% |
| $75,000 to $99,999 | 126 | 14.7% |
| $100,000 to $149,999 | 125 | 14.6% |
| $150,000 to $199,999 | 79 | 9.2% |
| $200,000+ | 148 | 17.3% |
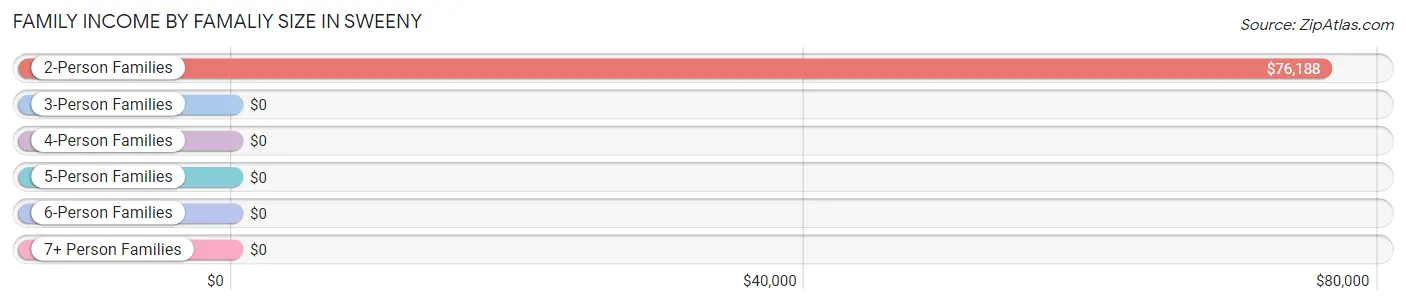
Family Income by Famaliy Size in Sweeny
2-person families (293 | 34.2%) account for the highest median family income in Sweeny with $76,188 per family, while 2-person families (293 | 34.2%) have the highest median income of $38,094 per family member.
| Income Bracket | # Families | Median Income |
| 2-Person Families | 293 (34.2%) | $76,188 |
| 3-Person Families | 305 (35.6%) | $0 |
| 4-Person Families | 65 (7.6%) | $0 |
| 5-Person Families | 104 (12.1%) | $0 |
| 6-Person Families | 0 (0.0%) | $0 |
| 7+ Person Families | 89 (10.4%) | $0 |
| Total | 856 (100.0%) | $78,415 |
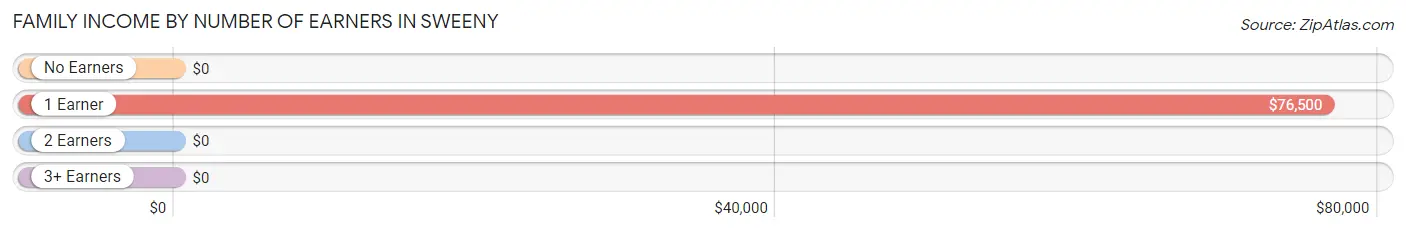
Family Income by Number of Earners in Sweeny
| Number of Earners | # Families | Median Income |
| No Earners | 63 (7.4%) | $0 |
| 1 Earner | 386 (45.1%) | $76,500 |
| 2 Earners | 374 (43.7%) | $0 |
| 3+ Earners | 33 (3.9%) | $0 |
| Total | 856 (100.0%) | $78,415 |
Household Income in Sweeny
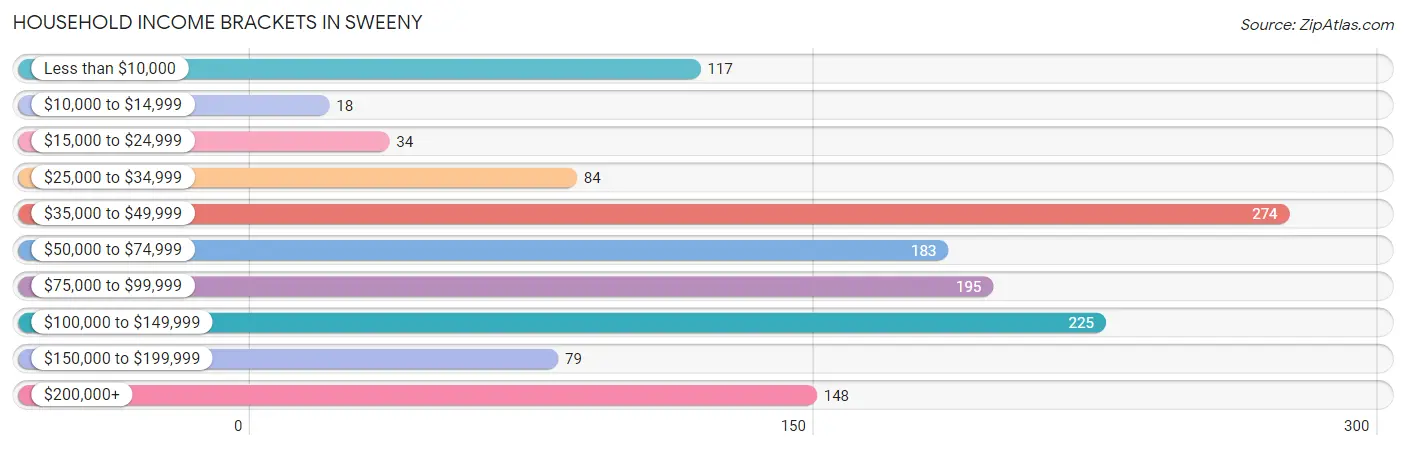
Household Income Brackets in Sweeny
With 274 households falling in the category, the $35,000 to $49,999 income range is the most frequent in Sweeny, accounting for 20.2% of all households. In contrast, only 18 households (1.3%) fall into the $10,000 to $14,999 income bracket, making it the least populous group.
| Income Bracket | # Households | % Households |
| Less than $10,000 | 117 | 8.6% |
| $10,000 to $14,999 | 18 | 1.3% |
| $15,000 to $24,999 | 34 | 2.5% |
| $25,000 to $34,999 | 84 | 6.2% |
| $35,000 to $49,999 | 274 | 20.2% |
| $50,000 to $74,999 | 183 | 13.5% |
| $75,000 to $99,999 | 195 | 14.4% |
| $100,000 to $149,999 | 225 | 16.6% |
| $150,000 to $199,999 | 79 | 5.8% |
| $200,000+ | 148 | 10.9% |
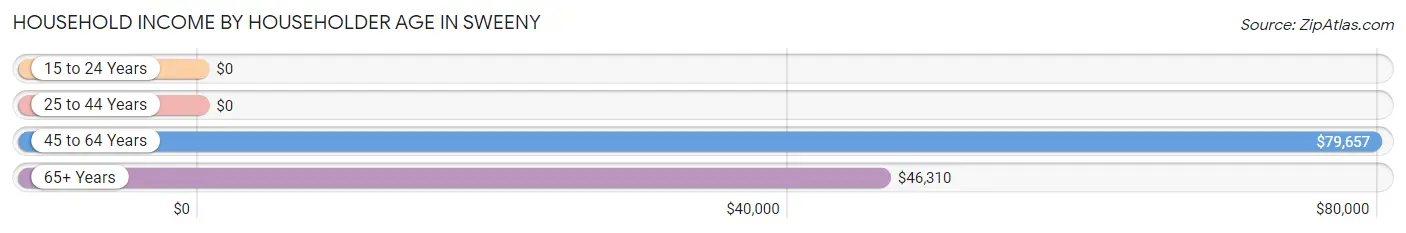
Household Income by Householder Age in Sweeny
The median household income in Sweeny is $63,125, with the highest median household income of $79,657 found in the 45 to 64 years age bracket for the primary householder. A total of 539 households (39.7%) fall into this category. Meanwhile, the 15 to 24 years age bracket for the primary householder has the lowest median household income of $0, with 63 households (4.6%) in this group.
| Income Bracket | # Households | Median Income |
| 15 to 24 Years | 63 (4.6%) | $0 |
| 25 to 44 Years | 453 (33.4%) | $0 |
| 45 to 64 Years | 539 (39.7%) | $79,657 |
| 65+ Years | 302 (22.3%) | $46,310 |
| Total | 1,357 (100.0%) | $63,125 |
Poverty in Sweeny
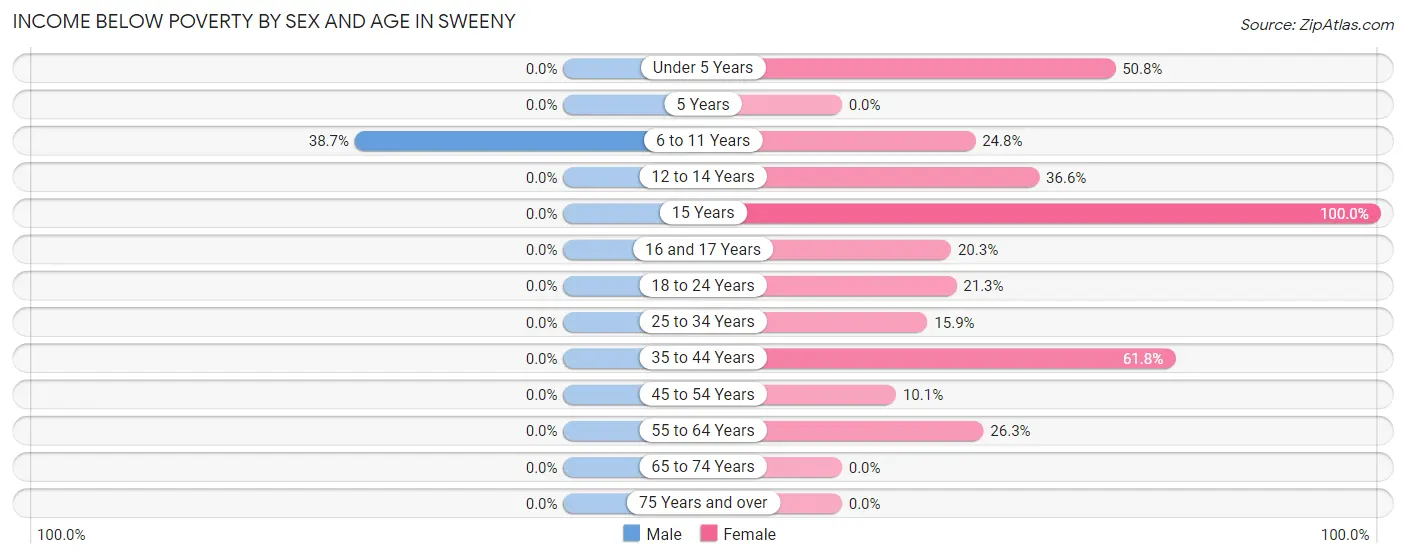
Income Below Poverty by Sex and Age in Sweeny
With 3.4% poverty level for males and 22.8% for females among the residents of Sweeny, 6 to 11 year old males and 15 year old females are the most vulnerable to poverty, with 60 males (38.7%) and 54 females (100.0%) in their respective age groups living below the poverty level.
| Age Bracket | Male | Female |
| Under 5 Years | 0 (0.0%) | 34 (50.7%) |
| 5 Years | 0 (0.0%) | 0 (0.0%) |
| 6 to 11 Years | 60 (38.7%) | 53 (24.8%) |
| 12 to 14 Years | 0 (0.0%) | 37 (36.6%) |
| 15 Years | 0 (0.0%) | 54 (100.0%) |
| 16 and 17 Years | 0 (0.0%) | 15 (20.3%) |
| 18 to 24 Years | 0 (0.0%) | 37 (21.3%) |
| 25 to 34 Years | 0 (0.0%) | 48 (15.9%) |
| 35 to 44 Years | 0 (0.0%) | 47 (61.8%) |
| 45 to 54 Years | 0 (0.0%) | 18 (10.1%) |
| 55 to 64 Years | 0 (0.0%) | 56 (26.3%) |
| 65 to 74 Years | 0 (0.0%) | 0 (0.0%) |
| 75 Years and over | 0 (0.0%) | 0 (0.0%) |
| Total | 60 (3.4%) | 399 (22.8%) |
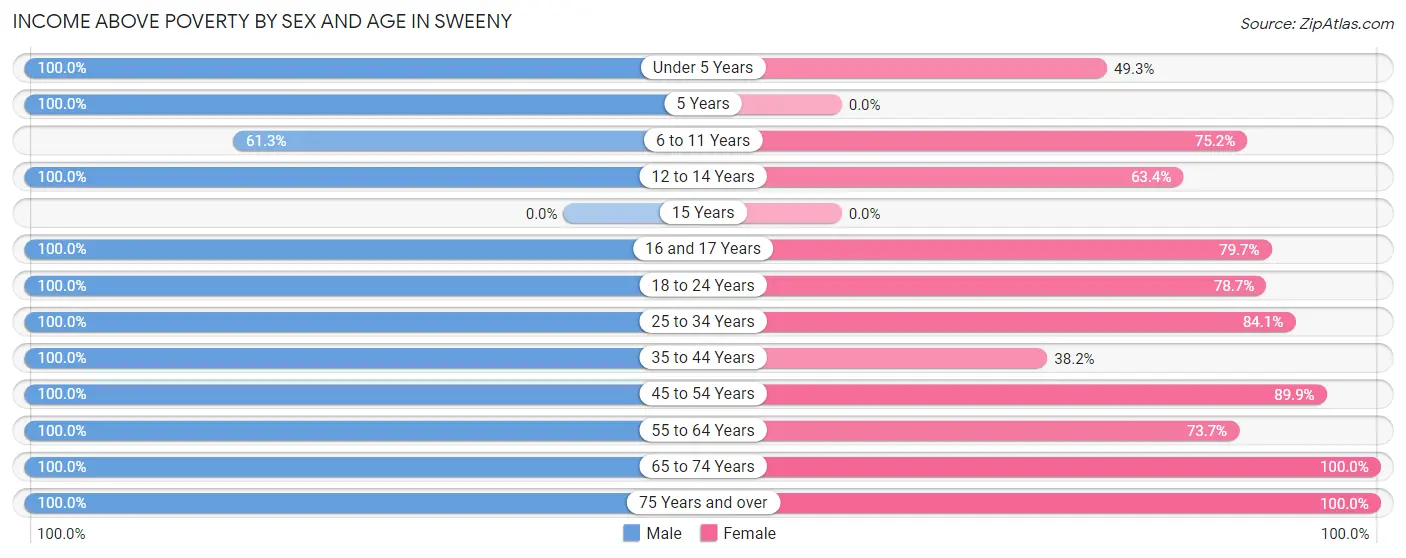
Income Above Poverty by Sex and Age in Sweeny
According to the poverty statistics in Sweeny, males aged under 5 years and females aged 65 to 74 years are the age groups that are most secure financially, with 100.0% of males and 100.0% of females in these age groups living above the poverty line.
| Age Bracket | Male | Female |
| Under 5 Years | 129 (100.0%) | 33 (49.2%) |
| 5 Years | 101 (100.0%) | 0 (0.0%) |
| 6 to 11 Years | 95 (61.3%) | 161 (75.2%) |
| 12 to 14 Years | 160 (100.0%) | 64 (63.4%) |
| 15 Years | 0 (0.0%) | 0 (0.0%) |
| 16 and 17 Years | 33 (100.0%) | 59 (79.7%) |
| 18 to 24 Years | 60 (100.0%) | 137 (78.7%) |
| 25 to 34 Years | 353 (100.0%) | 254 (84.1%) |
| 35 to 44 Years | 116 (100.0%) | 29 (38.2%) |
| 45 to 54 Years | 147 (100.0%) | 161 (89.9%) |
| 55 to 64 Years | 242 (100.0%) | 157 (73.7%) |
| 65 to 74 Years | 112 (100.0%) | 90 (100.0%) |
| 75 Years and over | 144 (100.0%) | 203 (100.0%) |
| Total | 1,692 (96.6%) | 1,348 (77.2%) |
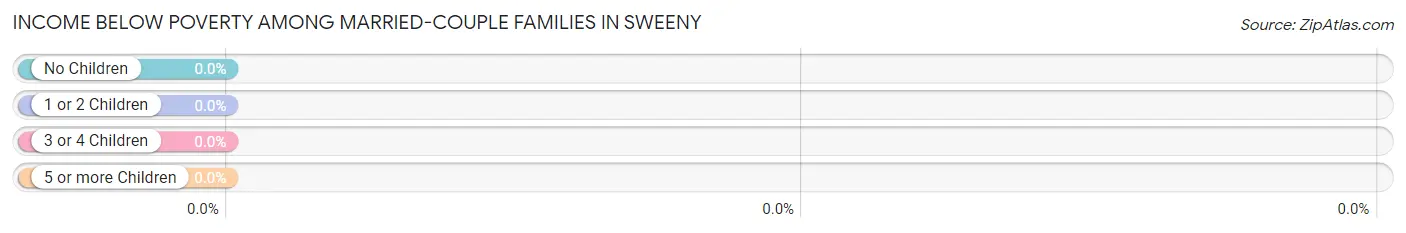
Income Below Poverty Among Married-Couple Families in Sweeny
| Children | Above Poverty | Below Poverty |
| No Children | 228 (100.0%) | 0 (0.0%) |
| 1 or 2 Children | 277 (100.0%) | 0 (0.0%) |
| 3 or 4 Children | 71 (100.0%) | 0 (0.0%) |
| 5 or more Children | 0 (0.0%) | 0 (0.0%) |
| Total | 576 (100.0%) | 0 (0.0%) |
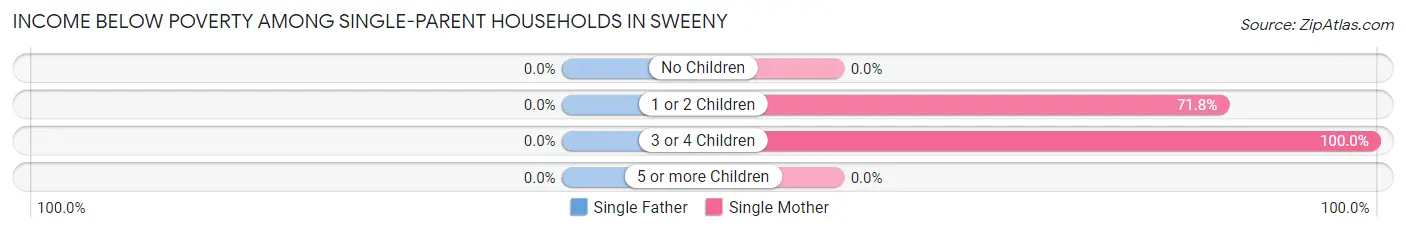
Income Below Poverty Among Single-Parent Households in Sweeny
| Children | Single Father | Single Mother |
| No Children | 0 (0.0%) | 0 (0.0%) |
| 1 or 2 Children | 0 (0.0%) | 61 (71.8%) |
| 3 or 4 Children | 0 (0.0%) | 34 (100.0%) |
| 5 or more Children | 0 (0.0%) | 0 (0.0%) |
| Total | 0 (0.0%) | 95 (68.3%) |
Income Below Poverty Among Married-Couple vs Single-Parent Households in Sweeny
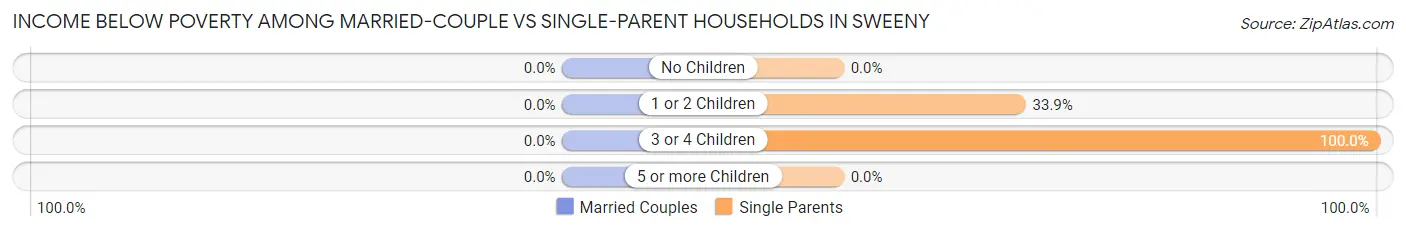
| Children | Married-Couple Families | Single-Parent Households |
| No Children | 0 (0.0%) | 0 (0.0%) |
| 1 or 2 Children | 0 (0.0%) | 61 (33.9%) |
| 3 or 4 Children | 0 (0.0%) | 34 (100.0%) |
| 5 or more Children | 0 (0.0%) | 0 (0.0%) |
| Total | 0 (0.0%) | 95 (33.9%) |
Race in Sweeny
The most populous races in Sweeny are White / Caucasian (2,959 | 82.2%), Hispanic or Latino (1,100 | 30.5%), and Black / African American (405 | 11.2%).
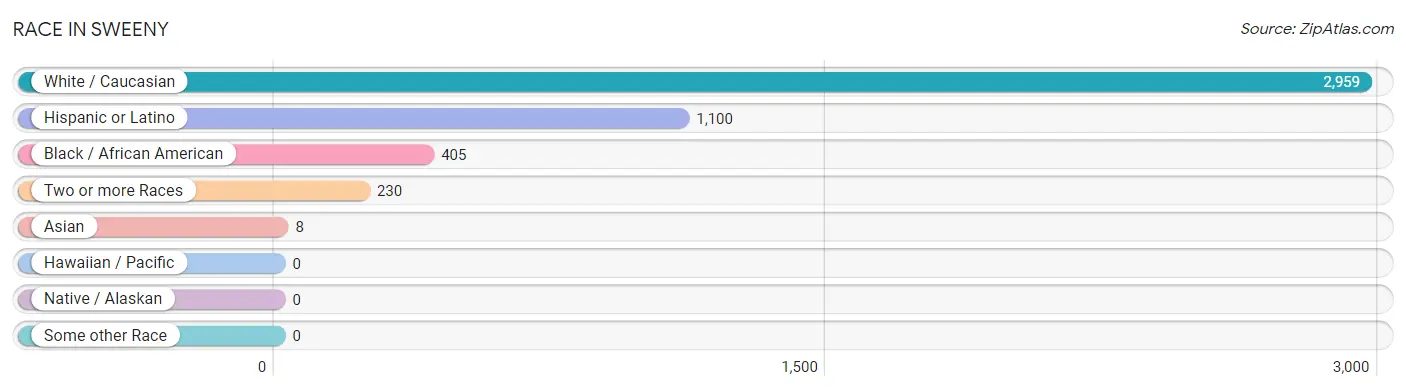
| Race | # Population | % Population |
| Asian | 8 | 0.2% |
| Black / African American | 405 | 11.2% |
| Hawaiian / Pacific | 0 | 0.0% |
| Hispanic or Latino | 1,100 | 30.5% |
| Native / Alaskan | 0 | 0.0% |
| White / Caucasian | 2,959 | 82.2% |
| Two or more Races | 230 | 6.4% |
| Some other Race | 0 | 0.0% |
| Total | 3,602 | 100.0% |
Ancestry in Sweeny
The most populous ancestries reported in Sweeny are Mexican (1,055 | 29.3%), German (622 | 17.3%), Irish (412 | 11.4%), American (229 | 6.4%), and English (194 | 5.4%), together accounting for 69.8% of all Sweeny residents.
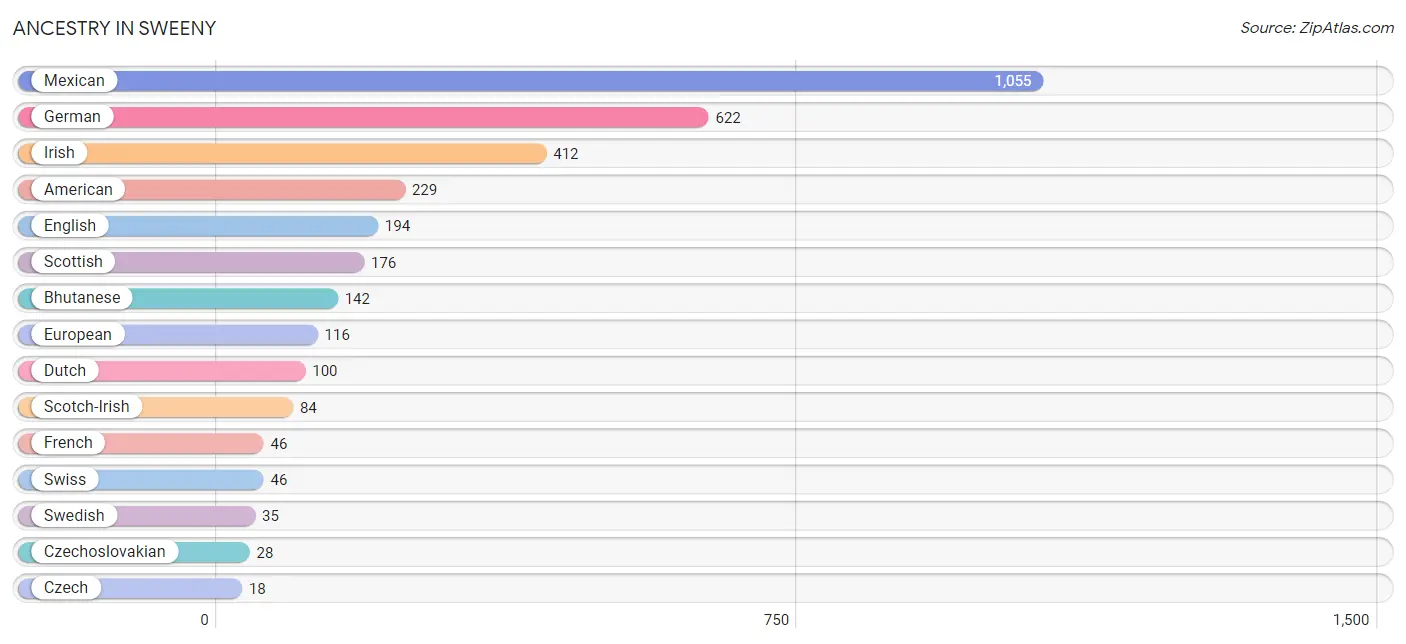
| Ancestry | # Population | % Population |
| African | 3 | 0.1% |
| American | 229 | 6.4% |
| Bhutanese | 142 | 3.9% |
| Czech | 18 | 0.5% |
| Czechoslovakian | 28 | 0.8% |
| Dutch | 100 | 2.8% |
| English | 194 | 5.4% |
| European | 116 | 3.2% |
| French | 46 | 1.3% |
| French Canadian | 5 | 0.1% |
| German | 622 | 17.3% |
| Greek | 18 | 0.5% |
| Irish | 412 | 11.4% |
| Italian | 18 | 0.5% |
| Mexican | 1,055 | 29.3% |
| Scotch-Irish | 84 | 2.3% |
| Scottish | 176 | 4.9% |
| Subsaharan African | 3 | 0.1% |
| Swedish | 35 | 1.0% |
| Swiss | 46 | 1.3% |
| Thai | 8 | 0.2% | View All 21 Rows |
Immigrants in Sweeny
The most numerous immigrant groups reported in Sweeny came from Central America (378 | 10.5%), Latin America (378 | 10.5%), Mexico (378 | 10.5%), Africa (21 | 0.6%), and Egypt (18 | 0.5%), together accounting for 32.6% of all Sweeny residents.
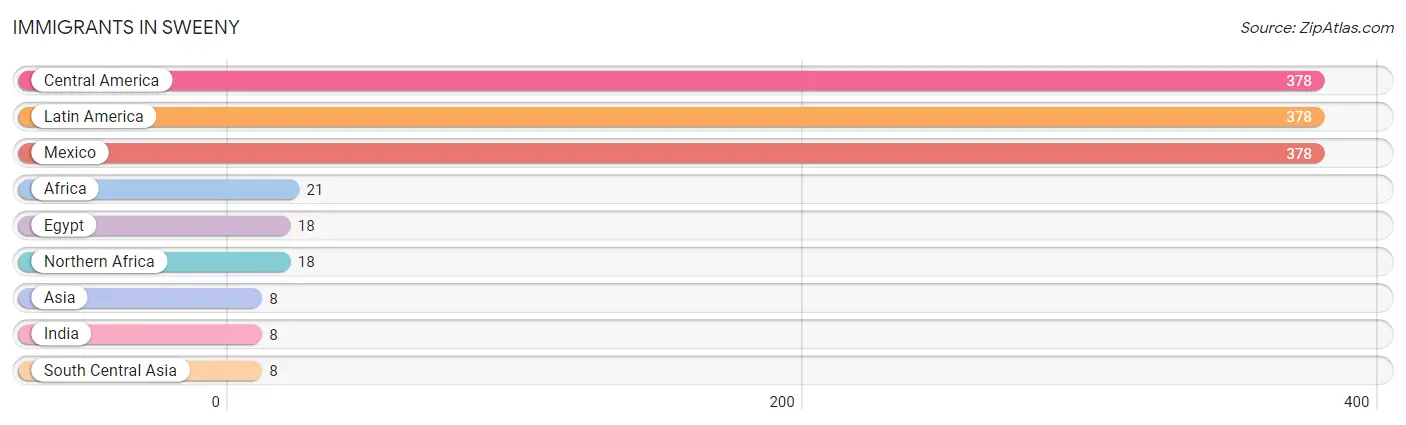
| Immigration Origin | # Population | % Population |
| Africa | 21 | 0.6% |
| Asia | 8 | 0.2% |
| Central America | 378 | 10.5% |
| Egypt | 18 | 0.5% |
| India | 8 | 0.2% |
| Latin America | 378 | 10.5% |
| Mexico | 378 | 10.5% |
| Northern Africa | 18 | 0.5% |
| South Central Asia | 8 | 0.2% | View All 9 Rows |
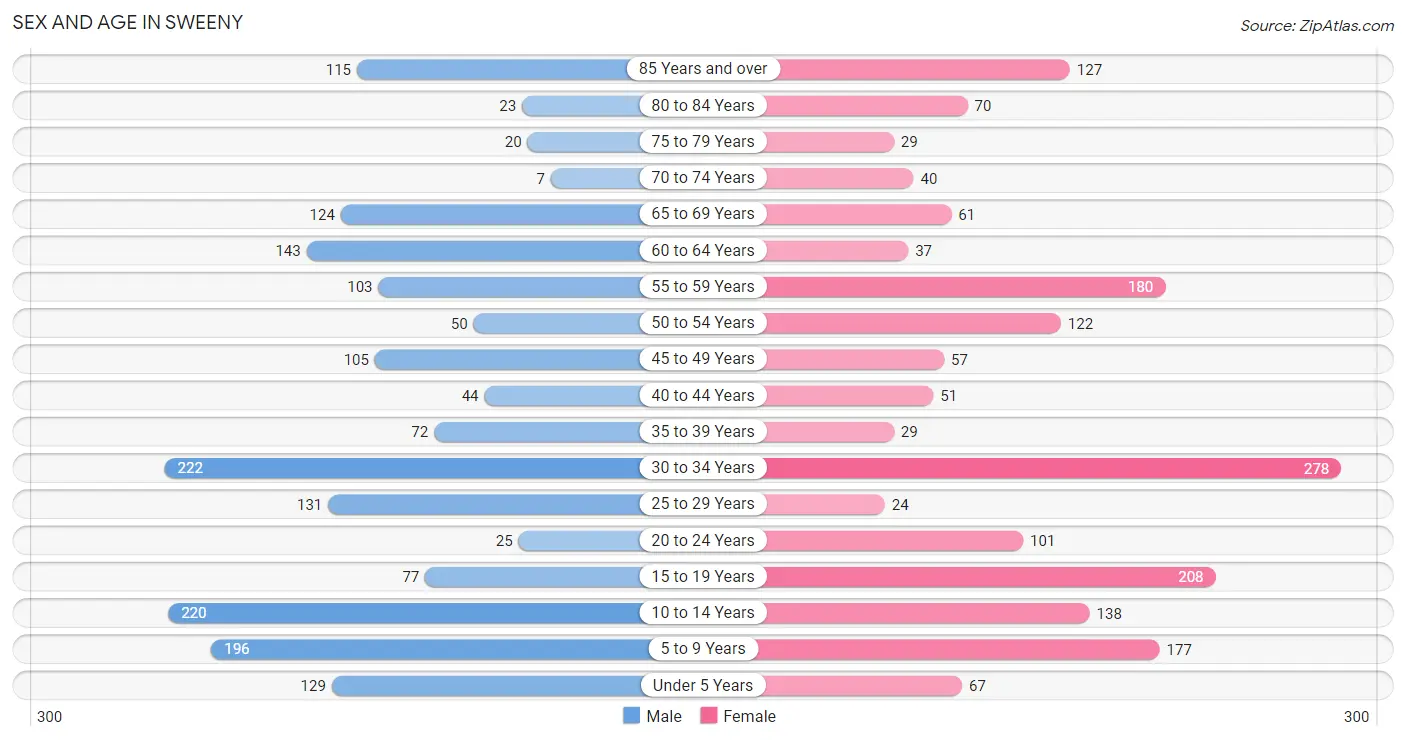
Sex and Age in Sweeny
Sex and Age in Sweeny
The most populous age groups in Sweeny are 30 to 34 Years (222 | 12.3%) for men and 30 to 34 Years (278 | 15.5%) for women.
| Age Bracket | Male | Female |
| Under 5 Years | 129 (7.1%) | 67 (3.7%) |
| 5 to 9 Years | 196 (10.8%) | 177 (9.9%) |
| 10 to 14 Years | 220 (12.2%) | 138 (7.7%) |
| 15 to 19 Years | 77 (4.3%) | 208 (11.6%) |
| 20 to 24 Years | 25 (1.4%) | 101 (5.6%) |
| 25 to 29 Years | 131 (7.2%) | 24 (1.3%) |
| 30 to 34 Years | 222 (12.3%) | 278 (15.5%) |
| 35 to 39 Years | 72 (4.0%) | 29 (1.6%) |
| 40 to 44 Years | 44 (2.4%) | 51 (2.8%) |
| 45 to 49 Years | 105 (5.8%) | 57 (3.2%) |
| 50 to 54 Years | 50 (2.8%) | 122 (6.8%) |
| 55 to 59 Years | 103 (5.7%) | 180 (10.0%) |
| 60 to 64 Years | 143 (7.9%) | 37 (2.1%) |
| 65 to 69 Years | 124 (6.9%) | 61 (3.4%) |
| 70 to 74 Years | 7 (0.4%) | 40 (2.2%) |
| 75 to 79 Years | 20 (1.1%) | 29 (1.6%) |
| 80 to 84 Years | 23 (1.3%) | 70 (3.9%) |
| 85 Years and over | 115 (6.4%) | 127 (7.1%) |
| Total | 1,806 (100.0%) | 1,796 (100.0%) |
Families and Households in Sweeny
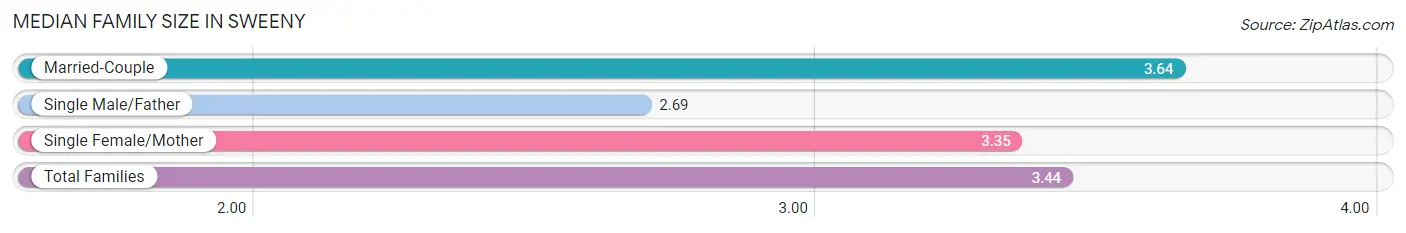
Median Family Size in Sweeny
The median family size in Sweeny is 3.44 persons per family, with married-couple families (576 | 67.3%) accounting for the largest median family size of 3.64 persons per family. On the other hand, single male/father families (141 | 16.5%) represent the smallest median family size with 2.69 persons per family.
| Family Type | # Families | Family Size |
| Married-Couple | 576 (67.3%) | 3.64 |
| Single Male/Father | 141 (16.5%) | 2.69 |
| Single Female/Mother | 139 (16.2%) | 3.35 |
| Total Families | 856 (100.0%) | 3.44 |
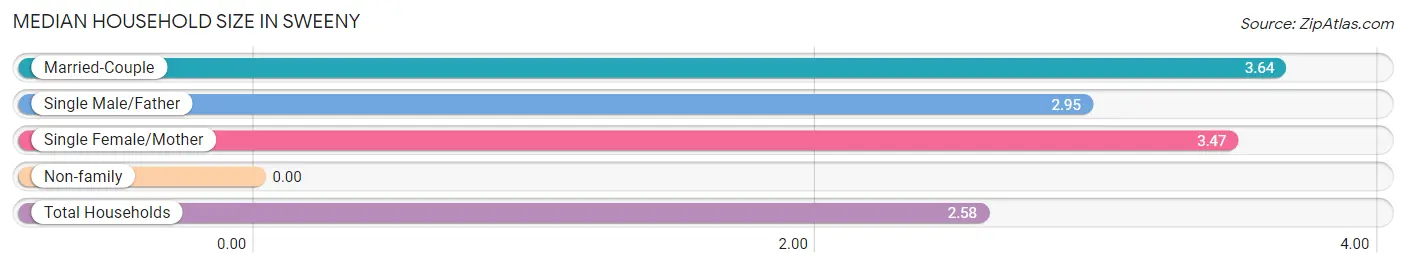
Median Household Size in Sweeny
| Household Type | # Households | Household Size |
| Married-Couple | 576 (42.4%) | 3.64 |
| Single Male/Father | 141 (10.4%) | 2.95 |
| Single Female/Mother | 139 (10.2%) | 3.47 |
| Non-family | 501 (36.9%) | - |
| Total Households | 1,357 (100.0%) | 2.58 |
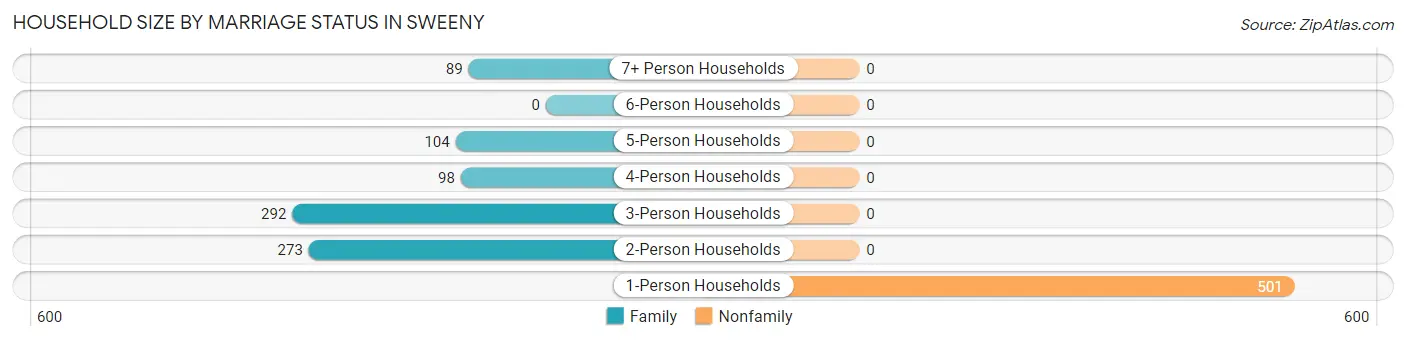
Household Size by Marriage Status in Sweeny
Out of a total of 1,357 households in Sweeny, 856 (63.1%) are family households, while 501 (36.9%) are nonfamily households. The most numerous type of family households are 3-person households, comprising 292, and the most common type of nonfamily households are 1-person households, comprising 501.
| Household Size | Family Households | Nonfamily Households |
| 1-Person Households | - | 501 (36.9%) |
| 2-Person Households | 273 (20.1%) | 0 (0.0%) |
| 3-Person Households | 292 (21.5%) | 0 (0.0%) |
| 4-Person Households | 98 (7.2%) | 0 (0.0%) |
| 5-Person Households | 104 (7.7%) | 0 (0.0%) |
| 6-Person Households | 0 (0.0%) | 0 (0.0%) |
| 7+ Person Households | 89 (6.6%) | 0 (0.0%) |
| Total | 856 (63.1%) | 501 (36.9%) |
Female Fertility in Sweeny
Fertility by Age in Sweeny
Average fertility rate in Sweeny is 85.0 births per 1,000 women. Women in the age bracket of 20 to 34 years have the highest fertility rate with 161.0 births per 1,000 women. Women in the age bracket of 20 to 34 years acount for 100.0% of all women with births.
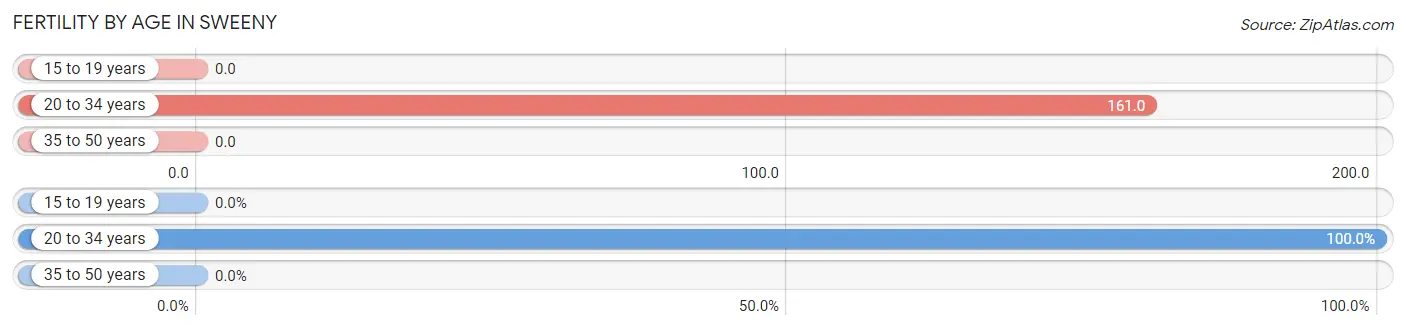
| Age Bracket | Women with Births | Births / 1,000 Women |
| 15 to 19 years | 0 (0.0%) | 0.0 |
| 20 to 34 years | 65 (100.0%) | 161.0 |
| 35 to 50 years | 0 (0.0%) | 0.0 |
| Total | 65 (100.0%) | 85.0 |
Fertility by Age by Marriage Status in Sweeny
47.7% of women with births (65) in Sweeny are married. The highest percentage of unmarried women with births falls into 20 to 34 years age bracket with 52.3% of them unmarried at the time of birth, while the lowest percentage of unmarried women with births belong to 20 to 34 years age bracket with 52.3% of them unmarried.
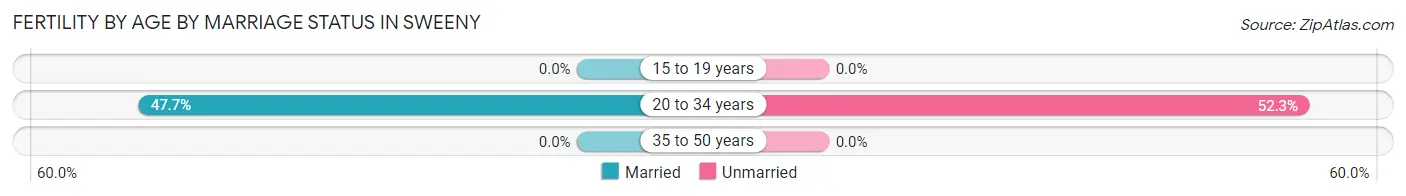
| Age Bracket | Married | Unmarried |
| 15 to 19 years | 0 (0.0%) | 0 (0.0%) |
| 20 to 34 years | 31 (47.7%) | 34 (52.3%) |
| 35 to 50 years | 0 (0.0%) | 0 (0.0%) |
| Total | 31 (47.7%) | 34 (52.3%) |
Fertility by Education in Sweeny
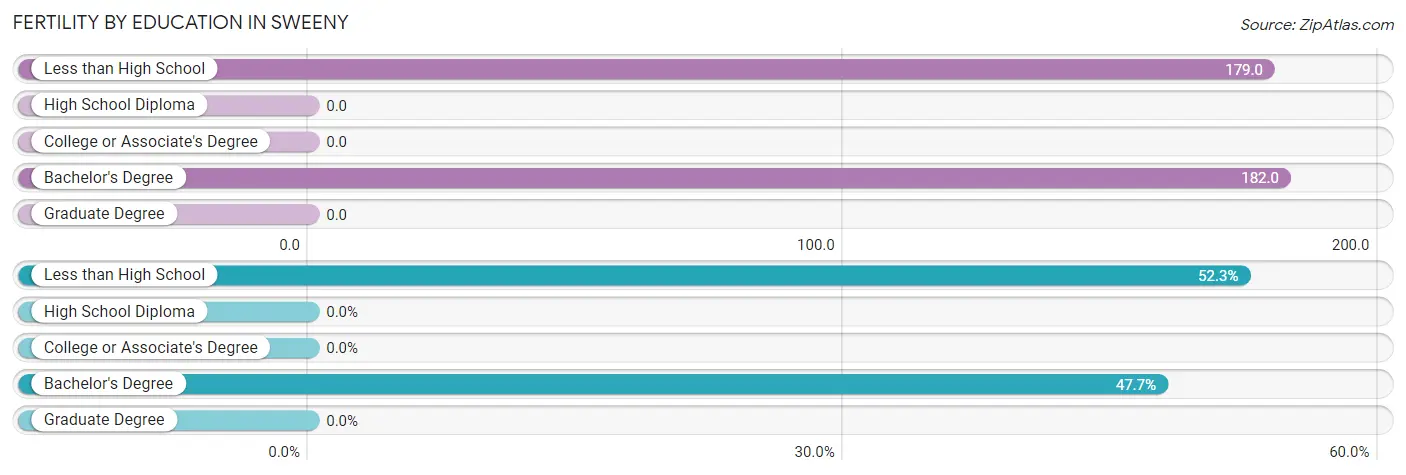
| Educational Attainment | Women with Births | Births / 1,000 Women |
| Less than High School | 34 (52.3%) | 179.0 |
| High School Diploma | 0 (0.0%) | 0.0 |
| College or Associate's Degree | 0 (0.0%) | 0.0 |
| Bachelor's Degree | 31 (47.7%) | 182.0 |
| Graduate Degree | 0 (0.0%) | 0.0 |
| Total | 65 (100.0%) | 85.0 |
Fertility by Education by Marriage Status in Sweeny
52.3% of women with births in Sweeny are unmarried. Women with the educational attainment of bachelor's degree are most likely to be married with 100.0% of them married at childbirth, while women with the educational attainment of less than high school are least likely to be married with 100.0% of them unmarried at childbirth.
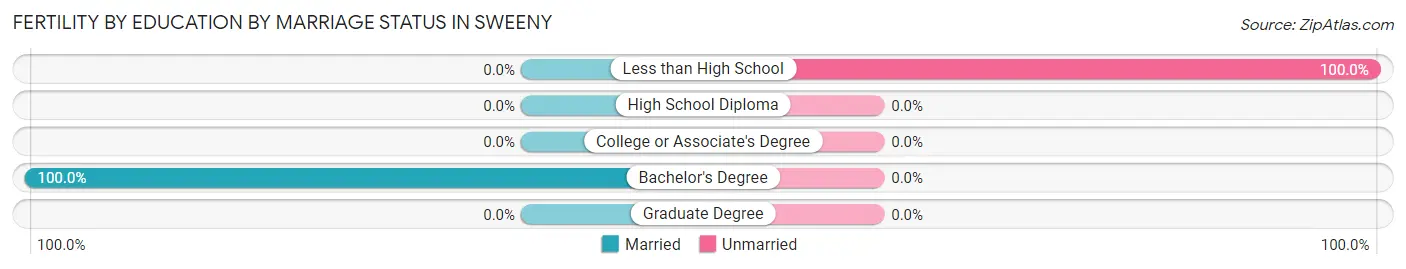
| Educational Attainment | Married | Unmarried |
| Less than High School | 0 (0.0%) | 34 (100.0%) |
| High School Diploma | 0 (0.0%) | 0 (0.0%) |
| College or Associate's Degree | 0 (0.0%) | 0 (0.0%) |
| Bachelor's Degree | 31 (100.0%) | 0 (0.0%) |
| Graduate Degree | 0 (0.0%) | 0 (0.0%) |
| Total | 31 (47.7%) | 34 (52.3%) |
Employment Characteristics in Sweeny
Employment by Class of Employer in Sweeny
Among the 1,418 employed individuals in Sweeny, private company employees (1,112 | 78.4%), not-for-profit organizations (159 | 11.2%), and local government employees (84 | 5.9%) make up the most common classes of employment.
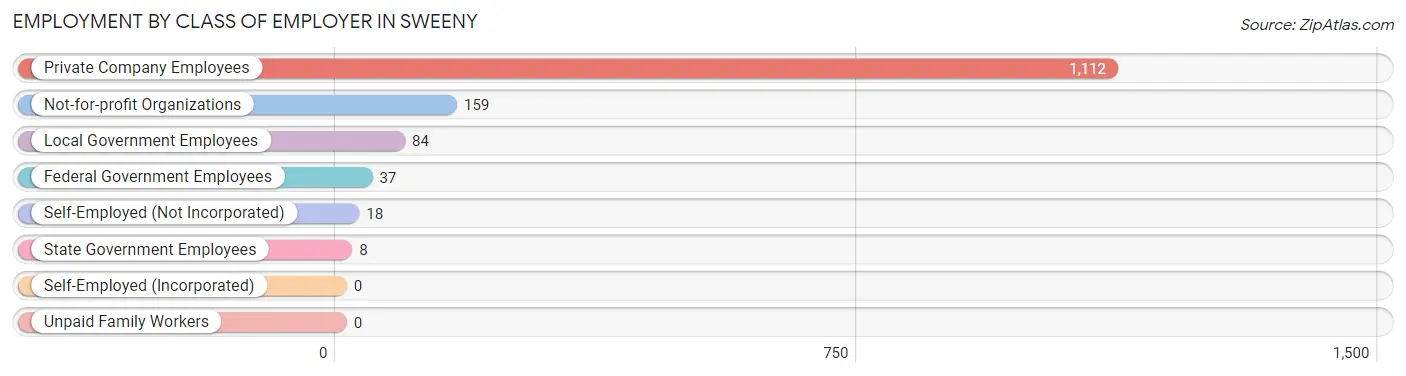
| Employer Class | # Employees | % Employees |
| Private Company Employees | 1,112 | 78.4% |
| Self-Employed (Incorporated) | 0 | 0.0% |
| Self-Employed (Not Incorporated) | 18 | 1.3% |
| Not-for-profit Organizations | 159 | 11.2% |
| Local Government Employees | 84 | 5.9% |
| State Government Employees | 8 | 0.6% |
| Federal Government Employees | 37 | 2.6% |
| Unpaid Family Workers | 0 | 0.0% |
| Total | 1,418 | 100.0% |
Employment Status by Age in Sweeny
According to the labor force statistics for Sweeny, out of the total population over 16 years of age (2,621), 56.9% or 1,491 individuals are in the labor force, with 5.1% or 76 of them unemployed. The age group with the highest labor force participation rate is 20 to 24 years, with 100.0% or 126 individuals in the labor force. Within the labor force, the 65 to 74 years age range has the highest percentage of unemployed individuals, with 42.3% or 22 of them being unemployed.
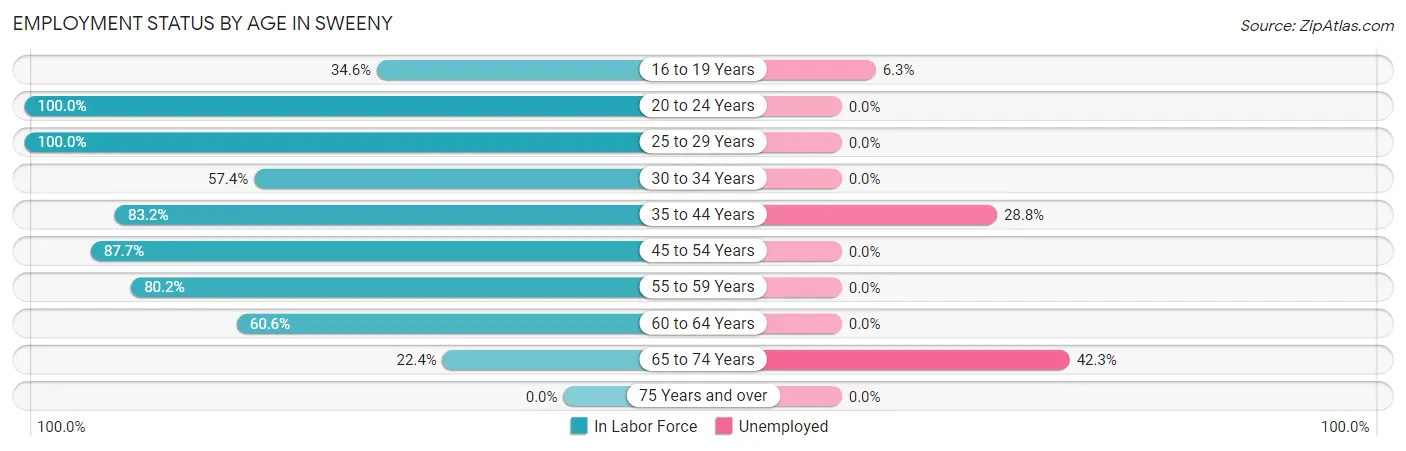
| Age Bracket | In Labor Force | Unemployed |
| 16 to 19 Years | 80 (34.6%) | 5 (6.3%) |
| 20 to 24 Years | 126 (100.0%) | 0 (0.0%) |
| 25 to 29 Years | 155 (100.0%) | 0 (0.0%) |
| 30 to 34 Years | 287 (57.4%) | 0 (0.0%) |
| 35 to 44 Years | 163 (83.2%) | 47 (28.8%) |
| 45 to 54 Years | 293 (87.7%) | 0 (0.0%) |
| 55 to 59 Years | 227 (80.2%) | 0 (0.0%) |
| 60 to 64 Years | 109 (60.6%) | 0 (0.0%) |
| 65 to 74 Years | 52 (22.4%) | 22 (42.3%) |
| 75 Years and over | 0 (0.0%) | 0 (0.0%) |
| Total | 1,491 (56.9%) | 76 (5.1%) |
Employment Status by Educational Attainment in Sweeny
According to labor force statistics for Sweeny, 74.9% of individuals (1,234) out of the total population between 25 and 64 years of age (1,648) are in the labor force, with 3.8% or 47 of them being unemployed. The group with the highest labor force participation rate are those with the educational attainment of college / associate degree, with 89.3% or 518 individuals in the labor force. Within the labor force, individuals with high school diploma education have the highest percentage of unemployment, with 11.8% or 47 of them being unemployed.
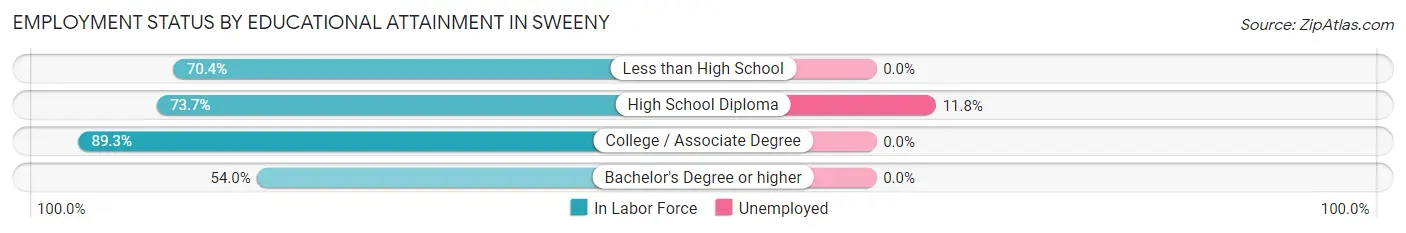
| Educational Attainment | In Labor Force | Unemployed |
| Less than High School | 143 (70.4%) | 0 (0.0%) |
| High School Diploma | 397 (73.7%) | 64 (11.8%) |
| College / Associate Degree | 518 (89.3%) | 0 (0.0%) |
| Bachelor's Degree or higher | 176 (54.0%) | 0 (0.0%) |
| Total | 1,234 (74.9%) | 63 (3.8%) |
Employment Occupations by Sex in Sweeny
Management, Business, Science and Arts Occupations
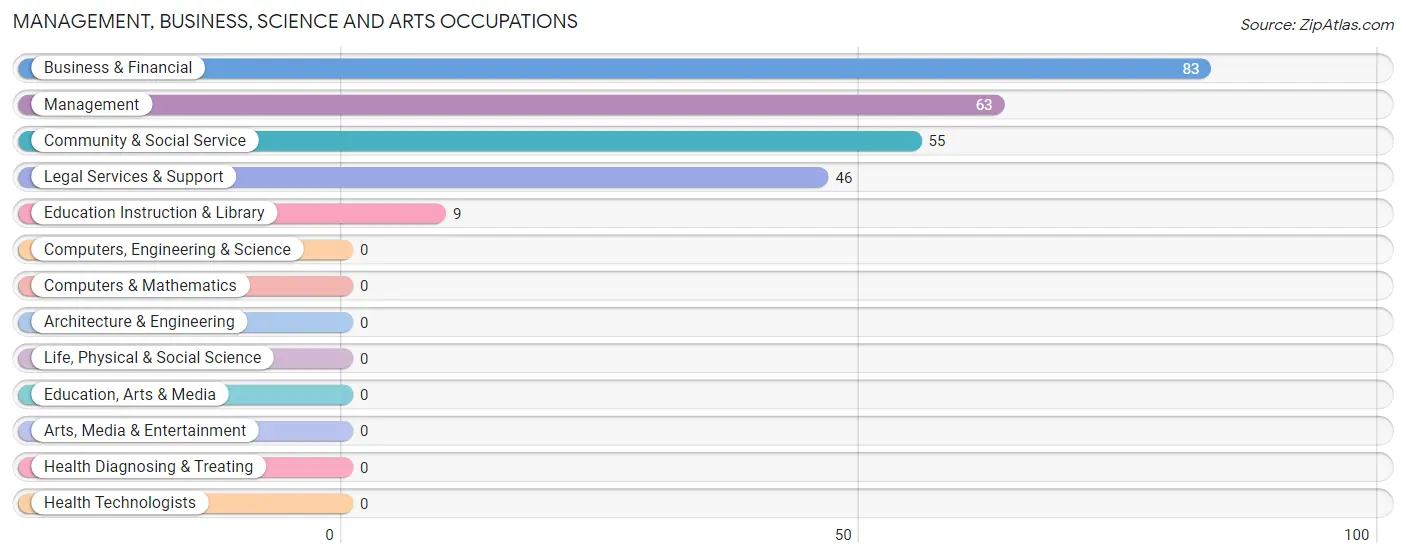
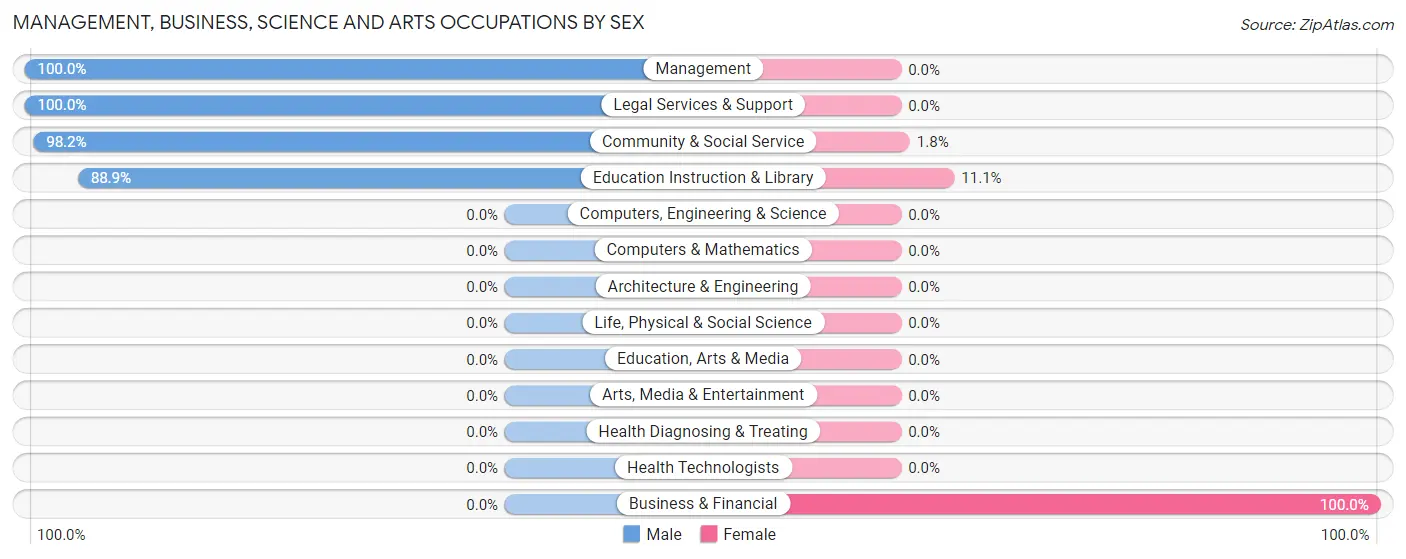
The most common Management, Business, Science and Arts occupations in Sweeny are Business & Financial (83 | 6.0%), Management (63 | 4.6%), Community & Social Service (55 | 4.0%), Legal Services & Support (46 | 3.3%), and Education Instruction & Library (9 | 0.6%).
Management, Business, Science and Arts Occupations by Sex
Within the Management, Business, Science and Arts occupations in Sweeny, the most male-oriented occupations are Management (100.0%), Legal Services & Support (100.0%), and Community & Social Service (98.2%), while the most female-oriented occupations are Business & Financial (100.0%), Education Instruction & Library (11.1%), and Community & Social Service (1.8%).
| Occupation | Male | Female |
| Management | 63 (100.0%) | 0 (0.0%) |
| Business & Financial | 0 (0.0%) | 83 (100.0%) |
| Computers, Engineering & Science | 0 (0.0%) | 0 (0.0%) |
| Computers & Mathematics | 0 (0.0%) | 0 (0.0%) |
| Architecture & Engineering | 0 (0.0%) | 0 (0.0%) |
| Life, Physical & Social Science | 0 (0.0%) | 0 (0.0%) |
| Community & Social Service | 54 (98.2%) | 1 (1.8%) |
| Education, Arts & Media | 0 (0.0%) | 0 (0.0%) |
| Legal Services & Support | 46 (100.0%) | 0 (0.0%) |
| Education Instruction & Library | 8 (88.9%) | 1 (11.1%) |
| Arts, Media & Entertainment | 0 (0.0%) | 0 (0.0%) |
| Health Diagnosing & Treating | 0 (0.0%) | 0 (0.0%) |
| Health Technologists | 0 (0.0%) | 0 (0.0%) |
| Total (Category) | 117 (58.2%) | 84 (41.8%) |
| Total (Overall) | 908 (65.7%) | 473 (34.3%) |
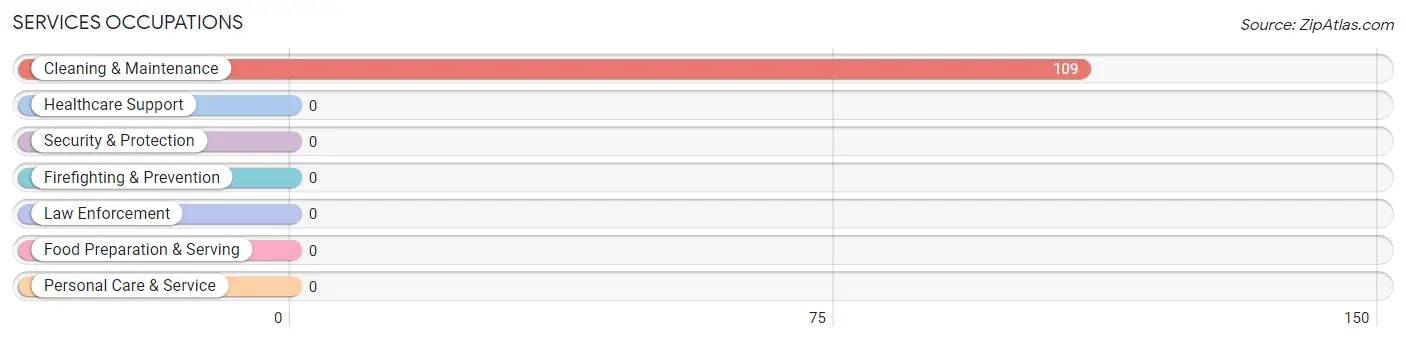
Services Occupations
The most common Services occupations in Sweeny are , and Cleaning & Maintenance (109 | 7.9%).
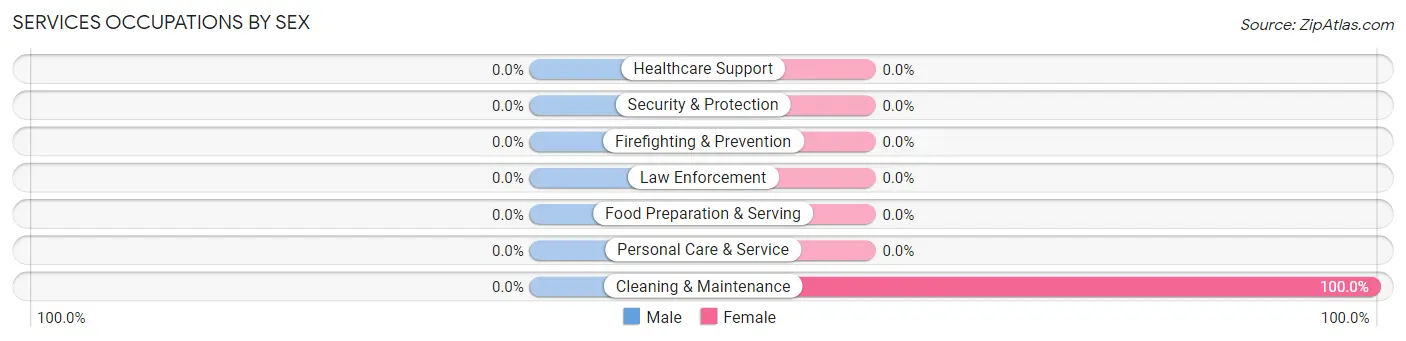
Services Occupations by Sex
| Occupation | Male | Female |
| Healthcare Support | 0 (0.0%) | 0 (0.0%) |
| Security & Protection | 0 (0.0%) | 0 (0.0%) |
| Firefighting & Prevention | 0 (0.0%) | 0 (0.0%) |
| Law Enforcement | 0 (0.0%) | 0 (0.0%) |
| Food Preparation & Serving | 0 (0.0%) | 0 (0.0%) |
| Cleaning & Maintenance | 0 (0.0%) | 109 (100.0%) |
| Personal Care & Service | 0 (0.0%) | 0 (0.0%) |
| Total (Category) | 0 (0.0%) | 109 (100.0%) |
| Total (Overall) | 908 (65.7%) | 473 (34.3%) |
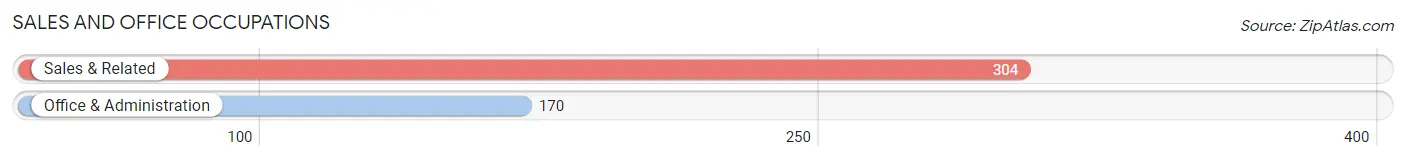
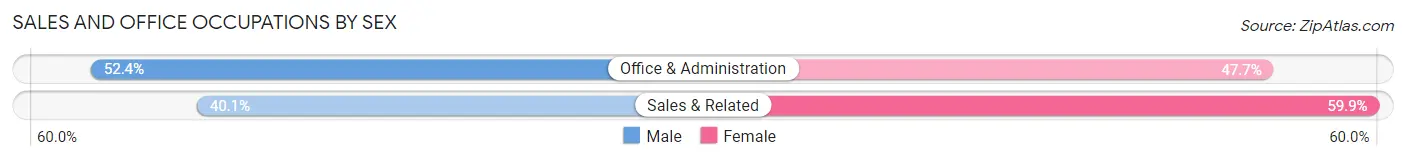
Sales and Office Occupations
The most common Sales and Office occupations in Sweeny are Sales & Related (304 | 22.0%), and Office & Administration (170 | 12.3%).
Sales and Office Occupations by Sex
| Occupation | Male | Female |
| Sales & Related | 122 (40.1%) | 182 (59.9%) |
| Office & Administration | 89 (52.3%) | 81 (47.6%) |
| Total (Category) | 211 (44.5%) | 263 (55.5%) |
| Total (Overall) | 908 (65.7%) | 473 (34.3%) |
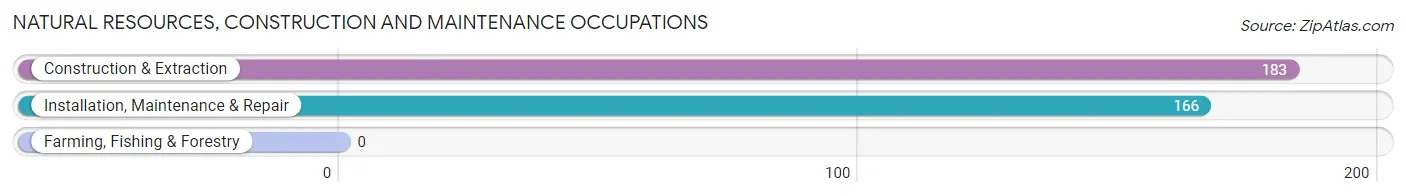
Natural Resources, Construction and Maintenance Occupations
The most common Natural Resources, Construction and Maintenance occupations in Sweeny are Construction & Extraction (183 | 13.3%), and Installation, Maintenance & Repair (166 | 12.0%).
Natural Resources, Construction and Maintenance Occupations by Sex
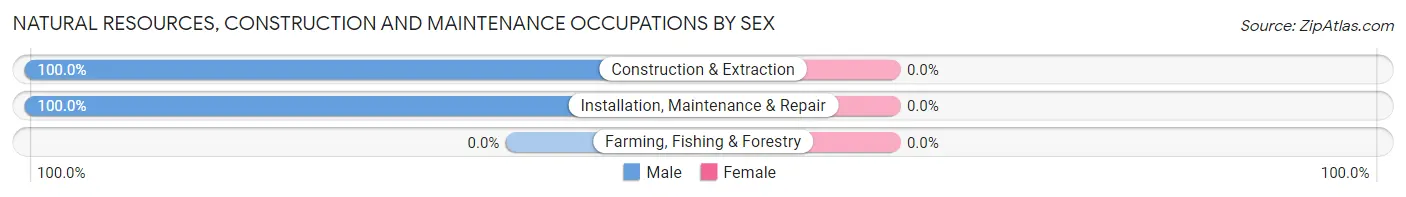
| Occupation | Male | Female |
| Farming, Fishing & Forestry | 0 (0.0%) | 0 (0.0%) |
| Construction & Extraction | 183 (100.0%) | 0 (0.0%) |
| Installation, Maintenance & Repair | 166 (100.0%) | 0 (0.0%) |
| Total (Category) | 349 (100.0%) | 0 (0.0%) |
| Total (Overall) | 908 (65.7%) | 473 (34.3%) |
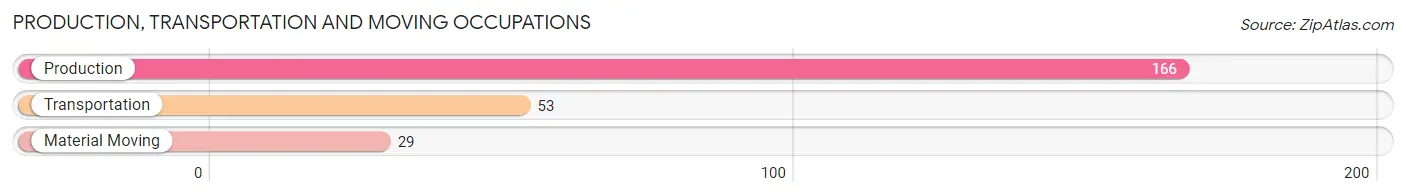
Production, Transportation and Moving Occupations
The most common Production, Transportation and Moving occupations in Sweeny are Production (166 | 12.0%), Transportation (53 | 3.8%), and Material Moving (29 | 2.1%).
Production, Transportation and Moving Occupations by Sex
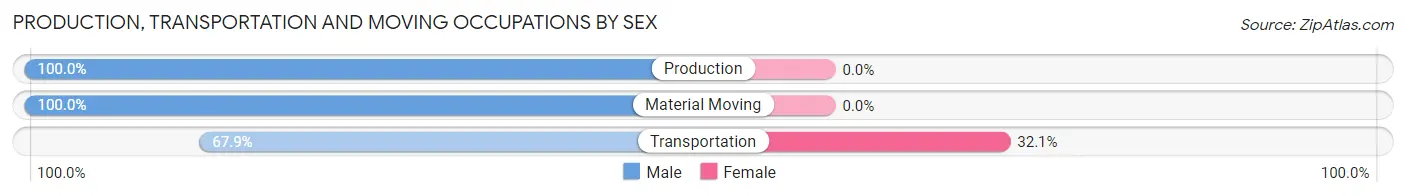
| Occupation | Male | Female |
| Production | 166 (100.0%) | 0 (0.0%) |
| Transportation | 36 (67.9%) | 17 (32.1%) |
| Material Moving | 29 (100.0%) | 0 (0.0%) |
| Total (Category) | 231 (93.1%) | 17 (6.9%) |
| Total (Overall) | 908 (65.7%) | 473 (34.3%) |
Employment Industries by Sex in Sweeny
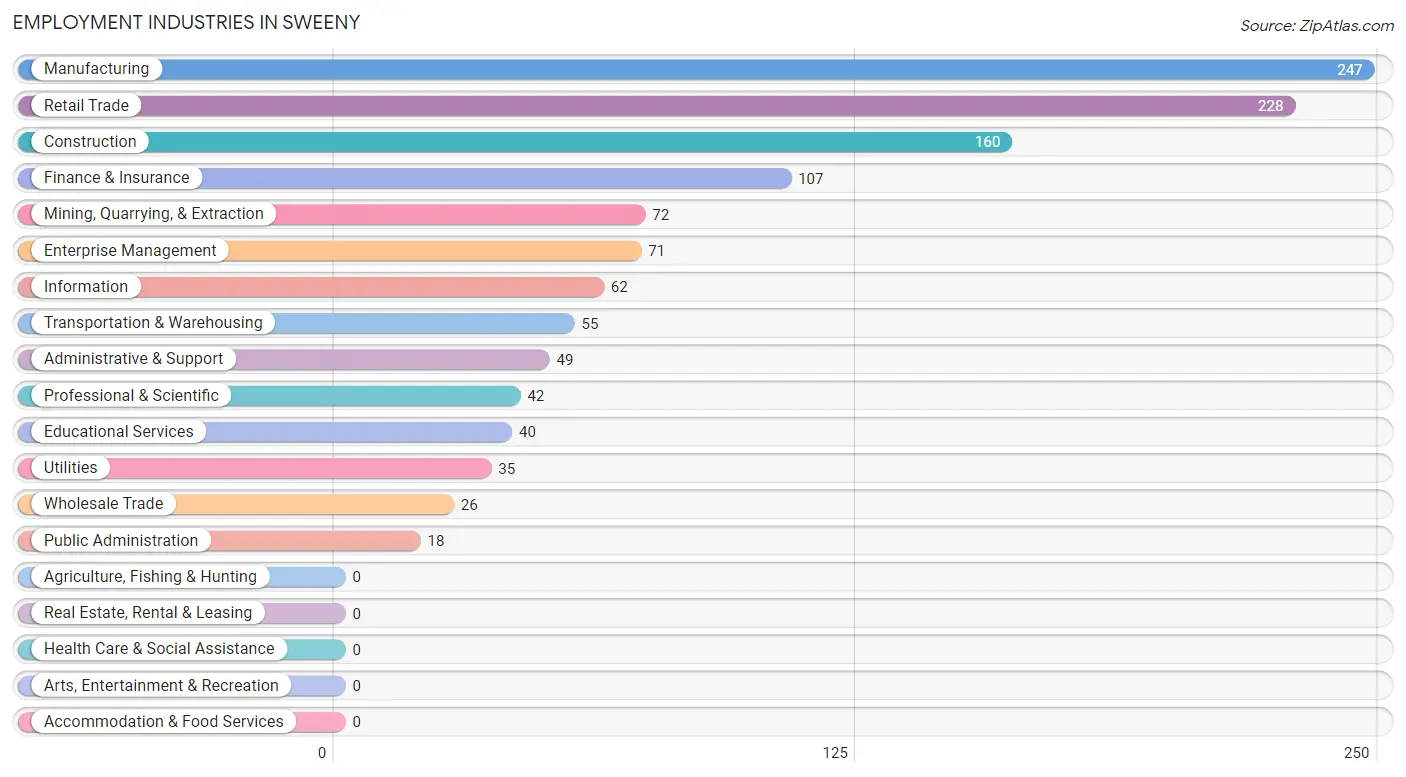
Employment Industries in Sweeny
The major employment industries in Sweeny include Manufacturing (247 | 17.9%), Retail Trade (228 | 16.5%), Construction (160 | 11.6%), Finance & Insurance (107 | 7.7%), and Mining, Quarrying, & Extraction (72 | 5.2%).
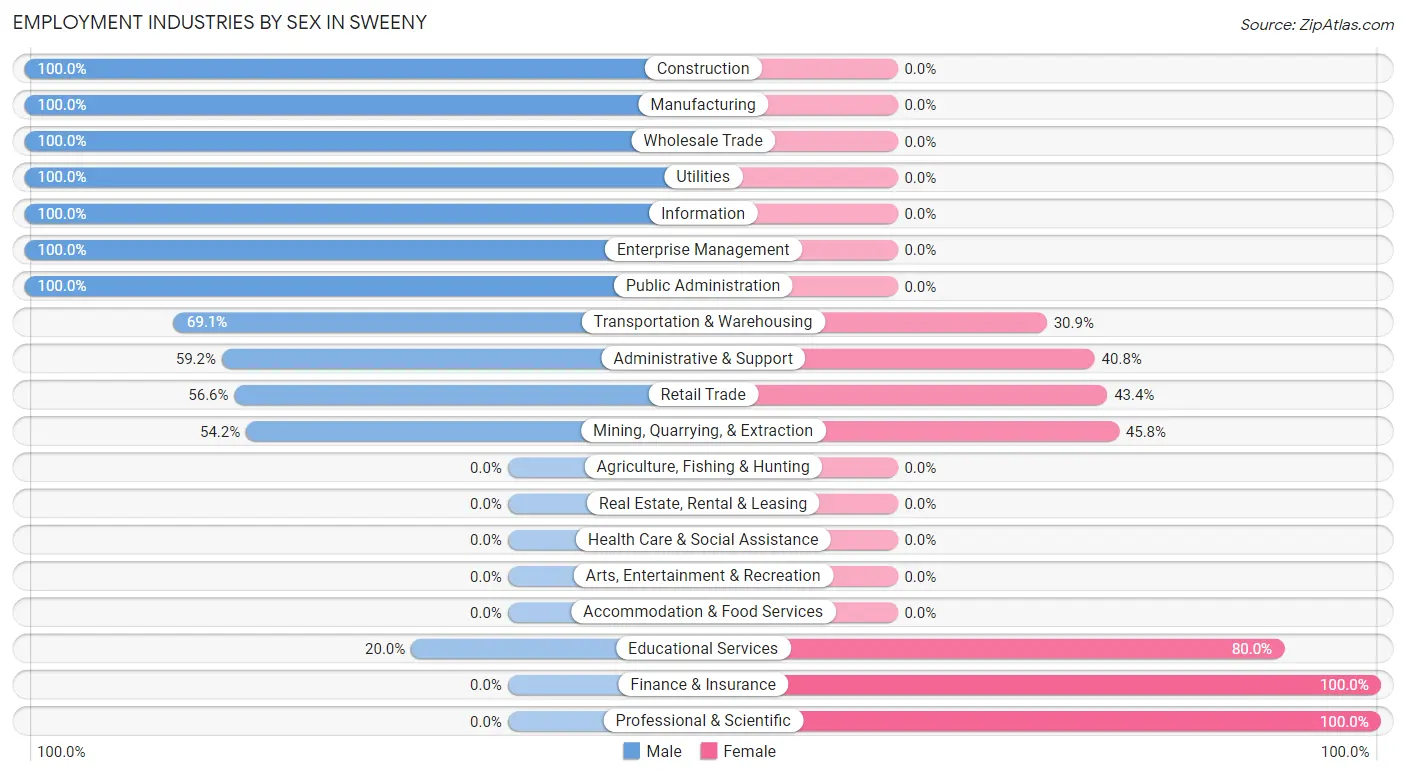
Employment Industries by Sex in Sweeny
The Sweeny industries that see more men than women are Construction (100.0%), Manufacturing (100.0%), and Wholesale Trade (100.0%), whereas the industries that tend to have a higher number of women are Finance & Insurance (100.0%), Professional & Scientific (100.0%), and Educational Services (80.0%).
| Industry | Male | Female |
| Agriculture, Fishing & Hunting | 0 (0.0%) | 0 (0.0%) |
| Mining, Quarrying, & Extraction | 39 (54.2%) | 33 (45.8%) |
| Construction | 160 (100.0%) | 0 (0.0%) |
| Manufacturing | 247 (100.0%) | 0 (0.0%) |
| Wholesale Trade | 26 (100.0%) | 0 (0.0%) |
| Retail Trade | 129 (56.6%) | 99 (43.4%) |
| Transportation & Warehousing | 38 (69.1%) | 17 (30.9%) |
| Utilities | 35 (100.0%) | 0 (0.0%) |
| Information | 62 (100.0%) | 0 (0.0%) |
| Finance & Insurance | 0 (0.0%) | 107 (100.0%) |
| Real Estate, Rental & Leasing | 0 (0.0%) | 0 (0.0%) |
| Professional & Scientific | 0 (0.0%) | 42 (100.0%) |
| Enterprise Management | 71 (100.0%) | 0 (0.0%) |
| Administrative & Support | 29 (59.2%) | 20 (40.8%) |
| Educational Services | 8 (20.0%) | 32 (80.0%) |
| Health Care & Social Assistance | 0 (0.0%) | 0 (0.0%) |
| Arts, Entertainment & Recreation | 0 (0.0%) | 0 (0.0%) |
| Accommodation & Food Services | 0 (0.0%) | 0 (0.0%) |
| Public Administration | 18 (100.0%) | 0 (0.0%) |
| Total | 908 (65.7%) | 473 (34.3%) |
Education in Sweeny
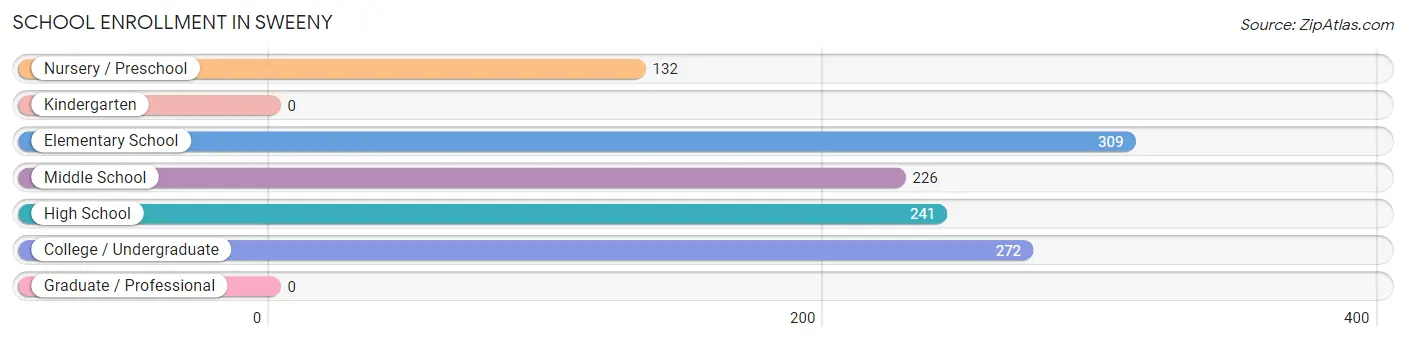
School Enrollment in Sweeny
The most common levels of schooling among the 1,180 students in Sweeny are elementary school (309 | 26.2%), college / undergraduate (272 | 23.1%), and high school (241 | 20.4%).
| School Level | # Students | % Students |
| Nursery / Preschool | 132 | 11.2% |
| Kindergarten | 0 | 0.0% |
| Elementary School | 309 | 26.2% |
| Middle School | 226 | 19.2% |
| High School | 241 | 20.4% |
| College / Undergraduate | 272 | 23.1% |
| Graduate / Professional | 0 | 0.0% |
| Total | 1,180 | 100.0% |
School Enrollment by Age by Funding Source in Sweeny
Out of a total of 1,180 students who are enrolled in schools in Sweeny, 238 (20.2%) attend a private institution, while the remaining 942 (79.8%) are enrolled in public schools. The age group of 3 to 4 year olds has the highest likelihood of being enrolled in private schools, with 31 (100.0% in the age bracket) enrolled. Conversely, the age group of 10 to 14 year olds has the lowest likelihood of being enrolled in a private school, with 358 (100.0% in the age bracket) attending a public institution.
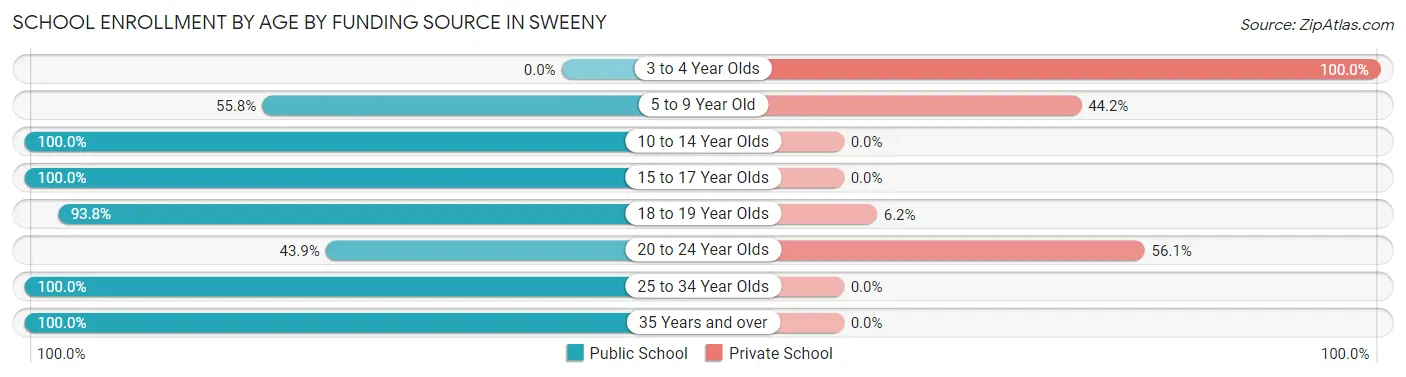
| Age Bracket | Public School | Private School |
| 3 to 4 Year Olds | 0 (0.0%) | 31 (100.0%) |
| 5 to 9 Year Old | 208 (55.8%) | 165 (44.2%) |
| 10 to 14 Year Olds | 358 (100.0%) | 0 (0.0%) |
| 15 to 17 Year Olds | 161 (100.0%) | 0 (0.0%) |
| 18 to 19 Year Olds | 76 (93.8%) | 5 (6.2%) |
| 20 to 24 Year Olds | 29 (43.9%) | 37 (56.1%) |
| 25 to 34 Year Olds | 14 (100.0%) | 0 (0.0%) |
| 35 Years and over | 96 (100.0%) | 0 (0.0%) |
| Total | 942 (79.8%) | 238 (20.2%) |
Educational Attainment by Field of Study in Sweeny
Business (134 | 22.1%), engineering (117 | 19.3%), computers & mathematics (64 | 10.6%), science & technology (64 | 10.6%), and education (51 | 8.4%) are the most common fields of study among 606 individuals in Sweeny who have obtained a bachelor's degree or higher.
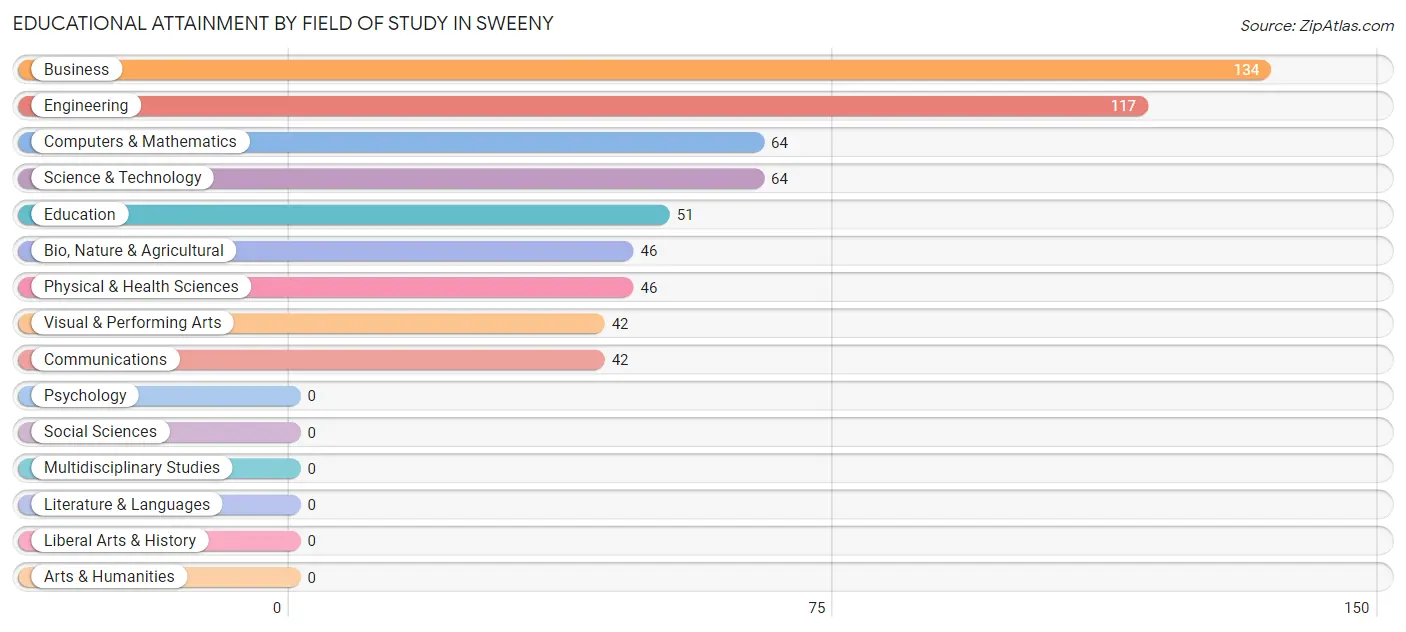
| Field of Study | # Graduates | % Graduates |
| Computers & Mathematics | 64 | 10.6% |
| Bio, Nature & Agricultural | 46 | 7.6% |
| Physical & Health Sciences | 46 | 7.6% |
| Psychology | 0 | 0.0% |
| Social Sciences | 0 | 0.0% |
| Engineering | 117 | 19.3% |
| Multidisciplinary Studies | 0 | 0.0% |
| Science & Technology | 64 | 10.6% |
| Business | 134 | 22.1% |
| Education | 51 | 8.4% |
| Literature & Languages | 0 | 0.0% |
| Liberal Arts & History | 0 | 0.0% |
| Visual & Performing Arts | 42 | 6.9% |
| Communications | 42 | 6.9% |
| Arts & Humanities | 0 | 0.0% |
| Total | 606 | 100.0% |
Transportation & Commute in Sweeny
Vehicle Availability by Sex in Sweeny
The most prevalent vehicle ownership categories in Sweeny are males with 2 vehicles (315, accounting for 35.0%) and females with 2 vehicles (150, making up 61.9%).
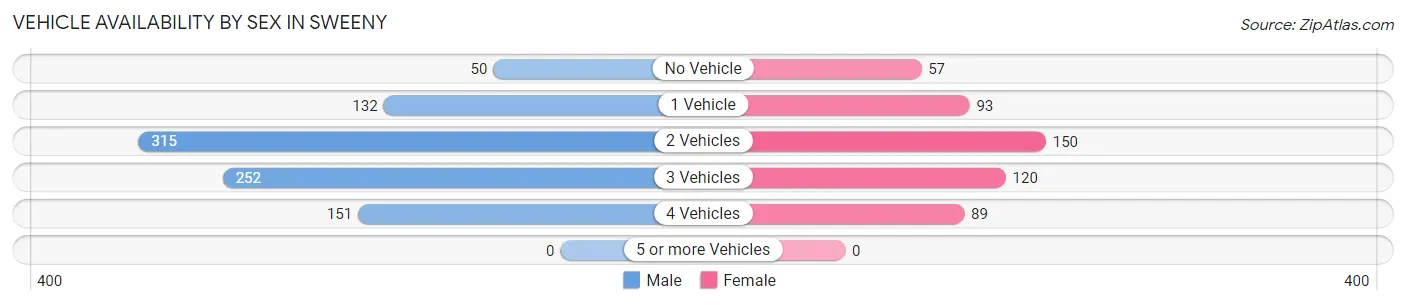
| Vehicles Available | Male | Female |
| No Vehicle | 50 (5.6%) | 57 (11.2%) |
| 1 Vehicle | 132 (14.7%) | 93 (18.3%) |
| 2 Vehicles | 315 (35.0%) | 150 (29.5%) |
| 3 Vehicles | 252 (28.0%) | 120 (23.6%) |
| 4 Vehicles | 151 (16.8%) | 89 (17.5%) |
| 5 or more Vehicles | 0 (0.0%) | 0 (0.0%) |
| Total | 900 (100.0%) | 509 (100.0%) |
Commute Time in Sweeny
The most frequently occuring commute durations in Sweeny are 30 to 34 minutes (249 commuters, 21.0%), 10 to 14 minutes (199 commuters, 16.8%), and 20 to 24 minutes (176 commuters, 14.8%).
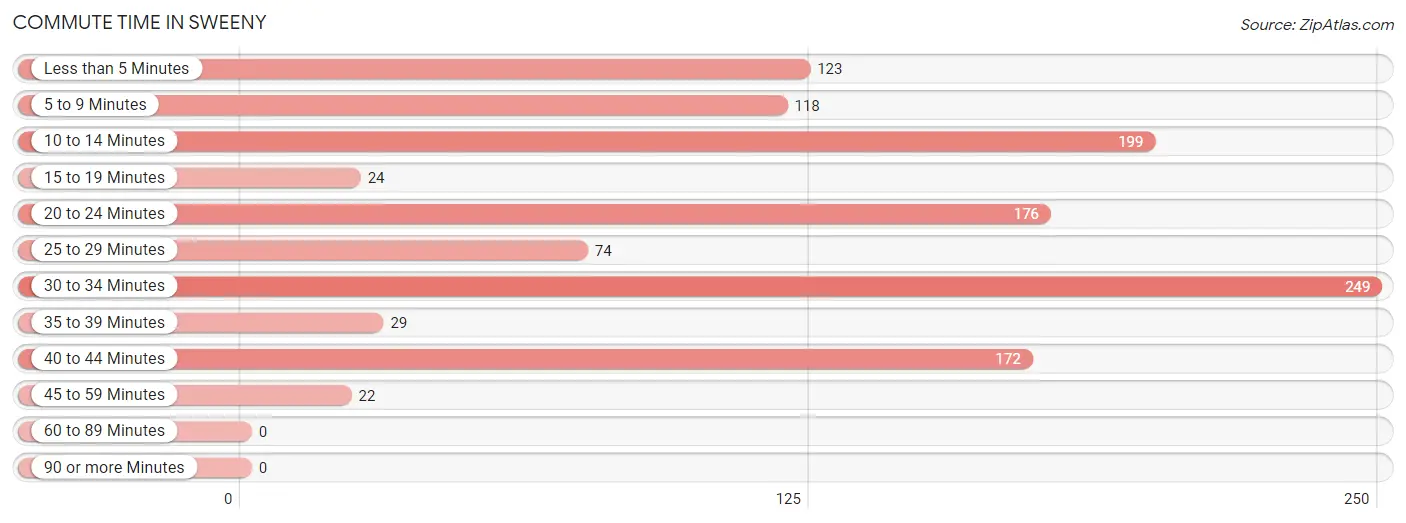
| Commute Time | # Commuters | % Commuters |
| Less than 5 Minutes | 123 | 10.4% |
| 5 to 9 Minutes | 118 | 10.0% |
| 10 to 14 Minutes | 199 | 16.8% |
| 15 to 19 Minutes | 24 | 2.0% |
| 20 to 24 Minutes | 176 | 14.8% |
| 25 to 29 Minutes | 74 | 6.2% |
| 30 to 34 Minutes | 249 | 21.0% |
| 35 to 39 Minutes | 29 | 2.5% |
| 40 to 44 Minutes | 172 | 14.5% |
| 45 to 59 Minutes | 22 | 1.8% |
| 60 to 89 Minutes | 0 | 0.0% |
| 90 or more Minutes | 0 | 0.0% |
Commute Time by Sex in Sweeny
The most common commute times in Sweeny are 30 to 34 minutes (173 commuters, 23.5%) for males and less than 5 minutes (123 commuters, 27.4%) for females.
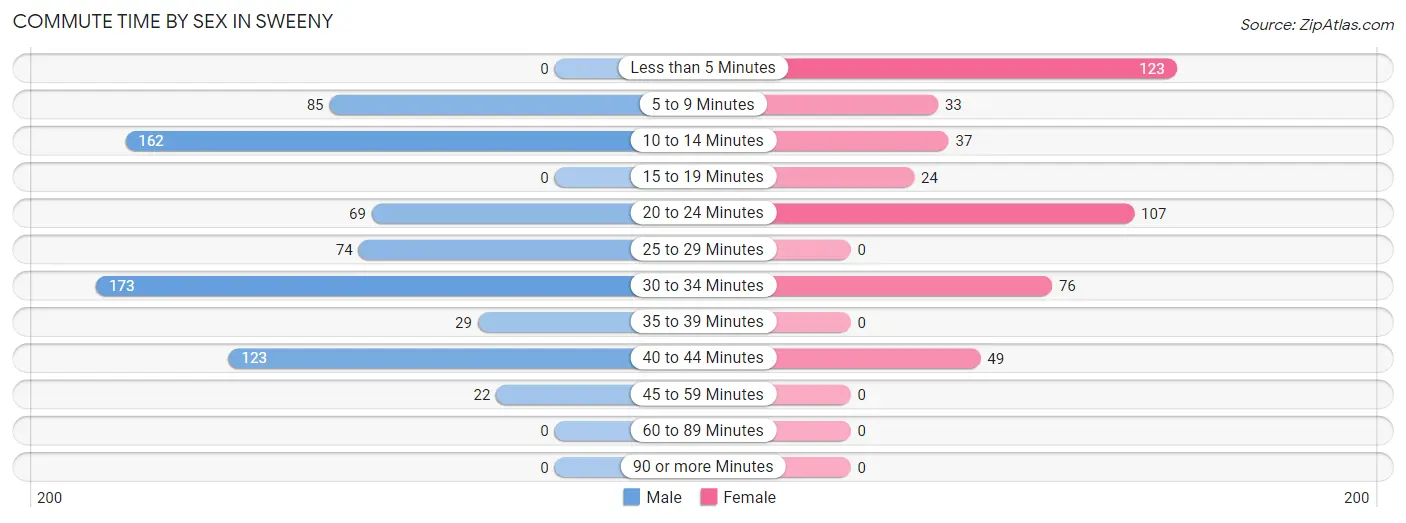
| Commute Time | Male | Female |
| Less than 5 Minutes | 0 (0.0%) | 123 (27.4%) |
| 5 to 9 Minutes | 85 (11.5%) | 33 (7.3%) |
| 10 to 14 Minutes | 162 (22.0%) | 37 (8.2%) |
| 15 to 19 Minutes | 0 (0.0%) | 24 (5.3%) |
| 20 to 24 Minutes | 69 (9.4%) | 107 (23.8%) |
| 25 to 29 Minutes | 74 (10.0%) | 0 (0.0%) |
| 30 to 34 Minutes | 173 (23.5%) | 76 (16.9%) |
| 35 to 39 Minutes | 29 (3.9%) | 0 (0.0%) |
| 40 to 44 Minutes | 123 (16.7%) | 49 (10.9%) |
| 45 to 59 Minutes | 22 (3.0%) | 0 (0.0%) |
| 60 to 89 Minutes | 0 (0.0%) | 0 (0.0%) |
| 90 or more Minutes | 0 (0.0%) | 0 (0.0%) |
Time of Departure to Work by Sex in Sweeny
The most frequent times of departure to work in Sweeny are 5:00 AM to 5:29 AM (191, 25.9%) for males and 7:00 AM to 7:29 AM (140, 31.2%) for females.
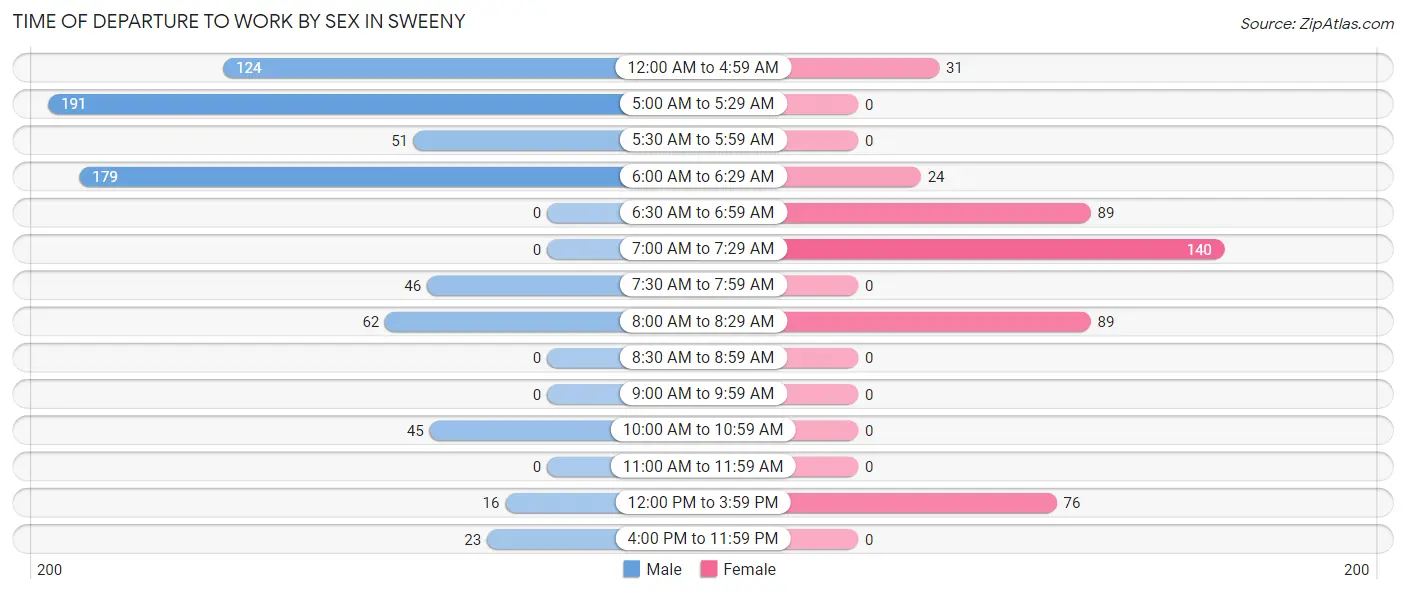
| Time of Departure | Male | Female |
| 12:00 AM to 4:59 AM | 124 (16.8%) | 31 (6.9%) |
| 5:00 AM to 5:29 AM | 191 (25.9%) | 0 (0.0%) |
| 5:30 AM to 5:59 AM | 51 (6.9%) | 0 (0.0%) |
| 6:00 AM to 6:29 AM | 179 (24.3%) | 24 (5.3%) |
| 6:30 AM to 6:59 AM | 0 (0.0%) | 89 (19.8%) |
| 7:00 AM to 7:29 AM | 0 (0.0%) | 140 (31.2%) |
| 7:30 AM to 7:59 AM | 46 (6.2%) | 0 (0.0%) |
| 8:00 AM to 8:29 AM | 62 (8.4%) | 89 (19.8%) |
| 8:30 AM to 8:59 AM | 0 (0.0%) | 0 (0.0%) |
| 9:00 AM to 9:59 AM | 0 (0.0%) | 0 (0.0%) |
| 10:00 AM to 10:59 AM | 45 (6.1%) | 0 (0.0%) |
| 11:00 AM to 11:59 AM | 0 (0.0%) | 0 (0.0%) |
| 12:00 PM to 3:59 PM | 16 (2.2%) | 76 (16.9%) |
| 4:00 PM to 11:59 PM | 23 (3.1%) | 0 (0.0%) |
| Total | 737 (100.0%) | 449 (100.0%) |
Housing Occupancy in Sweeny
Occupancy by Ownership in Sweeny
Of the total 1,357 dwellings in Sweeny, owner-occupied units account for 940 (69.3%), while renter-occupied units make up 417 (30.7%).
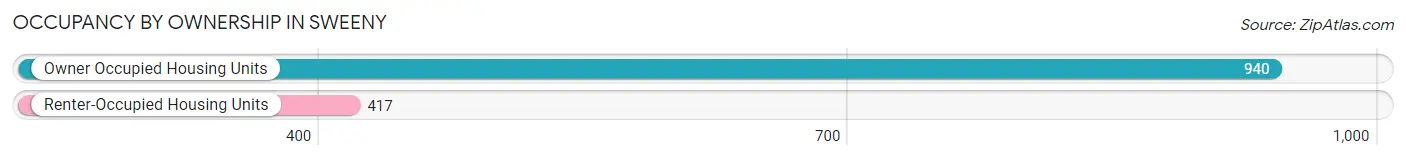
| Occupancy | # Housing Units | % Housing Units |
| Owner Occupied Housing Units | 940 | 69.3% |
| Renter-Occupied Housing Units | 417 | 30.7% |
| Total Occupied Housing Units | 1,357 | 100.0% |
Occupancy by Household Size in Sweeny
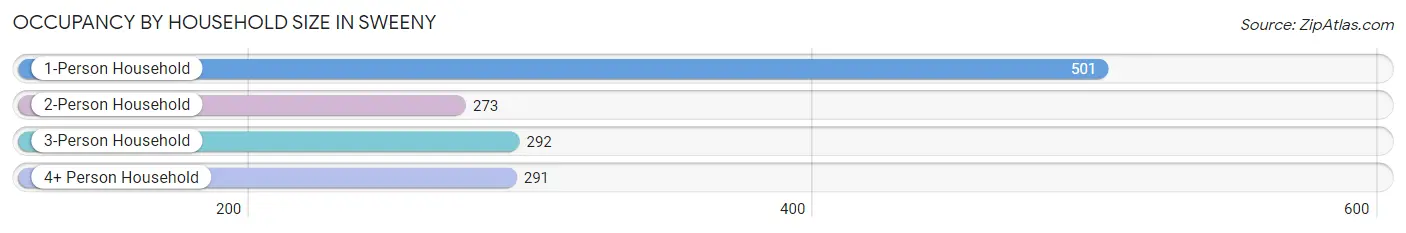
| Household Size | # Housing Units | % Housing Units |
| 1-Person Household | 501 | 36.9% |
| 2-Person Household | 273 | 20.1% |
| 3-Person Household | 292 | 21.5% |
| 4+ Person Household | 291 | 21.4% |
| Total Housing Units | 1,357 | 100.0% |
Occupancy by Ownership by Household Size in Sweeny
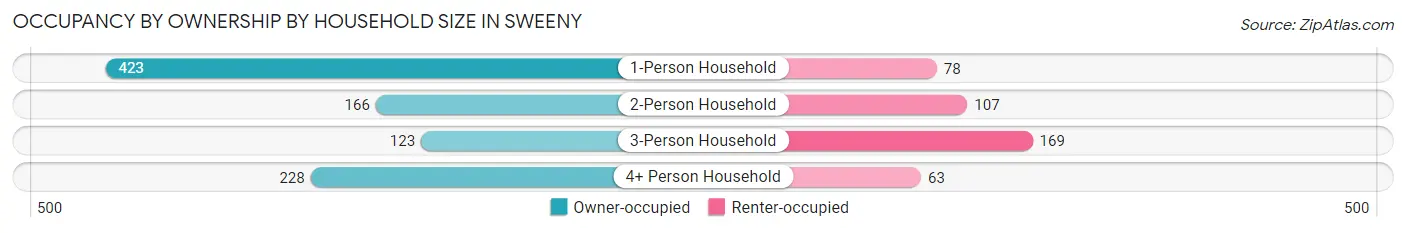
| Household Size | Owner-occupied | Renter-occupied |
| 1-Person Household | 423 (84.4%) | 78 (15.6%) |
| 2-Person Household | 166 (60.8%) | 107 (39.2%) |
| 3-Person Household | 123 (42.1%) | 169 (57.9%) |
| 4+ Person Household | 228 (78.3%) | 63 (21.6%) |
| Total Housing Units | 940 (69.3%) | 417 (30.7%) |
Occupancy by Educational Attainment in Sweeny
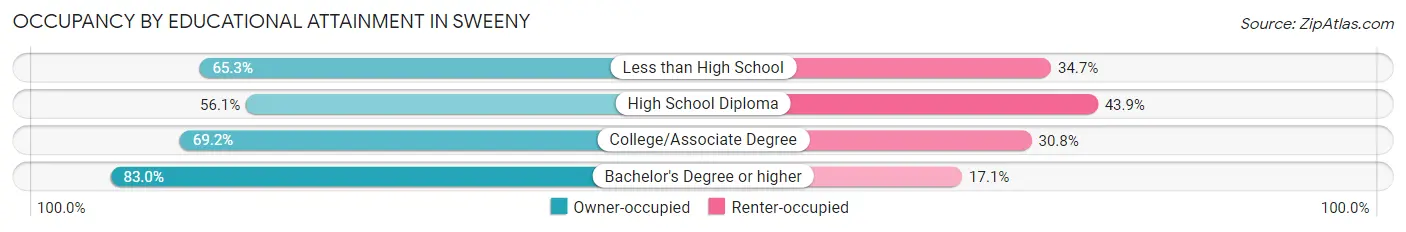
| Household Size | Owner-occupied | Renter-occupied |
| Less than High School | 145 (65.3%) | 77 (34.7%) |
| High School Diploma | 166 (56.1%) | 130 (43.9%) |
| College/Associate Degree | 337 (69.2%) | 150 (30.8%) |
| Bachelor's Degree or higher | 292 (83.0%) | 60 (17.1%) |
Occupancy by Age of Householder in Sweeny
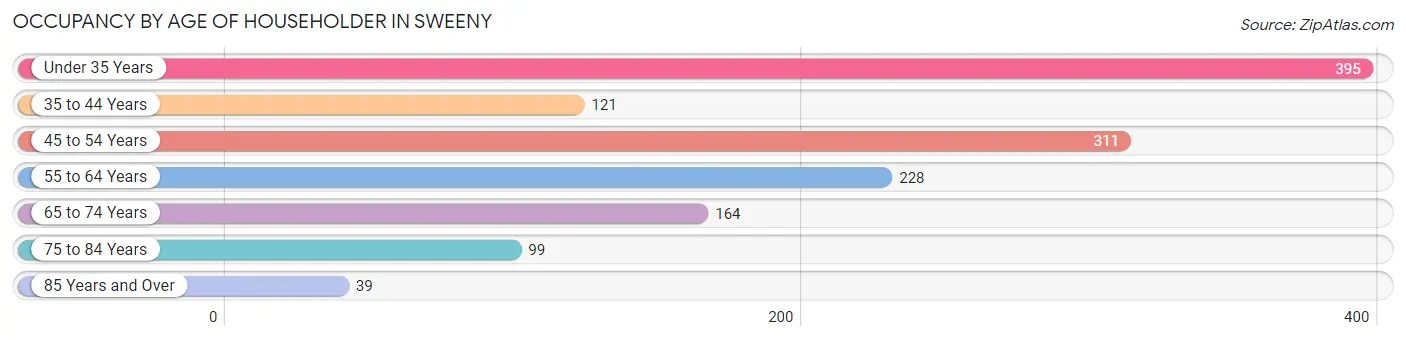
| Age Bracket | # Households | % Households |
| Under 35 Years | 395 | 29.1% |
| 35 to 44 Years | 121 | 8.9% |
| 45 to 54 Years | 311 | 22.9% |
| 55 to 64 Years | 228 | 16.8% |
| 65 to 74 Years | 164 | 12.1% |
| 75 to 84 Years | 99 | 7.3% |
| 85 Years and Over | 39 | 2.9% |
| Total | 1,357 | 100.0% |
Housing Finances in Sweeny
Median Income by Occupancy in Sweeny
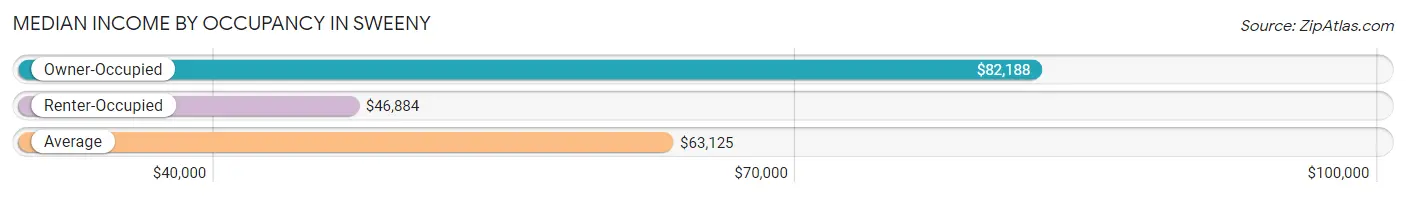
| Occupancy Type | # Households | Median Income |
| Owner-Occupied | 940 (69.3%) | $82,188 |
| Renter-Occupied | 417 (30.7%) | $46,884 |
| Average | 1,357 (100.0%) | $63,125 |
Occupancy by Householder Income Bracket in Sweeny
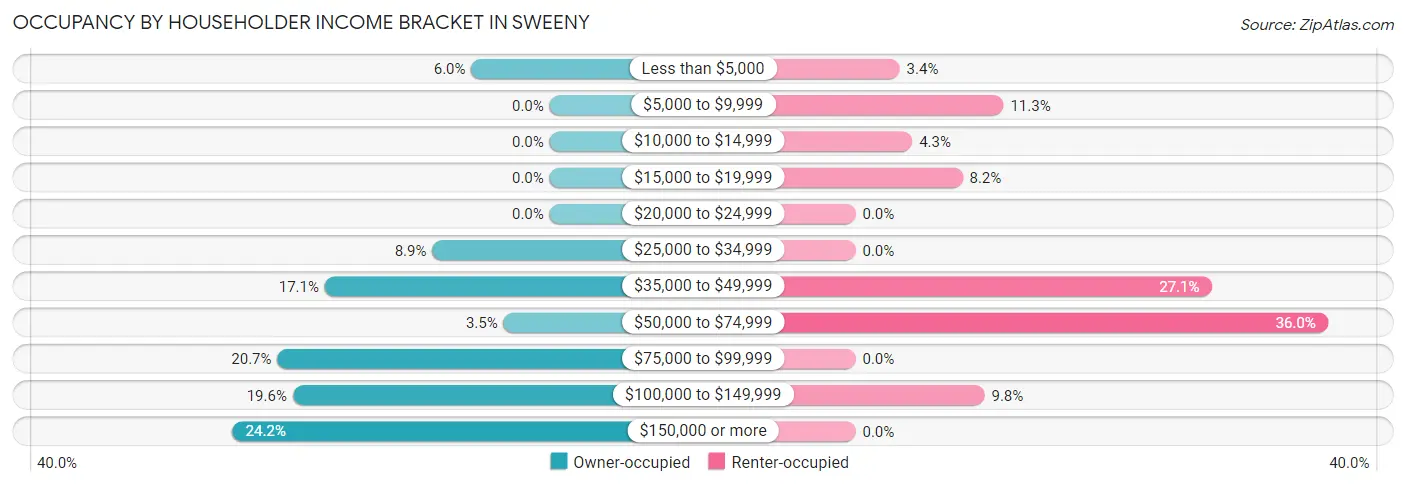
| Income Bracket | Owner-occupied | Renter-occupied |
| Less than $5,000 | 56 (6.0%) | 14 (3.4%) |
| $5,000 to $9,999 | 0 (0.0%) | 47 (11.3%) |
| $10,000 to $14,999 | 0 (0.0%) | 18 (4.3%) |
| $15,000 to $19,999 | 0 (0.0%) | 34 (8.2%) |
| $20,000 to $24,999 | 0 (0.0%) | 0 (0.0%) |
| $25,000 to $34,999 | 84 (8.9%) | 0 (0.0%) |
| $35,000 to $49,999 | 161 (17.1%) | 113 (27.1%) |
| $50,000 to $74,999 | 33 (3.5%) | 150 (36.0%) |
| $75,000 to $99,999 | 195 (20.7%) | 0 (0.0%) |
| $100,000 to $149,999 | 184 (19.6%) | 41 (9.8%) |
| $150,000 or more | 227 (24.1%) | 0 (0.0%) |
| Total | 940 (100.0%) | 417 (100.0%) |
Monthly Housing Cost Tiers in Sweeny
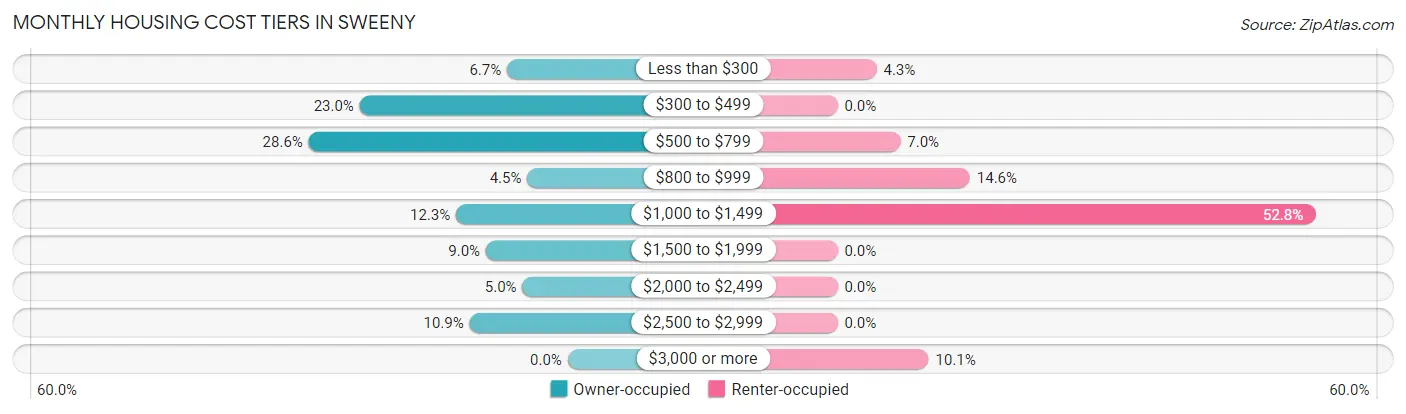
| Monthly Cost | Owner-occupied | Renter-occupied |
| Less than $300 | 63 (6.7%) | 18 (4.3%) |
| $300 to $499 | 216 (23.0%) | 0 (0.0%) |
| $500 to $799 | 269 (28.6%) | 29 (7.0%) |
| $800 to $999 | 42 (4.5%) | 61 (14.6%) |
| $1,000 to $1,499 | 116 (12.3%) | 220 (52.8%) |
| $1,500 to $1,999 | 85 (9.0%) | 0 (0.0%) |
| $2,000 to $2,499 | 47 (5.0%) | 0 (0.0%) |
| $2,500 to $2,999 | 102 (10.8%) | 0 (0.0%) |
| $3,000 or more | 0 (0.0%) | 42 (10.1%) |
| Total | 940 (100.0%) | 417 (100.0%) |
Physical Housing Characteristics in Sweeny
Housing Structures in Sweeny
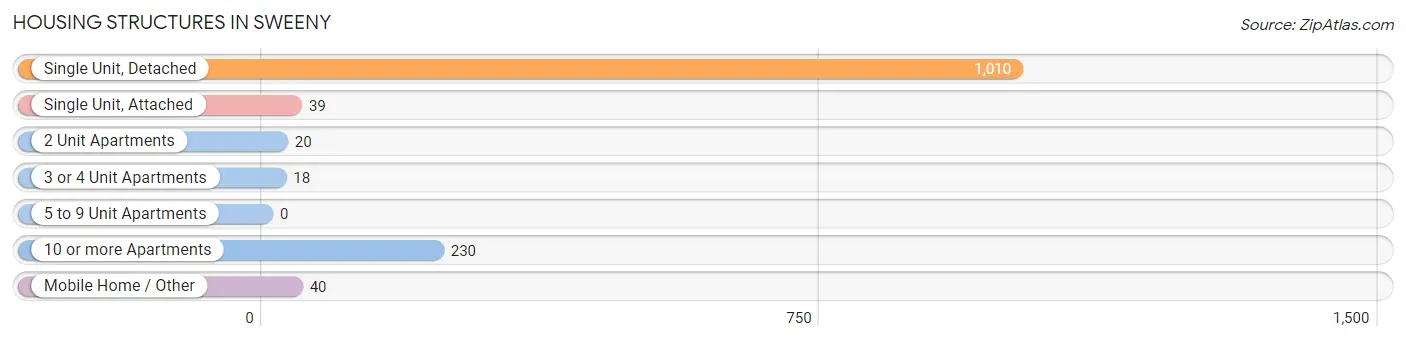
| Structure Type | # Housing Units | % Housing Units |
| Single Unit, Detached | 1,010 | 74.4% |
| Single Unit, Attached | 39 | 2.9% |
| 2 Unit Apartments | 20 | 1.5% |
| 3 or 4 Unit Apartments | 18 | 1.3% |
| 5 to 9 Unit Apartments | 0 | 0.0% |
| 10 or more Apartments | 230 | 17.0% |
| Mobile Home / Other | 40 | 2.9% |
| Total | 1,357 | 100.0% |
Housing Structures by Occupancy in Sweeny
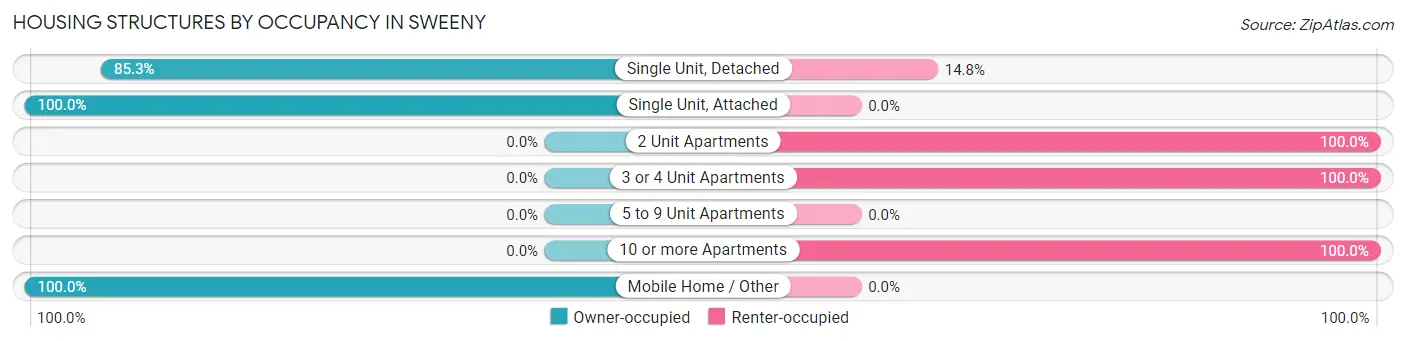
| Structure Type | Owner-occupied | Renter-occupied |
| Single Unit, Detached | 861 (85.3%) | 149 (14.7%) |
| Single Unit, Attached | 39 (100.0%) | 0 (0.0%) |
| 2 Unit Apartments | 0 (0.0%) | 20 (100.0%) |
| 3 or 4 Unit Apartments | 0 (0.0%) | 18 (100.0%) |
| 5 to 9 Unit Apartments | 0 (0.0%) | 0 (0.0%) |
| 10 or more Apartments | 0 (0.0%) | 230 (100.0%) |
| Mobile Home / Other | 40 (100.0%) | 0 (0.0%) |
| Total | 940 (69.3%) | 417 (30.7%) |
Housing Structures by Number of Rooms in Sweeny
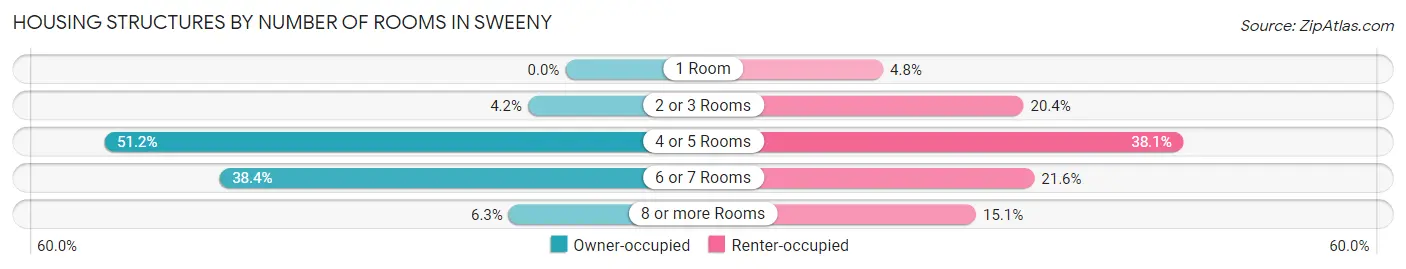
| Number of Rooms | Owner-occupied | Renter-occupied |
| 1 Room | 0 (0.0%) | 20 (4.8%) |
| 2 or 3 Rooms | 39 (4.2%) | 85 (20.4%) |
| 4 or 5 Rooms | 481 (51.2%) | 159 (38.1%) |
| 6 or 7 Rooms | 361 (38.4%) | 90 (21.6%) |
| 8 or more Rooms | 59 (6.3%) | 63 (15.1%) |
| Total | 940 (100.0%) | 417 (100.0%) |
Housing Structure by Heating Type in Sweeny
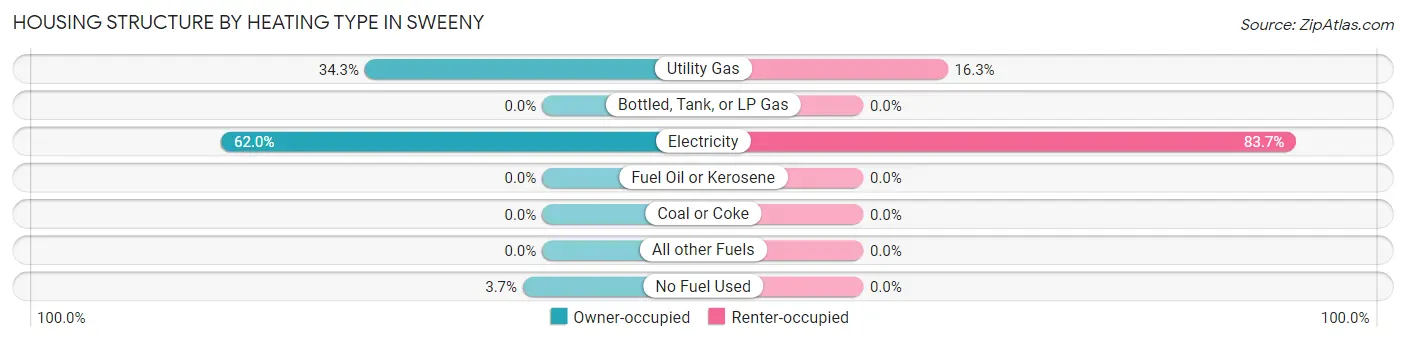
| Heating Type | Owner-occupied | Renter-occupied |
| Utility Gas | 322 (34.3%) | 68 (16.3%) |
| Bottled, Tank, or LP Gas | 0 (0.0%) | 0 (0.0%) |
| Electricity | 583 (62.0%) | 349 (83.7%) |
| Fuel Oil or Kerosene | 0 (0.0%) | 0 (0.0%) |
| Coal or Coke | 0 (0.0%) | 0 (0.0%) |
| All other Fuels | 0 (0.0%) | 0 (0.0%) |
| No Fuel Used | 35 (3.7%) | 0 (0.0%) |
| Total | 940 (100.0%) | 417 (100.0%) |
Household Vehicle Usage in Sweeny
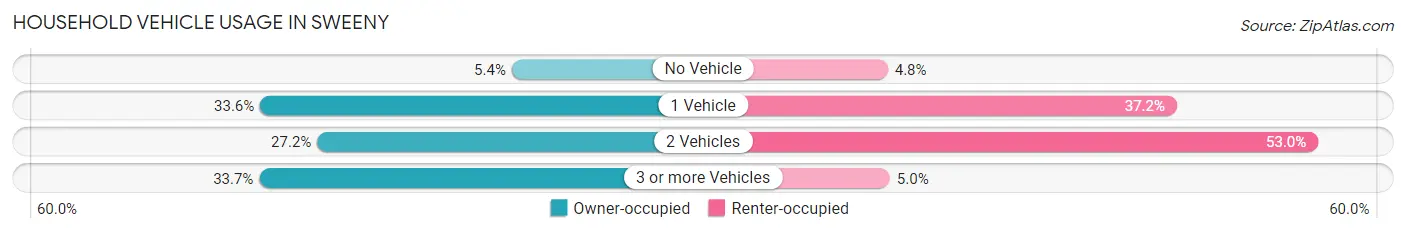
| Vehicles per Household | Owner-occupied | Renter-occupied |
| No Vehicle | 51 (5.4%) | 20 (4.8%) |
| 1 Vehicle | 316 (33.6%) | 155 (37.2%) |
| 2 Vehicles | 256 (27.2%) | 221 (53.0%) |
| 3 or more Vehicles | 317 (33.7%) | 21 (5.0%) |
| Total | 940 (100.0%) | 417 (100.0%) |
Real Estate & Mortgages in Sweeny
Real Estate and Mortgage Overview in Sweeny
| Characteristic | Without Mortgage | With Mortgage |
| Housing Units | 487 | 453 |
| Median Property Value | $131,600 | $172,300 |
| Median Household Income | - | - |
| Monthly Housing Costs | $516 | $0 |
| Real Estate Taxes | $2,142 | $39 |
Property Value by Mortgage Status in Sweeny
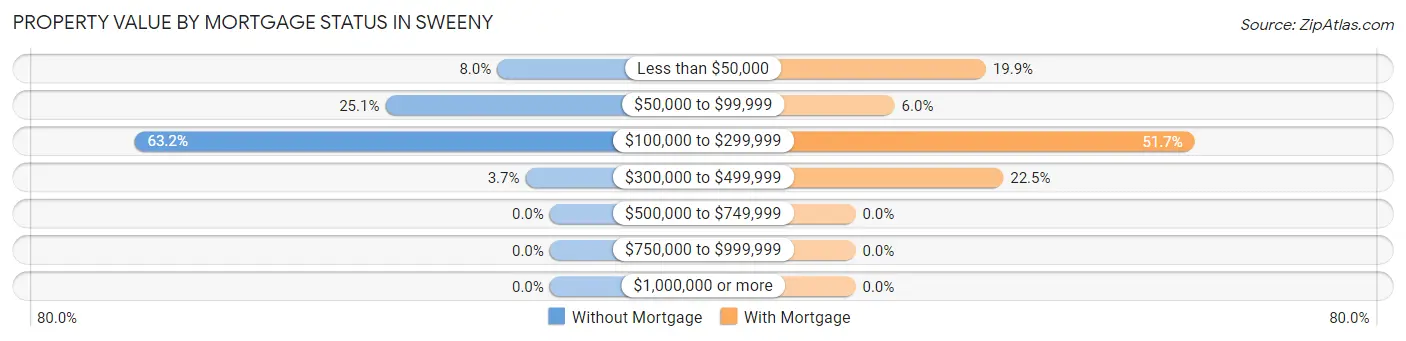
| Property Value | Without Mortgage | With Mortgage |
| Less than $50,000 | 39 (8.0%) | 90 (19.9%) |
| $50,000 to $99,999 | 122 (25.1%) | 27 (6.0%) |
| $100,000 to $299,999 | 308 (63.2%) | 234 (51.7%) |
| $300,000 to $499,999 | 18 (3.7%) | 102 (22.5%) |
| $500,000 to $749,999 | 0 (0.0%) | 0 (0.0%) |
| $750,000 to $999,999 | 0 (0.0%) | 0 (0.0%) |
| $1,000,000 or more | 0 (0.0%) | 0 (0.0%) |
| Total | 487 (100.0%) | 453 (100.0%) |
Household Income by Mortgage Status in Sweeny
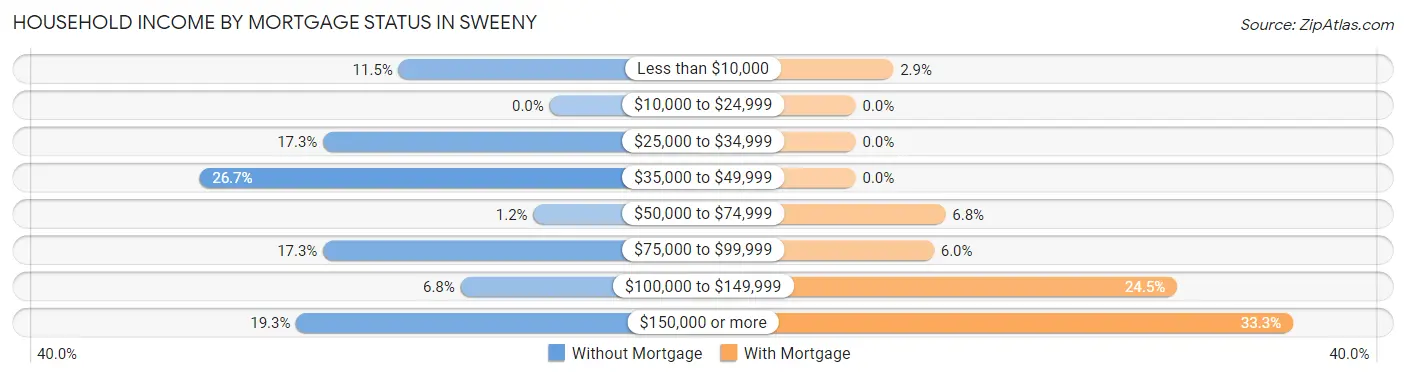
| Household Income | Without Mortgage | With Mortgage |
| Less than $10,000 | 56 (11.5%) | 13 (2.9%) |
| $10,000 to $24,999 | 0 (0.0%) | 0 (0.0%) |
| $25,000 to $34,999 | 84 (17.2%) | 0 (0.0%) |
| $35,000 to $49,999 | 130 (26.7%) | 0 (0.0%) |
| $50,000 to $74,999 | 6 (1.2%) | 31 (6.8%) |
| $75,000 to $99,999 | 84 (17.2%) | 27 (6.0%) |
| $100,000 to $149,999 | 33 (6.8%) | 111 (24.5%) |
| $150,000 or more | 94 (19.3%) | 151 (33.3%) |
| Total | 487 (100.0%) | 453 (100.0%) |
Property Value to Household Income Ratio in Sweeny
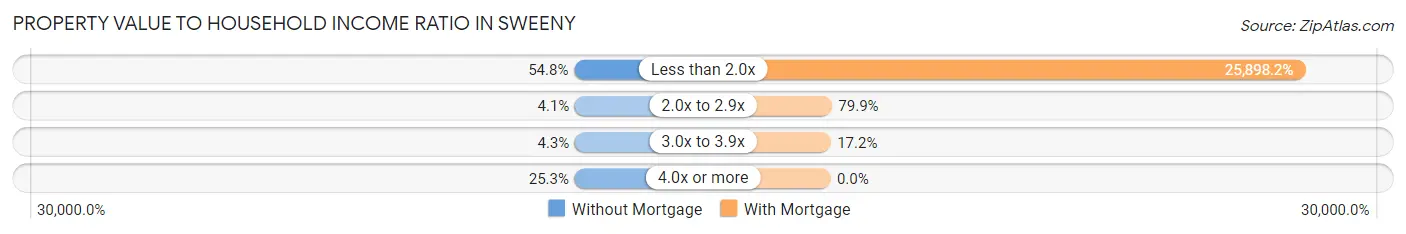
| Value-to-Income Ratio | Without Mortgage | With Mortgage |
| Less than 2.0x | 267 (54.8%) | 117,319 (25,898.2%) |
| 2.0x to 2.9x | 20 (4.1%) | 362 (79.9%) |
| 3.0x to 3.9x | 21 (4.3%) | 78 (17.2%) |
| 4.0x or more | 123 (25.3%) | 0 (0.0%) |
| Total | 487 (100.0%) | 453 (100.0%) |
Real Estate Taxes by Mortgage Status in Sweeny
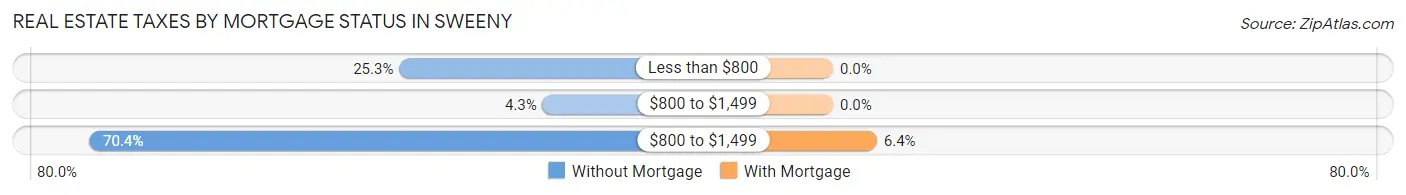
| Property Taxes | Without Mortgage | With Mortgage |
| Less than $800 | 123 (25.3%) | 0 (0.0%) |
| $800 to $1,499 | 21 (4.3%) | 0 (0.0%) |
| $800 to $1,499 | 343 (70.4%) | 29 (6.4%) |
| Total | 487 (100.0%) | 453 (100.0%) |
Health & Disability in Sweeny
Health Insurance Coverage by Age in Sweeny
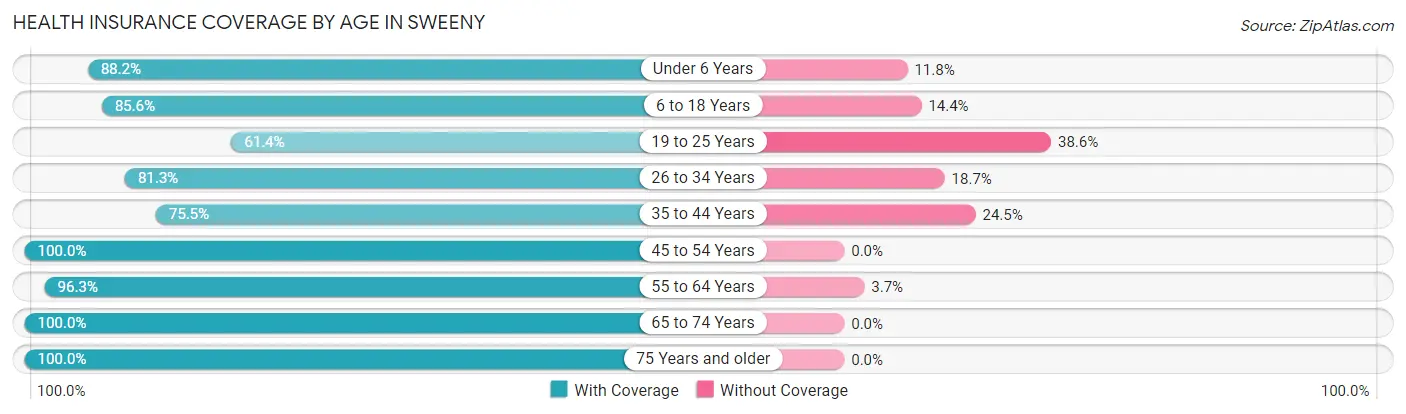
| Age Bracket | With Coverage | Without Coverage |
| Under 6 Years | 262 (88.2%) | 35 (11.8%) |
| 6 to 18 Years | 678 (85.6%) | 114 (14.4%) |
| 19 to 25 Years | 188 (61.4%) | 118 (38.6%) |
| 26 to 34 Years | 456 (81.3%) | 105 (18.7%) |
| 35 to 44 Years | 145 (75.5%) | 47 (24.5%) |
| 45 to 54 Years | 326 (100.0%) | 0 (0.0%) |
| 55 to 64 Years | 438 (96.3%) | 17 (3.7%) |
| 65 to 74 Years | 202 (100.0%) | 0 (0.0%) |
| 75 Years and older | 347 (100.0%) | 0 (0.0%) |
| Total | 3,042 (87.5%) | 436 (12.5%) |
Health Insurance Coverage by Citizenship Status in Sweeny
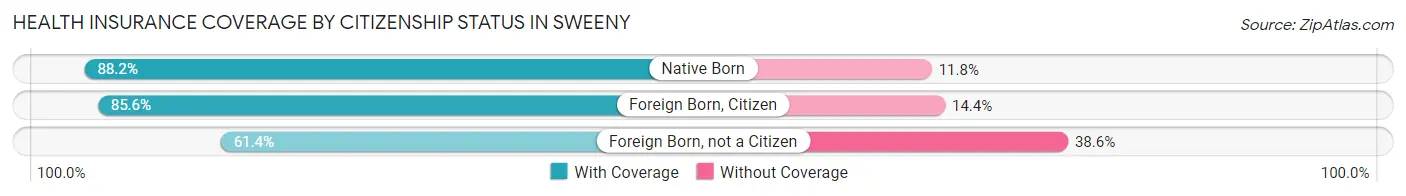
| Citizenship Status | With Coverage | Without Coverage |
| Native Born | 262 (88.2%) | 35 (11.8%) |
| Foreign Born, Citizen | 678 (85.6%) | 114 (14.4%) |
| Foreign Born, not a Citizen | 188 (61.4%) | 118 (38.6%) |
Health Insurance Coverage by Household Income in Sweeny
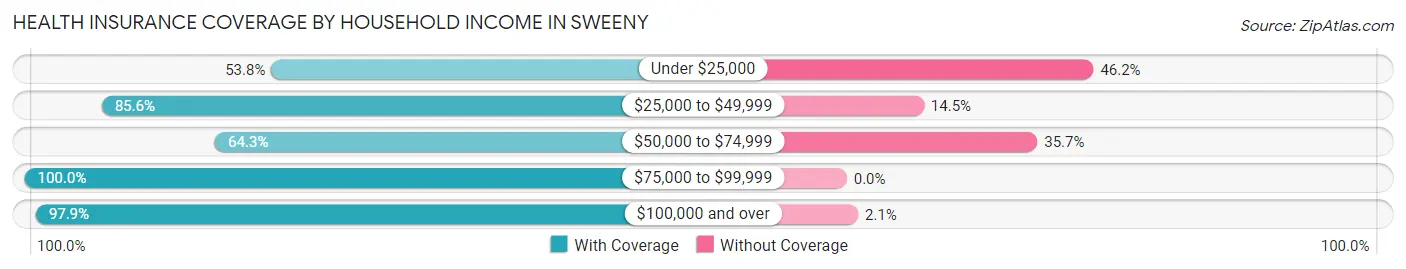
| Household Income | With Coverage | Without Coverage |
| Under $25,000 | 227 (53.8%) | 195 (46.2%) |
| $25,000 to $49,999 | 521 (85.6%) | 88 (14.4%) |
| $50,000 to $74,999 | 209 (64.3%) | 116 (35.7%) |
| $75,000 to $99,999 | 362 (100.0%) | 0 (0.0%) |
| $100,000 and over | 1,707 (97.9%) | 37 (2.1%) |
Public vs Private Health Insurance Coverage by Age in Sweeny
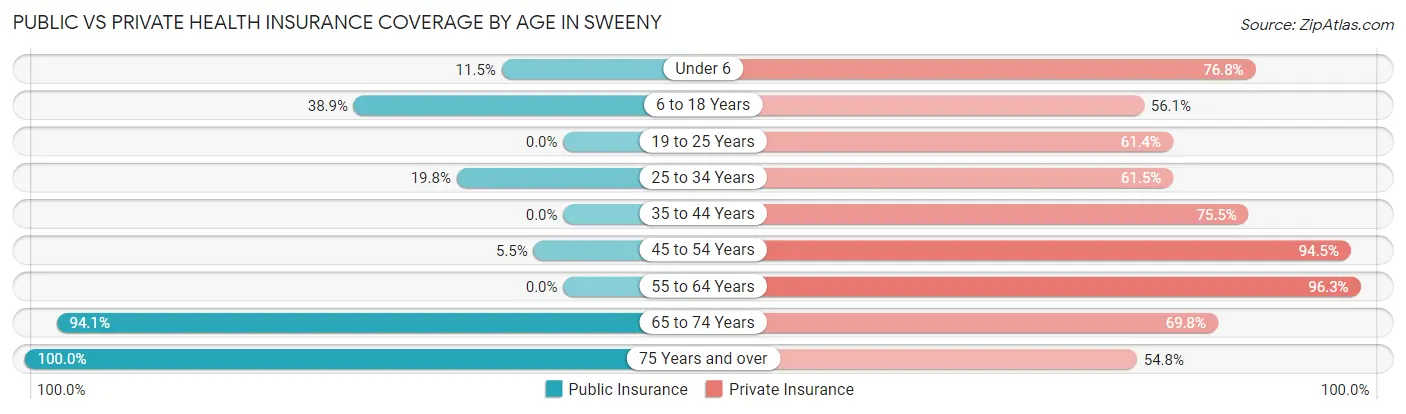
| Age Bracket | Public Insurance | Private Insurance |
| Under 6 | 34 (11.5%) | 228 (76.8%) |
| 6 to 18 Years | 308 (38.9%) | 444 (56.1%) |
| 19 to 25 Years | 0 (0.0%) | 188 (61.4%) |
| 25 to 34 Years | 111 (19.8%) | 345 (61.5%) |
| 35 to 44 Years | 0 (0.0%) | 145 (75.5%) |
| 45 to 54 Years | 18 (5.5%) | 308 (94.5%) |
| 55 to 64 Years | 0 (0.0%) | 438 (96.3%) |
| 65 to 74 Years | 190 (94.1%) | 141 (69.8%) |
| 75 Years and over | 347 (100.0%) | 190 (54.8%) |
| Total | 1,008 (29.0%) | 2,427 (69.8%) |
Disability Status by Sex by Age in Sweeny
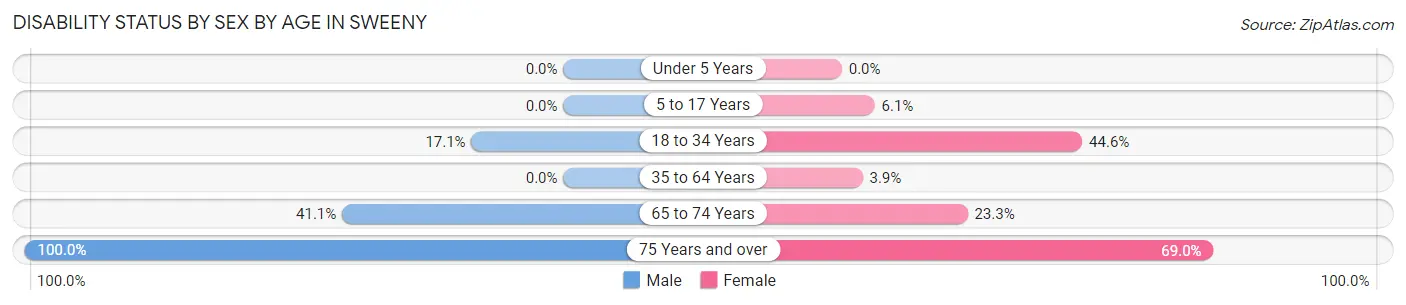
| Age Bracket | Male | Female |
| Under 5 Years | 0 (0.0%) | 0 (0.0%) |
| 5 to 17 Years | 0 (0.0%) | 27 (6.1%) |
| 18 to 34 Years | 72 (17.1%) | 199 (44.6%) |
| 35 to 64 Years | 0 (0.0%) | 18 (3.8%) |
| 65 to 74 Years | 46 (41.1%) | 21 (23.3%) |
| 75 Years and over | 144 (100.0%) | 140 (69.0%) |
Disability Class by Sex by Age in Sweeny
Disability Class: Hearing Difficulty
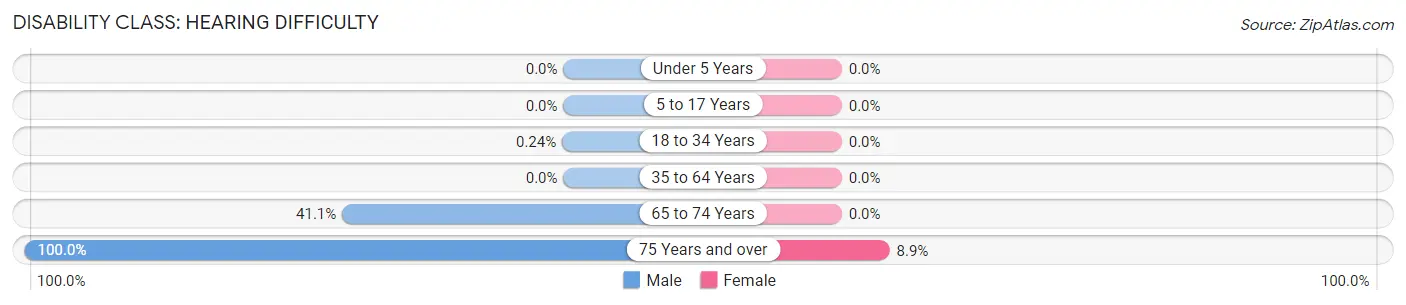
| Age Bracket | Male | Female |
| Under 5 Years | 0 (0.0%) | 0 (0.0%) |
| 5 to 17 Years | 0 (0.0%) | 0 (0.0%) |
| 18 to 34 Years | 1 (0.2%) | 0 (0.0%) |
| 35 to 64 Years | 0 (0.0%) | 0 (0.0%) |
| 65 to 74 Years | 46 (41.1%) | 0 (0.0%) |
| 75 Years and over | 144 (100.0%) | 18 (8.9%) |
Disability Class: Vision Difficulty
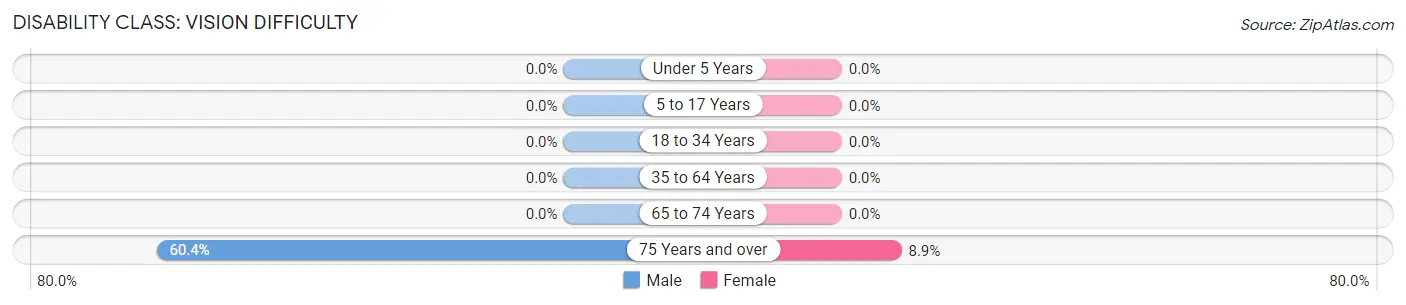
| Age Bracket | Male | Female |
| Under 5 Years | 0 (0.0%) | 0 (0.0%) |
| 5 to 17 Years | 0 (0.0%) | 0 (0.0%) |
| 18 to 34 Years | 0 (0.0%) | 0 (0.0%) |
| 35 to 64 Years | 0 (0.0%) | 0 (0.0%) |
| 65 to 74 Years | 0 (0.0%) | 0 (0.0%) |
| 75 Years and over | 87 (60.4%) | 18 (8.9%) |
Disability Class: Cognitive Difficulty
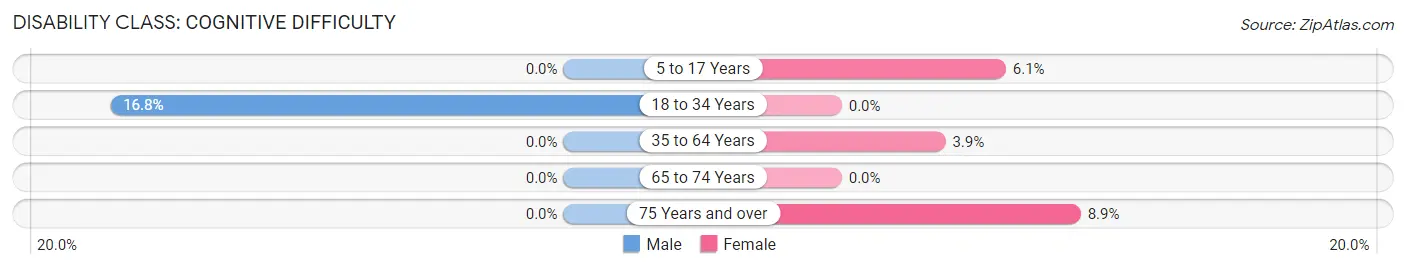
| Age Bracket | Male | Female |
| 5 to 17 Years | 0 (0.0%) | 27 (6.1%) |
| 18 to 34 Years | 71 (16.8%) | 0 (0.0%) |
| 35 to 64 Years | 0 (0.0%) | 18 (3.8%) |
| 65 to 74 Years | 0 (0.0%) | 0 (0.0%) |
| 75 Years and over | 0 (0.0%) | 18 (8.9%) |
Disability Class: Ambulatory Difficulty
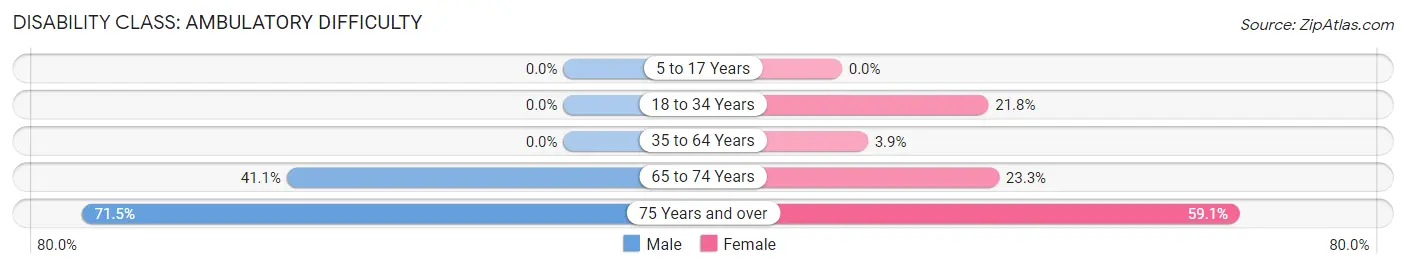
| Age Bracket | Male | Female |
| 5 to 17 Years | 0 (0.0%) | 0 (0.0%) |
| 18 to 34 Years | 0 (0.0%) | 97 (21.7%) |
| 35 to 64 Years | 0 (0.0%) | 18 (3.8%) |
| 65 to 74 Years | 46 (41.1%) | 21 (23.3%) |
| 75 Years and over | 103 (71.5%) | 120 (59.1%) |
Disability Class: Self-Care Difficulty
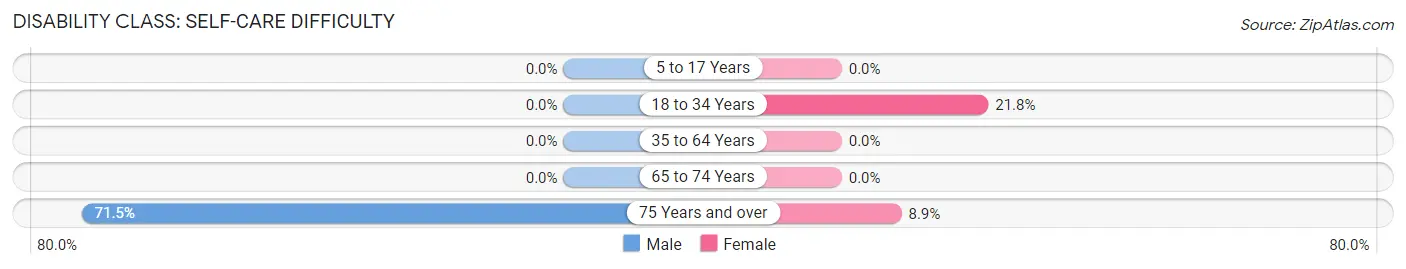
| Age Bracket | Male | Female |
| 5 to 17 Years | 0 (0.0%) | 0 (0.0%) |
| 18 to 34 Years | 0 (0.0%) | 97 (21.7%) |
| 35 to 64 Years | 0 (0.0%) | 0 (0.0%) |
| 65 to 74 Years | 0 (0.0%) | 0 (0.0%) |
| 75 Years and over | 103 (71.5%) | 18 (8.9%) |
Technology Access in Sweeny
Computing Device Access in Sweeny
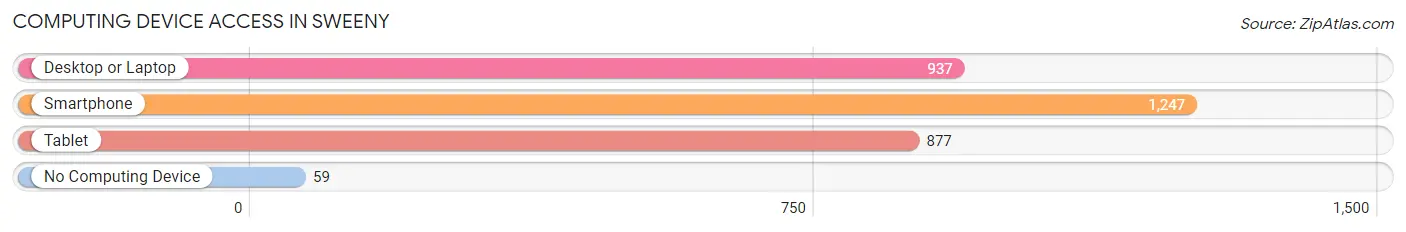
| Device Type | # Households | % Households |
| Desktop or Laptop | 937 | 69.1% |
| Smartphone | 1,247 | 91.9% |
| Tablet | 877 | 64.6% |
| No Computing Device | 59 | 4.3% |
| Total | 1,357 | 100.0% |
Internet Access in Sweeny
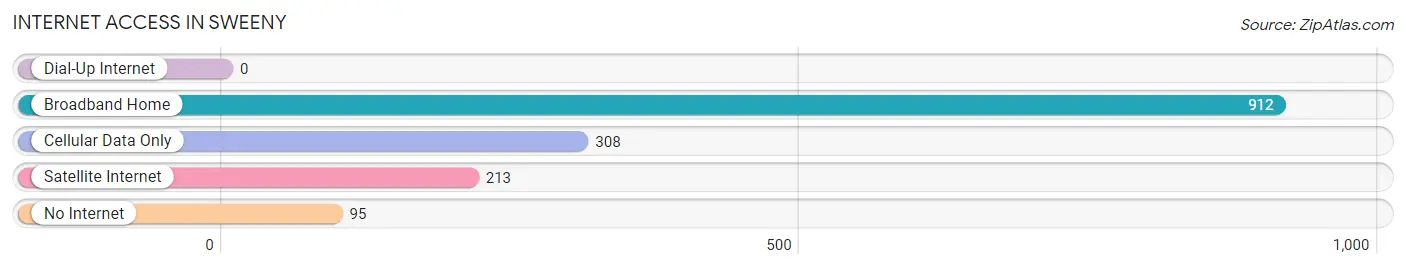
| Internet Type | # Households | % Households |
| Dial-Up Internet | 0 | 0.0% |
| Broadband Home | 912 | 67.2% |
| Cellular Data Only | 308 | 22.7% |
| Satellite Internet | 213 | 15.7% |
| No Internet | 95 | 7.0% |
| Total | 1,357 | 100.0% |
Sweeny Summary
Sweeny, Texas is a small town located in Brazoria County, Texas. It is situated about 40 miles southwest of Houston and is part of the Houston–The Woodlands–Sugar Land metropolitan area. The town was founded in 1876 and was named after a local rancher, John Sweeny. The population of Sweeny was estimated to be 4,717 in 2019.
History
Sweeny was founded in 1876 by John Sweeny, a local rancher. The town was originally known as Sweenyville, but the name was changed to Sweeny in 1883. The town was incorporated in 1891 and was the first incorporated town in Brazoria County.
The town was a major center for the cotton industry in the late 19th and early 20th centuries. The town was also home to a number of businesses, including a cotton gin, a sawmill, a gristmill, and a blacksmith shop.
In the early 20th century, Sweeny was a major stop on the Gulf, Colorado and Santa Fe Railway. The railroad brought new businesses and people to the town, and the population grew rapidly.
Geography
Sweeny is located in Brazoria County, Texas, about 40 miles southwest of Houston. The town is situated on the banks of the San Bernard River, which flows through the town. The town is surrounded by rolling hills and is located in the Gulf Coastal Plain.
The climate in Sweeny is humid subtropical, with hot summers and mild winters. The average annual temperature is 70°F (21°C). The average annual precipitation is 48 inches (122 cm).
Economy
The economy of Sweeny is largely based on agriculture and oil and gas production. The town is home to several large oil and gas companies, including Chevron, Shell, and ExxonMobil.
Agriculture is also an important part of the local economy. The town is home to several large farms, which produce cotton, corn, soybeans, and other crops.
The town is also home to several small businesses, including restaurants, retail stores, and service providers.
Demographics
The population of Sweeny was estimated to be 4,717 in 2019. The population is predominantly white (83.3%), followed by Hispanic or Latino (13.2%), African American (2.2%), and Asian (1.3%).
The median household income in Sweeny is $50,945, and the median home value is $117,400. The town has a poverty rate of 16.3%.
Conclusion
Sweeny, Texas is a small town located in Brazoria County, Texas. It was founded in 1876 and is home to a population of 4,717. The town is largely based on agriculture and oil and gas production, and the population is predominantly white. The median household income is $50,945, and the median home value is $117,400.
Common Questions
What is Per Capita Income in Sweeny?
Per Capita income in Sweeny is $35,250.
What is the Median Family Income in Sweeny?
Median Family Income in Sweeny is $78,415.
What is the Median Household income in Sweeny?
Median Household Income in Sweeny is $63,125.
What is Income or Wage Gap in Sweeny?
Income or Wage Gap in Sweeny is 72.3%.
Women in Sweeny earn 27.7 cents for every dollar earned by a man.
What is Family Income Deficit in Sweeny?
Family Income Deficit in Sweeny is $12,816.
Families that are below poverty line in Sweeny earn $12,816 less on average than the poverty threshold level.
What is Inequality or Gini Index in Sweeny?
Inequality or Gini Index in Sweeny is 0.44.
What is the Total Population of Sweeny?
Total Population of Sweeny is 3,602.
What is the Total Male Population of Sweeny?
Total Male Population of Sweeny is 1,806.
What is the Total Female Population of Sweeny?
Total Female Population of Sweeny is 1,796.
What is the Ratio of Males per 100 Females in Sweeny?
There are 100.56 Males per 100 Females in Sweeny.
What is the Ratio of Females per 100 Males in Sweeny?
There are 99.45 Females per 100 Males in Sweeny.
What is the Median Population Age in Sweeny?
Median Population Age in Sweeny is 32.7 Years.
What is the Average Family Size in Sweeny
Average Family Size in Sweeny is 3.4 People.
What is the Average Household Size in Sweeny
Average Household Size in Sweeny is 2.6 People.
How Large is the Labor Force in Sweeny?
There are 1,491 People in the Labor Forcein in Sweeny.
What is the Percentage of People in the Labor Force in Sweeny?
56.9% of People are in the Labor Force in Sweeny.
What is the Unemployment Rate in Sweeny?
Unemployment Rate in Sweeny is 5.1%.