Sulphur Springs, TX Map & Demographics
Sulphur Springs Map
Sulphur Springs Overview
$29,083
PER CAPITA INCOME
$71,221
AVG FAMILY INCOME
$54,950
AVG HOUSEHOLD INCOME
39.2%
WAGE / INCOME GAP [ % ]
60.8¢/ $1
WAGE / INCOME GAP [ $ ]
$11,269
FAMILY INCOME DEFICIT
0.46
INEQUALITY / GINI INDEX
16,033
TOTAL POPULATION
7,663
MALE POPULATION
8,370
FEMALE POPULATION
91.55
MALES / 100 FEMALES
109.23
FEMALES / 100 MALES
39.4
MEDIAN AGE
3.2
AVG FAMILY SIZE
2.5
AVG HOUSEHOLD SIZE
8,118
LABOR FORCE [ PEOPLE ]
63.9%
PERCENT IN LABOR FORCE
6.4%
UNEMPLOYMENT RATE
Sulphur Springs Zip Codes
Sulphur Springs Area Codes
Income in Sulphur Springs
Income Overview in Sulphur Springs
Per Capita Income in Sulphur Springs is $29,083, while median incomes of families and households are $71,221 and $54,950 respectively.
| Characteristic | Number | Measure |
| Per Capita Income | 16,033 | $29,083 |
| Median Family Income | 3,940 | $71,221 |
| Mean Family Income | 3,940 | $90,101 |
| Median Household Income | 6,271 | $54,950 |
| Mean Household Income | 6,271 | $72,182 |
| Income Deficit | 3,940 | $11,269 |
| Wage / Income Gap (%) | 16,033 | 39.17% |
| Wage / Income Gap ($) | 16,033 | 60.83¢ per $1 |
| Gini / Inequality Index | 16,033 | 0.46 |
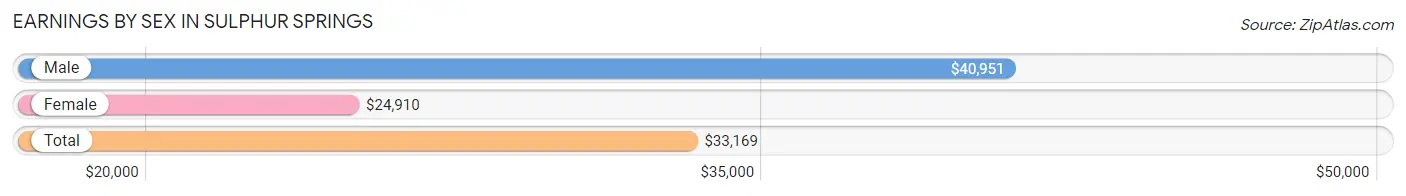
Earnings by Sex in Sulphur Springs
Average Earnings in Sulphur Springs are $33,169, $40,951 for men and $24,910 for women, a difference of 39.2%.
| Sex | Number | Average Earnings |
| Male | 4,257 (52.0%) | $40,951 |
| Female | 3,927 (48.0%) | $24,910 |
| Total | 8,184 (100.0%) | $33,169 |
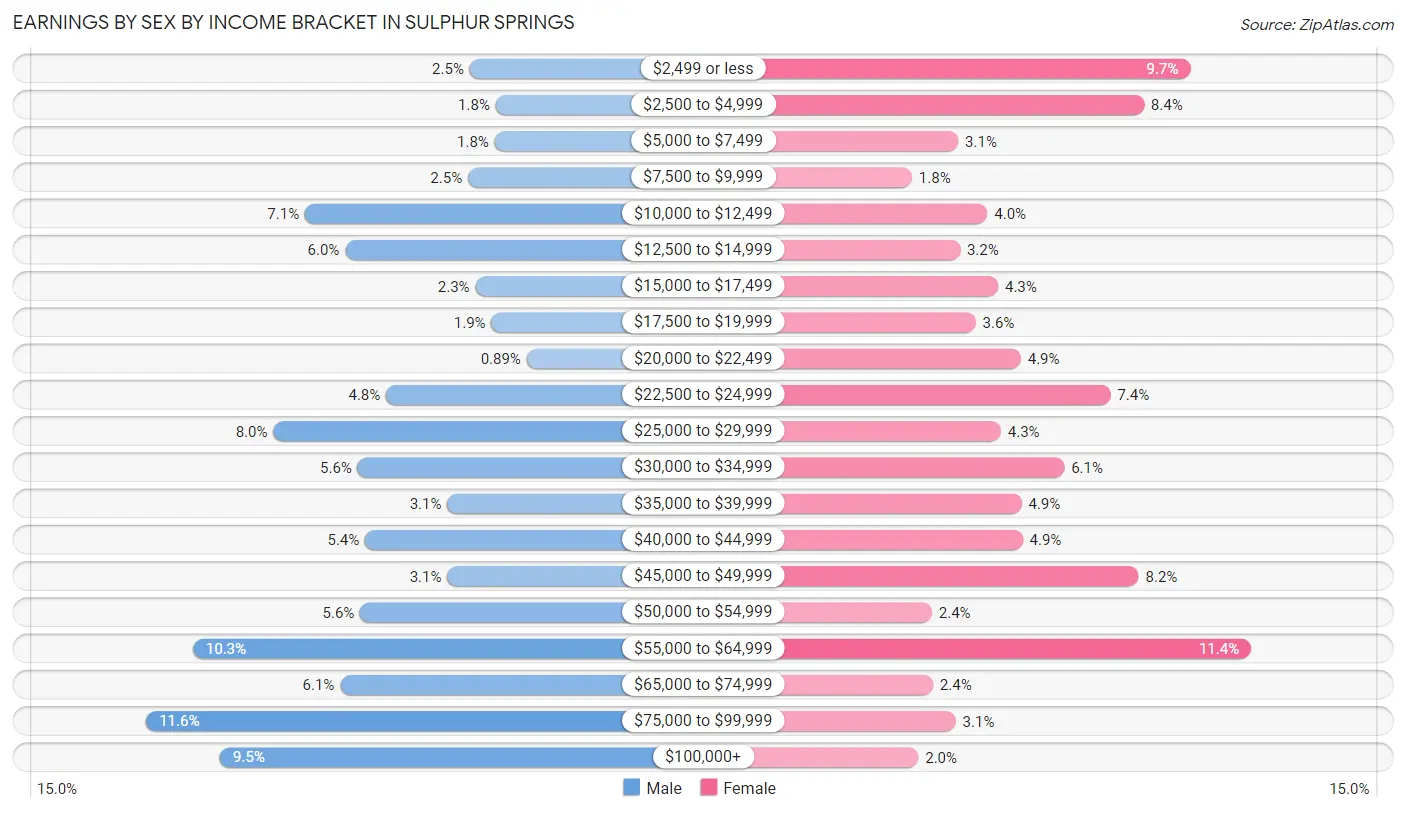
Earnings by Sex by Income Bracket in Sulphur Springs
The most common earnings brackets in Sulphur Springs are $75,000 to $99,999 for men (493 | 11.6%) and $55,000 to $64,999 for women (446 | 11.4%).
| Income | Male | Female |
| $2,499 or less | 106 (2.5%) | 379 (9.7%) |
| $2,500 to $4,999 | 75 (1.8%) | 328 (8.4%) |
| $5,000 to $7,499 | 76 (1.8%) | 123 (3.1%) |
| $7,500 to $9,999 | 108 (2.5%) | 72 (1.8%) |
| $10,000 to $12,499 | 303 (7.1%) | 155 (4.0%) |
| $12,500 to $14,999 | 255 (6.0%) | 125 (3.2%) |
| $15,000 to $17,499 | 99 (2.3%) | 167 (4.3%) |
| $17,500 to $19,999 | 80 (1.9%) | 142 (3.6%) |
| $20,000 to $22,499 | 38 (0.9%) | 192 (4.9%) |
| $22,500 to $24,999 | 206 (4.8%) | 291 (7.4%) |
| $25,000 to $29,999 | 341 (8.0%) | 170 (4.3%) |
| $30,000 to $34,999 | 240 (5.6%) | 240 (6.1%) |
| $35,000 to $39,999 | 133 (3.1%) | 193 (4.9%) |
| $40,000 to $44,999 | 231 (5.4%) | 194 (4.9%) |
| $45,000 to $49,999 | 133 (3.1%) | 322 (8.2%) |
| $50,000 to $54,999 | 237 (5.6%) | 94 (2.4%) |
| $55,000 to $64,999 | 437 (10.3%) | 446 (11.4%) |
| $65,000 to $74,999 | 261 (6.1%) | 95 (2.4%) |
| $75,000 to $99,999 | 493 (11.6%) | 120 (3.1%) |
| $100,000+ | 405 (9.5%) | 79 (2.0%) |
| Total | 4,257 (100.0%) | 3,927 (100.0%) |
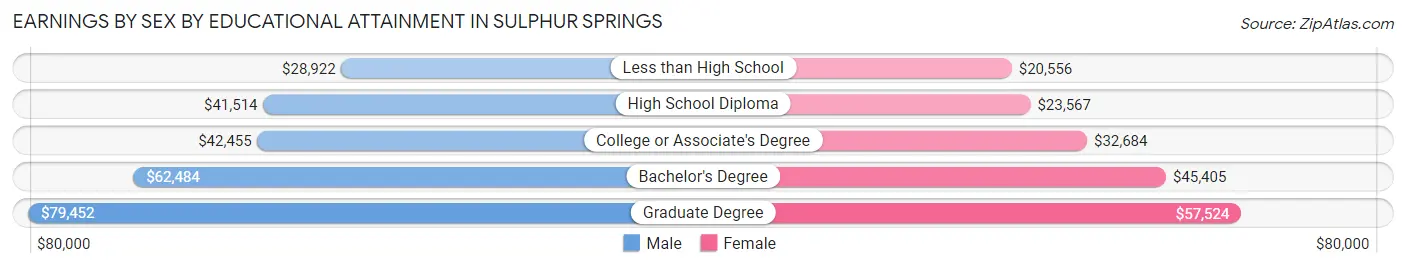
Earnings by Sex by Educational Attainment in Sulphur Springs
Average earnings in Sulphur Springs are $47,276 for men and $32,927 for women, a difference of 30.3%. Men with an educational attainment of graduate degree enjoy the highest average annual earnings of $79,452, while those with less than high school education earn the least with $28,922. Women with an educational attainment of graduate degree earn the most with the average annual earnings of $57,524, while those with less than high school education have the smallest earnings of $20,556.
| Educational Attainment | Male Income | Female Income |
| Less than High School | $28,922 | $20,556 |
| High School Diploma | $41,514 | $23,567 |
| College or Associate's Degree | $42,455 | $32,684 |
| Bachelor's Degree | $62,484 | $45,405 |
| Graduate Degree | $79,452 | $57,524 |
| Total | $47,276 | $32,927 |
Family Income in Sulphur Springs
Family Income Brackets in Sulphur Springs
According to the Sulphur Springs family income data, there are 776 families falling into the $50,000 to $74,999 income range, which is the most common income bracket and makes up 19.7% of all families. Conversely, the $10,000 to $14,999 income bracket is the least frequent group with only 154 families (3.9%) belonging to this category.
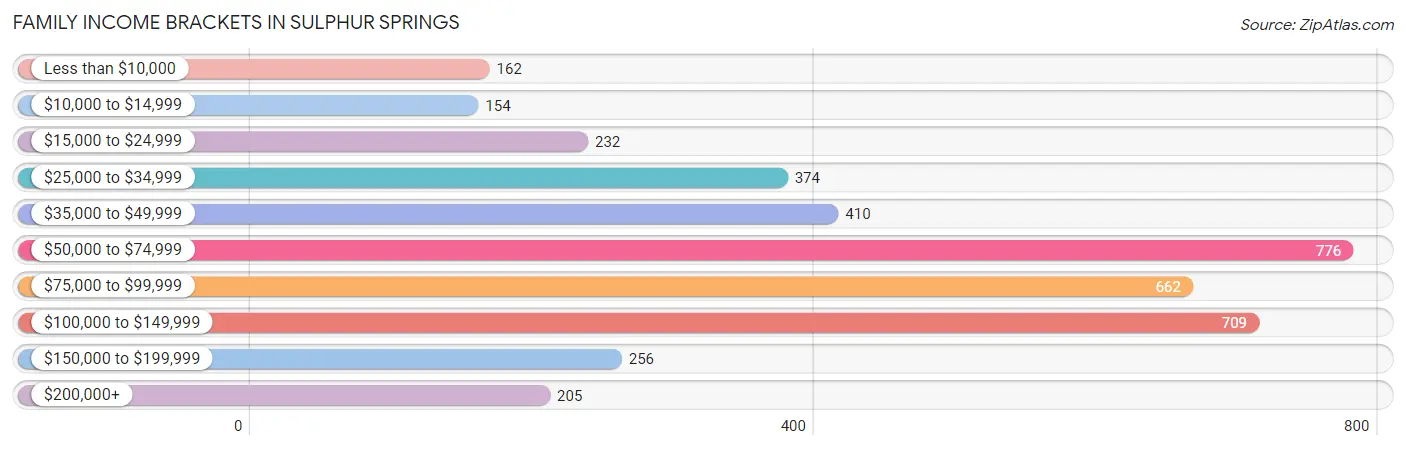
| Income Bracket | # Families | % Families |
| Less than $10,000 | 162 | 4.1% |
| $10,000 to $14,999 | 154 | 3.9% |
| $15,000 to $24,999 | 232 | 5.9% |
| $25,000 to $34,999 | 374 | 9.5% |
| $35,000 to $49,999 | 410 | 10.4% |
| $50,000 to $74,999 | 776 | 19.7% |
| $75,000 to $99,999 | 662 | 16.8% |
| $100,000 to $149,999 | 709 | 18.0% |
| $150,000 to $199,999 | 256 | 6.5% |
| $200,000+ | 205 | 5.2% |
Family Income by Famaliy Size in Sulphur Springs
7+ person families (68 | 1.7%) account for the highest median family income in Sulphur Springs with $205,855 per family, while 2-person families (1,793 | 45.5%) have the highest median income of $35,140 per family member.
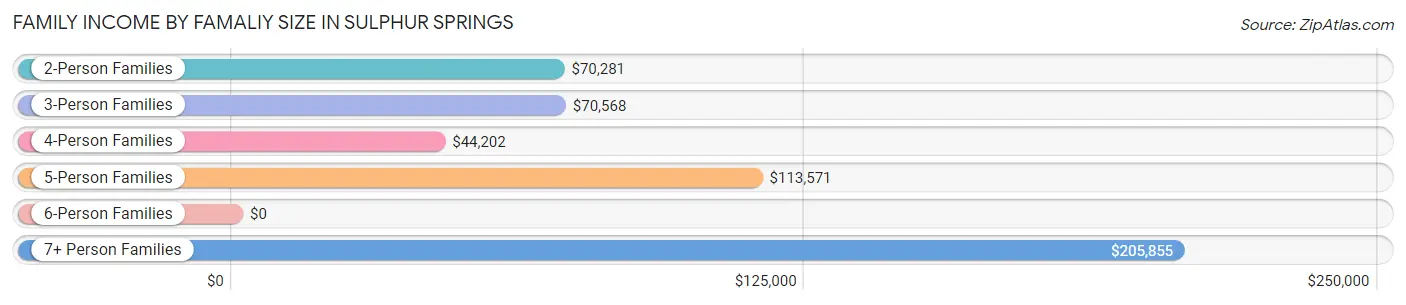
| Income Bracket | # Families | Median Income |
| 2-Person Families | 1,793 (45.5%) | $70,281 |
| 3-Person Families | 665 (16.9%) | $70,568 |
| 4-Person Families | 904 (22.9%) | $44,202 |
| 5-Person Families | 450 (11.4%) | $113,571 |
| 6-Person Families | 60 (1.5%) | $0 |
| 7+ Person Families | 68 (1.7%) | $205,855 |
| Total | 3,940 (100.0%) | $71,221 |
Family Income by Number of Earners in Sulphur Springs
The median family income in Sulphur Springs is $71,221, with families comprising 3+ earners (452) having the highest median family income of $124,038, while families with no earners (602) have the lowest median family income of $39,500, accounting for 11.5% and 15.3% of families, respectively.
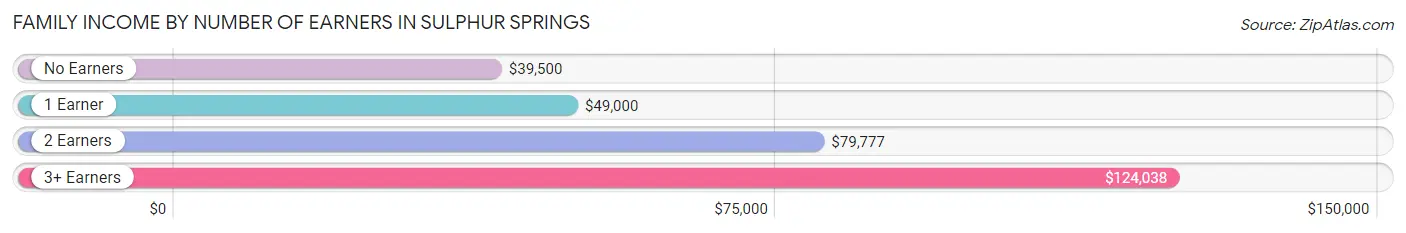
| Number of Earners | # Families | Median Income |
| No Earners | 602 (15.3%) | $39,500 |
| 1 Earner | 1,174 (29.8%) | $49,000 |
| 2 Earners | 1,712 (43.4%) | $79,777 |
| 3+ Earners | 452 (11.5%) | $124,038 |
| Total | 3,940 (100.0%) | $71,221 |
Household Income in Sulphur Springs
Household Income Brackets in Sulphur Springs
With 1,260 households falling in the category, the $50,000 to $74,999 income range is the most frequent in Sulphur Springs, accounting for 20.1% of all households. In contrast, only 219 households (3.5%) fall into the $200,000+ income bracket, making it the least populous group.
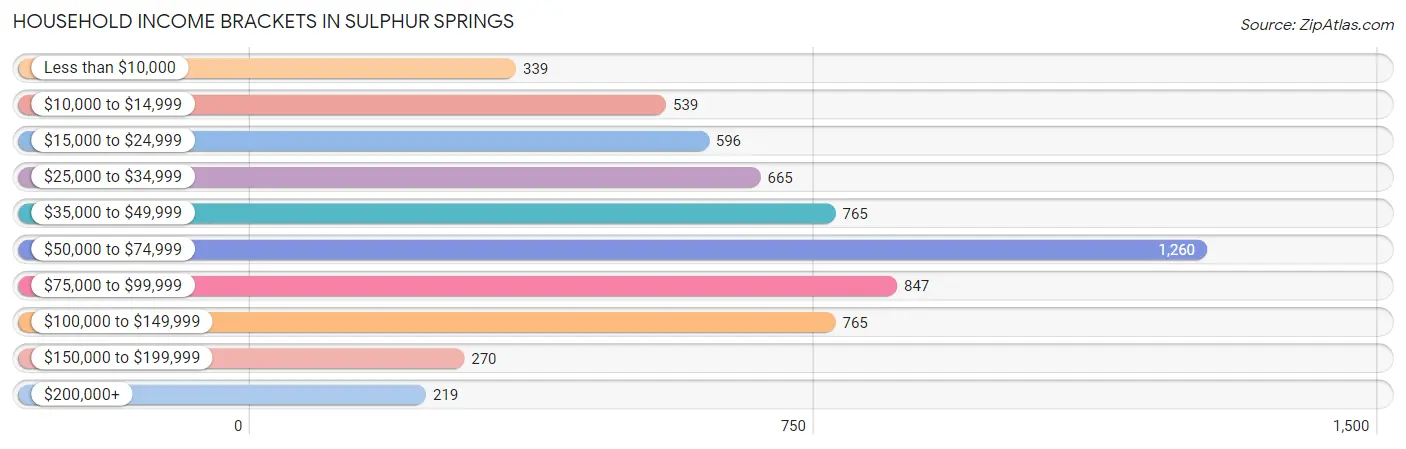
| Income Bracket | # Households | % Households |
| Less than $10,000 | 339 | 5.4% |
| $10,000 to $14,999 | 539 | 8.6% |
| $15,000 to $24,999 | 596 | 9.5% |
| $25,000 to $34,999 | 665 | 10.6% |
| $35,000 to $49,999 | 765 | 12.2% |
| $50,000 to $74,999 | 1,260 | 20.1% |
| $75,000 to $99,999 | 847 | 13.5% |
| $100,000 to $149,999 | 765 | 12.2% |
| $150,000 to $199,999 | 270 | 4.3% |
| $200,000+ | 219 | 3.5% |
Household Income by Householder Age in Sulphur Springs
The median household income in Sulphur Springs is $54,950, with the highest median household income of $64,386 found in the 25 to 44 years age bracket for the primary householder. A total of 1,668 households (26.6%) fall into this category. Meanwhile, the 65+ years age bracket for the primary householder has the lowest median household income of $40,743, with 1,873 households (29.9%) in this group.
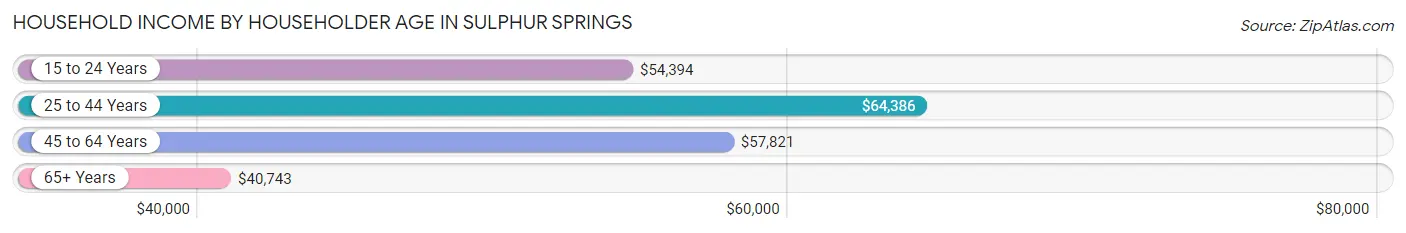
| Income Bracket | # Households | Median Income |
| 15 to 24 Years | 356 (5.7%) | $54,394 |
| 25 to 44 Years | 1,668 (26.6%) | $64,386 |
| 45 to 64 Years | 2,374 (37.9%) | $57,821 |
| 65+ Years | 1,873 (29.9%) | $40,743 |
| Total | 6,271 (100.0%) | $54,950 |
Poverty in Sulphur Springs
Income Below Poverty by Sex and Age in Sulphur Springs
With 16.2% poverty level for males and 16.1% for females among the residents of Sulphur Springs, 5 year old males and under 5 year old females are the most vulnerable to poverty, with 54 males (44.3%) and 123 females (30.7%) in their respective age groups living below the poverty level.
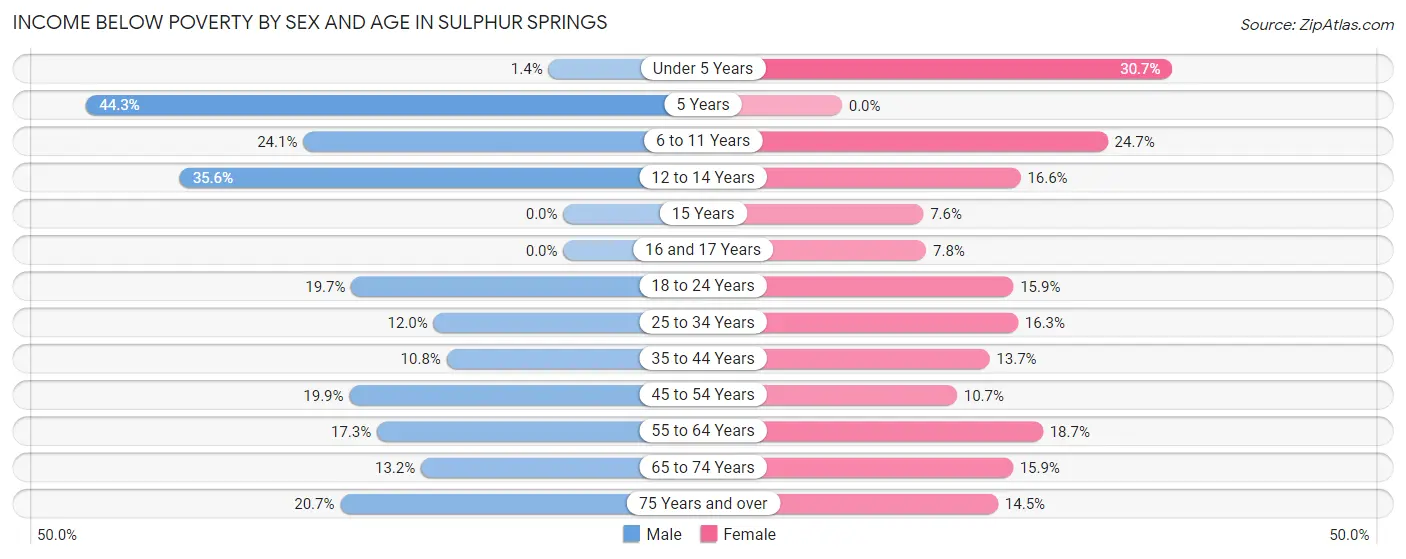
| Age Bracket | Male | Female |
| Under 5 Years | 7 (1.4%) | 123 (30.7%) |
| 5 Years | 54 (44.3%) | 0 (0.0%) |
| 6 to 11 Years | 161 (24.1%) | 170 (24.7%) |
| 12 to 14 Years | 89 (35.6%) | 67 (16.6%) |
| 15 Years | 0 (0.0%) | 13 (7.6%) |
| 16 and 17 Years | 0 (0.0%) | 19 (7.8%) |
| 18 to 24 Years | 136 (19.7%) | 147 (15.9%) |
| 25 to 34 Years | 115 (12.0%) | 134 (16.3%) |
| 35 to 44 Years | 89 (10.8%) | 114 (13.7%) |
| 45 to 54 Years | 220 (19.9%) | 122 (10.7%) |
| 55 to 64 Years | 167 (17.3%) | 158 (18.6%) |
| 65 to 74 Years | 91 (13.2%) | 144 (15.9%) |
| 75 Years and over | 77 (20.7%) | 102 (14.5%) |
| Total | 1,206 (16.2%) | 1,313 (16.1%) |
Income Above Poverty by Sex and Age in Sulphur Springs
According to the poverty statistics in Sulphur Springs, males aged 15 years and females aged 5 years are the age groups that are most secure financially, with 100.0% of males and 100.0% of females in these age groups living above the poverty line.
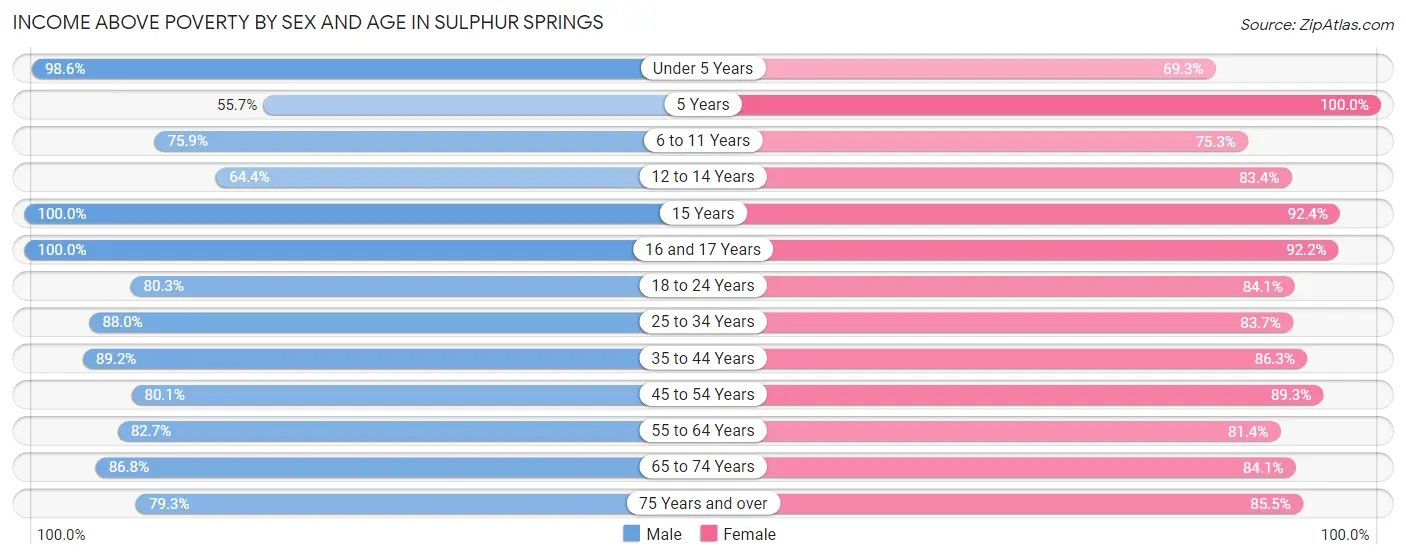
| Age Bracket | Male | Female |
| Under 5 Years | 499 (98.6%) | 278 (69.3%) |
| 5 Years | 68 (55.7%) | 55 (100.0%) |
| 6 to 11 Years | 506 (75.9%) | 519 (75.3%) |
| 12 to 14 Years | 161 (64.4%) | 337 (83.4%) |
| 15 Years | 63 (100.0%) | 159 (92.4%) |
| 16 and 17 Years | 231 (100.0%) | 224 (92.2%) |
| 18 to 24 Years | 555 (80.3%) | 777 (84.1%) |
| 25 to 34 Years | 840 (88.0%) | 686 (83.7%) |
| 35 to 44 Years | 733 (89.2%) | 718 (86.3%) |
| 45 to 54 Years | 888 (80.1%) | 1,021 (89.3%) |
| 55 to 64 Years | 799 (82.7%) | 689 (81.4%) |
| 65 to 74 Years | 598 (86.8%) | 764 (84.1%) |
| 75 Years and over | 295 (79.3%) | 602 (85.5%) |
| Total | 6,236 (83.8%) | 6,829 (83.9%) |
Income Below Poverty Among Married-Couple Families in Sulphur Springs
The poverty statistics for married-couple families in Sulphur Springs show that 6.4% or 185 of the total 2,896 families live below the poverty line. Families with 3 or 4 children have the highest poverty rate of 11.8%, comprising of 29 families. On the other hand, families with 5 or more children have the lowest poverty rate of 0.0%, which includes 0 families.
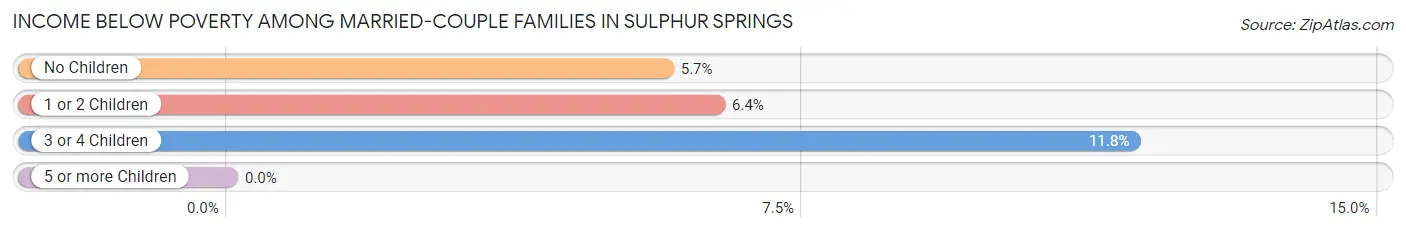
| Children | Above Poverty | Below Poverty |
| No Children | 1,426 (94.3%) | 86 (5.7%) |
| 1 or 2 Children | 1,030 (93.6%) | 70 (6.4%) |
| 3 or 4 Children | 217 (88.2%) | 29 (11.8%) |
| 5 or more Children | 38 (100.0%) | 0 (0.0%) |
| Total | 2,711 (93.6%) | 185 (6.4%) |
Income Below Poverty Among Single-Parent Households in Sulphur Springs
According to the poverty data in Sulphur Springs, 26.7% or 76 single-father households and 30.6% or 232 single-mother households are living below the poverty line. Among single-father households, those with no children have the highest poverty rate, with 58 households (47.1%) experiencing poverty. Likewise, among single-mother households, those with 3 or 4 children have the highest poverty rate, with 69 households (100.0%) falling below the poverty line.
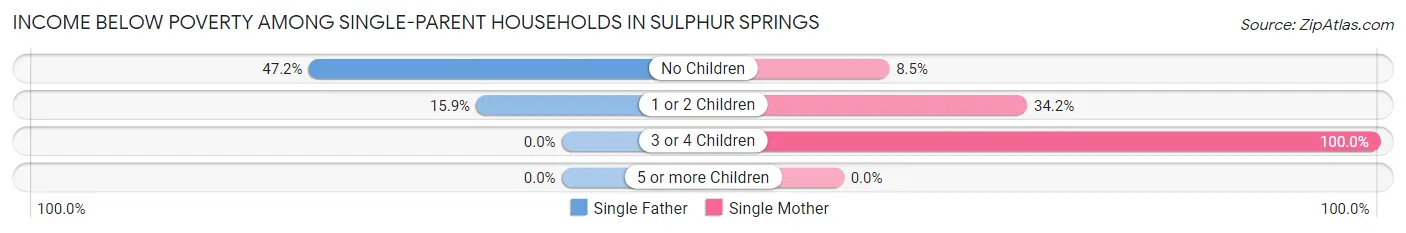
| Children | Single Father | Single Mother |
| No Children | 58 (47.1%) | 24 (8.5%) |
| 1 or 2 Children | 18 (15.9%) | 139 (34.2%) |
| 3 or 4 Children | 0 (0.0%) | 69 (100.0%) |
| 5 or more Children | 0 (0.0%) | 0 (0.0%) |
| Total | 76 (26.7%) | 232 (30.6%) |
Income Below Poverty Among Married-Couple vs Single-Parent Households in Sulphur Springs
The poverty data for Sulphur Springs shows that 185 of the married-couple family households (6.4%) and 308 of the single-parent households (29.5%) are living below the poverty level. Within the married-couple family households, those with 3 or 4 children have the highest poverty rate, with 29 households (11.8%) falling below the poverty line. Among the single-parent households, those with 3 or 4 children have the highest poverty rate, with 69 household (58.5%) living below poverty.
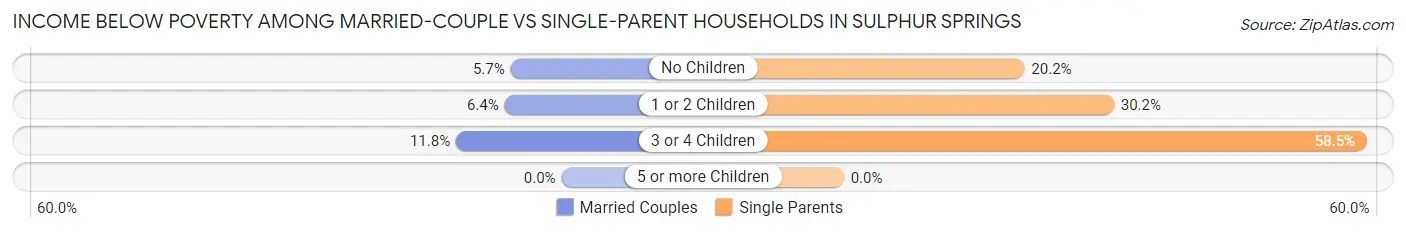
| Children | Married-Couple Families | Single-Parent Households |
| No Children | 86 (5.7%) | 82 (20.2%) |
| 1 or 2 Children | 70 (6.4%) | 157 (30.2%) |
| 3 or 4 Children | 29 (11.8%) | 69 (58.5%) |
| 5 or more Children | 0 (0.0%) | 0 (0.0%) |
| Total | 185 (6.4%) | 308 (29.5%) |
Race in Sulphur Springs
The most populous races in Sulphur Springs are White / Caucasian (12,131 | 75.7%), Hispanic or Latino (2,727 | 17.0%), and Black / African American (2,247 | 14.0%).
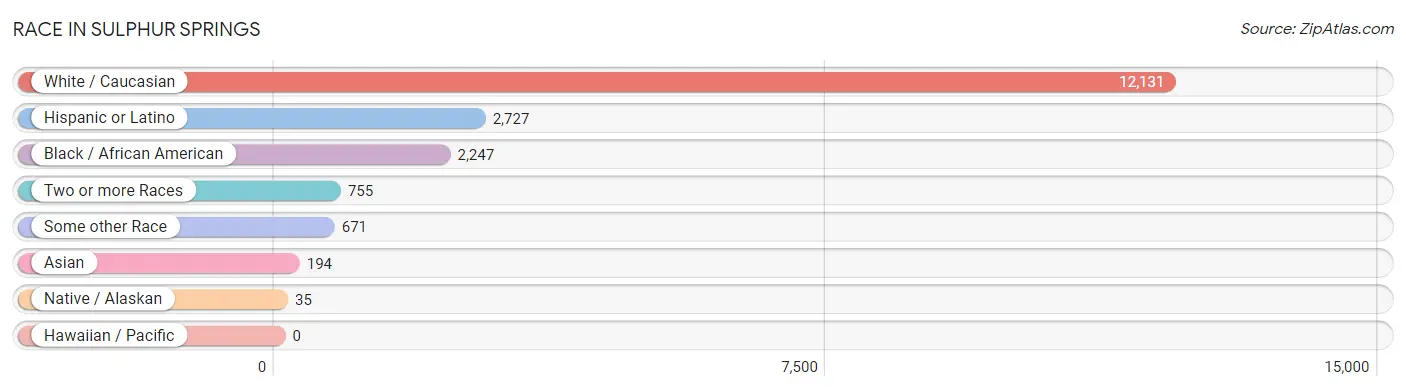
| Race | # Population | % Population |
| Asian | 194 | 1.2% |
| Black / African American | 2,247 | 14.0% |
| Hawaiian / Pacific | 0 | 0.0% |
| Hispanic or Latino | 2,727 | 17.0% |
| Native / Alaskan | 35 | 0.2% |
| White / Caucasian | 12,131 | 75.7% |
| Two or more Races | 755 | 4.7% |
| Some other Race | 671 | 4.2% |
| Total | 16,033 | 100.0% |
Ancestry in Sulphur Springs
The most populous ancestries reported in Sulphur Springs are Mexican (2,450 | 15.3%), English (1,397 | 8.7%), Irish (1,342 | 8.4%), American (1,257 | 7.8%), and German (993 | 6.2%), together accounting for 46.4% of all Sulphur Springs residents.
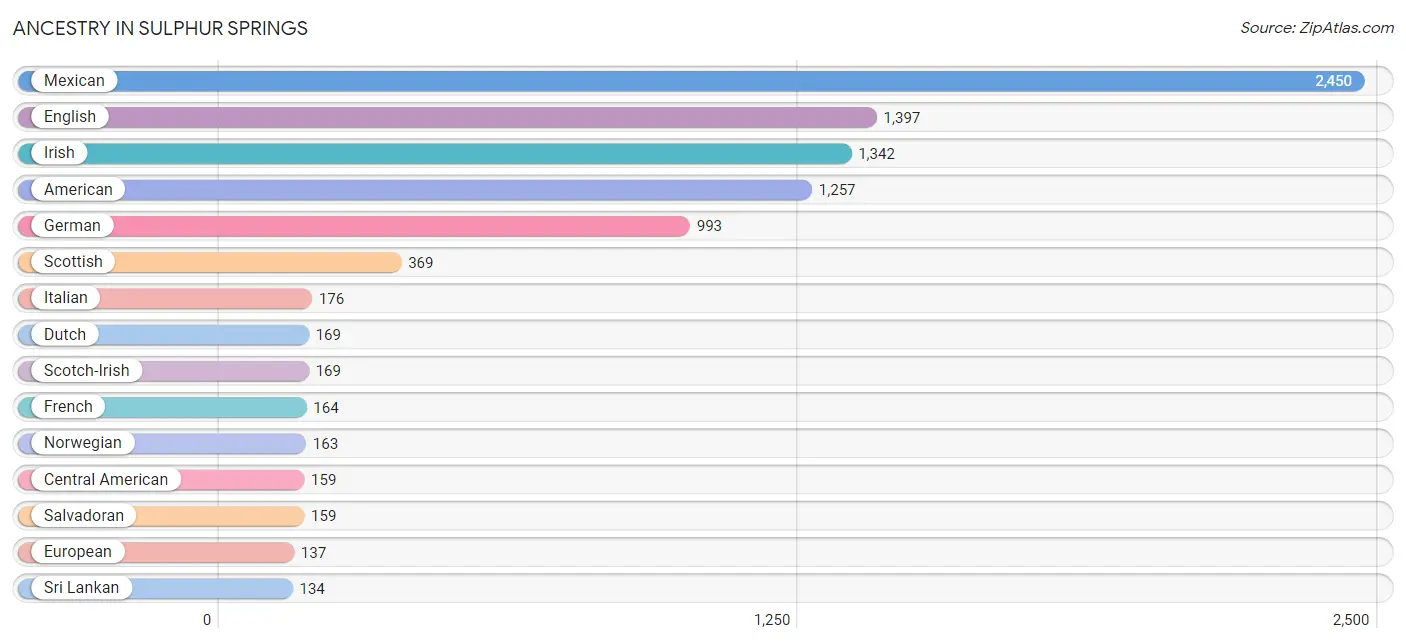
| Ancestry | # Population | % Population |
| African | 70 | 0.4% |
| American | 1,257 | 7.8% |
| Arab | 20 | 0.1% |
| Armenian | 18 | 0.1% |
| Austrian | 111 | 0.7% |
| Belizean | 54 | 0.3% |
| Blackfeet | 18 | 0.1% |
| British | 38 | 0.2% |
| Burmese | 43 | 0.3% |
| Cajun | 7 | 0.0% |
| Canadian | 17 | 0.1% |
| Central American | 159 | 1.0% |
| Central American Indian | 5 | 0.0% |
| Cherokee | 40 | 0.3% |
| Choctaw | 31 | 0.2% |
| Cuban | 58 | 0.4% |
| Czech | 46 | 0.3% |
| Dutch | 169 | 1.1% |
| Eastern European | 9 | 0.1% |
| English | 1,397 | 8.7% |
| European | 137 | 0.9% |
| French | 164 | 1.0% |
| French Canadian | 23 | 0.1% |
| German | 993 | 6.2% |
| Greek | 23 | 0.1% |
| Irish | 1,342 | 8.4% |
| Italian | 176 | 1.1% |
| Lebanese | 20 | 0.1% |
| Mexican | 2,450 | 15.3% |
| Mexican American Indian | 25 | 0.2% |
| Navajo | 19 | 0.1% |
| Nigerian | 5 | 0.0% |
| Norwegian | 163 | 1.0% |
| Peruvian | 27 | 0.2% |
| Polish | 102 | 0.6% |
| Portuguese | 56 | 0.4% |
| Puerto Rican | 9 | 0.1% |
| Salvadoran | 159 | 1.0% |
| Scandinavian | 13 | 0.1% |
| Scotch-Irish | 169 | 1.1% |
| Scottish | 369 | 2.3% |
| Serbian | 10 | 0.1% |
| Sioux | 4 | 0.0% |
| Slovak | 19 | 0.1% |
| South American | 27 | 0.2% |
| Spaniard | 24 | 0.2% |
| Sri Lankan | 134 | 0.8% |
| Subsaharan African | 75 | 0.5% |
| Swedish | 28 | 0.2% |
| Swiss | 9 | 0.1% |
| Thai | 43 | 0.3% |
| Ukrainian | 11 | 0.1% |
| Welsh | 35 | 0.2% | View All 53 Rows |
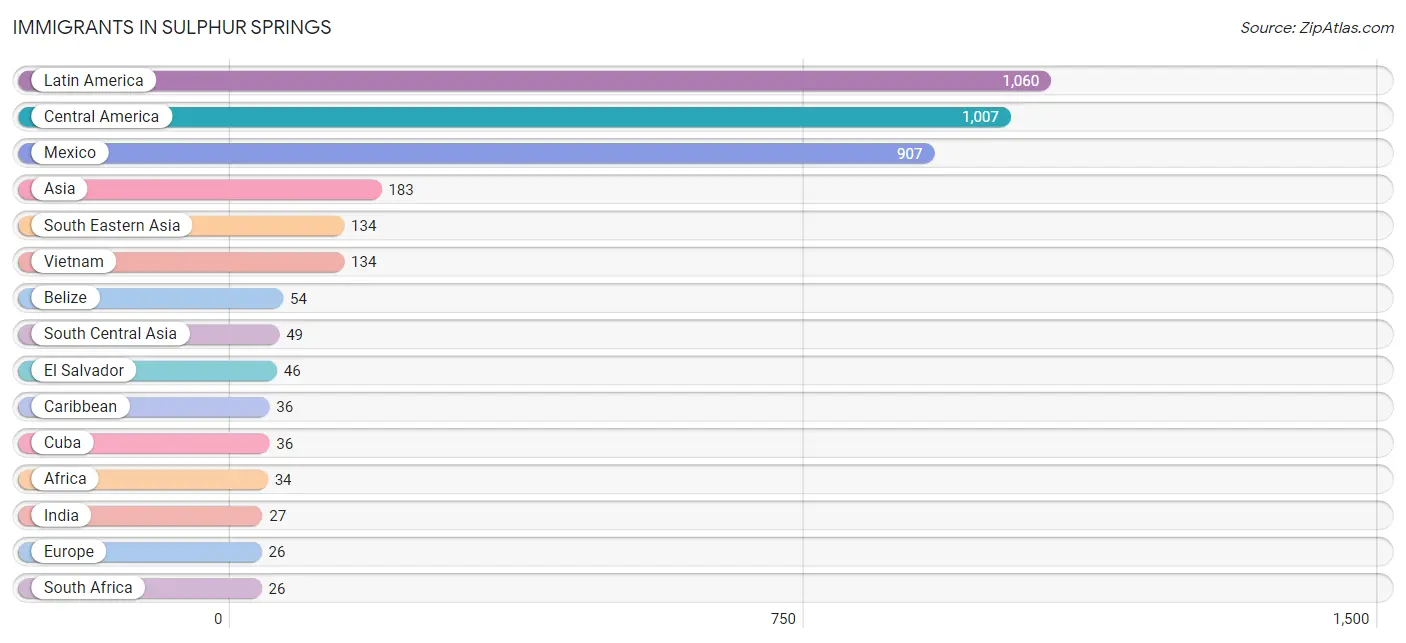
Immigrants in Sulphur Springs
The most numerous immigrant groups reported in Sulphur Springs came from Latin America (1,060 | 6.6%), Central America (1,007 | 6.3%), Mexico (907 | 5.7%), Asia (183 | 1.1%), and South Eastern Asia (134 | 0.8%), together accounting for 20.5% of all Sulphur Springs residents.
| Immigration Origin | # Population | % Population |
| Africa | 34 | 0.2% |
| Asia | 183 | 1.1% |
| Belize | 54 | 0.3% |
| Canada | 17 | 0.1% |
| Caribbean | 36 | 0.2% |
| Central America | 1,007 | 6.3% |
| Cuba | 36 | 0.2% |
| Eastern Africa | 8 | 0.1% |
| El Salvador | 46 | 0.3% |
| Europe | 26 | 0.2% |
| France | 3 | 0.0% |
| India | 27 | 0.2% |
| Italy | 12 | 0.1% |
| Kenya | 8 | 0.1% |
| Latin America | 1,060 | 6.6% |
| Mexico | 907 | 5.7% |
| Pakistan | 22 | 0.1% |
| Peru | 17 | 0.1% |
| South Africa | 26 | 0.2% |
| South America | 17 | 0.1% |
| South Central Asia | 49 | 0.3% |
| South Eastern Asia | 134 | 0.8% |
| Southern Europe | 23 | 0.1% |
| Vietnam | 134 | 0.8% |
| Western Europe | 3 | 0.0% | View All 25 Rows |
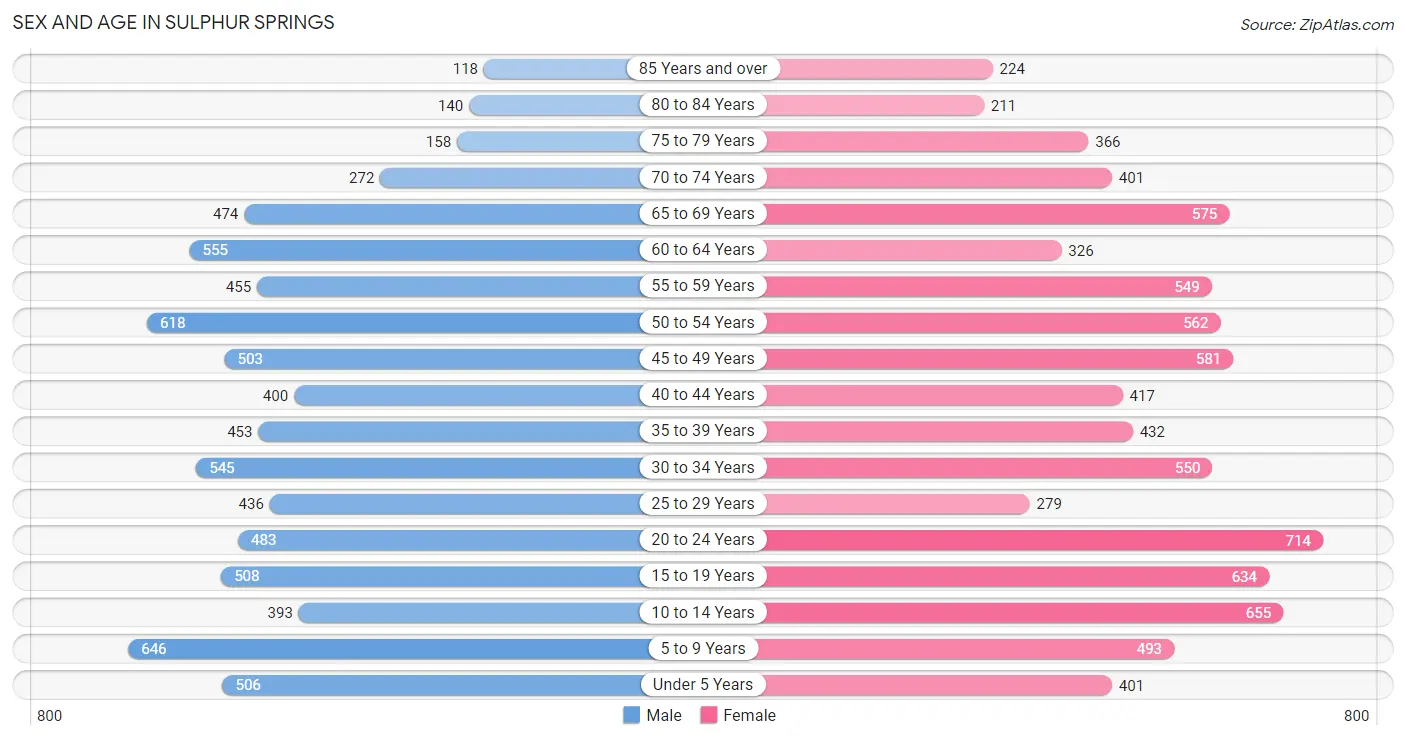
Sex and Age in Sulphur Springs
Sex and Age in Sulphur Springs
The most populous age groups in Sulphur Springs are 5 to 9 Years (646 | 8.4%) for men and 20 to 24 Years (714 | 8.5%) for women.
| Age Bracket | Male | Female |
| Under 5 Years | 506 (6.6%) | 401 (4.8%) |
| 5 to 9 Years | 646 (8.4%) | 493 (5.9%) |
| 10 to 14 Years | 393 (5.1%) | 655 (7.8%) |
| 15 to 19 Years | 508 (6.6%) | 634 (7.6%) |
| 20 to 24 Years | 483 (6.3%) | 714 (8.5%) |
| 25 to 29 Years | 436 (5.7%) | 279 (3.3%) |
| 30 to 34 Years | 545 (7.1%) | 550 (6.6%) |
| 35 to 39 Years | 453 (5.9%) | 432 (5.2%) |
| 40 to 44 Years | 400 (5.2%) | 417 (5.0%) |
| 45 to 49 Years | 503 (6.6%) | 581 (6.9%) |
| 50 to 54 Years | 618 (8.1%) | 562 (6.7%) |
| 55 to 59 Years | 455 (5.9%) | 549 (6.6%) |
| 60 to 64 Years | 555 (7.2%) | 326 (3.9%) |
| 65 to 69 Years | 474 (6.2%) | 575 (6.9%) |
| 70 to 74 Years | 272 (3.5%) | 401 (4.8%) |
| 75 to 79 Years | 158 (2.1%) | 366 (4.4%) |
| 80 to 84 Years | 140 (1.8%) | 211 (2.5%) |
| 85 Years and over | 118 (1.5%) | 224 (2.7%) |
| Total | 7,663 (100.0%) | 8,370 (100.0%) |
Families and Households in Sulphur Springs
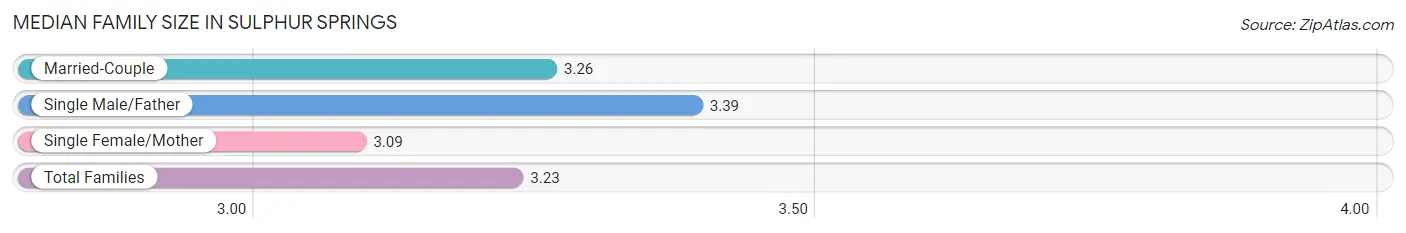
Median Family Size in Sulphur Springs
The median family size in Sulphur Springs is 3.23 persons per family, with single male/father families (285 | 7.2%) accounting for the largest median family size of 3.39 persons per family. On the other hand, single female/mother families (759 | 19.3%) represent the smallest median family size with 3.09 persons per family.
| Family Type | # Families | Family Size |
| Married-Couple | 2,896 (73.5%) | 3.26 |
| Single Male/Father | 285 (7.2%) | 3.39 |
| Single Female/Mother | 759 (19.3%) | 3.09 |
| Total Families | 3,940 (100.0%) | 3.23 |
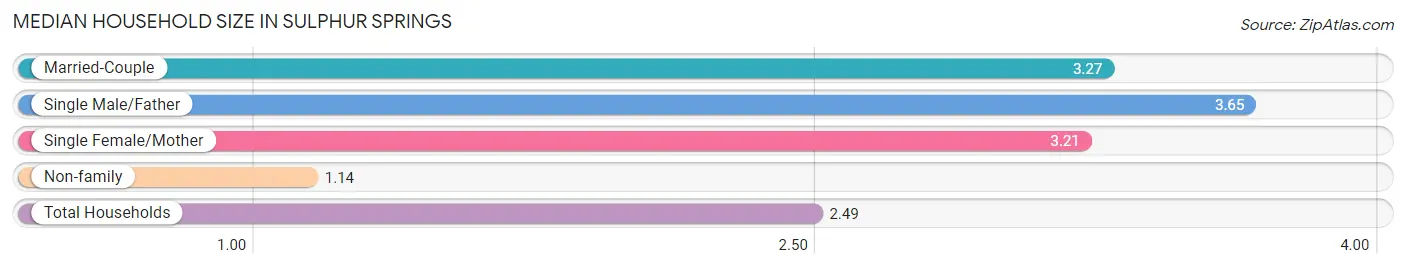
Median Household Size in Sulphur Springs
The median household size in Sulphur Springs is 2.49 persons per household, with single male/father households (285 | 4.5%) accounting for the largest median household size of 3.65 persons per household. non-family households (2,331 | 37.2%) represent the smallest median household size with 1.14 persons per household.
| Household Type | # Households | Household Size |
| Married-Couple | 2,896 (46.2%) | 3.27 |
| Single Male/Father | 285 (4.5%) | 3.65 |
| Single Female/Mother | 759 (12.1%) | 3.21 |
| Non-family | 2,331 (37.2%) | 1.14 |
| Total Households | 6,271 (100.0%) | 2.49 |
Household Size by Marriage Status in Sulphur Springs
Out of a total of 6,271 households in Sulphur Springs, 3,940 (62.8%) are family households, while 2,331 (37.2%) are nonfamily households. The most numerous type of family households are 2-person households, comprising 1,728, and the most common type of nonfamily households are 1-person households, comprising 2,138.
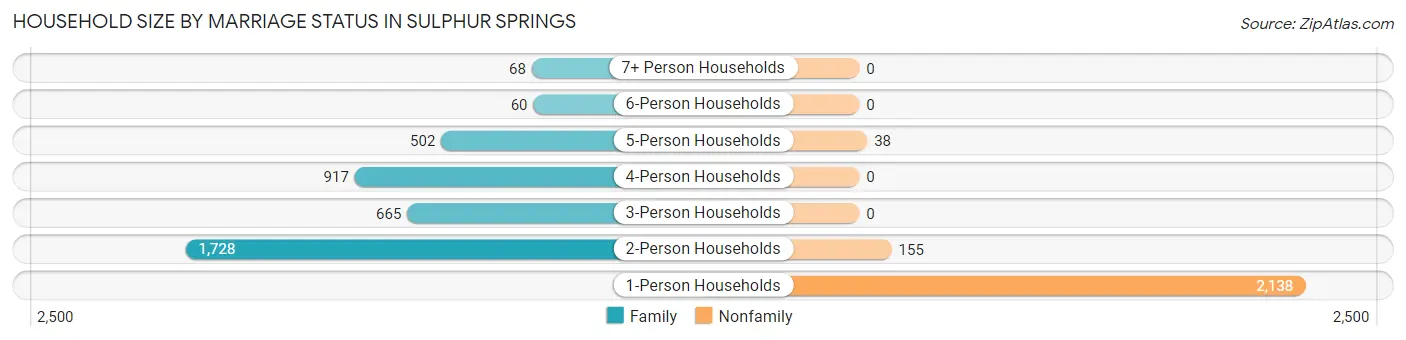
| Household Size | Family Households | Nonfamily Households |
| 1-Person Households | - | 2,138 (34.1%) |
| 2-Person Households | 1,728 (27.6%) | 155 (2.5%) |
| 3-Person Households | 665 (10.6%) | 0 (0.0%) |
| 4-Person Households | 917 (14.6%) | 0 (0.0%) |
| 5-Person Households | 502 (8.0%) | 38 (0.6%) |
| 6-Person Households | 60 (1.0%) | 0 (0.0%) |
| 7+ Person Households | 68 (1.1%) | 0 (0.0%) |
| Total | 3,940 (62.8%) | 2,331 (37.2%) |
Female Fertility in Sulphur Springs
Fertility by Age in Sulphur Springs
Average fertility rate in Sulphur Springs is 53.0 births per 1,000 women. Women in the age bracket of 20 to 34 years have the highest fertility rate with 93.0 births per 1,000 women. Women in the age bracket of 20 to 34 years acount for 73.5% of all women with births.
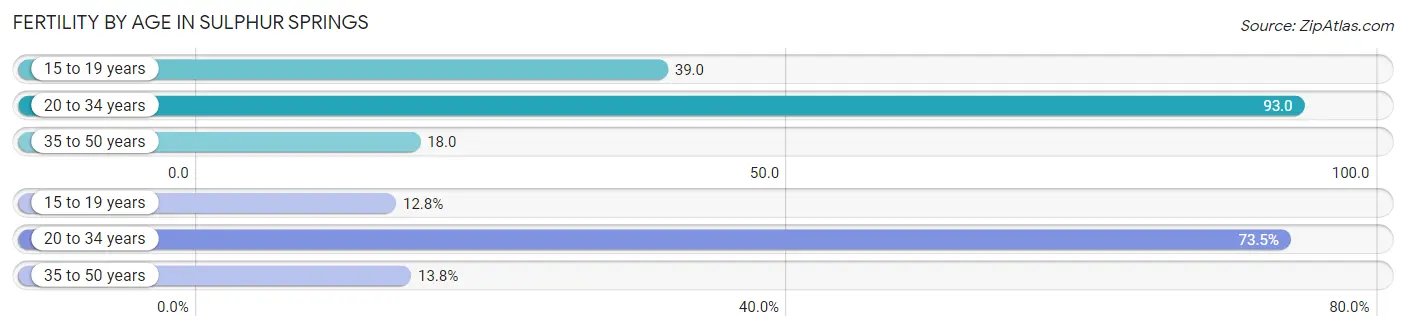
| Age Bracket | Women with Births | Births / 1,000 Women |
| 15 to 19 years | 25 (12.8%) | 39.0 |
| 20 to 34 years | 144 (73.5%) | 93.0 |
| 35 to 50 years | 27 (13.8%) | 18.0 |
| Total | 196 (100.0%) | 53.0 |
Fertility by Age by Marriage Status in Sulphur Springs
71.4% of women with births (196) in Sulphur Springs are married. The highest percentage of unmarried women with births falls into 15 to 19 years age bracket with 100.0% of them unmarried at the time of birth, while the lowest percentage of unmarried women with births belong to 20 to 34 years age bracket with 11.8% of them unmarried.
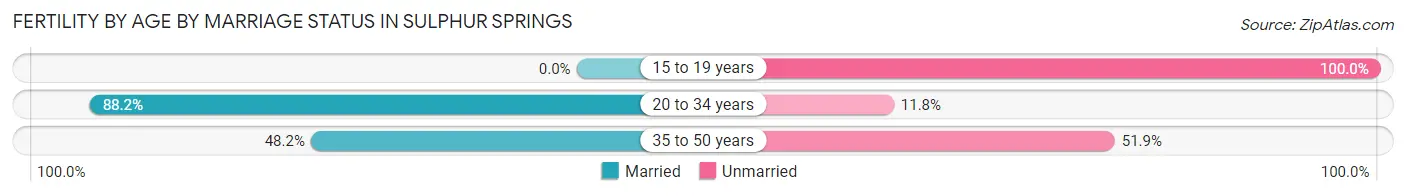
| Age Bracket | Married | Unmarried |
| 15 to 19 years | 0 (0.0%) | 25 (100.0%) |
| 20 to 34 years | 127 (88.2%) | 17 (11.8%) |
| 35 to 50 years | 13 (48.1%) | 14 (51.8%) |
| Total | 140 (71.4%) | 56 (28.6%) |
Fertility by Education in Sulphur Springs
Average fertility rate in Sulphur Springs is 53.0 births per 1,000 women. Women with the education attainment of graduate degree have the highest fertility rate of 125.0 births per 1,000 women, while women with the education attainment of high school diploma have the lowest fertility at 30.0 births per 1,000 women. Women with the education attainment of bachelor's degree represent 36.2% of all women with births.
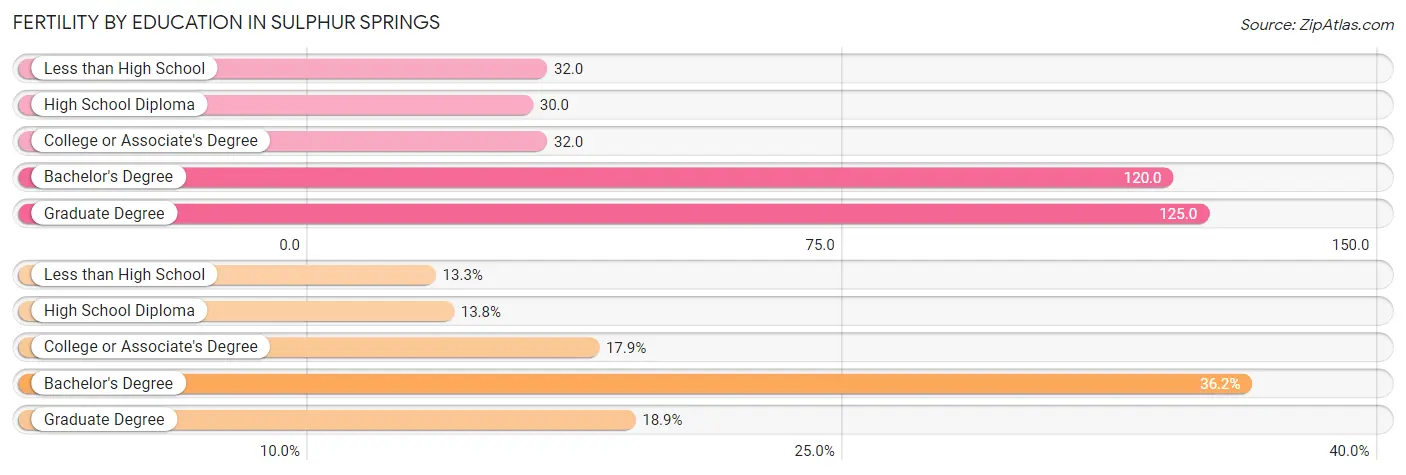
| Educational Attainment | Women with Births | Births / 1,000 Women |
| Less than High School | 26 (13.3%) | 32.0 |
| High School Diploma | 27 (13.8%) | 30.0 |
| College or Associate's Degree | 35 (17.9%) | 32.0 |
| Bachelor's Degree | 71 (36.2%) | 120.0 |
| Graduate Degree | 37 (18.9%) | 125.0 |
| Total | 196 (100.0%) | 53.0 |
Fertility by Education by Marriage Status in Sulphur Springs
28.6% of women with births in Sulphur Springs are unmarried. Women with the educational attainment of bachelor's degree are most likely to be married with 100.0% of them married at childbirth, while women with the educational attainment of less than high school are least likely to be married with 100.0% of them unmarried at childbirth.
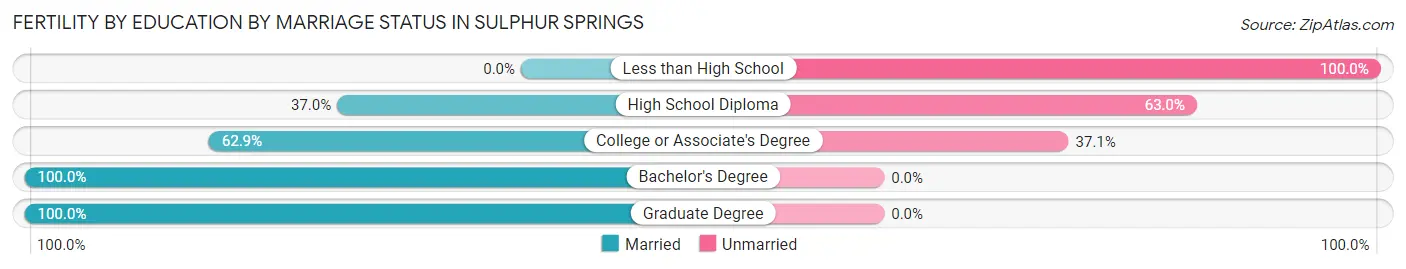
| Educational Attainment | Married | Unmarried |
| Less than High School | 0 (0.0%) | 26 (100.0%) |
| High School Diploma | 10 (37.0%) | 17 (63.0%) |
| College or Associate's Degree | 22 (62.9%) | 13 (37.1%) |
| Bachelor's Degree | 71 (100.0%) | 0 (0.0%) |
| Graduate Degree | 37 (100.0%) | 0 (0.0%) |
| Total | 140 (71.4%) | 56 (28.6%) |
Employment Characteristics in Sulphur Springs
Employment by Class of Employer in Sulphur Springs
Among the 7,438 employed individuals in Sulphur Springs, private company employees (5,203 | 70.0%), local government employees (754 | 10.1%), and not-for-profit organizations (552 | 7.4%) make up the most common classes of employment.

| Employer Class | # Employees | % Employees |
| Private Company Employees | 5,203 | 70.0% |
| Self-Employed (Incorporated) | 106 | 1.4% |
| Self-Employed (Not Incorporated) | 457 | 6.1% |
| Not-for-profit Organizations | 552 | 7.4% |
| Local Government Employees | 754 | 10.1% |
| State Government Employees | 204 | 2.7% |
| Federal Government Employees | 90 | 1.2% |
| Unpaid Family Workers | 72 | 1.0% |
| Total | 7,438 | 100.0% |
Employment Status by Age in Sulphur Springs
According to the labor force statistics for Sulphur Springs, out of the total population over 16 years of age (12,704), 63.9% or 8,118 individuals are in the labor force, with 6.4% or 520 of them unemployed. The age group with the highest labor force participation rate is 25 to 29 years, with 94.3% or 674 individuals in the labor force. Within the labor force, the 30 to 34 years age range has the highest percentage of unemployed individuals, with 10.9% or 98 of them being unemployed.
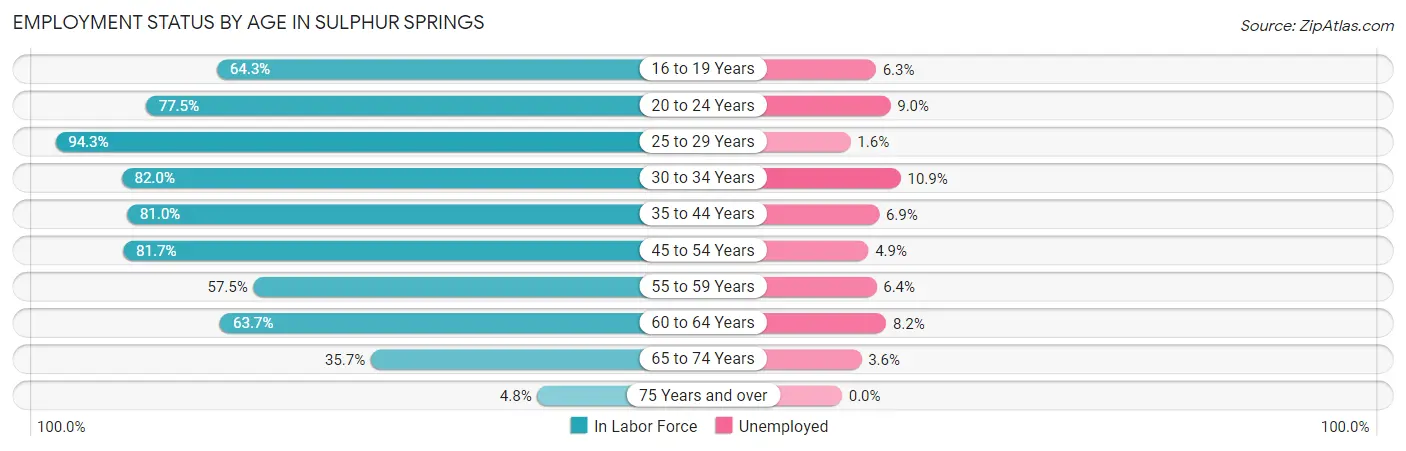
| Age Bracket | In Labor Force | Unemployed |
| 16 to 19 Years | 583 (64.3%) | 37 (6.3%) |
| 20 to 24 Years | 928 (77.5%) | 84 (9.0%) |
| 25 to 29 Years | 674 (94.3%) | 11 (1.6%) |
| 30 to 34 Years | 898 (82.0%) | 98 (10.9%) |
| 35 to 44 Years | 1,379 (81.0%) | 95 (6.9%) |
| 45 to 54 Years | 1,850 (81.7%) | 91 (4.9%) |
| 55 to 59 Years | 577 (57.5%) | 37 (6.4%) |
| 60 to 64 Years | 561 (63.7%) | 46 (8.2%) |
| 65 to 74 Years | 615 (35.7%) | 22 (3.6%) |
| 75 Years and over | 58 (4.8%) | 0 (0.0%) |
| Total | 8,118 (63.9%) | 520 (6.4%) |
Employment Status by Educational Attainment in Sulphur Springs
According to labor force statistics for Sulphur Springs, 77.5% of individuals (5,937) out of the total population between 25 and 64 years of age (7,661) are in the labor force, with 6.4% or 380 of them being unemployed. The group with the highest labor force participation rate are those with the educational attainment of bachelor's degree or higher, with 91.8% or 1,561 individuals in the labor force. Within the labor force, individuals with less than high school education have the highest percentage of unemployment, with 10.1% or 50 of them being unemployed.
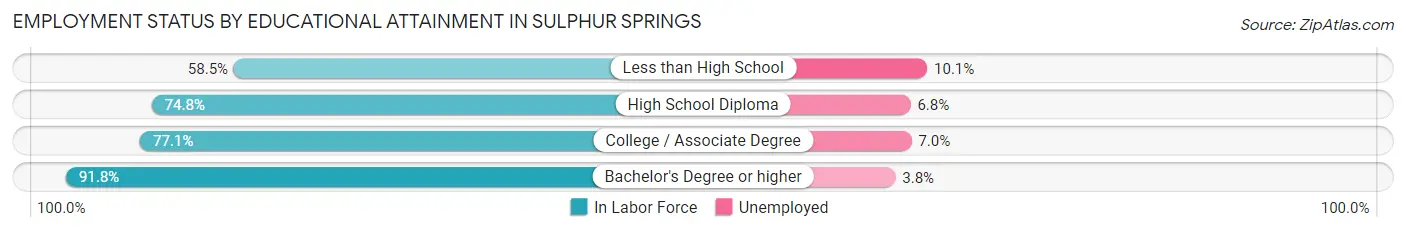
| Educational Attainment | In Labor Force | Unemployed |
| Less than High School | 493 (58.5%) | 85 (10.1%) |
| High School Diploma | 1,938 (74.8%) | 176 (6.8%) |
| College / Associate Degree | 1,948 (77.1%) | 177 (7.0%) |
| Bachelor's Degree or higher | 1,561 (91.8%) | 65 (3.8%) |
| Total | 5,937 (77.5%) | 490 (6.4%) |
Employment Occupations by Sex in Sulphur Springs
Management, Business, Science and Arts Occupations
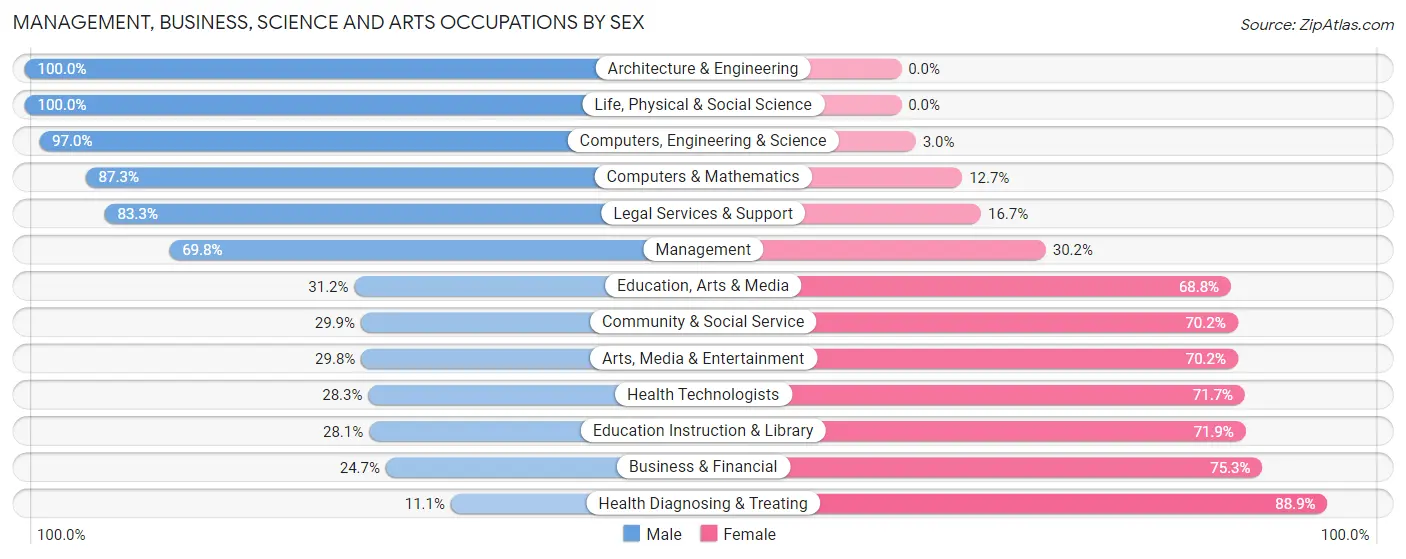
The most common Management, Business, Science and Arts occupations in Sulphur Springs are Community & Social Service (757 | 10.0%), Management (580 | 7.7%), Business & Financial (515 | 6.8%), Education Instruction & Library (494 | 6.5%), and Health Diagnosing & Treating (451 | 6.0%).
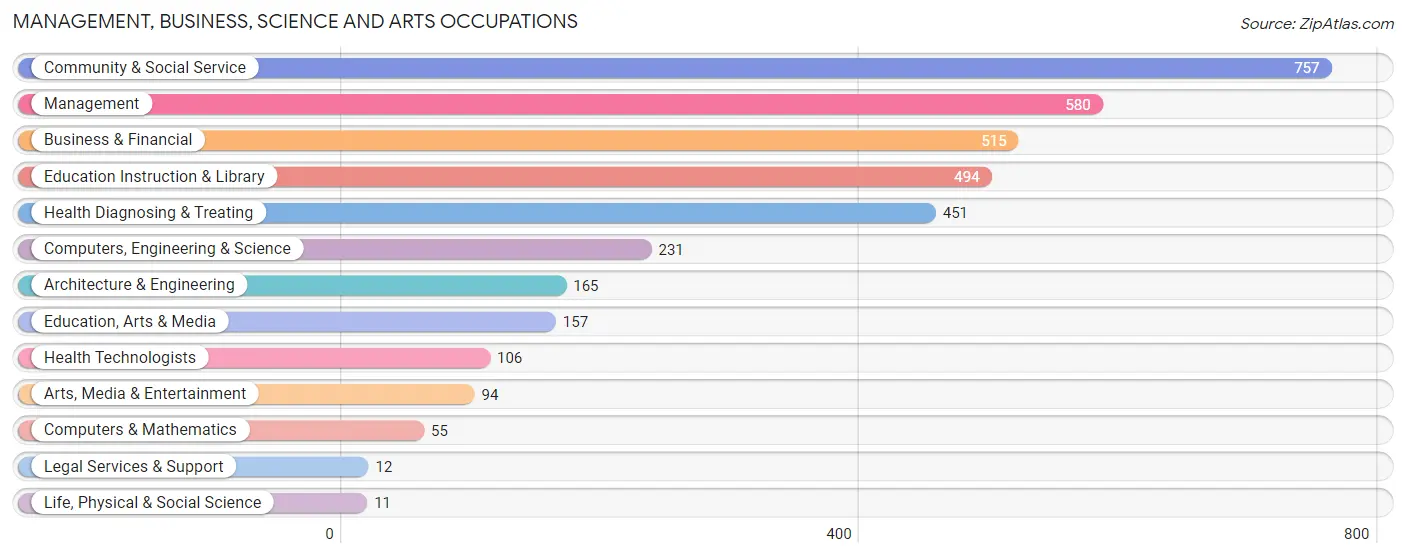
Management, Business, Science and Arts Occupations by Sex
Within the Management, Business, Science and Arts occupations in Sulphur Springs, the most male-oriented occupations are Architecture & Engineering (100.0%), Life, Physical & Social Science (100.0%), and Computers, Engineering & Science (97.0%), while the most female-oriented occupations are Health Diagnosing & Treating (88.9%), Business & Financial (75.3%), and Education Instruction & Library (71.9%).
| Occupation | Male | Female |
| Management | 405 (69.8%) | 175 (30.2%) |
| Business & Financial | 127 (24.7%) | 388 (75.3%) |
| Computers, Engineering & Science | 224 (97.0%) | 7 (3.0%) |
| Computers & Mathematics | 48 (87.3%) | 7 (12.7%) |
| Architecture & Engineering | 165 (100.0%) | 0 (0.0%) |
| Life, Physical & Social Science | 11 (100.0%) | 0 (0.0%) |
| Community & Social Service | 226 (29.8%) | 531 (70.2%) |
| Education, Arts & Media | 49 (31.2%) | 108 (68.8%) |
| Legal Services & Support | 10 (83.3%) | 2 (16.7%) |
| Education Instruction & Library | 139 (28.1%) | 355 (71.9%) |
| Arts, Media & Entertainment | 28 (29.8%) | 66 (70.2%) |
| Health Diagnosing & Treating | 50 (11.1%) | 401 (88.9%) |
| Health Technologists | 30 (28.3%) | 76 (71.7%) |
| Total (Category) | 1,032 (40.7%) | 1,502 (59.3%) |
| Total (Overall) | 3,985 (52.6%) | 3,587 (47.4%) |
Services Occupations
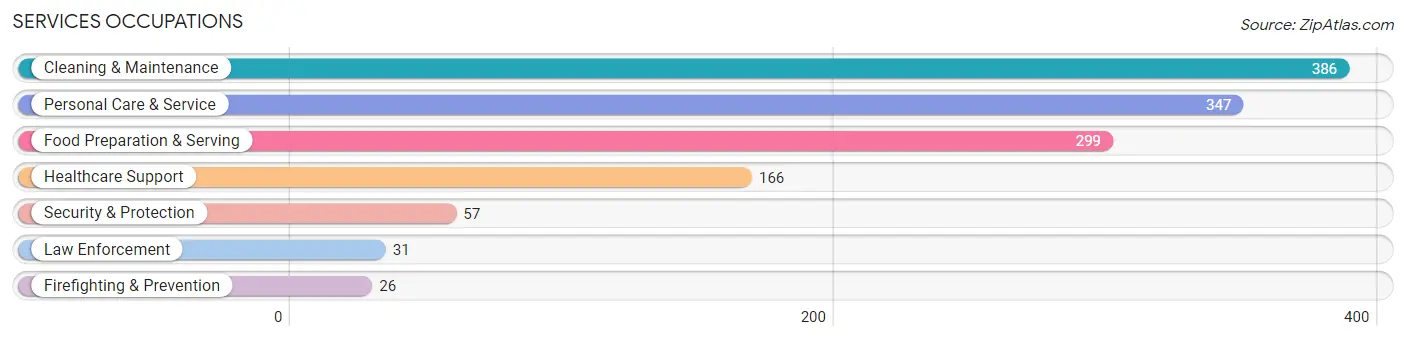
The most common Services occupations in Sulphur Springs are Cleaning & Maintenance (386 | 5.1%), Personal Care & Service (347 | 4.6%), Food Preparation & Serving (299 | 4.0%), Healthcare Support (166 | 2.2%), and Security & Protection (57 | 0.7%).
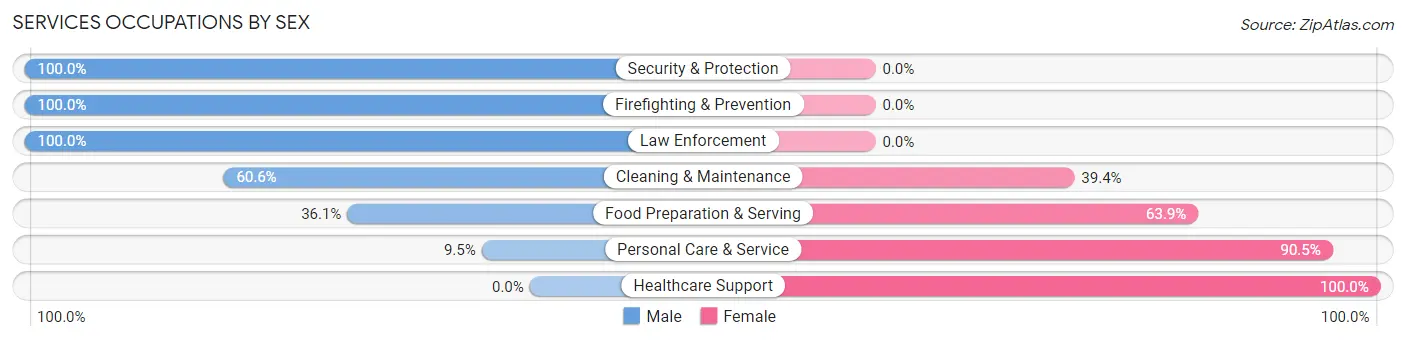
Services Occupations by Sex
Within the Services occupations in Sulphur Springs, the most male-oriented occupations are Security & Protection (100.0%), Firefighting & Prevention (100.0%), and Law Enforcement (100.0%), while the most female-oriented occupations are Healthcare Support (100.0%), Personal Care & Service (90.5%), and Food Preparation & Serving (63.9%).
| Occupation | Male | Female |
| Healthcare Support | 0 (0.0%) | 166 (100.0%) |
| Security & Protection | 57 (100.0%) | 0 (0.0%) |
| Firefighting & Prevention | 26 (100.0%) | 0 (0.0%) |
| Law Enforcement | 31 (100.0%) | 0 (0.0%) |
| Food Preparation & Serving | 108 (36.1%) | 191 (63.9%) |
| Cleaning & Maintenance | 234 (60.6%) | 152 (39.4%) |
| Personal Care & Service | 33 (9.5%) | 314 (90.5%) |
| Total (Category) | 432 (34.4%) | 823 (65.6%) |
| Total (Overall) | 3,985 (52.6%) | 3,587 (47.4%) |
Sales and Office Occupations
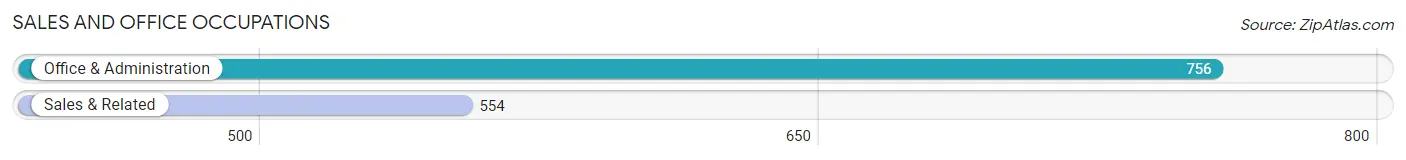
The most common Sales and Office occupations in Sulphur Springs are Office & Administration (756 | 10.0%), and Sales & Related (554 | 7.3%).
Sales and Office Occupations by Sex
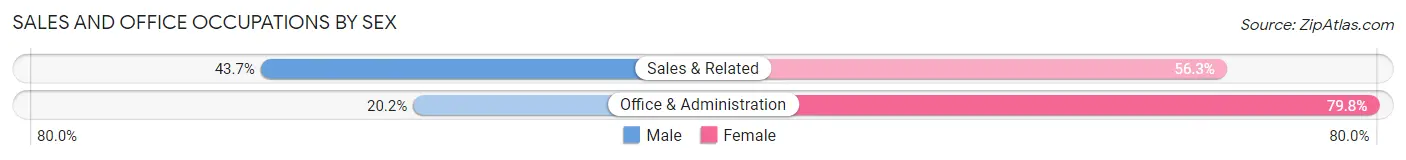
| Occupation | Male | Female |
| Sales & Related | 242 (43.7%) | 312 (56.3%) |
| Office & Administration | 153 (20.2%) | 603 (79.8%) |
| Total (Category) | 395 (30.1%) | 915 (69.9%) |
| Total (Overall) | 3,985 (52.6%) | 3,587 (47.4%) |
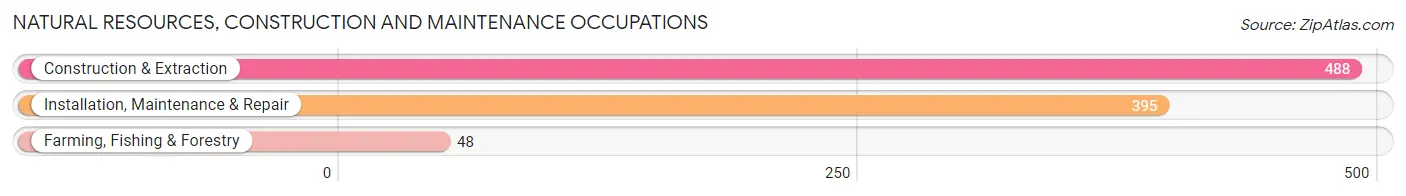
Natural Resources, Construction and Maintenance Occupations
The most common Natural Resources, Construction and Maintenance occupations in Sulphur Springs are Construction & Extraction (488 | 6.4%), Installation, Maintenance & Repair (395 | 5.2%), and Farming, Fishing & Forestry (48 | 0.6%).
Natural Resources, Construction and Maintenance Occupations by Sex
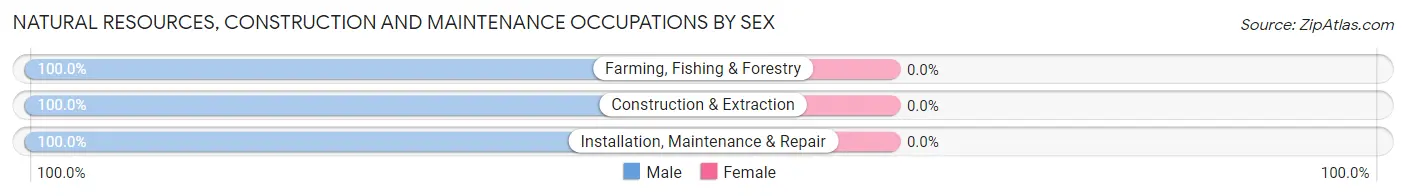
| Occupation | Male | Female |
| Farming, Fishing & Forestry | 48 (100.0%) | 0 (0.0%) |
| Construction & Extraction | 488 (100.0%) | 0 (0.0%) |
| Installation, Maintenance & Repair | 395 (100.0%) | 0 (0.0%) |
| Total (Category) | 931 (100.0%) | 0 (0.0%) |
| Total (Overall) | 3,985 (52.6%) | 3,587 (47.4%) |
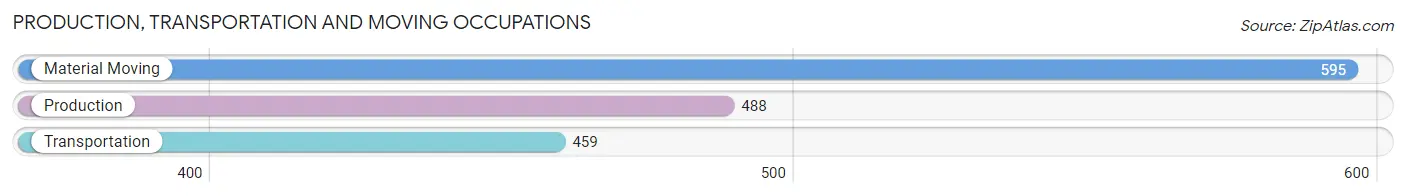
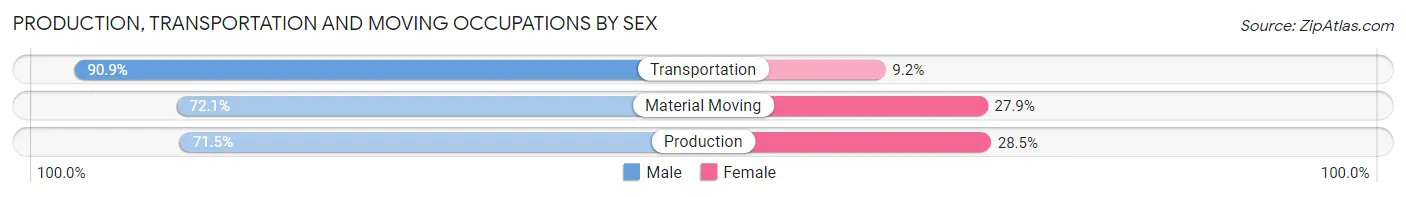
Production, Transportation and Moving Occupations
The most common Production, Transportation and Moving occupations in Sulphur Springs are Material Moving (595 | 7.9%), Production (488 | 6.4%), and Transportation (459 | 6.1%).
Production, Transportation and Moving Occupations by Sex
| Occupation | Male | Female |
| Production | 349 (71.5%) | 139 (28.5%) |
| Transportation | 417 (90.8%) | 42 (9.1%) |
| Material Moving | 429 (72.1%) | 166 (27.9%) |
| Total (Category) | 1,195 (77.5%) | 347 (22.5%) |
| Total (Overall) | 3,985 (52.6%) | 3,587 (47.4%) |
Employment Industries by Sex in Sulphur Springs
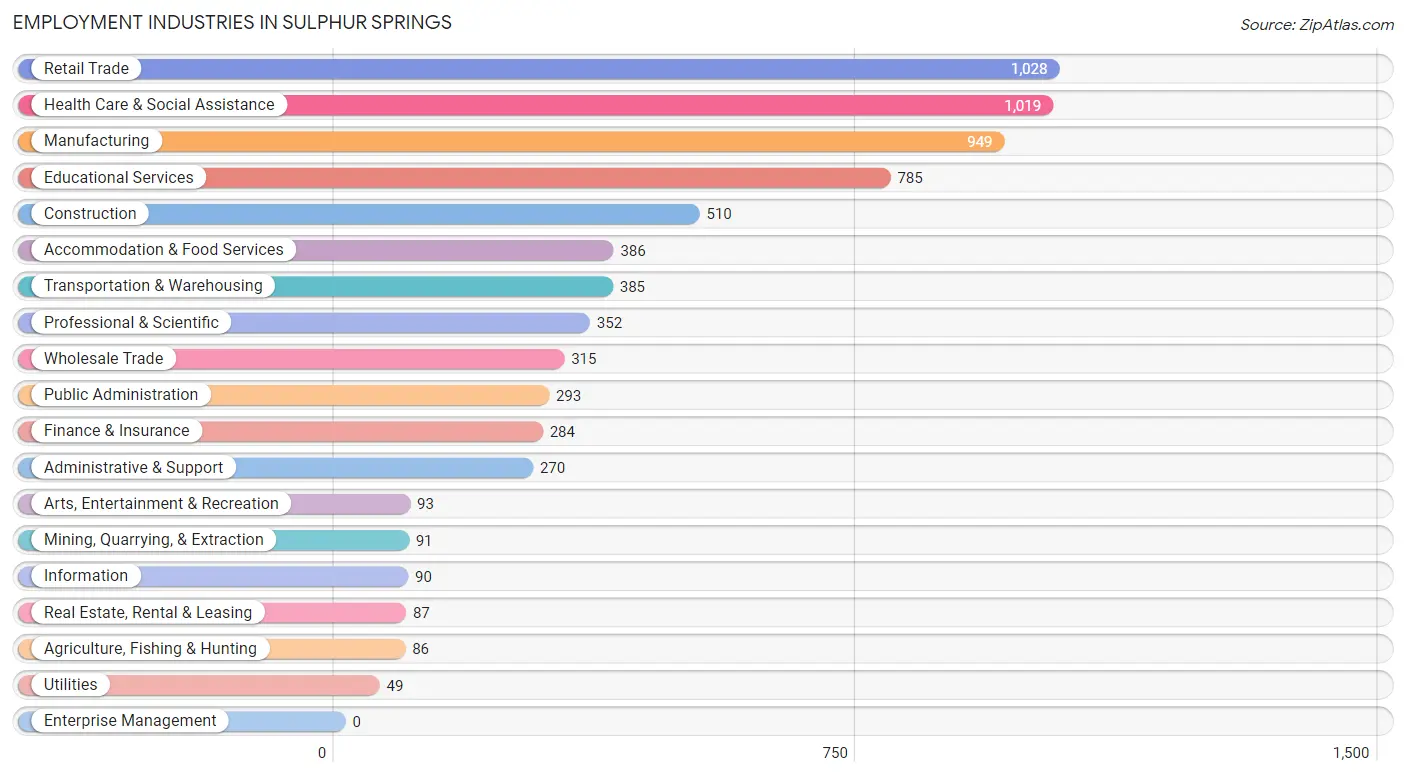
Employment Industries in Sulphur Springs
The major employment industries in Sulphur Springs include Retail Trade (1,028 | 13.6%), Health Care & Social Assistance (1,019 | 13.5%), Manufacturing (949 | 12.5%), Educational Services (785 | 10.4%), and Construction (510 | 6.7%).
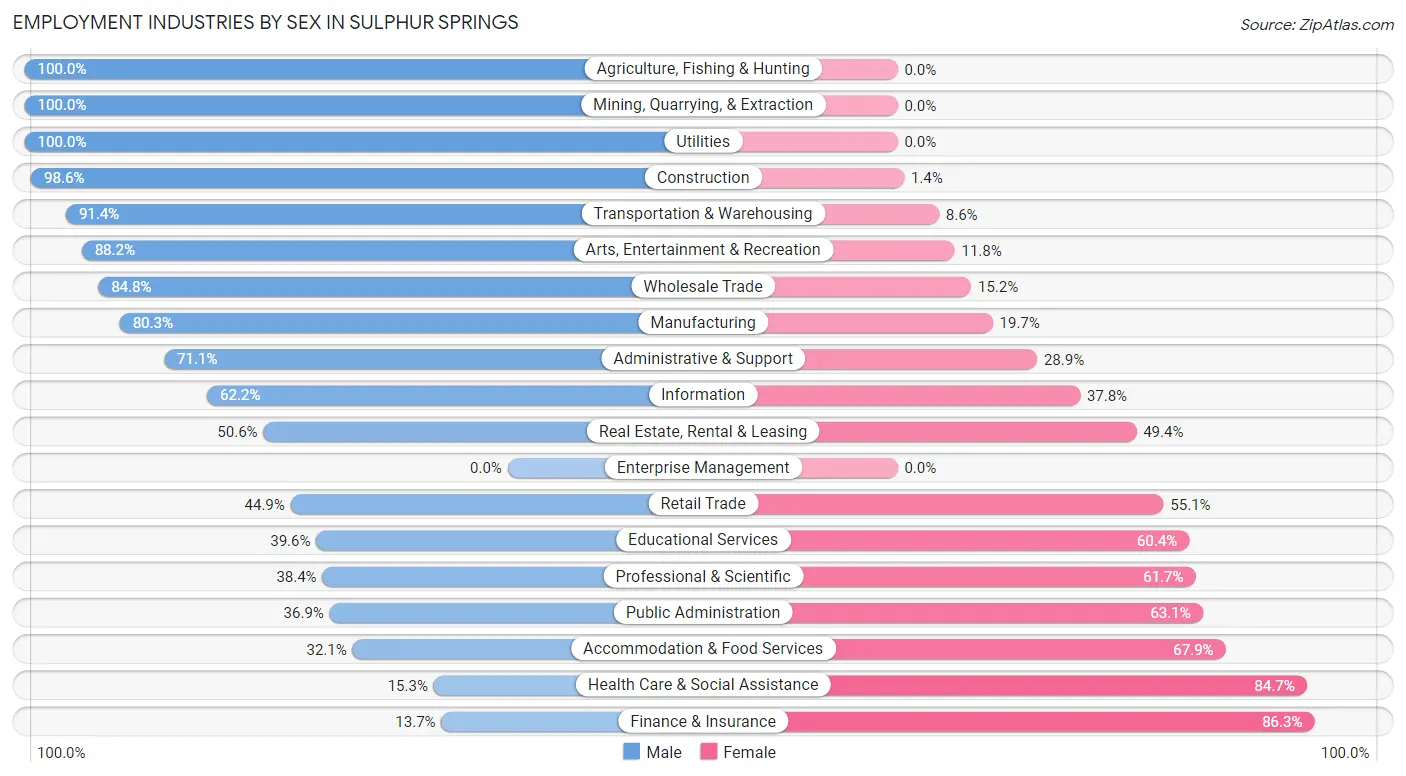
Employment Industries by Sex in Sulphur Springs
The Sulphur Springs industries that see more men than women are Agriculture, Fishing & Hunting (100.0%), Mining, Quarrying, & Extraction (100.0%), and Utilities (100.0%), whereas the industries that tend to have a higher number of women are Finance & Insurance (86.3%), Health Care & Social Assistance (84.7%), and Accommodation & Food Services (67.9%).
| Industry | Male | Female |
| Agriculture, Fishing & Hunting | 86 (100.0%) | 0 (0.0%) |
| Mining, Quarrying, & Extraction | 91 (100.0%) | 0 (0.0%) |
| Construction | 503 (98.6%) | 7 (1.4%) |
| Manufacturing | 762 (80.3%) | 187 (19.7%) |
| Wholesale Trade | 267 (84.8%) | 48 (15.2%) |
| Retail Trade | 462 (44.9%) | 566 (55.1%) |
| Transportation & Warehousing | 352 (91.4%) | 33 (8.6%) |
| Utilities | 49 (100.0%) | 0 (0.0%) |
| Information | 56 (62.2%) | 34 (37.8%) |
| Finance & Insurance | 39 (13.7%) | 245 (86.3%) |
| Real Estate, Rental & Leasing | 44 (50.6%) | 43 (49.4%) |
| Professional & Scientific | 135 (38.4%) | 217 (61.7%) |
| Enterprise Management | 0 (0.0%) | 0 (0.0%) |
| Administrative & Support | 192 (71.1%) | 78 (28.9%) |
| Educational Services | 311 (39.6%) | 474 (60.4%) |
| Health Care & Social Assistance | 156 (15.3%) | 863 (84.7%) |
| Arts, Entertainment & Recreation | 82 (88.2%) | 11 (11.8%) |
| Accommodation & Food Services | 124 (32.1%) | 262 (67.9%) |
| Public Administration | 108 (36.9%) | 185 (63.1%) |
| Total | 3,985 (52.6%) | 3,587 (47.4%) |
Education in Sulphur Springs
School Enrollment in Sulphur Springs
The most common levels of schooling among the 3,845 students in Sulphur Springs are elementary school (938 | 24.4%), middle school (911 | 23.7%), and high school (909 | 23.6%).

| School Level | # Students | % Students |
| Nursery / Preschool | 243 | 6.3% |
| Kindergarten | 213 | 5.5% |
| Elementary School | 938 | 24.4% |
| Middle School | 911 | 23.7% |
| High School | 909 | 23.6% |
| College / Undergraduate | 500 | 13.0% |
| Graduate / Professional | 131 | 3.4% |
| Total | 3,845 | 100.0% |
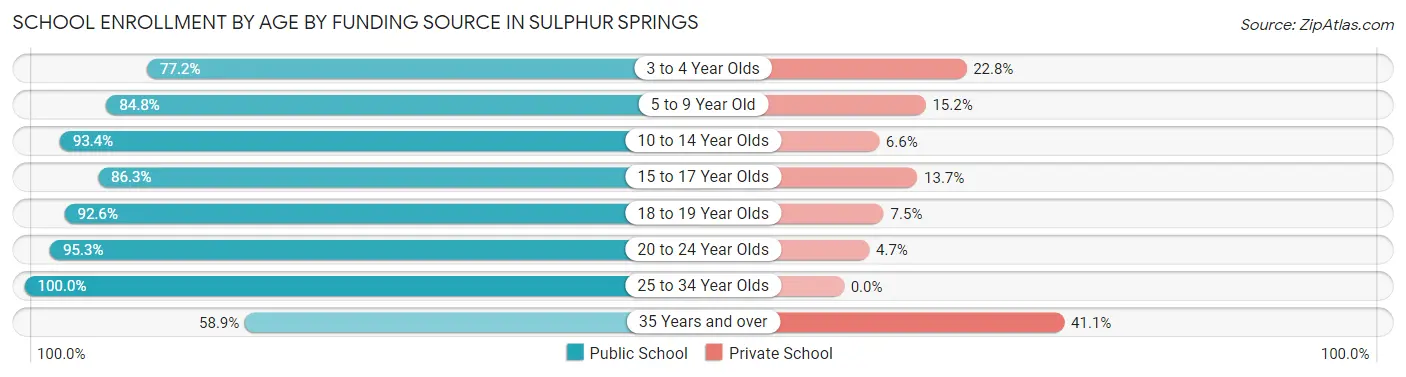
School Enrollment by Age by Funding Source in Sulphur Springs
Out of a total of 3,845 students who are enrolled in schools in Sulphur Springs, 461 (12.0%) attend a private institution, while the remaining 3,384 (88.0%) are enrolled in public schools. The age group of 35 years and over has the highest likelihood of being enrolled in private schools, with 46 (41.1% in the age bracket) enrolled. Conversely, the age group of 25 to 34 year olds has the lowest likelihood of being enrolled in a private school, with 83 (100.0% in the age bracket) attending a public institution.
| Age Bracket | Public School | Private School |
| 3 to 4 Year Olds | 159 (77.2%) | 47 (22.8%) |
| 5 to 9 Year Old | 940 (84.8%) | 169 (15.2%) |
| 10 to 14 Year Olds | 940 (93.4%) | 66 (6.6%) |
| 15 to 17 Year Olds | 612 (86.3%) | 97 (13.7%) |
| 18 to 19 Year Olds | 261 (92.5%) | 21 (7.4%) |
| 20 to 24 Year Olds | 322 (95.3%) | 16 (4.7%) |
| 25 to 34 Year Olds | 83 (100.0%) | 0 (0.0%) |
| 35 Years and over | 66 (58.9%) | 46 (41.1%) |
| Total | 3,384 (88.0%) | 461 (12.0%) |
Educational Attainment by Field of Study in Sulphur Springs
Education (473 | 19.2%), business (444 | 18.0%), science & technology (294 | 11.9%), bio, nature & agricultural (241 | 9.8%), and arts & humanities (223 | 9.1%) are the most common fields of study among 2,461 individuals in Sulphur Springs who have obtained a bachelor's degree or higher.
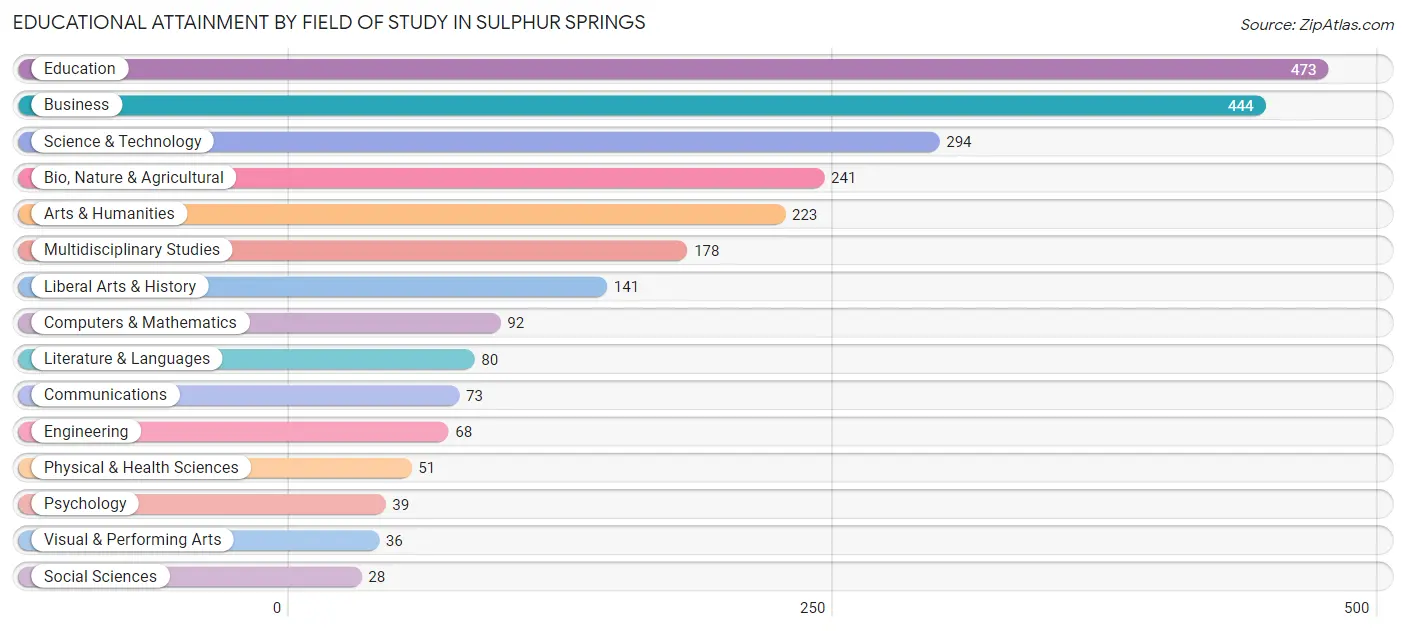
| Field of Study | # Graduates | % Graduates |
| Computers & Mathematics | 92 | 3.7% |
| Bio, Nature & Agricultural | 241 | 9.8% |
| Physical & Health Sciences | 51 | 2.1% |
| Psychology | 39 | 1.6% |
| Social Sciences | 28 | 1.1% |
| Engineering | 68 | 2.8% |
| Multidisciplinary Studies | 178 | 7.2% |
| Science & Technology | 294 | 11.9% |
| Business | 444 | 18.0% |
| Education | 473 | 19.2% |
| Literature & Languages | 80 | 3.3% |
| Liberal Arts & History | 141 | 5.7% |
| Visual & Performing Arts | 36 | 1.5% |
| Communications | 73 | 3.0% |
| Arts & Humanities | 223 | 9.1% |
| Total | 2,461 | 100.0% |
Transportation & Commute in Sulphur Springs
Vehicle Availability by Sex in Sulphur Springs
The most prevalent vehicle ownership categories in Sulphur Springs are males with 2 vehicles (1,516, accounting for 38.5%) and females with 2 vehicles (1,567, making up 43.3%).
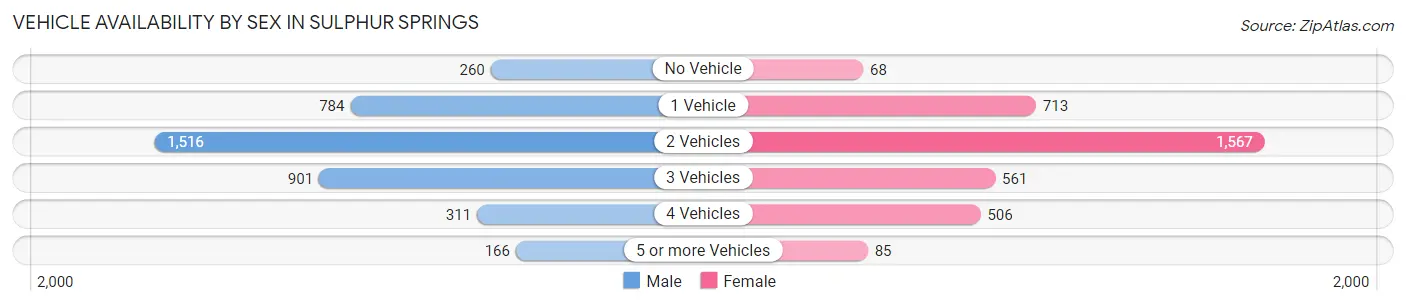
| Vehicles Available | Male | Female |
| No Vehicle | 260 (6.6%) | 68 (1.9%) |
| 1 Vehicle | 784 (19.9%) | 713 (20.4%) |
| 2 Vehicles | 1,516 (38.5%) | 1,567 (44.8%) |
| 3 Vehicles | 901 (22.9%) | 561 (16.0%) |
| 4 Vehicles | 311 (7.9%) | 506 (14.5%) |
| 5 or more Vehicles | 166 (4.2%) | 85 (2.4%) |
| Total | 3,938 (100.0%) | 3,500 (100.0%) |
Commute Time in Sulphur Springs
The most frequently occuring commute durations in Sulphur Springs are 5 to 9 minutes (2,360 commuters, 33.2%), 10 to 14 minutes (1,829 commuters, 25.7%), and 15 to 19 minutes (684 commuters, 9.6%).
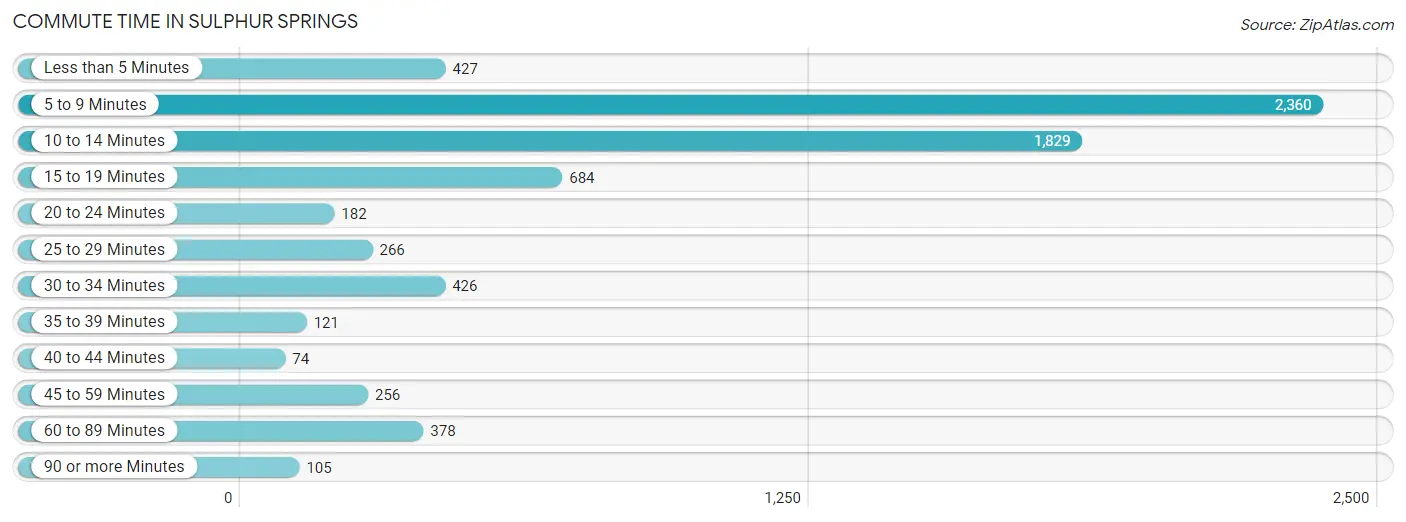
| Commute Time | # Commuters | % Commuters |
| Less than 5 Minutes | 427 | 6.0% |
| 5 to 9 Minutes | 2,360 | 33.2% |
| 10 to 14 Minutes | 1,829 | 25.7% |
| 15 to 19 Minutes | 684 | 9.6% |
| 20 to 24 Minutes | 182 | 2.6% |
| 25 to 29 Minutes | 266 | 3.7% |
| 30 to 34 Minutes | 426 | 6.0% |
| 35 to 39 Minutes | 121 | 1.7% |
| 40 to 44 Minutes | 74 | 1.0% |
| 45 to 59 Minutes | 256 | 3.6% |
| 60 to 89 Minutes | 378 | 5.3% |
| 90 or more Minutes | 105 | 1.5% |
Commute Time by Sex in Sulphur Springs
The most common commute times in Sulphur Springs are 5 to 9 minutes (1,121 commuters, 29.2%) for males and 5 to 9 minutes (1,239 commuters, 38.0%) for females.
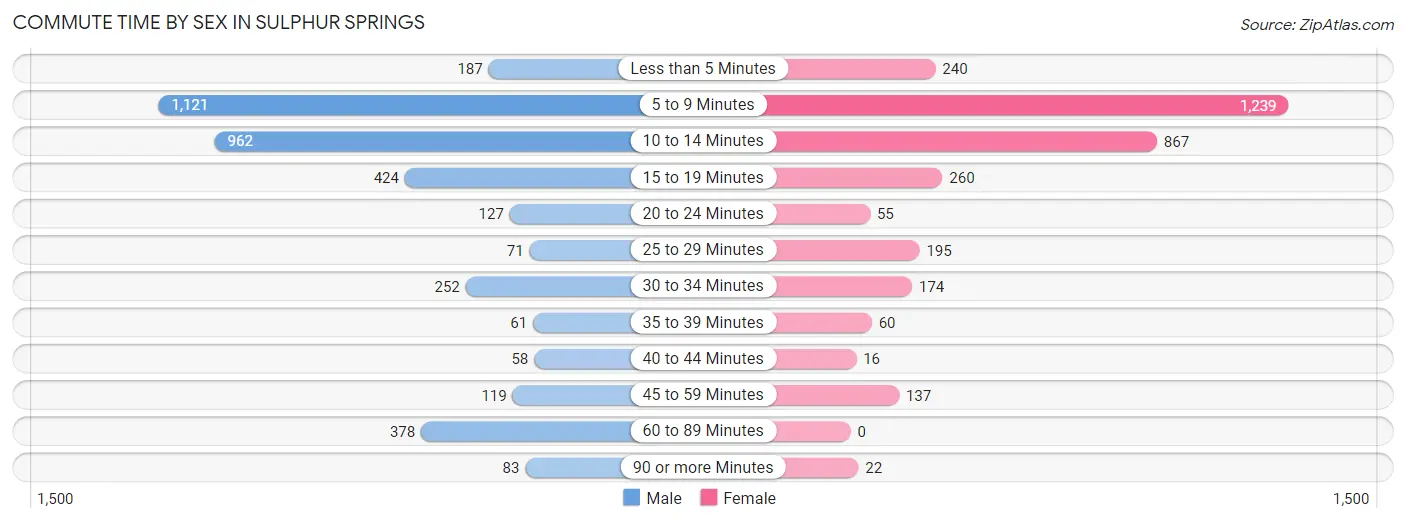
| Commute Time | Male | Female |
| Less than 5 Minutes | 187 (4.9%) | 240 (7.3%) |
| 5 to 9 Minutes | 1,121 (29.2%) | 1,239 (38.0%) |
| 10 to 14 Minutes | 962 (25.0%) | 867 (26.6%) |
| 15 to 19 Minutes | 424 (11.0%) | 260 (8.0%) |
| 20 to 24 Minutes | 127 (3.3%) | 55 (1.7%) |
| 25 to 29 Minutes | 71 (1.8%) | 195 (6.0%) |
| 30 to 34 Minutes | 252 (6.6%) | 174 (5.3%) |
| 35 to 39 Minutes | 61 (1.6%) | 60 (1.8%) |
| 40 to 44 Minutes | 58 (1.5%) | 16 (0.5%) |
| 45 to 59 Minutes | 119 (3.1%) | 137 (4.2%) |
| 60 to 89 Minutes | 378 (9.8%) | 0 (0.0%) |
| 90 or more Minutes | 83 (2.2%) | 22 (0.7%) |
Time of Departure to Work by Sex in Sulphur Springs
The most frequent times of departure to work in Sulphur Springs are 12:00 AM to 4:59 AM (565, 14.7%) for males and 7:00 AM to 7:29 AM (849, 26.0%) for females.
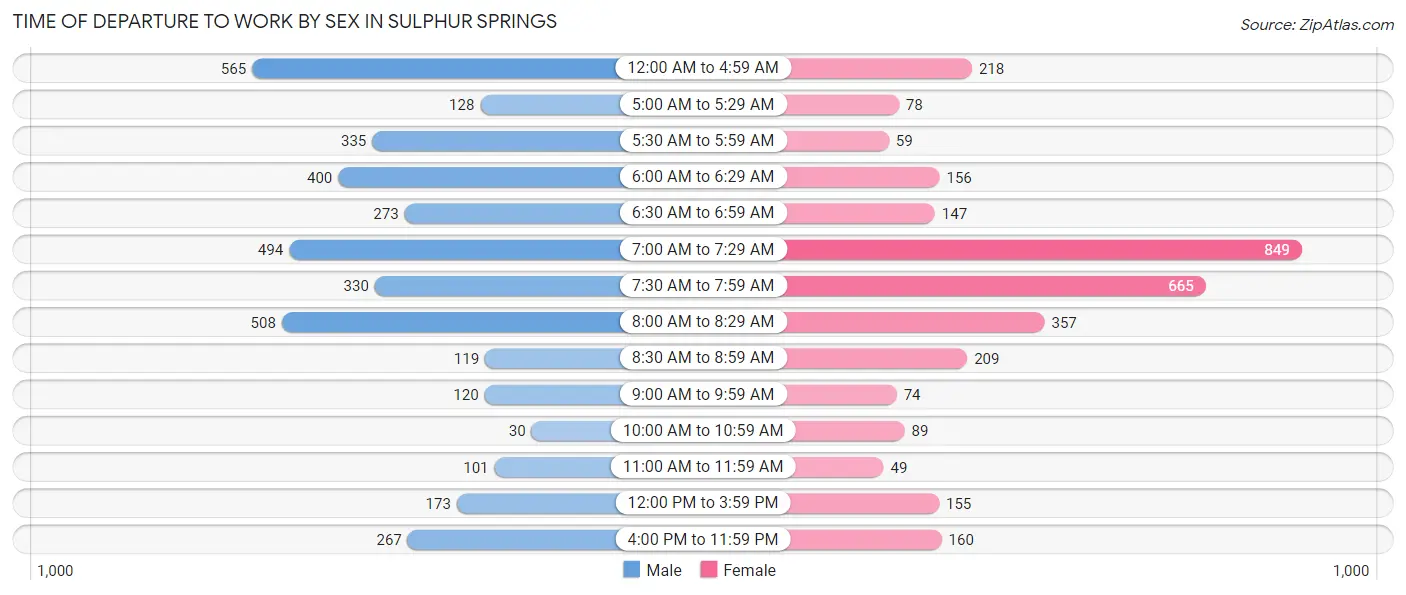
| Time of Departure | Male | Female |
| 12:00 AM to 4:59 AM | 565 (14.7%) | 218 (6.7%) |
| 5:00 AM to 5:29 AM | 128 (3.3%) | 78 (2.4%) |
| 5:30 AM to 5:59 AM | 335 (8.7%) | 59 (1.8%) |
| 6:00 AM to 6:29 AM | 400 (10.4%) | 156 (4.8%) |
| 6:30 AM to 6:59 AM | 273 (7.1%) | 147 (4.5%) |
| 7:00 AM to 7:29 AM | 494 (12.9%) | 849 (26.0%) |
| 7:30 AM to 7:59 AM | 330 (8.6%) | 665 (20.4%) |
| 8:00 AM to 8:29 AM | 508 (13.2%) | 357 (10.9%) |
| 8:30 AM to 8:59 AM | 119 (3.1%) | 209 (6.4%) |
| 9:00 AM to 9:59 AM | 120 (3.1%) | 74 (2.3%) |
| 10:00 AM to 10:59 AM | 30 (0.8%) | 89 (2.7%) |
| 11:00 AM to 11:59 AM | 101 (2.6%) | 49 (1.5%) |
| 12:00 PM to 3:59 PM | 173 (4.5%) | 155 (4.8%) |
| 4:00 PM to 11:59 PM | 267 (7.0%) | 160 (4.9%) |
| Total | 3,843 (100.0%) | 3,265 (100.0%) |
Housing Occupancy in Sulphur Springs
Occupancy by Ownership in Sulphur Springs
Of the total 6,271 dwellings in Sulphur Springs, owner-occupied units account for 3,448 (55.0%), while renter-occupied units make up 2,823 (45.0%).
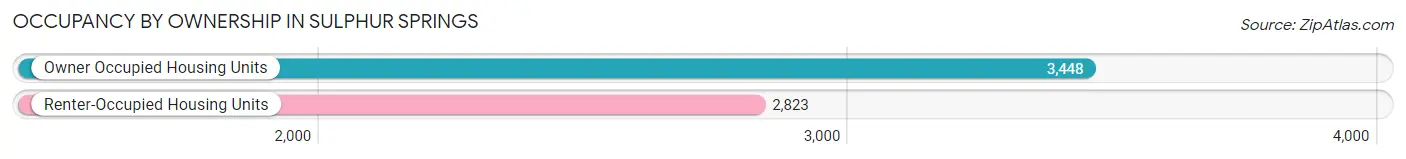
| Occupancy | # Housing Units | % Housing Units |
| Owner Occupied Housing Units | 3,448 | 55.0% |
| Renter-Occupied Housing Units | 2,823 | 45.0% |
| Total Occupied Housing Units | 6,271 | 100.0% |
Occupancy by Household Size in Sulphur Springs
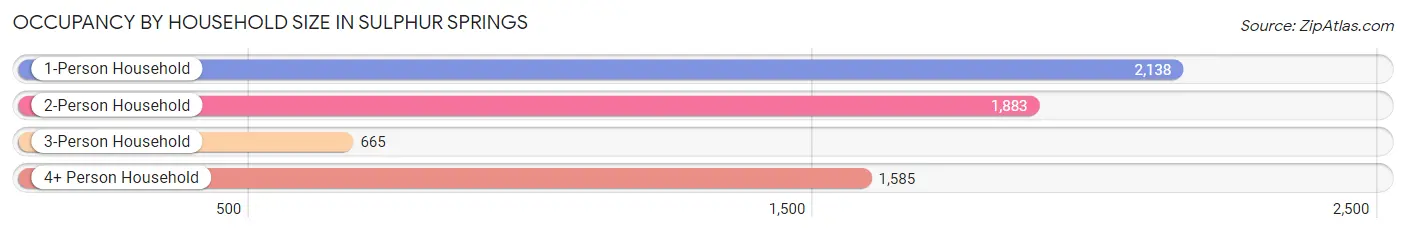
| Household Size | # Housing Units | % Housing Units |
| 1-Person Household | 2,138 | 34.1% |
| 2-Person Household | 1,883 | 30.0% |
| 3-Person Household | 665 | 10.6% |
| 4+ Person Household | 1,585 | 25.3% |
| Total Housing Units | 6,271 | 100.0% |
Occupancy by Ownership by Household Size in Sulphur Springs
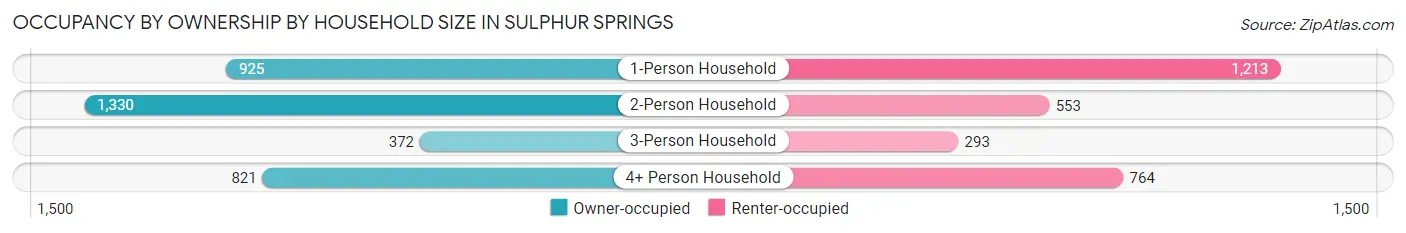
| Household Size | Owner-occupied | Renter-occupied |
| 1-Person Household | 925 (43.3%) | 1,213 (56.7%) |
| 2-Person Household | 1,330 (70.6%) | 553 (29.4%) |
| 3-Person Household | 372 (55.9%) | 293 (44.1%) |
| 4+ Person Household | 821 (51.8%) | 764 (48.2%) |
| Total Housing Units | 3,448 (55.0%) | 2,823 (45.0%) |
Occupancy by Educational Attainment in Sulphur Springs
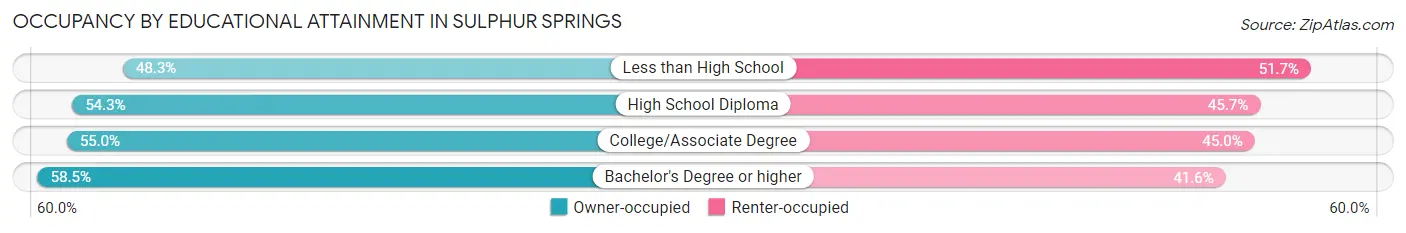
| Household Size | Owner-occupied | Renter-occupied |
| Less than High School | 299 (48.3%) | 320 (51.7%) |
| High School Diploma | 1,003 (54.3%) | 843 (45.7%) |
| College/Associate Degree | 1,250 (55.0%) | 1,023 (45.0%) |
| Bachelor's Degree or higher | 896 (58.5%) | 637 (41.5%) |
Occupancy by Age of Householder in Sulphur Springs
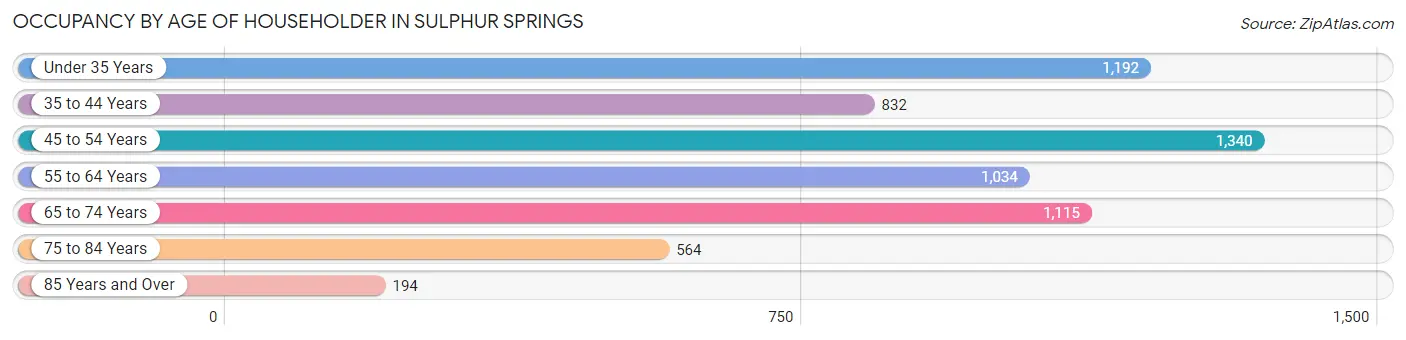
| Age Bracket | # Households | % Households |
| Under 35 Years | 1,192 | 19.0% |
| 35 to 44 Years | 832 | 13.3% |
| 45 to 54 Years | 1,340 | 21.4% |
| 55 to 64 Years | 1,034 | 16.5% |
| 65 to 74 Years | 1,115 | 17.8% |
| 75 to 84 Years | 564 | 9.0% |
| 85 Years and Over | 194 | 3.1% |
| Total | 6,271 | 100.0% |
Housing Finances in Sulphur Springs
Median Income by Occupancy in Sulphur Springs
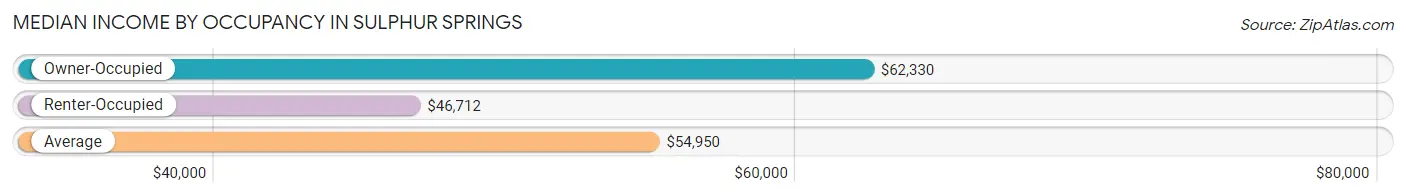
| Occupancy Type | # Households | Median Income |
| Owner-Occupied | 3,448 (55.0%) | $62,330 |
| Renter-Occupied | 2,823 (45.0%) | $46,712 |
| Average | 6,271 (100.0%) | $54,950 |
Occupancy by Householder Income Bracket in Sulphur Springs
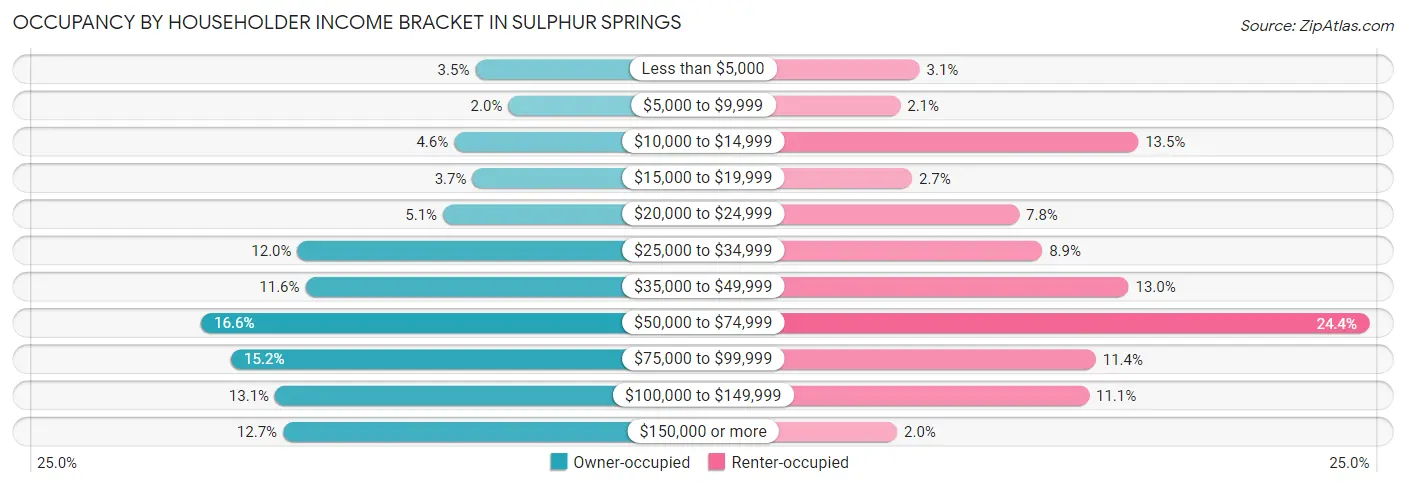
| Income Bracket | Owner-occupied | Renter-occupied |
| Less than $5,000 | 122 (3.5%) | 86 (3.0%) |
| $5,000 to $9,999 | 68 (2.0%) | 60 (2.1%) |
| $10,000 to $14,999 | 157 (4.5%) | 380 (13.5%) |
| $15,000 to $19,999 | 127 (3.7%) | 76 (2.7%) |
| $20,000 to $24,999 | 175 (5.1%) | 220 (7.8%) |
| $25,000 to $34,999 | 414 (12.0%) | 251 (8.9%) |
| $35,000 to $49,999 | 401 (11.6%) | 367 (13.0%) |
| $50,000 to $74,999 | 572 (16.6%) | 690 (24.4%) |
| $75,000 to $99,999 | 523 (15.2%) | 323 (11.4%) |
| $100,000 to $149,999 | 451 (13.1%) | 314 (11.1%) |
| $150,000 or more | 438 (12.7%) | 56 (2.0%) |
| Total | 3,448 (100.0%) | 2,823 (100.0%) |
Monthly Housing Cost Tiers in Sulphur Springs
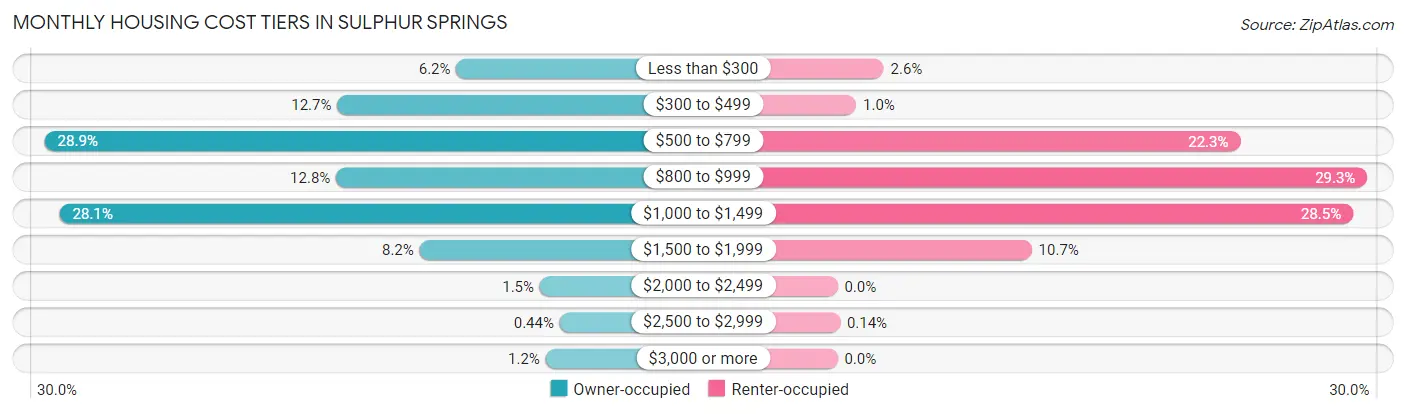
| Monthly Cost | Owner-occupied | Renter-occupied |
| Less than $300 | 212 (6.1%) | 72 (2.5%) |
| $300 to $499 | 439 (12.7%) | 29 (1.0%) |
| $500 to $799 | 996 (28.9%) | 628 (22.3%) |
| $800 to $999 | 441 (12.8%) | 826 (29.3%) |
| $1,000 to $1,499 | 968 (28.1%) | 804 (28.5%) |
| $1,500 to $1,999 | 282 (8.2%) | 303 (10.7%) |
| $2,000 to $2,499 | 53 (1.5%) | 0 (0.0%) |
| $2,500 to $2,999 | 15 (0.4%) | 4 (0.1%) |
| $3,000 or more | 42 (1.2%) | 0 (0.0%) |
| Total | 3,448 (100.0%) | 2,823 (100.0%) |
Physical Housing Characteristics in Sulphur Springs
Housing Structures in Sulphur Springs
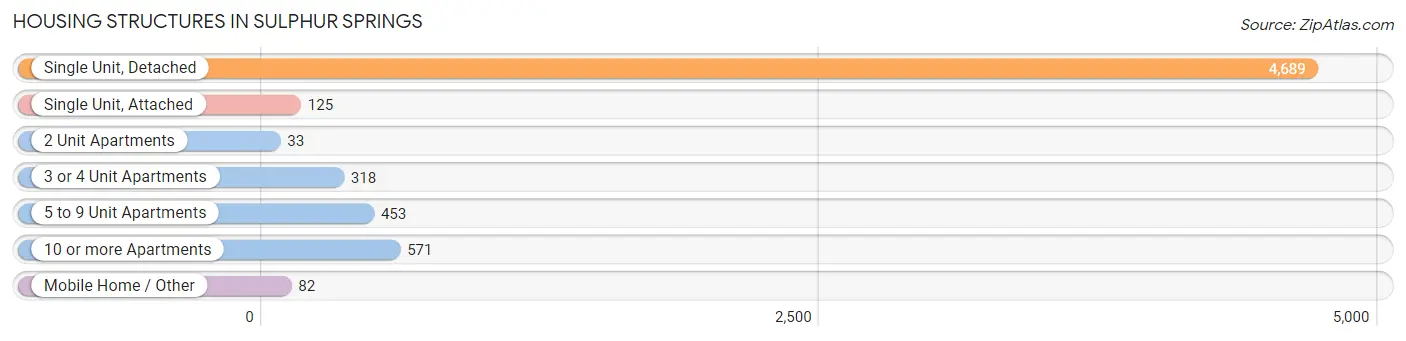
| Structure Type | # Housing Units | % Housing Units |
| Single Unit, Detached | 4,689 | 74.8% |
| Single Unit, Attached | 125 | 2.0% |
| 2 Unit Apartments | 33 | 0.5% |
| 3 or 4 Unit Apartments | 318 | 5.1% |
| 5 to 9 Unit Apartments | 453 | 7.2% |
| 10 or more Apartments | 571 | 9.1% |
| Mobile Home / Other | 82 | 1.3% |
| Total | 6,271 | 100.0% |
Housing Structures by Occupancy in Sulphur Springs
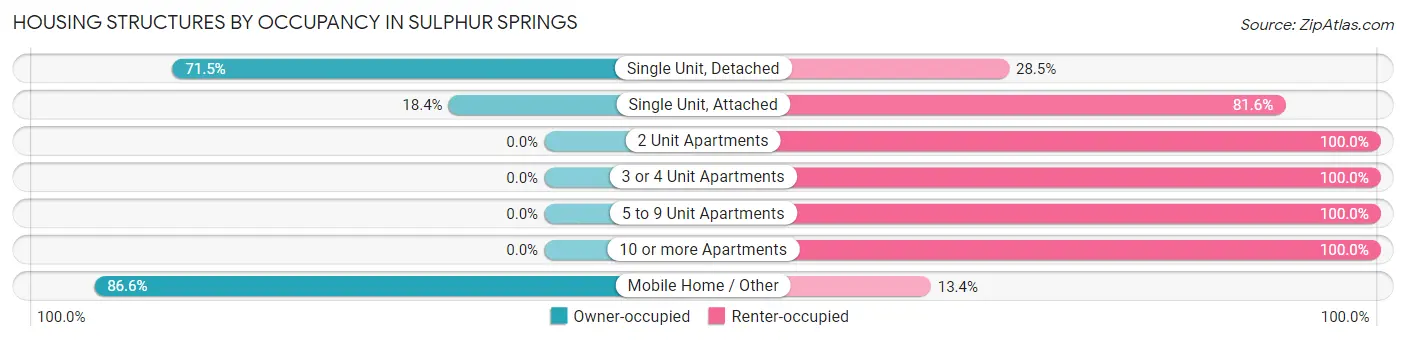
| Structure Type | Owner-occupied | Renter-occupied |
| Single Unit, Detached | 3,354 (71.5%) | 1,335 (28.5%) |
| Single Unit, Attached | 23 (18.4%) | 102 (81.6%) |
| 2 Unit Apartments | 0 (0.0%) | 33 (100.0%) |
| 3 or 4 Unit Apartments | 0 (0.0%) | 318 (100.0%) |
| 5 to 9 Unit Apartments | 0 (0.0%) | 453 (100.0%) |
| 10 or more Apartments | 0 (0.0%) | 571 (100.0%) |
| Mobile Home / Other | 71 (86.6%) | 11 (13.4%) |
| Total | 3,448 (55.0%) | 2,823 (45.0%) |
Housing Structures by Number of Rooms in Sulphur Springs
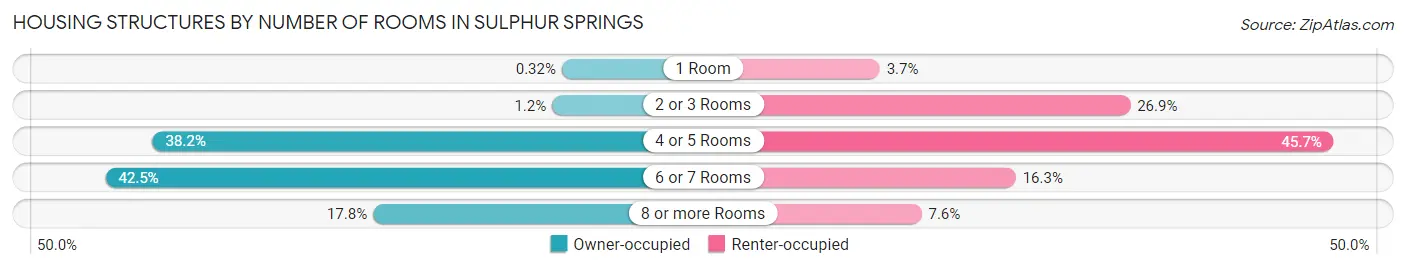
| Number of Rooms | Owner-occupied | Renter-occupied |
| 1 Room | 11 (0.3%) | 104 (3.7%) |
| 2 or 3 Rooms | 42 (1.2%) | 758 (26.9%) |
| 4 or 5 Rooms | 1,316 (38.2%) | 1,289 (45.7%) |
| 6 or 7 Rooms | 1,466 (42.5%) | 459 (16.3%) |
| 8 or more Rooms | 613 (17.8%) | 213 (7.5%) |
| Total | 3,448 (100.0%) | 2,823 (100.0%) |
Housing Structure by Heating Type in Sulphur Springs
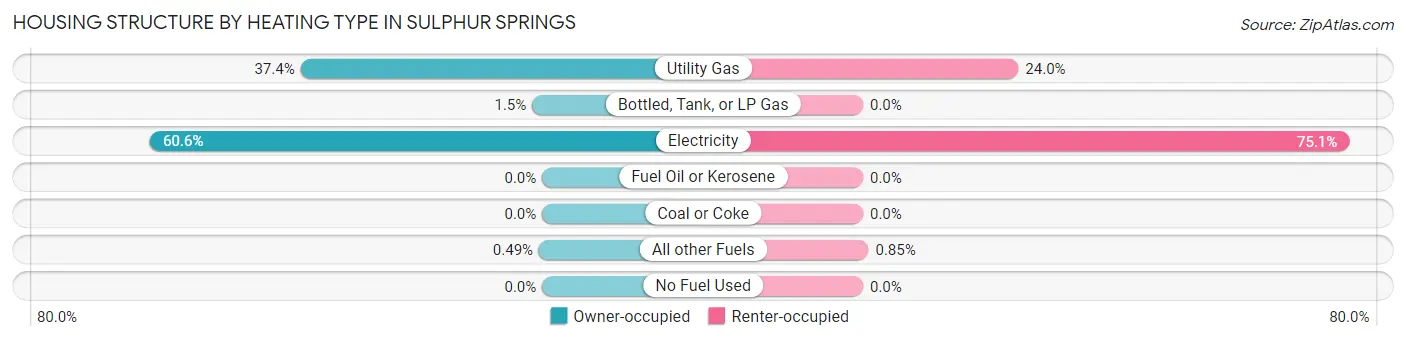
| Heating Type | Owner-occupied | Renter-occupied |
| Utility Gas | 1,288 (37.3%) | 678 (24.0%) |
| Bottled, Tank, or LP Gas | 53 (1.5%) | 0 (0.0%) |
| Electricity | 2,090 (60.6%) | 2,121 (75.1%) |
| Fuel Oil or Kerosene | 0 (0.0%) | 0 (0.0%) |
| Coal or Coke | 0 (0.0%) | 0 (0.0%) |
| All other Fuels | 17 (0.5%) | 24 (0.9%) |
| No Fuel Used | 0 (0.0%) | 0 (0.0%) |
| Total | 3,448 (100.0%) | 2,823 (100.0%) |
Household Vehicle Usage in Sulphur Springs
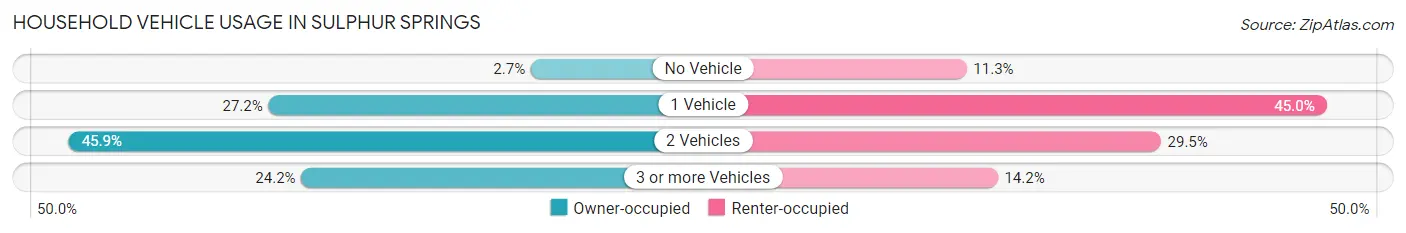
| Vehicles per Household | Owner-occupied | Renter-occupied |
| No Vehicle | 94 (2.7%) | 320 (11.3%) |
| 1 Vehicle | 939 (27.2%) | 1,269 (45.0%) |
| 2 Vehicles | 1,582 (45.9%) | 832 (29.5%) |
| 3 or more Vehicles | 833 (24.2%) | 402 (14.2%) |
| Total | 3,448 (100.0%) | 2,823 (100.0%) |
Real Estate & Mortgages in Sulphur Springs
Real Estate and Mortgage Overview in Sulphur Springs
| Characteristic | Without Mortgage | With Mortgage |
| Housing Units | 1,905 | 1,543 |
| Median Property Value | $170,700 | $174,600 |
| Median Household Income | $45,513 | $249 |
| Monthly Housing Costs | $558 | $42 |
| Real Estate Taxes | $1,907 | $51 |
Property Value by Mortgage Status in Sulphur Springs
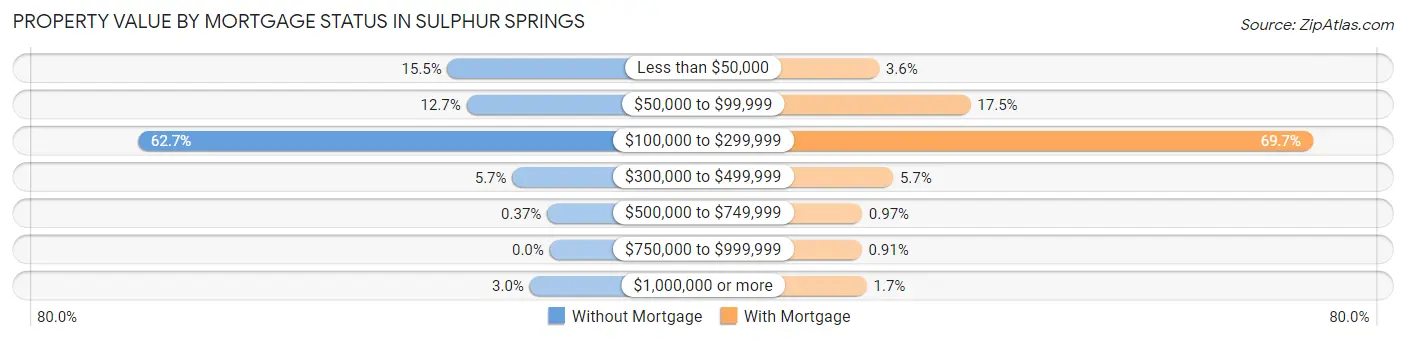
| Property Value | Without Mortgage | With Mortgage |
| Less than $50,000 | 296 (15.5%) | 55 (3.6%) |
| $50,000 to $99,999 | 241 (12.7%) | 270 (17.5%) |
| $100,000 to $299,999 | 1,195 (62.7%) | 1,075 (69.7%) |
| $300,000 to $499,999 | 108 (5.7%) | 88 (5.7%) |
| $500,000 to $749,999 | 7 (0.4%) | 15 (1.0%) |
| $750,000 to $999,999 | 0 (0.0%) | 14 (0.9%) |
| $1,000,000 or more | 58 (3.0%) | 26 (1.7%) |
| Total | 1,905 (100.0%) | 1,543 (100.0%) |
Household Income by Mortgage Status in Sulphur Springs
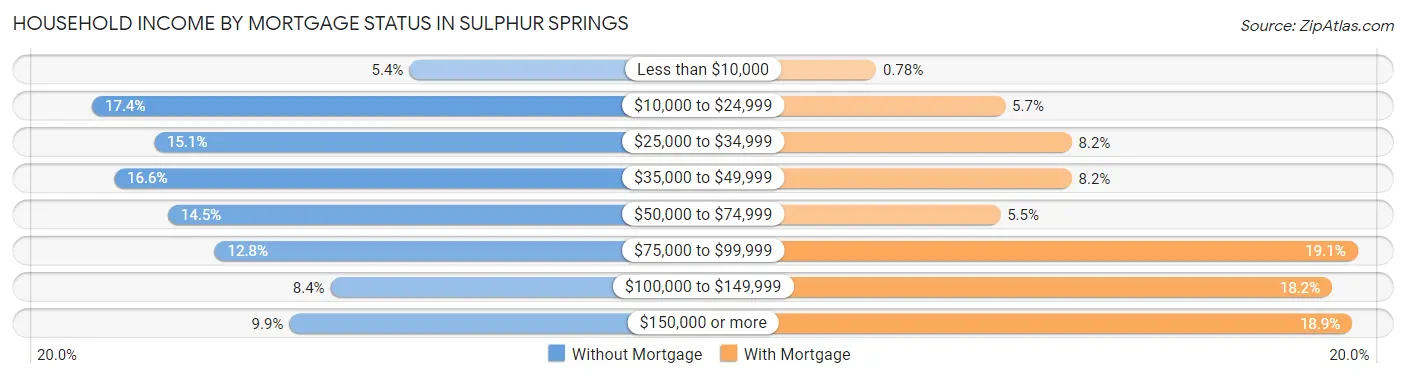
| Household Income | Without Mortgage | With Mortgage |
| Less than $10,000 | 102 (5.3%) | 12 (0.8%) |
| $10,000 to $24,999 | 332 (17.4%) | 88 (5.7%) |
| $25,000 to $34,999 | 287 (15.1%) | 127 (8.2%) |
| $35,000 to $49,999 | 316 (16.6%) | 127 (8.2%) |
| $50,000 to $74,999 | 277 (14.5%) | 85 (5.5%) |
| $75,000 to $99,999 | 243 (12.8%) | 295 (19.1%) |
| $100,000 to $149,999 | 159 (8.4%) | 280 (18.1%) |
| $150,000 or more | 189 (9.9%) | 292 (18.9%) |
| Total | 1,905 (100.0%) | 1,543 (100.0%) |
Property Value to Household Income Ratio in Sulphur Springs
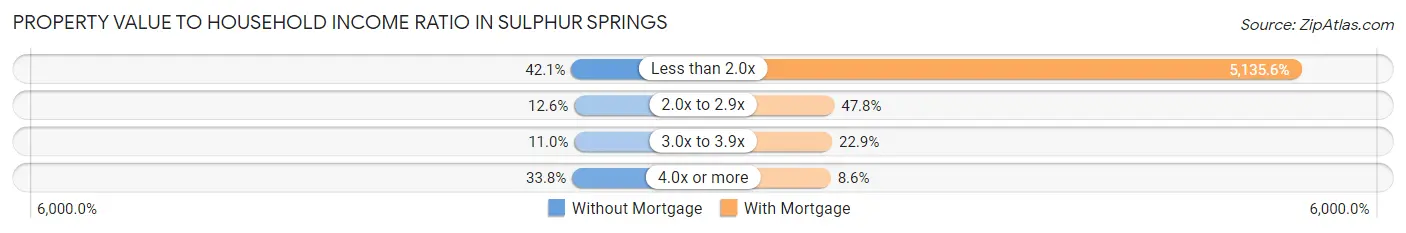
| Value-to-Income Ratio | Without Mortgage | With Mortgage |
| Less than 2.0x | 802 (42.1%) | 79,243 (5,135.6%) |
| 2.0x to 2.9x | 240 (12.6%) | 738 (47.8%) |
| 3.0x to 3.9x | 210 (11.0%) | 353 (22.9%) |
| 4.0x or more | 644 (33.8%) | 133 (8.6%) |
| Total | 1,905 (100.0%) | 1,543 (100.0%) |
Real Estate Taxes by Mortgage Status in Sulphur Springs
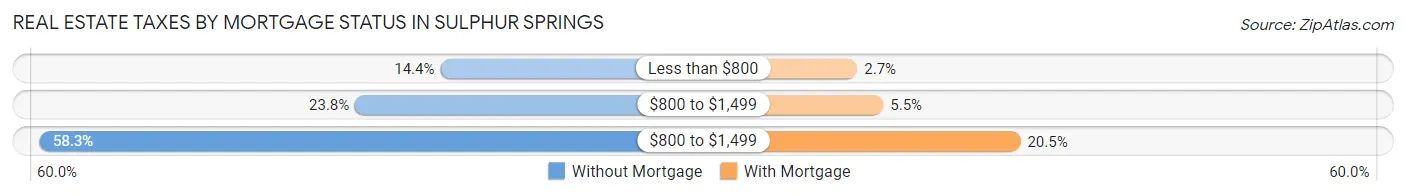
| Property Taxes | Without Mortgage | With Mortgage |
| Less than $800 | 275 (14.4%) | 41 (2.7%) |
| $800 to $1,499 | 453 (23.8%) | 85 (5.5%) |
| $800 to $1,499 | 1,111 (58.3%) | 317 (20.5%) |
| Total | 1,905 (100.0%) | 1,543 (100.0%) |
Health & Disability in Sulphur Springs
Health Insurance Coverage by Age in Sulphur Springs
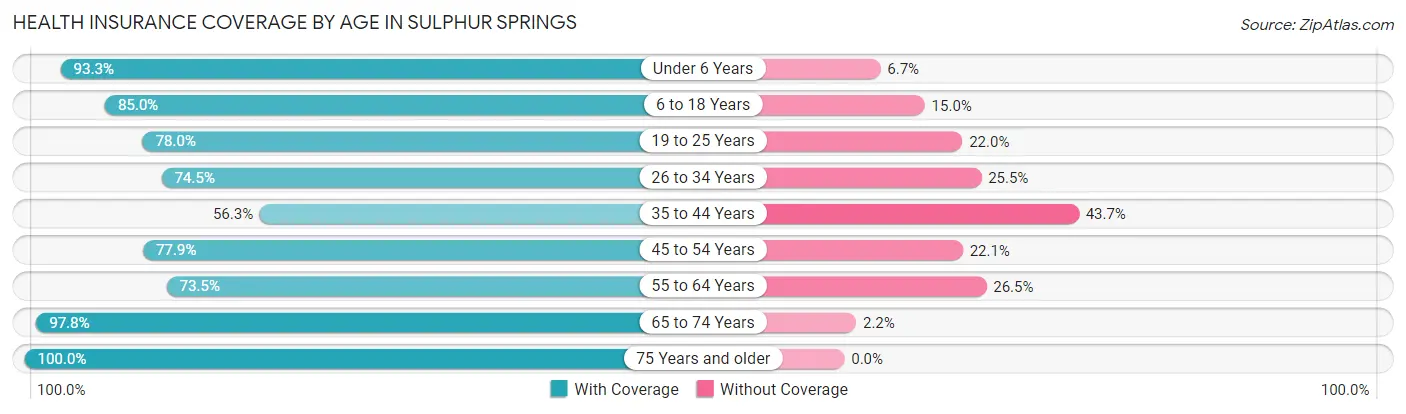
| Age Bracket | With Coverage | Without Coverage |
| Under 6 Years | 1,011 (93.3%) | 73 (6.7%) |
| 6 to 18 Years | 2,547 (85.0%) | 449 (15.0%) |
| 19 to 25 Years | 1,114 (78.0%) | 314 (22.0%) |
| 26 to 34 Years | 1,231 (74.5%) | 422 (25.5%) |
| 35 to 44 Years | 931 (56.3%) | 723 (43.7%) |
| 45 to 54 Years | 1,754 (77.9%) | 497 (22.1%) |
| 55 to 64 Years | 1,333 (73.5%) | 480 (26.5%) |
| 65 to 74 Years | 1,562 (97.8%) | 35 (2.2%) |
| 75 Years and older | 1,076 (100.0%) | 0 (0.0%) |
| Total | 12,559 (80.7%) | 2,993 (19.3%) |
Health Insurance Coverage by Citizenship Status in Sulphur Springs
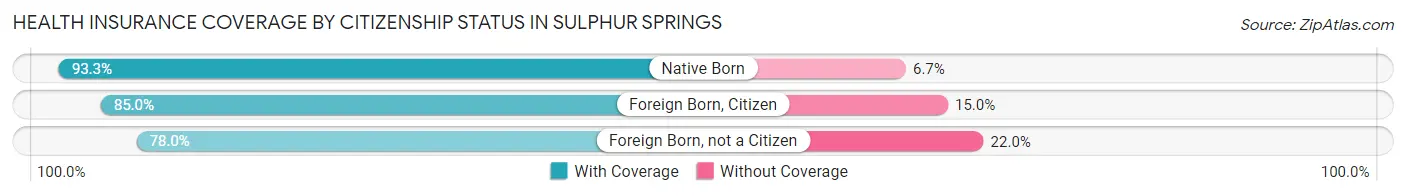
| Citizenship Status | With Coverage | Without Coverage |
| Native Born | 1,011 (93.3%) | 73 (6.7%) |
| Foreign Born, Citizen | 2,547 (85.0%) | 449 (15.0%) |
| Foreign Born, not a Citizen | 1,114 (78.0%) | 314 (22.0%) |
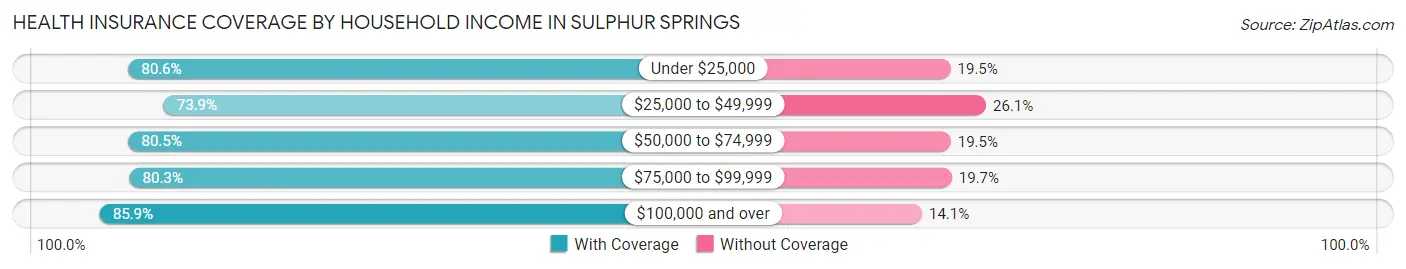
Health Insurance Coverage by Household Income in Sulphur Springs
| Household Income | With Coverage | Without Coverage |
| Under $25,000 | 2,037 (80.5%) | 492 (19.5%) |
| $25,000 to $49,999 | 2,177 (73.9%) | 769 (26.1%) |
| $50,000 to $74,999 | 2,493 (80.5%) | 603 (19.5%) |
| $75,000 to $99,999 | 2,081 (80.3%) | 510 (19.7%) |
| $100,000 and over | 3,771 (85.9%) | 619 (14.1%) |
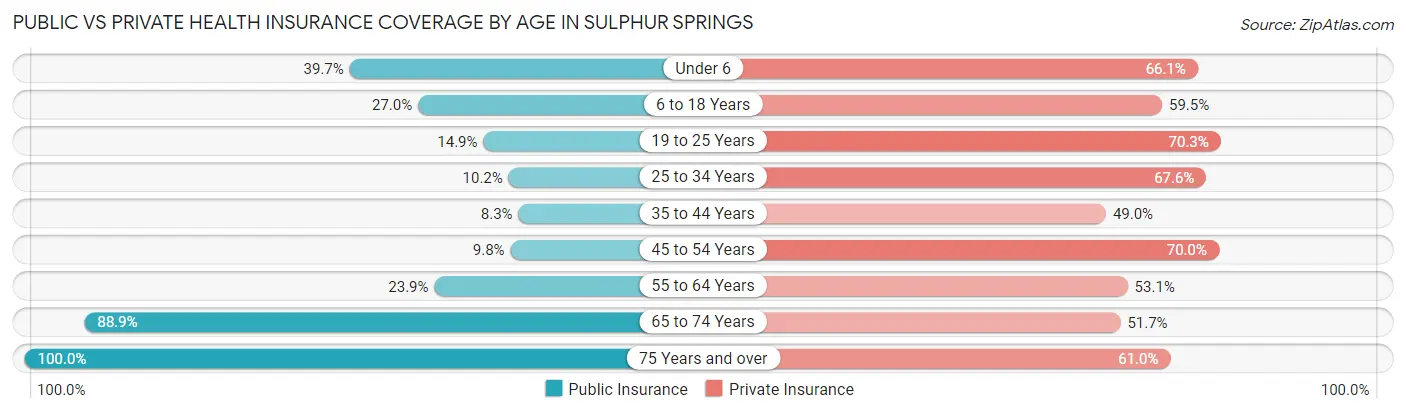
Public vs Private Health Insurance Coverage by Age in Sulphur Springs
| Age Bracket | Public Insurance | Private Insurance |
| Under 6 | 430 (39.7%) | 716 (66.0%) |
| 6 to 18 Years | 808 (27.0%) | 1,781 (59.5%) |
| 19 to 25 Years | 212 (14.8%) | 1,004 (70.3%) |
| 25 to 34 Years | 168 (10.2%) | 1,118 (67.6%) |
| 35 to 44 Years | 138 (8.3%) | 811 (49.0%) |
| 45 to 54 Years | 221 (9.8%) | 1,575 (70.0%) |
| 55 to 64 Years | 434 (23.9%) | 962 (53.1%) |
| 65 to 74 Years | 1,420 (88.9%) | 826 (51.7%) |
| 75 Years and over | 1,076 (100.0%) | 656 (61.0%) |
| Total | 4,907 (31.6%) | 9,449 (60.8%) |
Disability Status by Sex by Age in Sulphur Springs
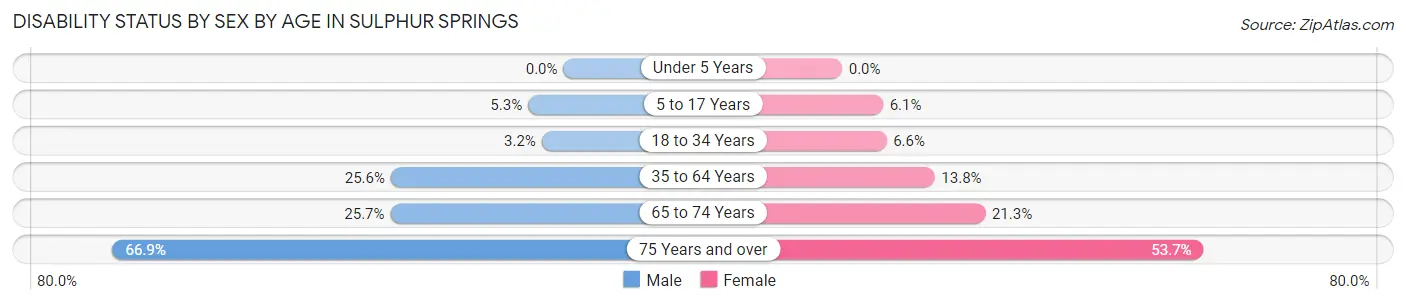
| Age Bracket | Male | Female |
| Under 5 Years | 0 (0.0%) | 0 (0.0%) |
| 5 to 17 Years | 70 (5.2%) | 95 (6.1%) |
| 18 to 34 Years | 52 (3.2%) | 115 (6.6%) |
| 35 to 64 Years | 742 (25.6%) | 388 (13.8%) |
| 65 to 74 Years | 177 (25.7%) | 193 (21.3%) |
| 75 Years and over | 249 (66.9%) | 378 (53.7%) |
Disability Class by Sex by Age in Sulphur Springs
Disability Class: Hearing Difficulty
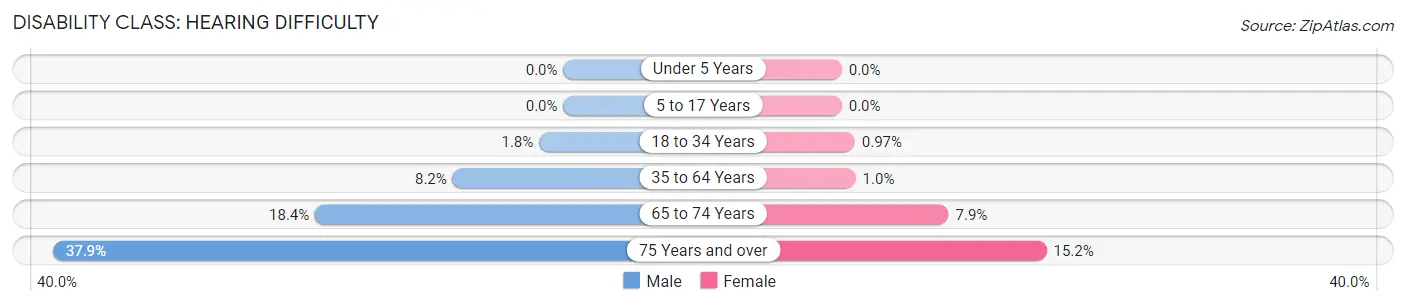
| Age Bracket | Male | Female |
| Under 5 Years | 0 (0.0%) | 0 (0.0%) |
| 5 to 17 Years | 0 (0.0%) | 0 (0.0%) |
| 18 to 34 Years | 29 (1.8%) | 17 (1.0%) |
| 35 to 64 Years | 238 (8.2%) | 29 (1.0%) |
| 65 to 74 Years | 127 (18.4%) | 72 (7.9%) |
| 75 Years and over | 141 (37.9%) | 107 (15.2%) |
Disability Class: Vision Difficulty
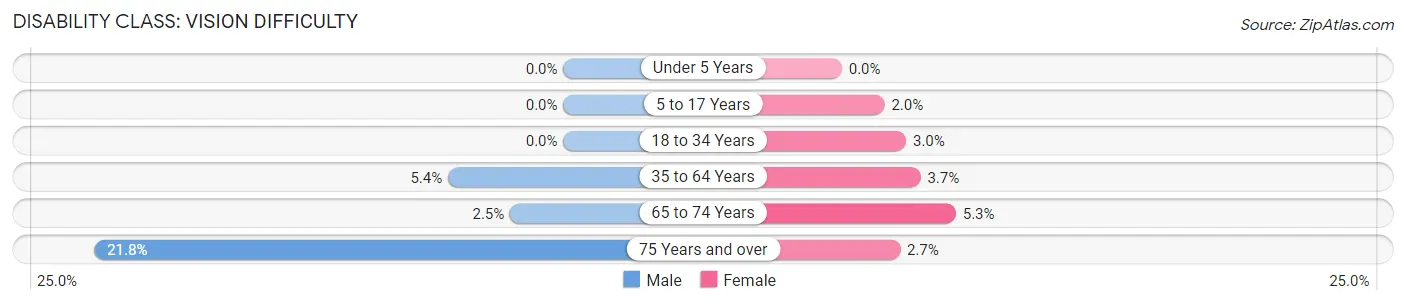
| Age Bracket | Male | Female |
| Under 5 Years | 0 (0.0%) | 0 (0.0%) |
| 5 to 17 Years | 0 (0.0%) | 31 (2.0%) |
| 18 to 34 Years | 0 (0.0%) | 52 (3.0%) |
| 35 to 64 Years | 155 (5.3%) | 103 (3.6%) |
| 65 to 74 Years | 17 (2.5%) | 48 (5.3%) |
| 75 Years and over | 81 (21.8%) | 19 (2.7%) |
Disability Class: Cognitive Difficulty
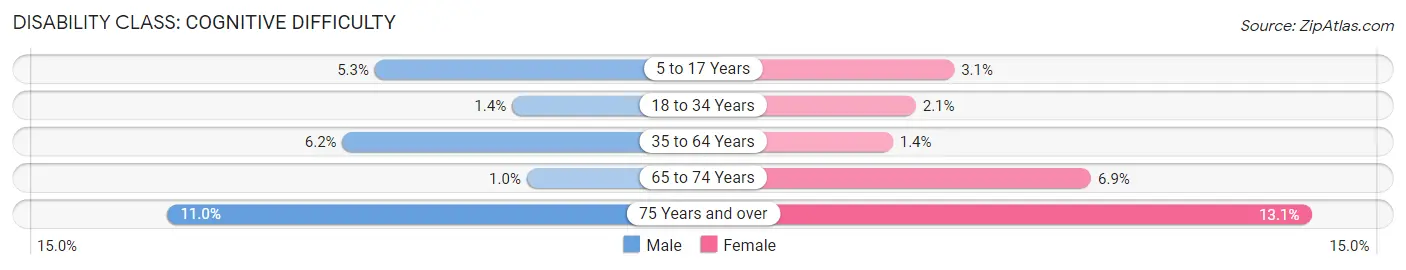
| Age Bracket | Male | Female |
| 5 to 17 Years | 70 (5.2%) | 49 (3.1%) |
| 18 to 34 Years | 23 (1.4%) | 36 (2.1%) |
| 35 to 64 Years | 178 (6.1%) | 40 (1.4%) |
| 65 to 74 Years | 7 (1.0%) | 63 (6.9%) |
| 75 Years and over | 41 (11.0%) | 92 (13.1%) |
Disability Class: Ambulatory Difficulty
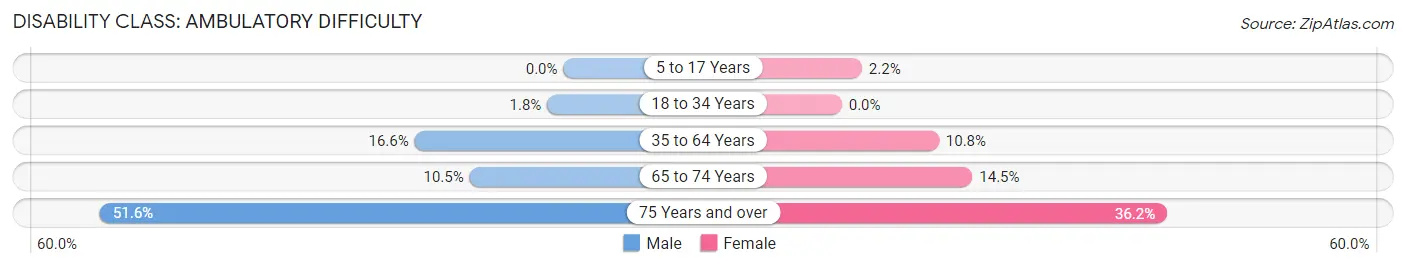
| Age Bracket | Male | Female |
| 5 to 17 Years | 0 (0.0%) | 35 (2.2%) |
| 18 to 34 Years | 29 (1.8%) | 0 (0.0%) |
| 35 to 64 Years | 480 (16.6%) | 305 (10.8%) |
| 65 to 74 Years | 72 (10.4%) | 132 (14.5%) |
| 75 Years and over | 192 (51.6%) | 255 (36.2%) |
Disability Class: Self-Care Difficulty
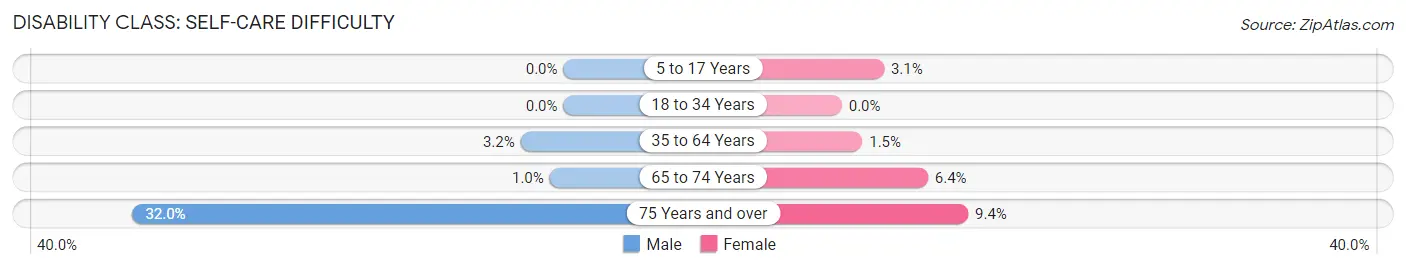
| Age Bracket | Male | Female |
| 5 to 17 Years | 0 (0.0%) | 49 (3.1%) |
| 18 to 34 Years | 0 (0.0%) | 0 (0.0%) |
| 35 to 64 Years | 92 (3.2%) | 43 (1.5%) |
| 65 to 74 Years | 7 (1.0%) | 58 (6.4%) |
| 75 Years and over | 119 (32.0%) | 66 (9.4%) |
Technology Access in Sulphur Springs
Computing Device Access in Sulphur Springs
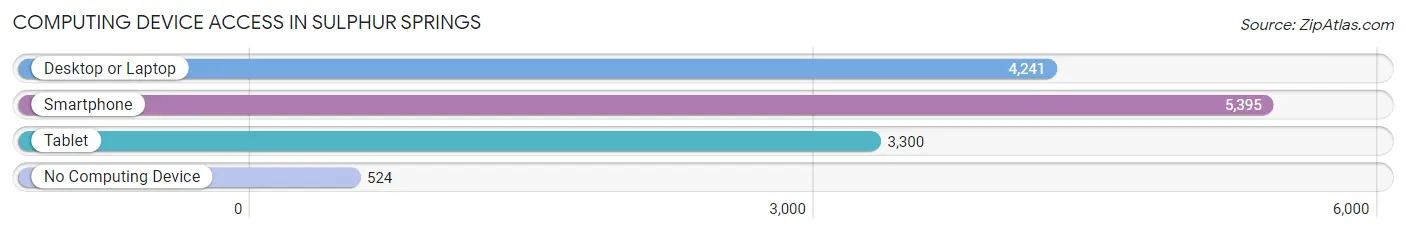
| Device Type | # Households | % Households |
| Desktop or Laptop | 4,241 | 67.6% |
| Smartphone | 5,395 | 86.0% |
| Tablet | 3,300 | 52.6% |
| No Computing Device | 524 | 8.4% |
| Total | 6,271 | 100.0% |
Internet Access in Sulphur Springs
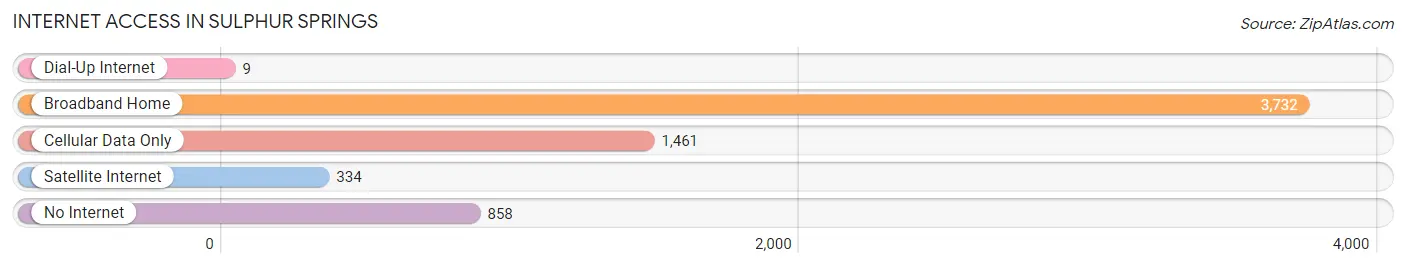
| Internet Type | # Households | % Households |
| Dial-Up Internet | 9 | 0.1% |
| Broadband Home | 3,732 | 59.5% |
| Cellular Data Only | 1,461 | 23.3% |
| Satellite Internet | 334 | 5.3% |
| No Internet | 858 | 13.7% |
| Total | 6,271 | 100.0% |
Sulphur Springs Summary
Sulphur Springs is a city located in Hopkins County, Texas, United States. It is the county seat of Hopkins County. The population was 15,449 at the 2010 census. It is the home of Sulphur Springs Independent School District, which serves the city and surrounding area.
History
Sulphur Springs was founded in 1846 by settlers from the Peters Colony. The city was named for the sulfur springs located in the area. The springs were believed to have medicinal properties and were a popular destination for visitors.
In 1873, the Texas and Pacific Railway was built through the city, connecting it to other parts of the state. This helped to spur economic growth in the area and the city soon became a center for trade and commerce.
In 1881, the city was incorporated and the first mayor was elected. The city continued to grow and by the early 1900s, it had become a popular tourist destination.
Geography
Sulphur Springs is located in the northeast corner of Hopkins County at 33°10'N 95°37'W (33.17, -95.62). It is situated on the Sulphur River, which flows south to the Red River.
The city is located at the intersection of U.S. Route 67 and Interstate 30, about 75 miles (121 km) northeast of Dallas.
Economy
Sulphur Springs is a regional center for trade and commerce. The city is home to several manufacturing and distribution companies, including a Tyson Foods plant and a Coca-Cola bottling plant.
The city is also home to several retail stores including Walmart Lowe s and Home Depot
Demographics
As of the 2010 census, there were 15,449 people, 5,845 households, and 3,845 families residing in the city. The population density was 1,092.3 people per square mile (421.7/km2). There were 6,521 housing units at an average density of 454.3 per square mile (175.3/km2).
The racial makeup of the city was 73.2% White, 17.2% African American, 0.6% Native American, 0.7% Asian, 0.1% Pacific Islander, 6.3% from other races, and 2.0% from two or more races. Hispanic or Latino of any race were 14.3% of the population.
The median income for a household in the city was $35,945, and the median income for a family was $41,945. Males had a median income of $31,945 versus $22,945 for females. The per capita income for the city was $17,945. About 14.3% of families and 17.2% of the population were below the poverty line, including 25.2% of those under age 18 and 11.2% of those age 65 or over.
Common Questions
What is Per Capita Income in Sulphur Springs?
Per Capita income in Sulphur Springs is $29,083.
What is the Median Family Income in Sulphur Springs?
Median Family Income in Sulphur Springs is $71,221.
What is the Median Household income in Sulphur Springs?
Median Household Income in Sulphur Springs is $54,950.
What is Income or Wage Gap in Sulphur Springs?
Income or Wage Gap in Sulphur Springs is 39.2%.
Women in Sulphur Springs earn 60.8 cents for every dollar earned by a man.
What is Family Income Deficit in Sulphur Springs?
Family Income Deficit in Sulphur Springs is $11,269.
Families that are below poverty line in Sulphur Springs earn $11,269 less on average than the poverty threshold level.
What is Inequality or Gini Index in Sulphur Springs?
Inequality or Gini Index in Sulphur Springs is 0.46.
What is the Total Population of Sulphur Springs?
Total Population of Sulphur Springs is 16,033.
What is the Total Male Population of Sulphur Springs?
Total Male Population of Sulphur Springs is 7,663.
What is the Total Female Population of Sulphur Springs?
Total Female Population of Sulphur Springs is 8,370.
What is the Ratio of Males per 100 Females in Sulphur Springs?
There are 91.55 Males per 100 Females in Sulphur Springs.
What is the Ratio of Females per 100 Males in Sulphur Springs?
There are 109.23 Females per 100 Males in Sulphur Springs.
What is the Median Population Age in Sulphur Springs?
Median Population Age in Sulphur Springs is 39.4 Years.
What is the Average Family Size in Sulphur Springs
Average Family Size in Sulphur Springs is 3.2 People.
What is the Average Household Size in Sulphur Springs
Average Household Size in Sulphur Springs is 2.5 People.
How Large is the Labor Force in Sulphur Springs?
There are 8,118 People in the Labor Forcein in Sulphur Springs.
What is the Percentage of People in the Labor Force in Sulphur Springs?
63.9% of People are in the Labor Force in Sulphur Springs.
What is the Unemployment Rate in Sulphur Springs?
Unemployment Rate in Sulphur Springs is 6.4%.