Stowell, TX Map & Demographics
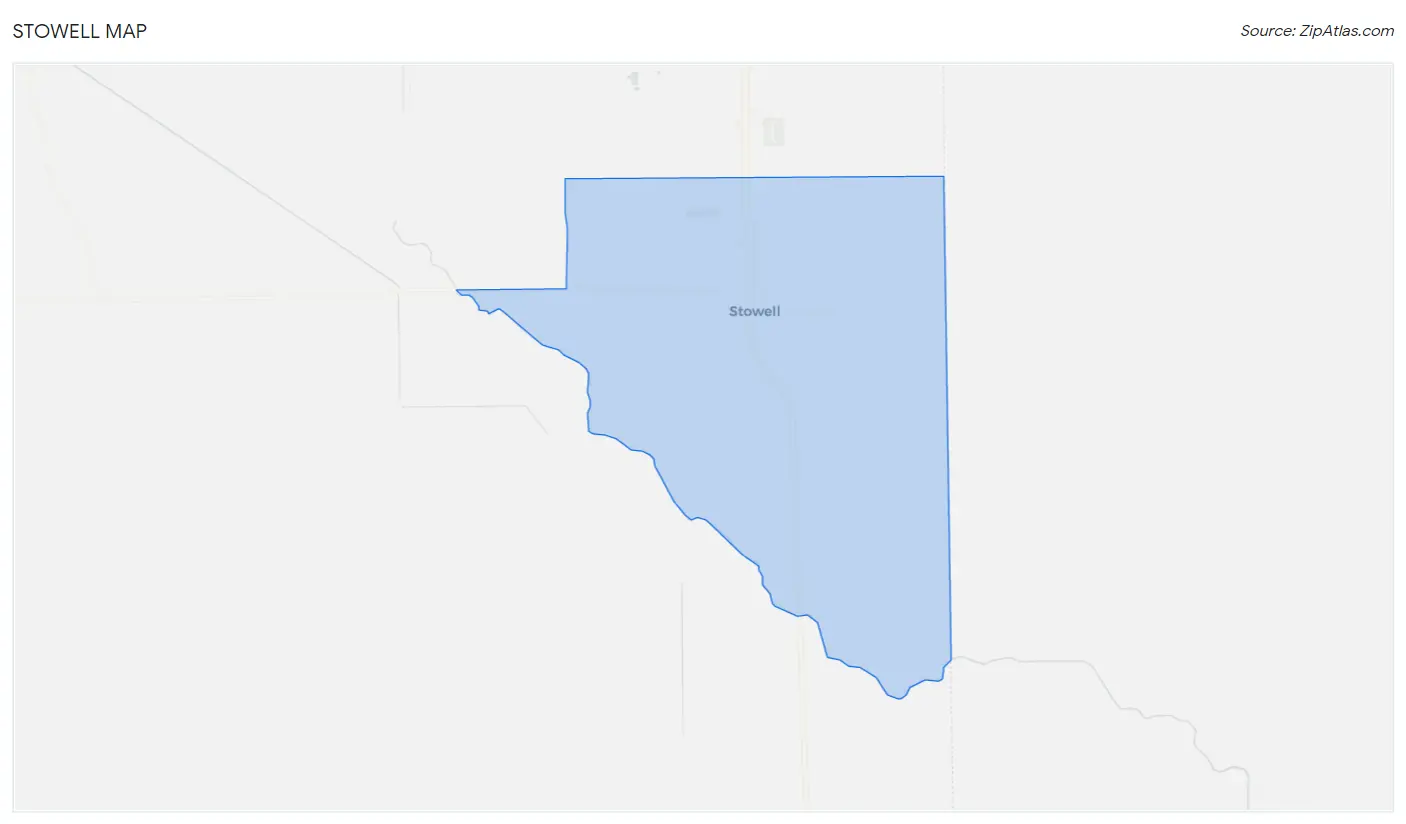
Stowell Map
Stowell Overview
$19,247
PER CAPITA INCOME
0.49
INEQUALITY / GINI INDEX
1,960
TOTAL POPULATION
1,197
MALE POPULATION
763
FEMALE POPULATION
156.88
MALES / 100 FEMALES
63.74
FEMALES / 100 MALES
36.9
MEDIAN AGE
3.3
AVG FAMILY SIZE
3.1
AVG HOUSEHOLD SIZE
865
LABOR FORCE [ PEOPLE ]
63.2%
PERCENT IN LABOR FORCE
12.8%
UNEMPLOYMENT RATE
Stowell Zip Codes
Income in Stowell
Income Overview in Stowell
| Characteristic | Number | Measure |
| Per Capita Income | 1,960 | $19,247 |
| Median Family Income | 570 | $0 |
| Mean Family Income | 570 | $62,220 |
| Median Household Income | 622 | $0 |
| Mean Household Income | 622 | $61,129 |
| Income Deficit | 570 | $0 |
| Wage / Income Gap (%) | 1,960 | 0.00% |
| Wage / Income Gap ($) | 1,960 | 100.00¢ per $1 |
| Gini / Inequality Index | 1,960 | 0.49 |
Earnings by Sex in Stowell
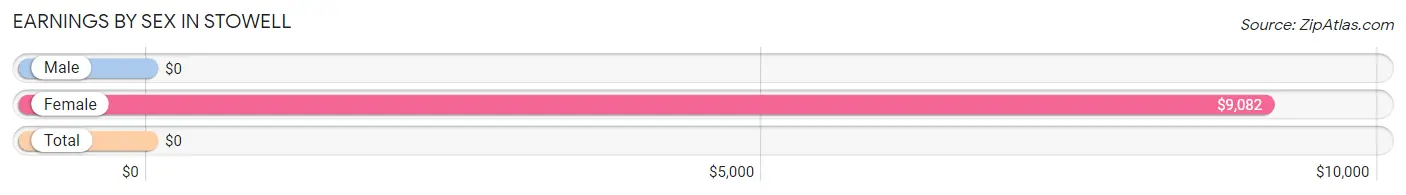
| Sex | Number | Average Earnings |
| Male | 464 (55.6%) | $0 |
| Female | 370 (44.4%) | $9,082 |
| Total | 834 (100.0%) | $0 |
Earnings by Sex by Income Bracket in Stowell
The most common earnings brackets in Stowell are $2,500 to $4,999 for men (188 | 40.5%) and $7,500 to $9,999 for women (98 | 26.5%).
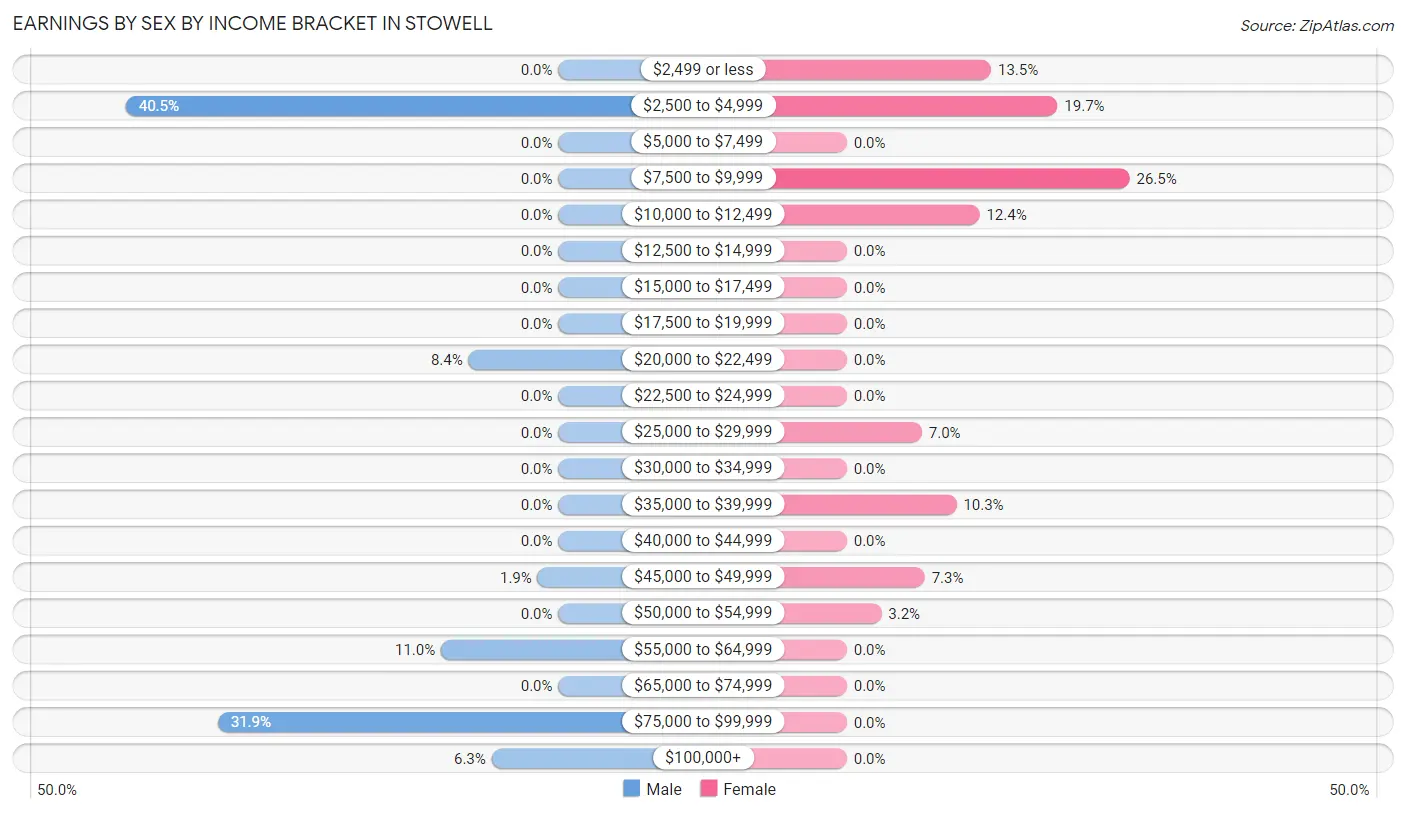
| Income | Male | Female |
| $2,499 or less | 0 (0.0%) | 50 (13.5%) |
| $2,500 to $4,999 | 188 (40.5%) | 73 (19.7%) |
| $5,000 to $7,499 | 0 (0.0%) | 0 (0.0%) |
| $7,500 to $9,999 | 0 (0.0%) | 98 (26.5%) |
| $10,000 to $12,499 | 0 (0.0%) | 46 (12.4%) |
| $12,500 to $14,999 | 0 (0.0%) | 0 (0.0%) |
| $15,000 to $17,499 | 0 (0.0%) | 0 (0.0%) |
| $17,500 to $19,999 | 0 (0.0%) | 0 (0.0%) |
| $20,000 to $22,499 | 39 (8.4%) | 0 (0.0%) |
| $22,500 to $24,999 | 0 (0.0%) | 0 (0.0%) |
| $25,000 to $29,999 | 0 (0.0%) | 26 (7.0%) |
| $30,000 to $34,999 | 0 (0.0%) | 0 (0.0%) |
| $35,000 to $39,999 | 0 (0.0%) | 38 (10.3%) |
| $40,000 to $44,999 | 0 (0.0%) | 0 (0.0%) |
| $45,000 to $49,999 | 9 (1.9%) | 27 (7.3%) |
| $50,000 to $54,999 | 0 (0.0%) | 12 (3.2%) |
| $55,000 to $64,999 | 51 (11.0%) | 0 (0.0%) |
| $65,000 to $74,999 | 0 (0.0%) | 0 (0.0%) |
| $75,000 to $99,999 | 148 (31.9%) | 0 (0.0%) |
| $100,000+ | 29 (6.2%) | 0 (0.0%) |
| Total | 464 (100.0%) | 370 (100.0%) |
Earnings by Sex by Educational Attainment in Stowell
| Educational Attainment | Male Income | Female Income |
| Less than High School | - | - |
| High School Diploma | - | - |
| College or Associate's Degree | - | - |
| Bachelor's Degree | - | - |
| Graduate Degree | - | - |
| Total | - | - |
Family Income in Stowell
Family Income Brackets in Stowell
According to the Stowell family income data, there are 251 families falling into the $15,000 to $24,999 income range, which is the most common income bracket and makes up 44.0% of all families.
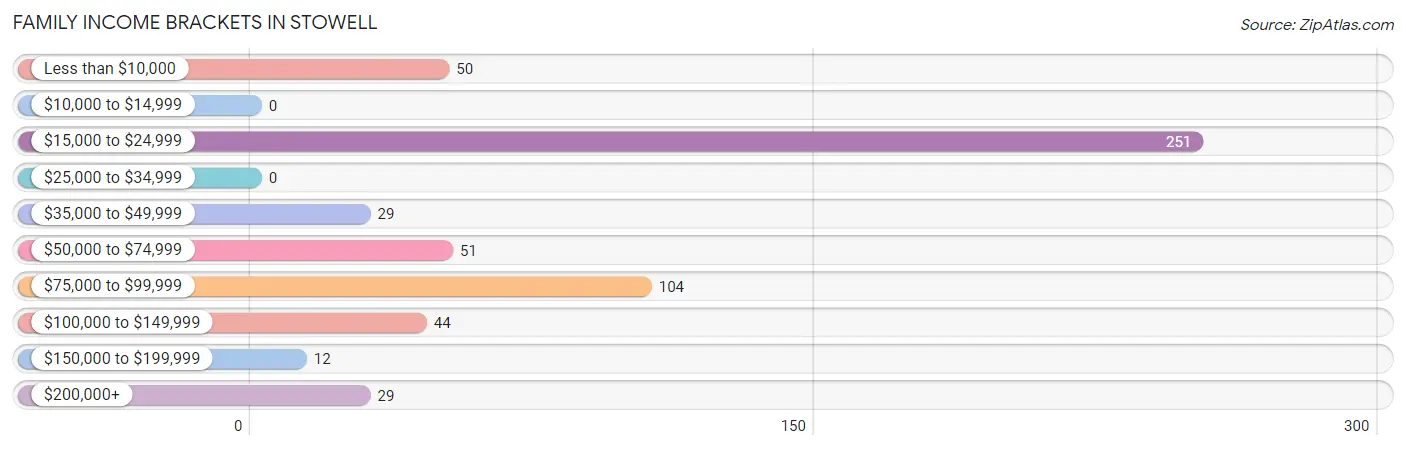
| Income Bracket | # Families | % Families |
| Less than $10,000 | 50 | 8.8% |
| $10,000 to $14,999 | 0 | 0.0% |
| $15,000 to $24,999 | 251 | 44.0% |
| $25,000 to $34,999 | 0 | 0.0% |
| $35,000 to $49,999 | 29 | 5.1% |
| $50,000 to $74,999 | 51 | 8.9% |
| $75,000 to $99,999 | 104 | 18.2% |
| $100,000 to $149,999 | 44 | 7.7% |
| $150,000 to $199,999 | 12 | 2.1% |
| $200,000+ | 29 | 5.1% |
Family Income by Famaliy Size in Stowell
4-person families (79 | 13.9%) account for the highest median family income in Stowell with $98,641 per family, while 4-person families (79 | 13.9%) have the highest median income of $24,660 per family member.
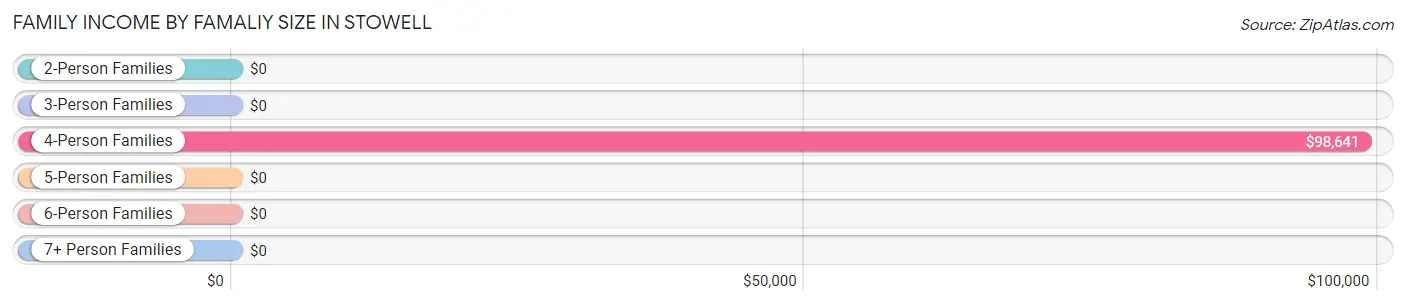
| Income Bracket | # Families | Median Income |
| 2-Person Families | 139 (24.4%) | $0 |
| 3-Person Families | 79 (13.9%) | $0 |
| 4-Person Families | 79 (13.9%) | $98,641 |
| 5-Person Families | 222 (39.0%) | $0 |
| 6-Person Families | 51 (8.9%) | $0 |
| 7+ Person Families | 0 (0.0%) | $0 |
| Total | 570 (100.0%) | $0 |
Family Income by Number of Earners in Stowell
| Number of Earners | # Families | Median Income |
| No Earners | 76 (13.3%) | $0 |
| 1 Earner | 201 (35.3%) | $0 |
| 2 Earners | 101 (17.7%) | $0 |
| 3+ Earners | 192 (33.7%) | $0 |
| Total | 570 (100.0%) | $0 |
Household Income in Stowell
Household Income Brackets in Stowell
With 301 households falling in the category, the $15,000 to $24,999 income range is the most frequent in Stowell, accounting for 48.4% of all households.
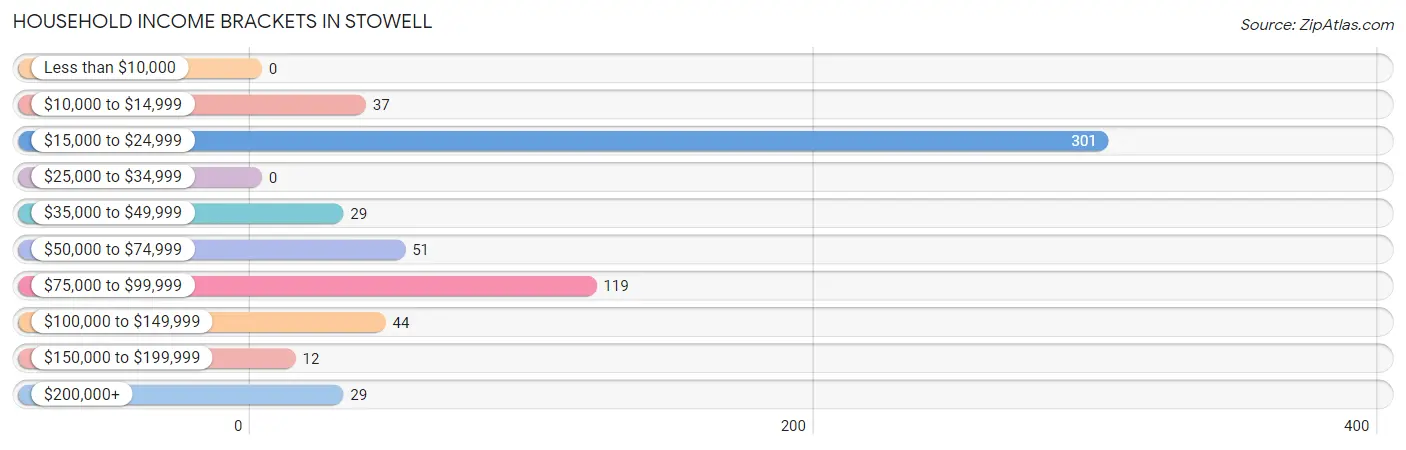
| Income Bracket | # Households | % Households |
| Less than $10,000 | 0 | 0.0% |
| $10,000 to $14,999 | 37 | 5.9% |
| $15,000 to $24,999 | 301 | 48.4% |
| $25,000 to $34,999 | 0 | 0.0% |
| $35,000 to $49,999 | 29 | 4.7% |
| $50,000 to $74,999 | 51 | 8.2% |
| $75,000 to $99,999 | 119 | 19.1% |
| $100,000 to $149,999 | 44 | 7.1% |
| $150,000 to $199,999 | 12 | 1.9% |
| $200,000+ | 29 | 4.7% |
Household Income by Householder Age in Stowell
The median household income in Stowell is $0, with the highest median household income of $49,784 found in the 45 to 64 years age bracket for the primary householder. A total of 195 households (31.4%) fall into this category.
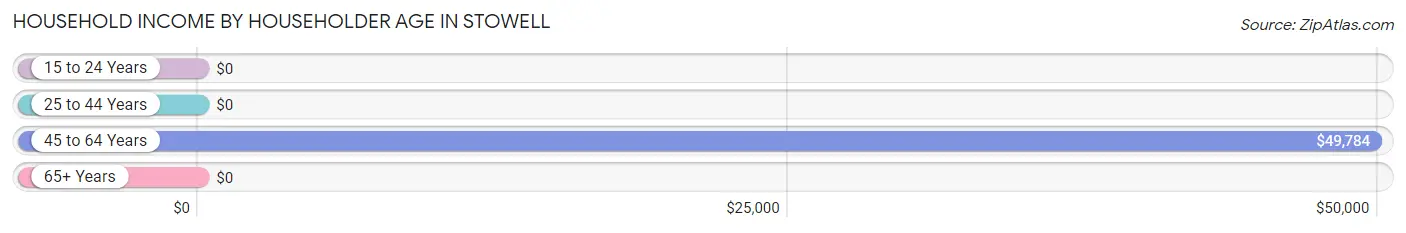
| Income Bracket | # Households | Median Income |
| 15 to 24 Years | 0 (0.0%) | $0 |
| 25 to 44 Years | 334 (53.7%) | $0 |
| 45 to 64 Years | 195 (31.4%) | $49,784 |
| 65+ Years | 93 (14.9%) | $0 |
| Total | 622 (100.0%) | $0 |
Poverty in Stowell
Income Below Poverty by Sex and Age in Stowell
With 32.7% poverty level for males and 40.1% for females among the residents of Stowell, 15 year old males and 18 to 24 year old females are the most vulnerable to poverty, with 51 males (100.0%) and 98 females (68.1%) in their respective age groups living below the poverty level.
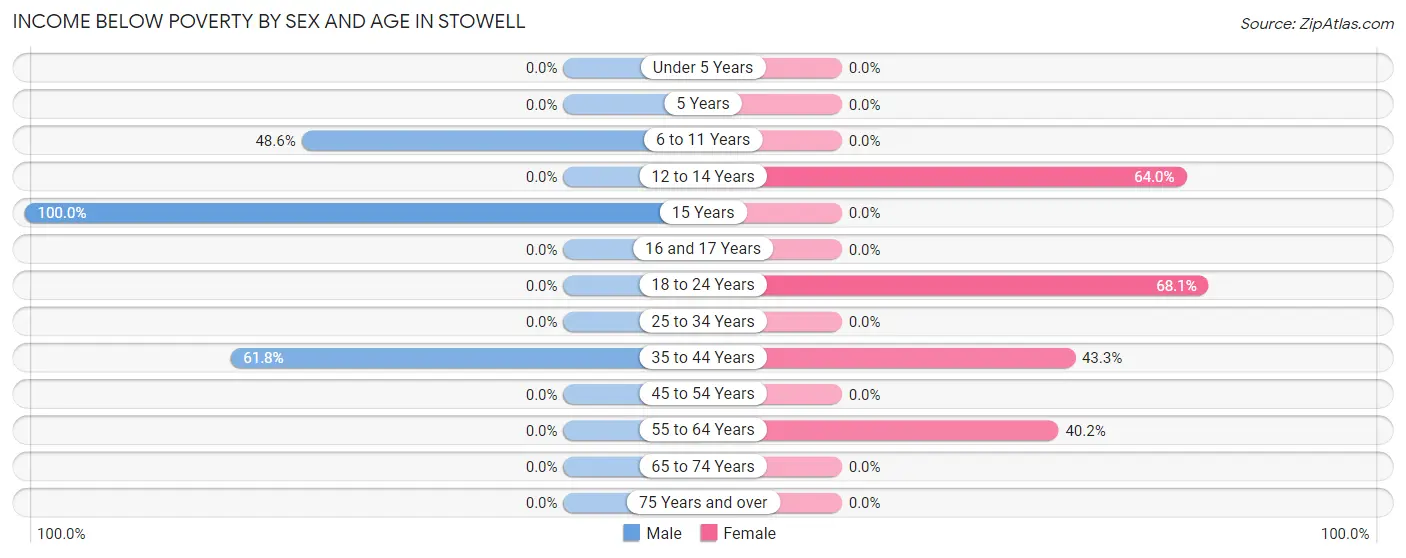
| Age Bracket | Male | Female |
| Under 5 Years | 0 (0.0%) | 0 (0.0%) |
| 5 Years | 0 (0.0%) | 0 (0.0%) |
| 6 to 11 Years | 175 (48.6%) | 0 (0.0%) |
| 12 to 14 Years | 0 (0.0%) | 55 (63.9%) |
| 15 Years | 51 (100.0%) | 0 (0.0%) |
| 16 and 17 Years | 0 (0.0%) | 0 (0.0%) |
| 18 to 24 Years | 0 (0.0%) | 98 (68.1%) |
| 25 to 34 Years | 0 (0.0%) | 0 (0.0%) |
| 35 to 44 Years | 165 (61.8%) | 116 (43.3%) |
| 45 to 54 Years | 0 (0.0%) | 0 (0.0%) |
| 55 to 64 Years | 0 (0.0%) | 37 (40.2%) |
| 65 to 74 Years | 0 (0.0%) | 0 (0.0%) |
| 75 Years and over | 0 (0.0%) | 0 (0.0%) |
| Total | 391 (32.7%) | 306 (40.1%) |
Income Above Poverty by Sex and Age in Stowell
According to the poverty statistics in Stowell, males aged under 5 years and females aged 16 and 17 years are the age groups that are most secure financially, with 100.0% of males and 100.0% of females in these age groups living above the poverty line.
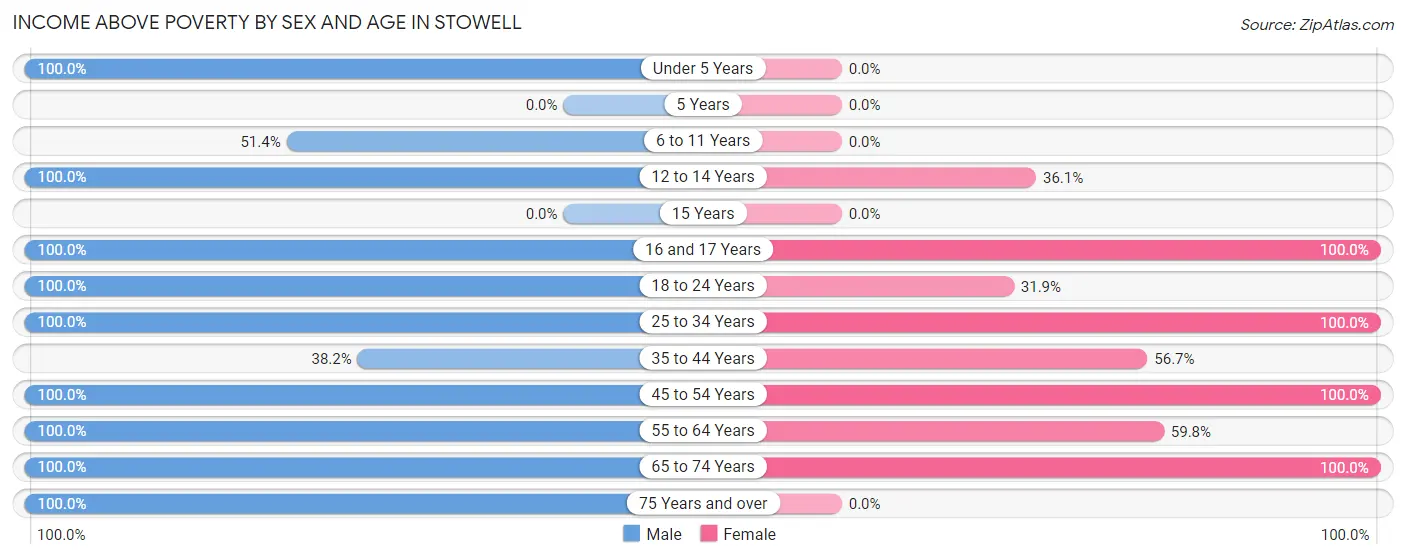
| Age Bracket | Male | Female |
| Under 5 Years | 43 (100.0%) | 0 (0.0%) |
| 5 Years | 0 (0.0%) | 0 (0.0%) |
| 6 to 11 Years | 185 (51.4%) | 0 (0.0%) |
| 12 to 14 Years | 52 (100.0%) | 31 (36.0%) |
| 15 Years | 0 (0.0%) | 0 (0.0%) |
| 16 and 17 Years | 55 (100.0%) | 41 (100.0%) |
| 18 to 24 Years | 43 (100.0%) | 46 (31.9%) |
| 25 to 34 Years | 8 (100.0%) | 12 (100.0%) |
| 35 to 44 Years | 102 (38.2%) | 152 (56.7%) |
| 45 to 54 Years | 115 (100.0%) | 34 (100.0%) |
| 55 to 64 Years | 83 (100.0%) | 55 (59.8%) |
| 65 to 74 Years | 96 (100.0%) | 86 (100.0%) |
| 75 Years and over | 24 (100.0%) | 0 (0.0%) |
| Total | 806 (67.3%) | 457 (59.9%) |
Income Below Poverty Among Married-Couple Families in Stowell
The poverty statistics for married-couple families in Stowell show that 33.6% or 165 of the total 491 families live below the poverty line. Families with 1 or 2 children have the highest poverty rate of 76.7%, comprising of 165 families. On the other hand, families with no children have the lowest poverty rate of 0.0%, which includes 0 families.
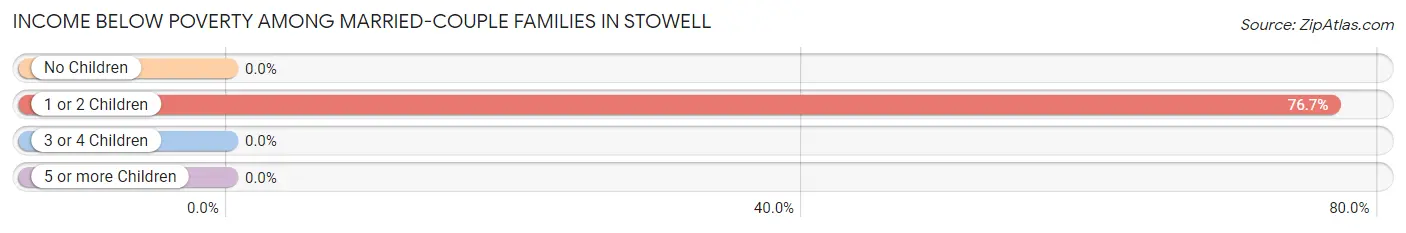
| Children | Above Poverty | Below Poverty |
| No Children | 168 (100.0%) | 0 (0.0%) |
| 1 or 2 Children | 50 (23.3%) | 165 (76.7%) |
| 3 or 4 Children | 108 (100.0%) | 0 (0.0%) |
| 5 or more Children | 0 (0.0%) | 0 (0.0%) |
| Total | 326 (66.4%) | 165 (33.6%) |
Income Below Poverty Among Single-Parent Households in Stowell
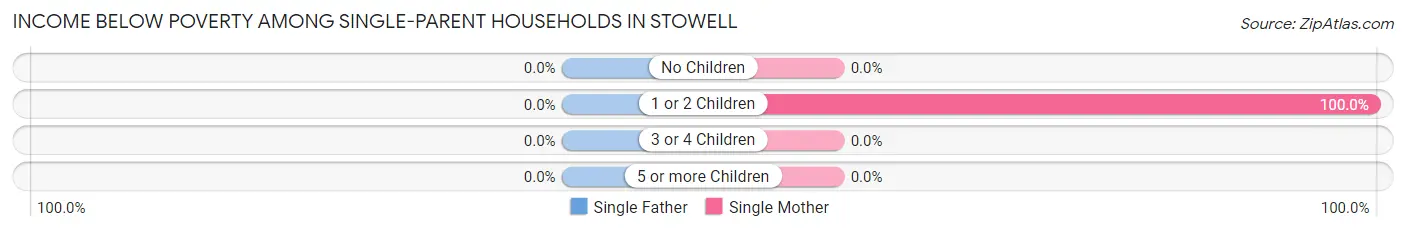
| Children | Single Father | Single Mother |
| No Children | 0 (0.0%) | 0 (0.0%) |
| 1 or 2 Children | 0 (0.0%) | 50 (100.0%) |
| 3 or 4 Children | 0 (0.0%) | 0 (0.0%) |
| 5 or more Children | 0 (0.0%) | 0 (0.0%) |
| Total | 0 (0.0%) | 50 (63.3%) |
Income Below Poverty Among Married-Couple vs Single-Parent Households in Stowell
The poverty data for Stowell shows that 165 of the married-couple family households (33.6%) and 50 of the single-parent households (63.3%) are living below the poverty level. Within the married-couple family households, those with 1 or 2 children have the highest poverty rate, with 165 households (76.7%) falling below the poverty line. Among the single-parent households, those with 1 or 2 children have the highest poverty rate, with 50 household (100.0%) living below poverty.
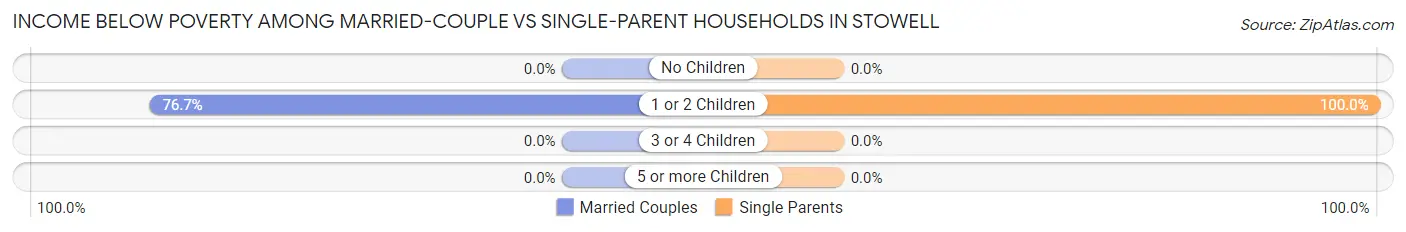
| Children | Married-Couple Families | Single-Parent Households |
| No Children | 0 (0.0%) | 0 (0.0%) |
| 1 or 2 Children | 165 (76.7%) | 50 (100.0%) |
| 3 or 4 Children | 0 (0.0%) | 0 (0.0%) |
| 5 or more Children | 0 (0.0%) | 0 (0.0%) |
| Total | 165 (33.6%) | 50 (63.3%) |
Race in Stowell
The most populous races in Stowell are Hispanic or Latino (907 | 46.3%), White / Caucasian (880 | 44.9%), and Some other Race (799 | 40.8%).
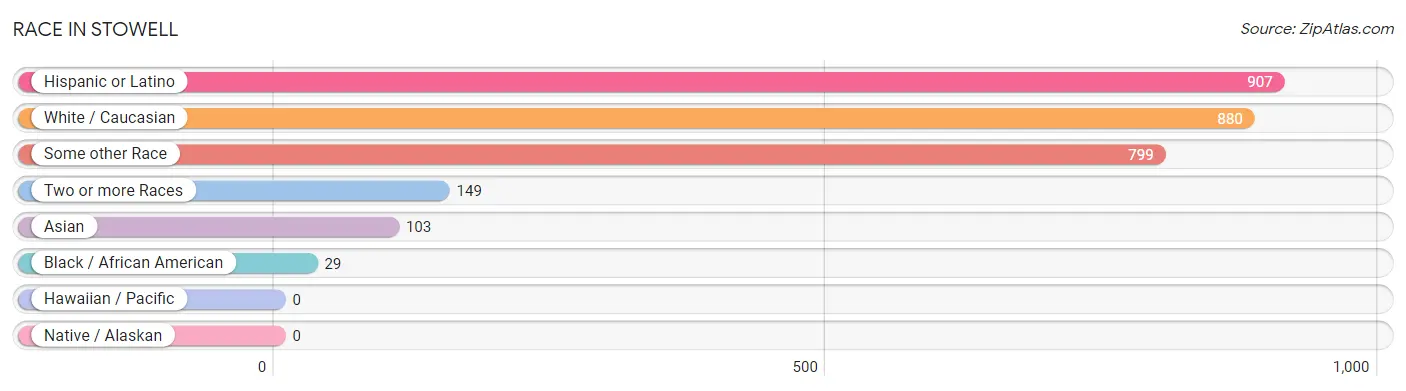
| Race | # Population | % Population |
| Asian | 103 | 5.3% |
| Black / African American | 29 | 1.5% |
| Hawaiian / Pacific | 0 | 0.0% |
| Hispanic or Latino | 907 | 46.3% |
| Native / Alaskan | 0 | 0.0% |
| White / Caucasian | 880 | 44.9% |
| Two or more Races | 149 | 7.6% |
| Some other Race | 799 | 40.8% |
| Total | 1,960 | 100.0% |
Ancestry in Stowell
The most populous ancestries reported in Stowell are Mexican (907 | 46.3%), German (243 | 12.4%), English (200 | 10.2%), French (139 | 7.1%), and Greek (112 | 5.7%), together accounting for 81.7% of all Stowell residents.
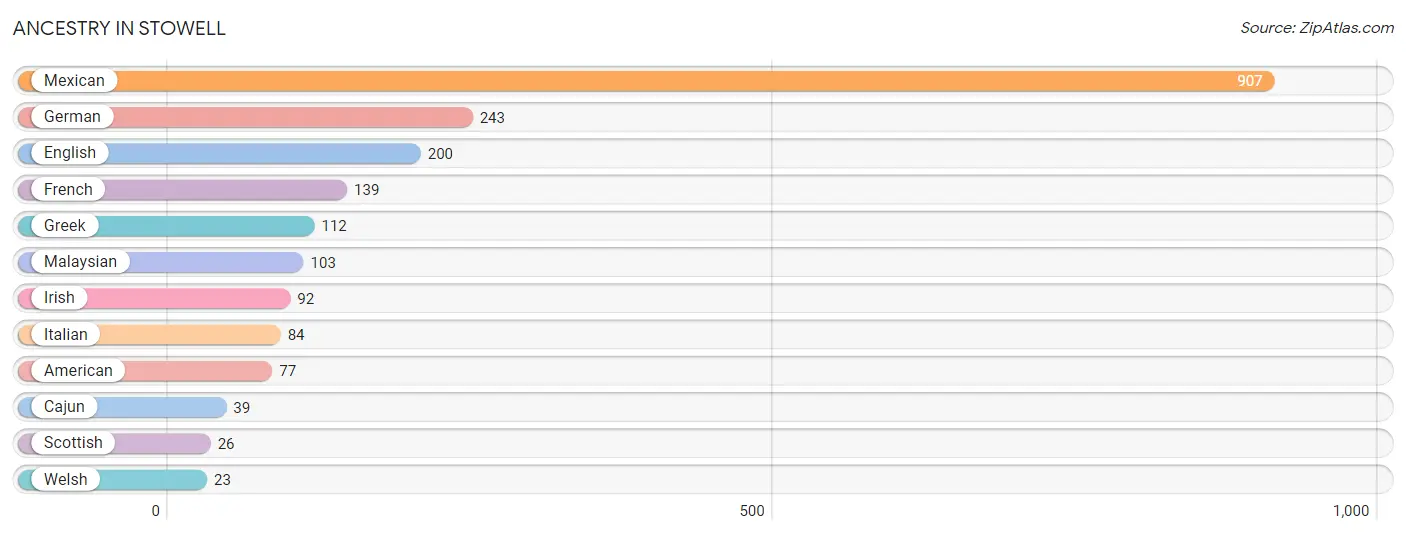
| Ancestry | # Population | % Population |
| American | 77 | 3.9% |
| Cajun | 39 | 2.0% |
| English | 200 | 10.2% |
| French | 139 | 7.1% |
| German | 243 | 12.4% |
| Greek | 112 | 5.7% |
| Irish | 92 | 4.7% |
| Italian | 84 | 4.3% |
| Malaysian | 103 | 5.3% |
| Mexican | 907 | 46.3% |
| Scottish | 26 | 1.3% |
| Welsh | 23 | 1.2% | View All 12 Rows |
Immigrants in Stowell
The most numerous immigrant groups reported in Stowell came from Central America (488 | 24.9%), Latin America (488 | 24.9%), Mexico (488 | 24.9%), Asia (103 | 5.3%), and Laos (103 | 5.3%), together accounting for 85.2% of all Stowell residents.
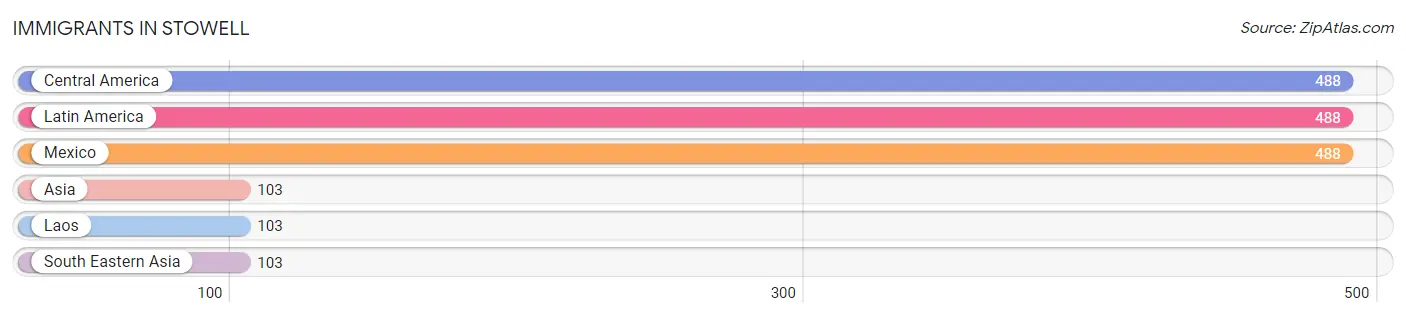
| Immigration Origin | # Population | % Population |
| Asia | 103 | 5.3% |
| Central America | 488 | 24.9% |
| Laos | 103 | 5.3% |
| Latin America | 488 | 24.9% |
| Mexico | 488 | 24.9% |
| South Eastern Asia | 103 | 5.3% | View All 6 Rows |
Sex and Age in Stowell
Sex and Age in Stowell
The most populous age groups in Stowell are 10 to 14 Years (299 | 25.0%) for men and 40 to 44 Years (205 | 26.9%) for women.
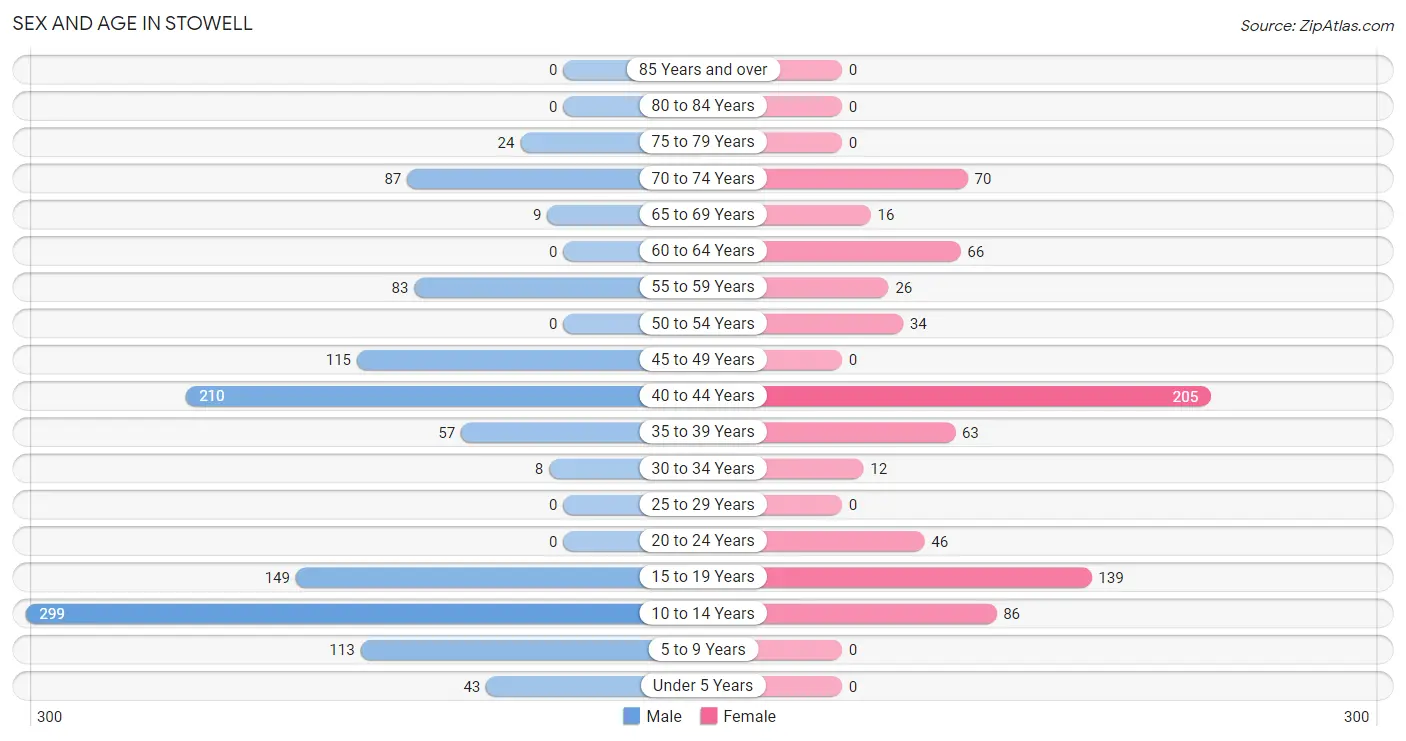
| Age Bracket | Male | Female |
| Under 5 Years | 43 (3.6%) | 0 (0.0%) |
| 5 to 9 Years | 113 (9.4%) | 0 (0.0%) |
| 10 to 14 Years | 299 (25.0%) | 86 (11.3%) |
| 15 to 19 Years | 149 (12.4%) | 139 (18.2%) |
| 20 to 24 Years | 0 (0.0%) | 46 (6.0%) |
| 25 to 29 Years | 0 (0.0%) | 0 (0.0%) |
| 30 to 34 Years | 8 (0.7%) | 12 (1.6%) |
| 35 to 39 Years | 57 (4.8%) | 63 (8.3%) |
| 40 to 44 Years | 210 (17.5%) | 205 (26.9%) |
| 45 to 49 Years | 115 (9.6%) | 0 (0.0%) |
| 50 to 54 Years | 0 (0.0%) | 34 (4.5%) |
| 55 to 59 Years | 83 (6.9%) | 26 (3.4%) |
| 60 to 64 Years | 0 (0.0%) | 66 (8.6%) |
| 65 to 69 Years | 9 (0.7%) | 16 (2.1%) |
| 70 to 74 Years | 87 (7.3%) | 70 (9.2%) |
| 75 to 79 Years | 24 (2.0%) | 0 (0.0%) |
| 80 to 84 Years | 0 (0.0%) | 0 (0.0%) |
| 85 Years and over | 0 (0.0%) | 0 (0.0%) |
| Total | 1,197 (100.0%) | 763 (100.0%) |
Families and Households in Stowell
Median Family Size in Stowell
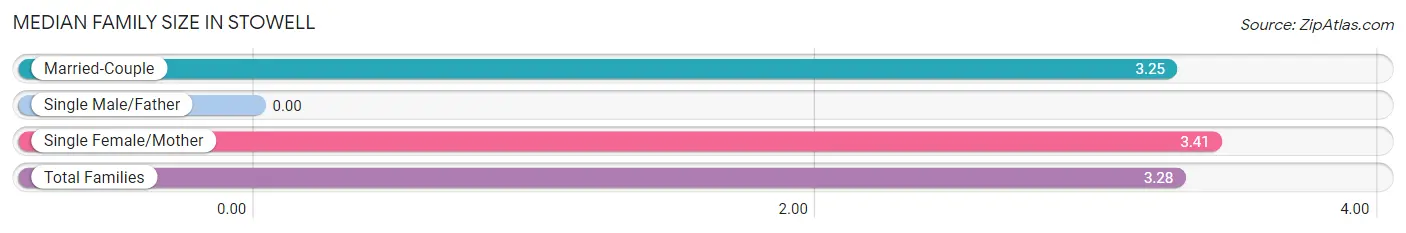
| Family Type | # Families | Family Size |
| Married-Couple | 491 (86.1%) | 3.25 |
| Single Male/Father | 0 (0.0%) | - |
| Single Female/Mother | 79 (13.9%) | 3.41 |
| Total Families | 570 (100.0%) | 3.28 |
Median Household Size in Stowell
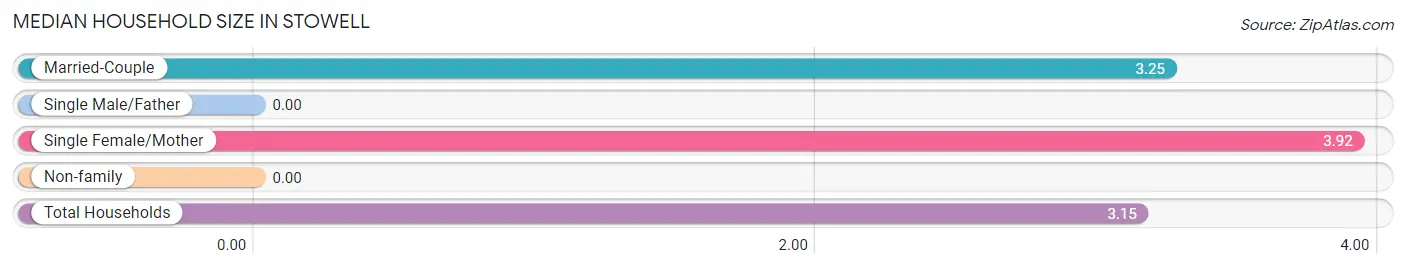
| Household Type | # Households | Household Size |
| Married-Couple | 491 (78.9%) | 3.25 |
| Single Male/Father | 0 (0.0%) | - |
| Single Female/Mother | 79 (12.7%) | 3.92 |
| Non-family | 52 (8.4%) | - |
| Total Households | 622 (100.0%) | 3.15 |
Household Size by Marriage Status in Stowell
Out of a total of 622 households in Stowell, 570 (91.6%) are family households, while 52 (8.4%) are nonfamily households. The most numerous type of family households are 5-person households, comprising 222, and the most common type of nonfamily households are 1-person households, comprising 52.
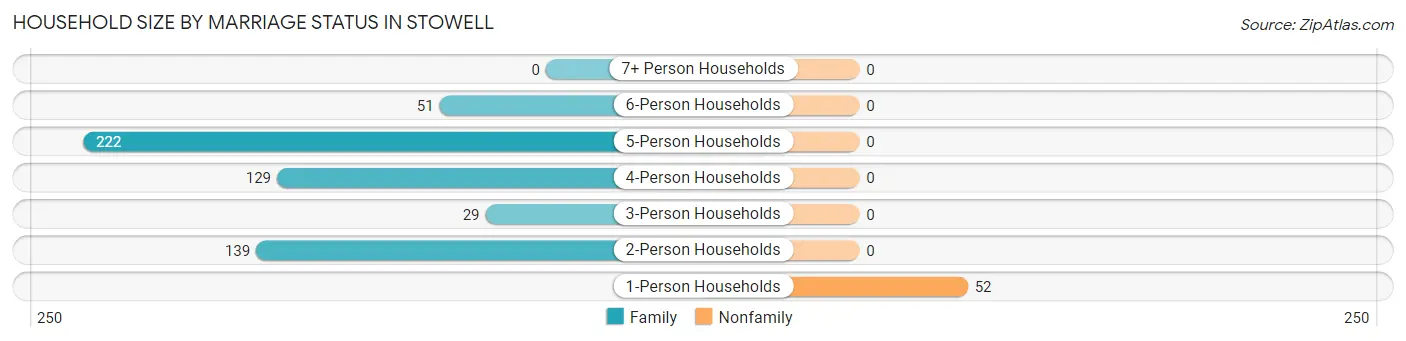
| Household Size | Family Households | Nonfamily Households |
| 1-Person Households | - | 52 (8.4%) |
| 2-Person Households | 139 (22.4%) | 0 (0.0%) |
| 3-Person Households | 29 (4.7%) | 0 (0.0%) |
| 4-Person Households | 129 (20.7%) | 0 (0.0%) |
| 5-Person Households | 222 (35.7%) | 0 (0.0%) |
| 6-Person Households | 51 (8.2%) | 0 (0.0%) |
| 7+ Person Households | 0 (0.0%) | 0 (0.0%) |
| Total | 570 (91.6%) | 52 (8.4%) |
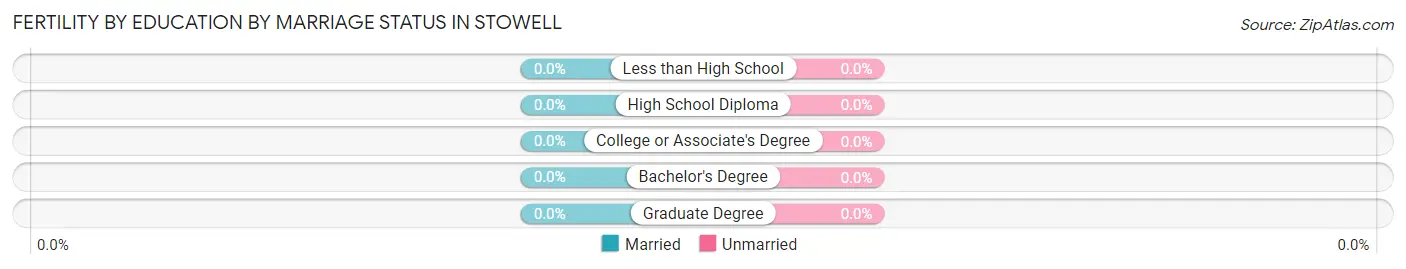
Female Fertility in Stowell
Fertility by Age in Stowell
| Age Bracket | Women with Births | Births / 1,000 Women |
| 15 to 19 years | 0 (0.0%) | 0.0 |
| 20 to 34 years | 0 (0.0%) | 0.0 |
| 35 to 50 years | 0 (0.0%) | 0.0 |
| Total | 0 (0.0%) | 0.0 |
Fertility by Age by Marriage Status in Stowell
| Age Bracket | Married | Unmarried |
| 15 to 19 years | 0 (0.0%) | 0 (0.0%) |
| 20 to 34 years | 0 (0.0%) | 0 (0.0%) |
| 35 to 50 years | 0 (0.0%) | 0 (0.0%) |
| Total | 0 (0.0%) | 0 (0.0%) |
Fertility by Education in Stowell
| Educational Attainment | Women with Births | Births / 1,000 Women |
| Less than High School | 0 (0.0%) | 0.0 |
| High School Diploma | 0 (0.0%) | 0.0 |
| College or Associate's Degree | 0 (0.0%) | 0.0 |
| Bachelor's Degree | 0 (0.0%) | 0.0 |
| Graduate Degree | 0 (0.0%) | 0.0 |
| Total | 0 (0.0%) | 0.0 |
Fertility by Education by Marriage Status in Stowell
| Educational Attainment | Married | Unmarried |
| Less than High School | 0 (0.0%) | 0 (0.0%) |
| High School Diploma | 0 (0.0%) | 0 (0.0%) |
| College or Associate's Degree | 0 (0.0%) | 0 (0.0%) |
| Bachelor's Degree | 0 (0.0%) | 0 (0.0%) |
| Graduate Degree | 0 (0.0%) | 0 (0.0%) |
| Total | 0 (0.0%) | 0 (0.0%) |
Employment Characteristics in Stowell
Employment by Class of Employer in Stowell
Among the 754 employed individuals in Stowell, private company employees (492 | 65.2%), local government employees (125 | 16.6%), and self-employed (not incorporated) (68 | 9.0%) make up the most common classes of employment.
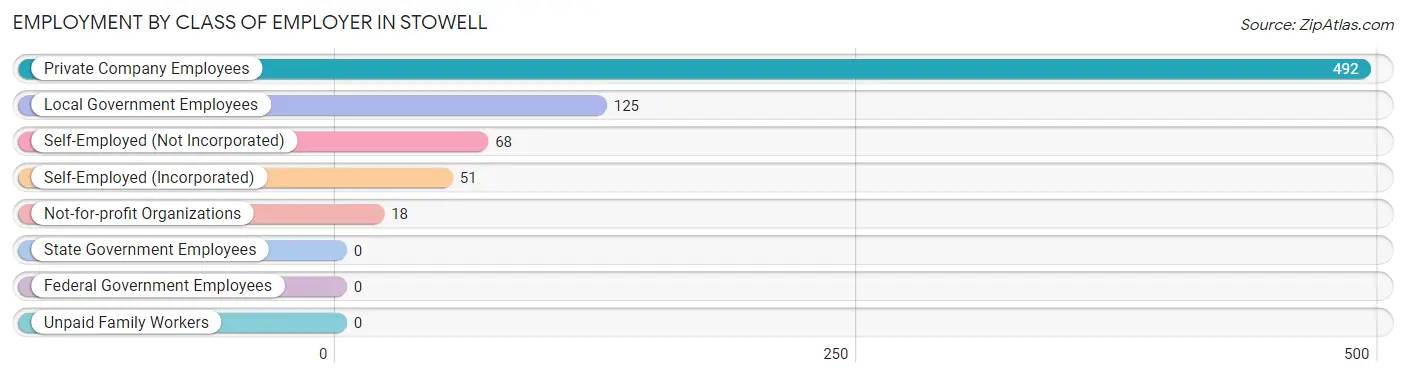
| Employer Class | # Employees | % Employees |
| Private Company Employees | 492 | 65.2% |
| Self-Employed (Incorporated) | 51 | 6.8% |
| Self-Employed (Not Incorporated) | 68 | 9.0% |
| Not-for-profit Organizations | 18 | 2.4% |
| Local Government Employees | 125 | 16.6% |
| State Government Employees | 0 | 0.0% |
| Federal Government Employees | 0 | 0.0% |
| Unpaid Family Workers | 0 | 0.0% |
| Total | 754 | 100.0% |
Employment Status by Age in Stowell
According to the labor force statistics for Stowell, out of the total population over 16 years of age (1,368), 63.2% or 865 individuals are in the labor force, with 12.8% or 111 of them unemployed. The age group with the highest labor force participation rate is 20 to 24 years, with 100.0% or 46 individuals in the labor force. Within the labor force, the 45 to 54 years age range has the highest percentage of unemployed individuals, with 35.7% or 41 of them being unemployed.
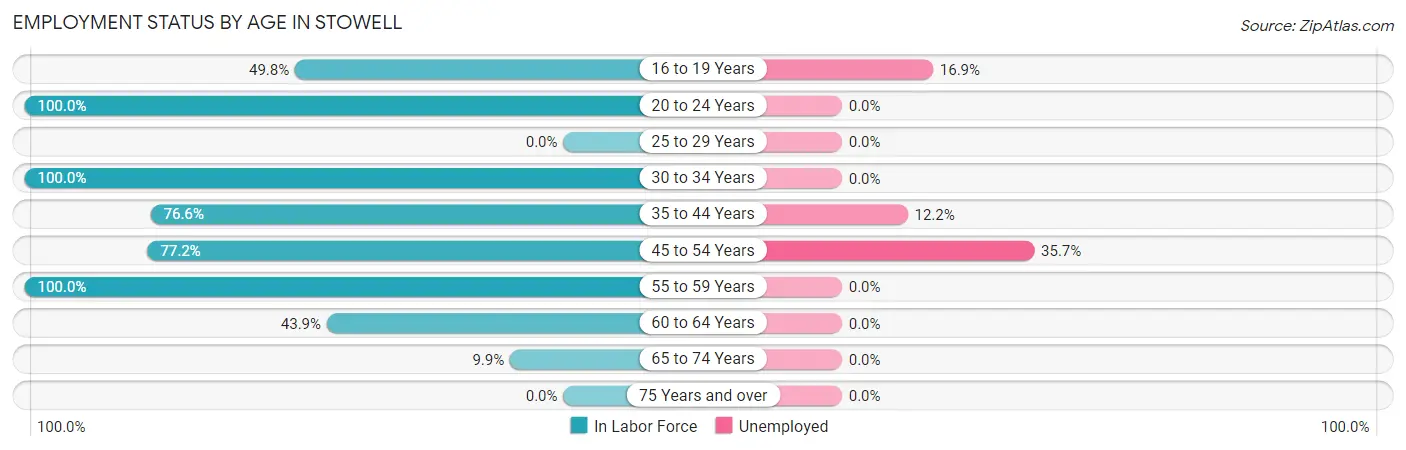
| Age Bracket | In Labor Force | Unemployed |
| 16 to 19 Years | 118 (49.8%) | 20 (16.9%) |
| 20 to 24 Years | 46 (100.0%) | 0 (0.0%) |
| 25 to 29 Years | 0 (0.0%) | 0 (0.0%) |
| 30 to 34 Years | 20 (100.0%) | 0 (0.0%) |
| 35 to 44 Years | 410 (76.6%) | 50 (12.2%) |
| 45 to 54 Years | 115 (77.2%) | 41 (35.7%) |
| 55 to 59 Years | 109 (100.0%) | 0 (0.0%) |
| 60 to 64 Years | 29 (43.9%) | 0 (0.0%) |
| 65 to 74 Years | 18 (9.9%) | 0 (0.0%) |
| 75 Years and over | 0 (0.0%) | 0 (0.0%) |
| Total | 865 (63.2%) | 111 (12.8%) |
Employment Status by Educational Attainment in Stowell
According to labor force statistics for Stowell, 77.7% of individuals (683) out of the total population between 25 and 64 years of age (879) are in the labor force, with 13.3% or 91 of them being unemployed. The group with the highest labor force participation rate are those with the educational attainment of less than high school, with 100.0% or 128 individuals in the labor force. Within the labor force, individuals with college / associate degree education have the highest percentage of unemployment, with 49.2% or 91 of them being unemployed.
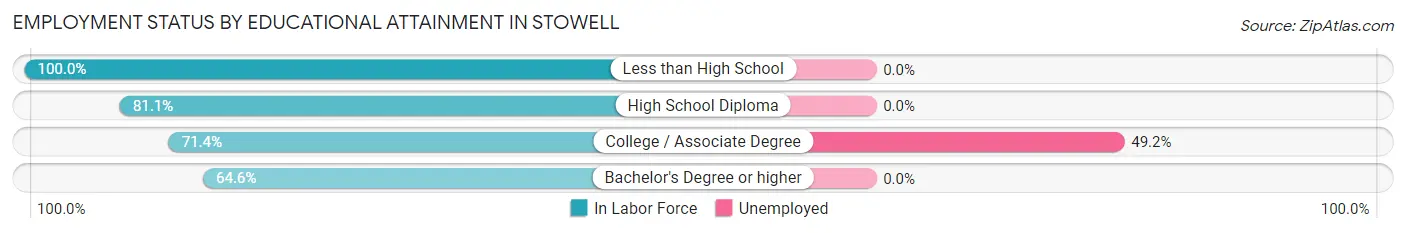
| Educational Attainment | In Labor Force | Unemployed |
| Less than High School | 128 (100.0%) | 0 (0.0%) |
| High School Diploma | 257 (81.1%) | 0 (0.0%) |
| College / Associate Degree | 185 (71.4%) | 127 (49.2%) |
| Bachelor's Degree or higher | 113 (64.6%) | 0 (0.0%) |
| Total | 683 (77.7%) | 117 (13.3%) |
Employment Occupations by Sex in Stowell
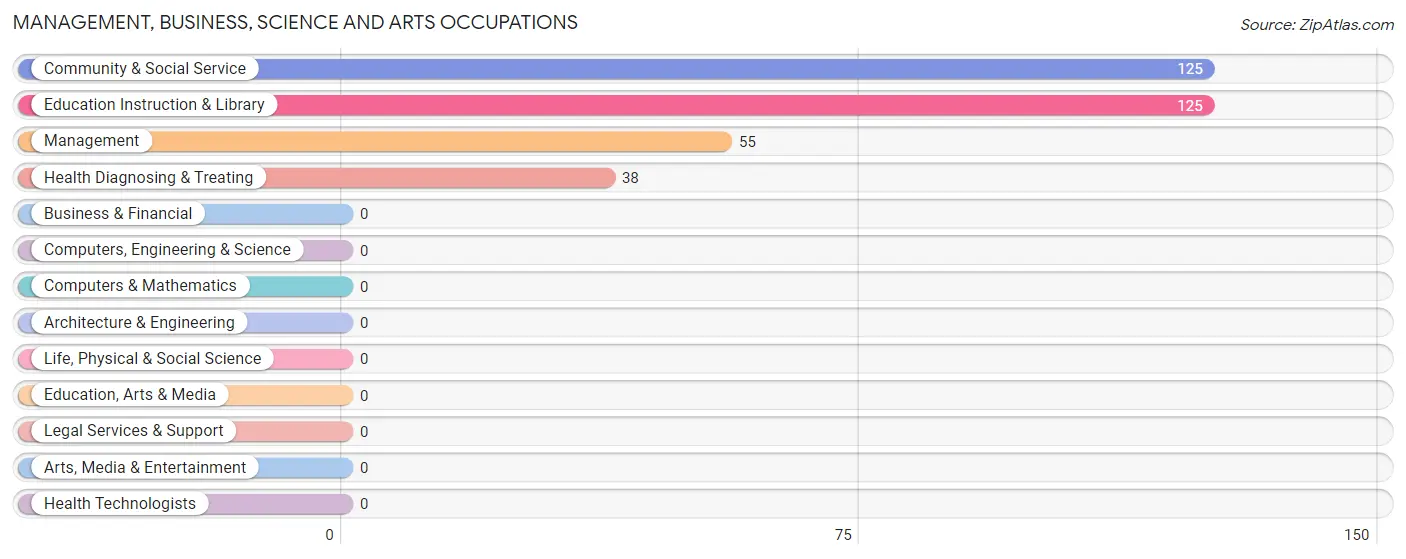
Management, Business, Science and Arts Occupations
The most common Management, Business, Science and Arts occupations in Stowell are Community & Social Service (125 | 16.6%), Education Instruction & Library (125 | 16.6%), Management (55 | 7.3%), and Health Diagnosing & Treating (38 | 5.0%).
Management, Business, Science and Arts Occupations by Sex
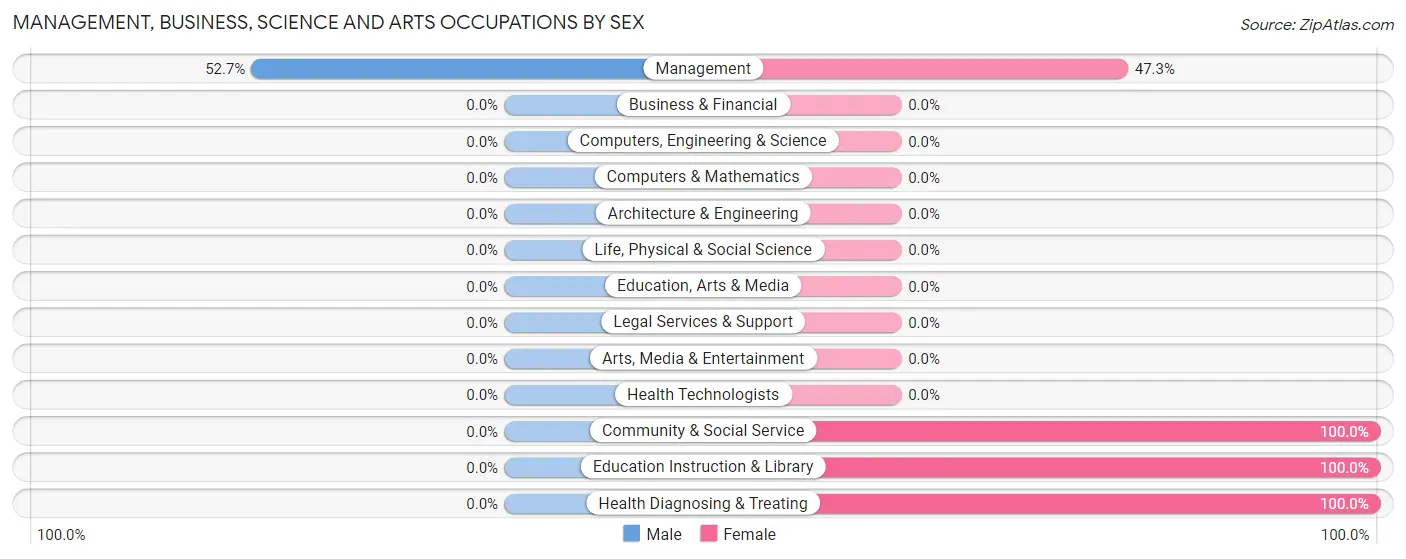
| Occupation | Male | Female |
| Management | 29 (52.7%) | 26 (47.3%) |
| Business & Financial | 0 (0.0%) | 0 (0.0%) |
| Computers, Engineering & Science | 0 (0.0%) | 0 (0.0%) |
| Computers & Mathematics | 0 (0.0%) | 0 (0.0%) |
| Architecture & Engineering | 0 (0.0%) | 0 (0.0%) |
| Life, Physical & Social Science | 0 (0.0%) | 0 (0.0%) |
| Community & Social Service | 0 (0.0%) | 125 (100.0%) |
| Education, Arts & Media | 0 (0.0%) | 0 (0.0%) |
| Legal Services & Support | 0 (0.0%) | 0 (0.0%) |
| Education Instruction & Library | 0 (0.0%) | 125 (100.0%) |
| Arts, Media & Entertainment | 0 (0.0%) | 0 (0.0%) |
| Health Diagnosing & Treating | 0 (0.0%) | 38 (100.0%) |
| Health Technologists | 0 (0.0%) | 0 (0.0%) |
| Total (Category) | 29 (13.3%) | 189 (86.7%) |
| Total (Overall) | 441 (58.5%) | 313 (41.5%) |
Services Occupations
The most common Services occupations in Stowell are , and Cleaning & Maintenance (66 | 8.7%).
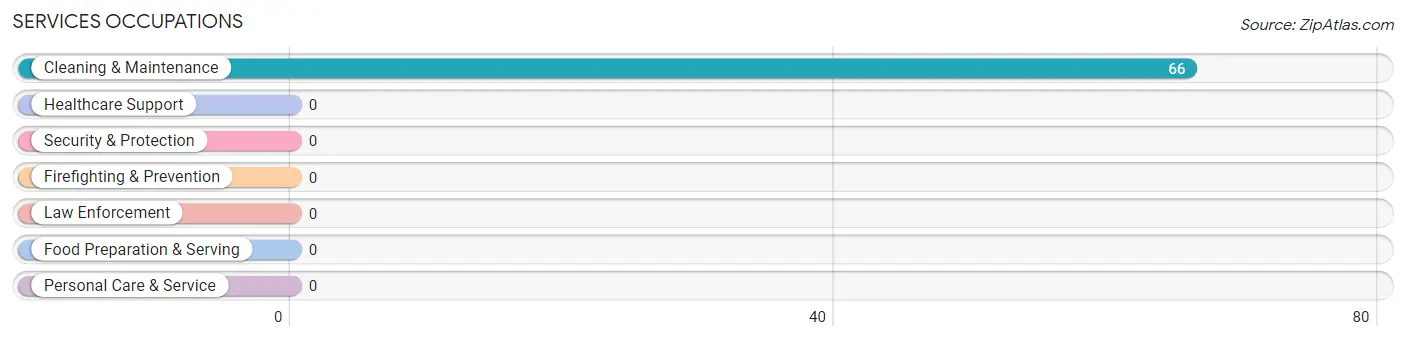
Services Occupations by Sex
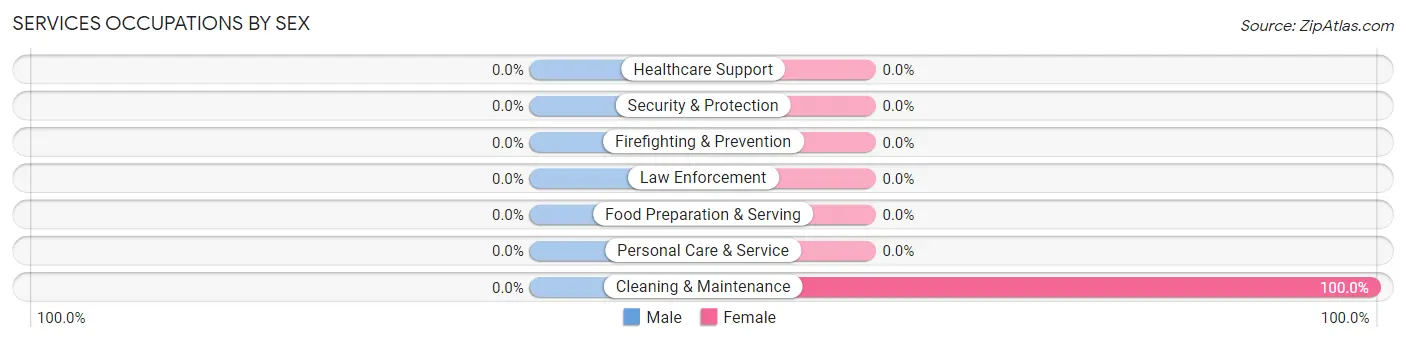
| Occupation | Male | Female |
| Healthcare Support | 0 (0.0%) | 0 (0.0%) |
| Security & Protection | 0 (0.0%) | 0 (0.0%) |
| Firefighting & Prevention | 0 (0.0%) | 0 (0.0%) |
| Law Enforcement | 0 (0.0%) | 0 (0.0%) |
| Food Preparation & Serving | 0 (0.0%) | 0 (0.0%) |
| Cleaning & Maintenance | 0 (0.0%) | 66 (100.0%) |
| Personal Care & Service | 0 (0.0%) | 0 (0.0%) |
| Total (Category) | 0 (0.0%) | 66 (100.0%) |
| Total (Overall) | 441 (58.5%) | 313 (41.5%) |
Sales and Office Occupations
The most common Sales and Office occupations in Stowell are Sales & Related (62 | 8.2%), and Office & Administration (58 | 7.7%).

Sales and Office Occupations by Sex

| Occupation | Male | Female |
| Sales & Related | 62 (100.0%) | 0 (0.0%) |
| Office & Administration | 0 (0.0%) | 58 (100.0%) |
| Total (Category) | 62 (51.7%) | 58 (48.3%) |
| Total (Overall) | 441 (58.5%) | 313 (41.5%) |
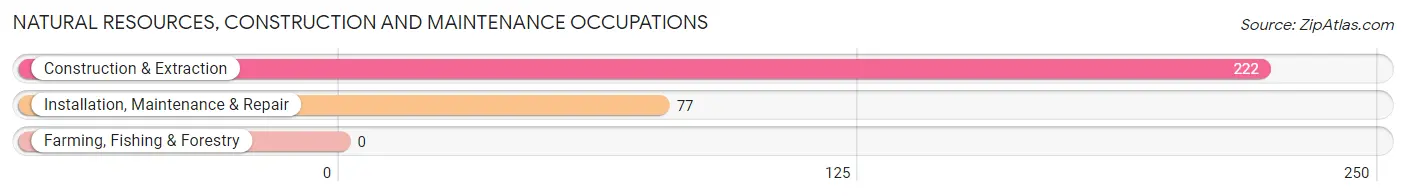
Natural Resources, Construction and Maintenance Occupations
The most common Natural Resources, Construction and Maintenance occupations in Stowell are Construction & Extraction (222 | 29.4%), and Installation, Maintenance & Repair (77 | 10.2%).
Natural Resources, Construction and Maintenance Occupations by Sex
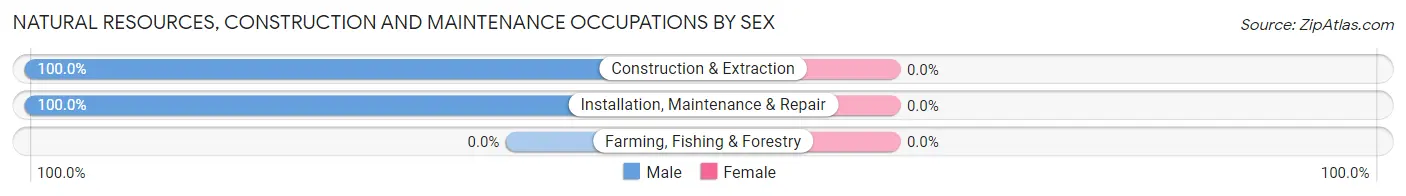
| Occupation | Male | Female |
| Farming, Fishing & Forestry | 0 (0.0%) | 0 (0.0%) |
| Construction & Extraction | 222 (100.0%) | 0 (0.0%) |
| Installation, Maintenance & Repair | 77 (100.0%) | 0 (0.0%) |
| Total (Category) | 299 (100.0%) | 0 (0.0%) |
| Total (Overall) | 441 (58.5%) | 313 (41.5%) |
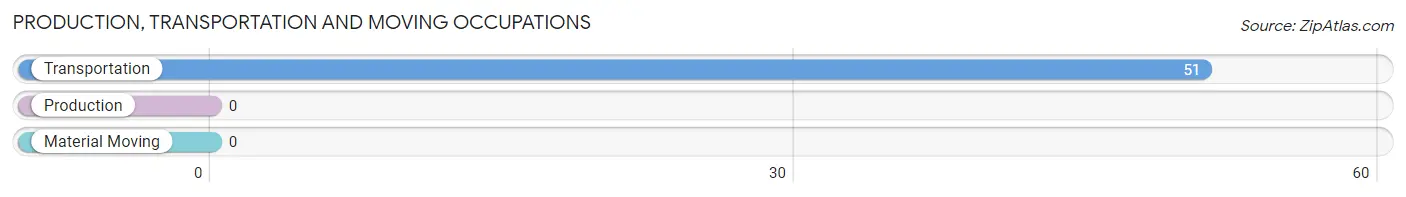
Production, Transportation and Moving Occupations
The most common Production, Transportation and Moving occupations in Stowell are , and Transportation (51 | 6.8%).
Production, Transportation and Moving Occupations by Sex
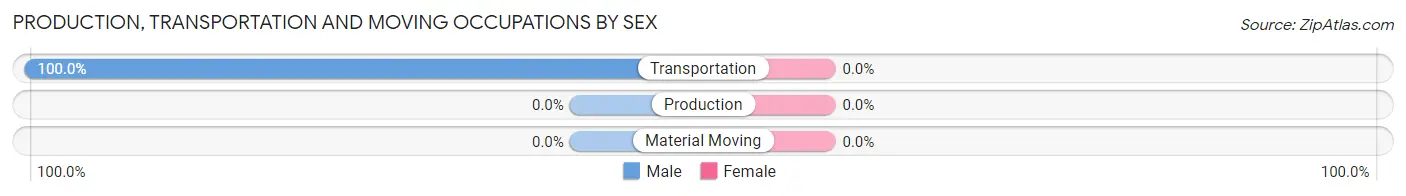
| Occupation | Male | Female |
| Production | 0 (0.0%) | 0 (0.0%) |
| Transportation | 51 (100.0%) | 0 (0.0%) |
| Material Moving | 0 (0.0%) | 0 (0.0%) |
| Total (Category) | 51 (100.0%) | 0 (0.0%) |
| Total (Overall) | 441 (58.5%) | 313 (41.5%) |
Employment Industries by Sex in Stowell
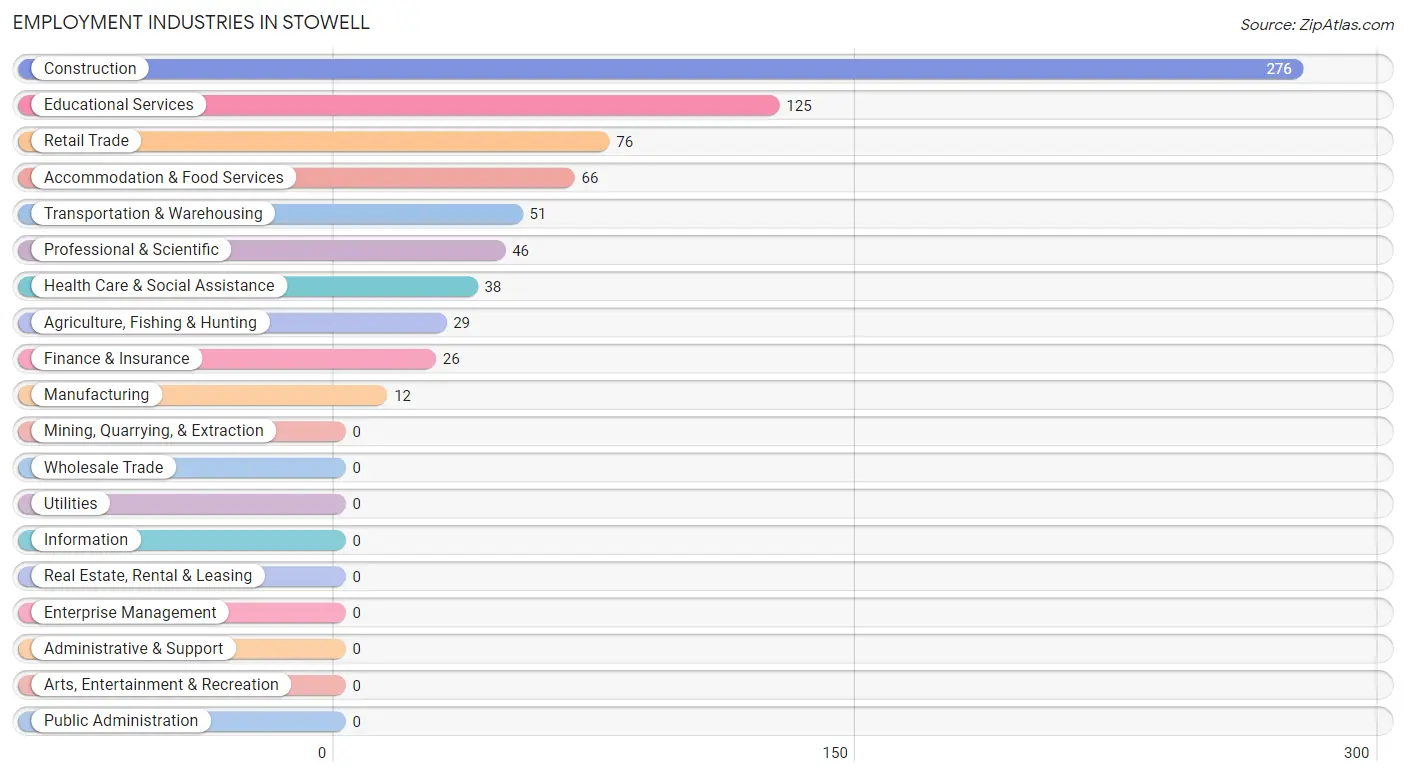
Employment Industries in Stowell
The major employment industries in Stowell include Construction (276 | 36.6%), Educational Services (125 | 16.6%), Retail Trade (76 | 10.1%), Accommodation & Food Services (66 | 8.7%), and Transportation & Warehousing (51 | 6.8%).
Employment Industries by Sex in Stowell
The Stowell industries that see more men than women are Agriculture, Fishing & Hunting (100.0%), Construction (100.0%), and Retail Trade (100.0%), whereas the industries that tend to have a higher number of women are Manufacturing (100.0%), Finance & Insurance (100.0%), and Professional & Scientific (100.0%).
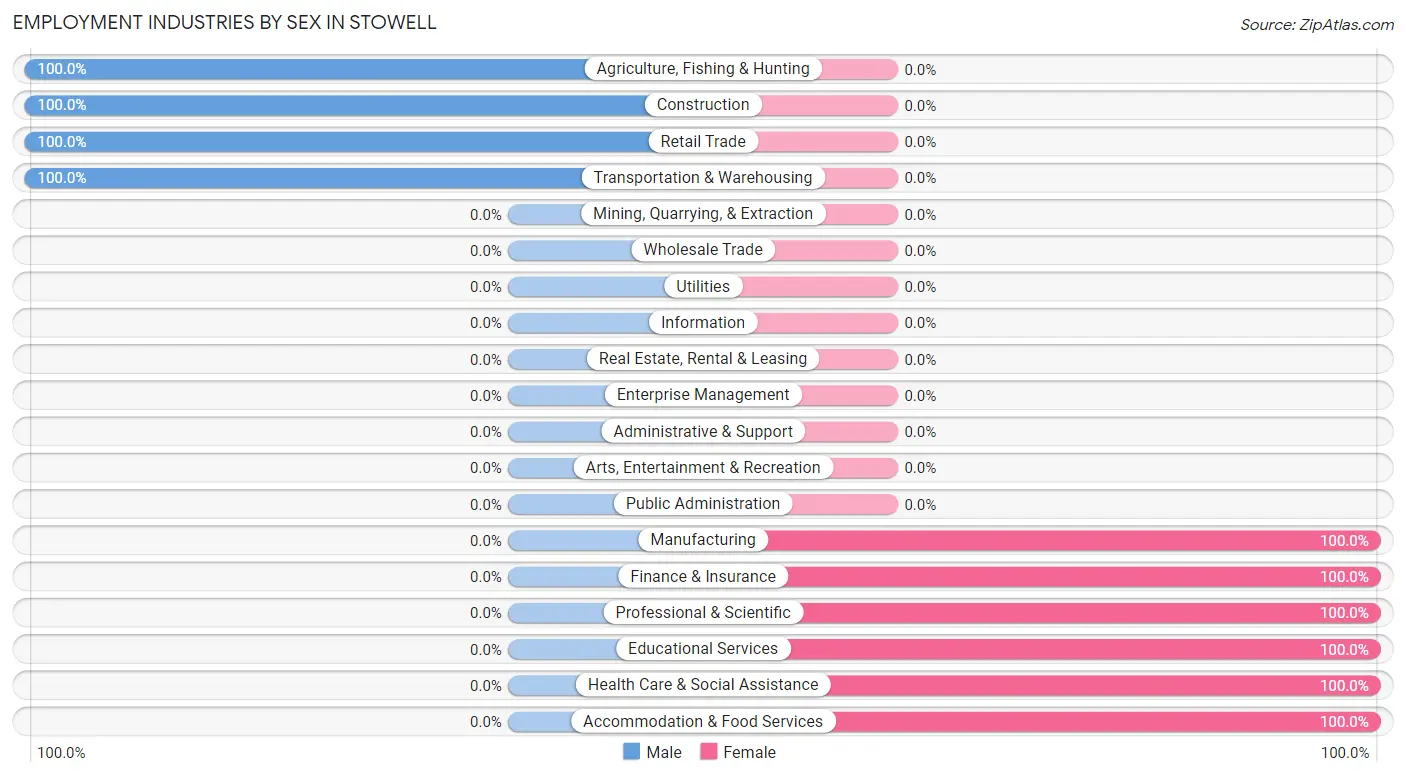
| Industry | Male | Female |
| Agriculture, Fishing & Hunting | 29 (100.0%) | 0 (0.0%) |
| Mining, Quarrying, & Extraction | 0 (0.0%) | 0 (0.0%) |
| Construction | 276 (100.0%) | 0 (0.0%) |
| Manufacturing | 0 (0.0%) | 12 (100.0%) |
| Wholesale Trade | 0 (0.0%) | 0 (0.0%) |
| Retail Trade | 76 (100.0%) | 0 (0.0%) |
| Transportation & Warehousing | 51 (100.0%) | 0 (0.0%) |
| Utilities | 0 (0.0%) | 0 (0.0%) |
| Information | 0 (0.0%) | 0 (0.0%) |
| Finance & Insurance | 0 (0.0%) | 26 (100.0%) |
| Real Estate, Rental & Leasing | 0 (0.0%) | 0 (0.0%) |
| Professional & Scientific | 0 (0.0%) | 46 (100.0%) |
| Enterprise Management | 0 (0.0%) | 0 (0.0%) |
| Administrative & Support | 0 (0.0%) | 0 (0.0%) |
| Educational Services | 0 (0.0%) | 125 (100.0%) |
| Health Care & Social Assistance | 0 (0.0%) | 38 (100.0%) |
| Arts, Entertainment & Recreation | 0 (0.0%) | 0 (0.0%) |
| Accommodation & Food Services | 0 (0.0%) | 66 (100.0%) |
| Public Administration | 0 (0.0%) | 0 (0.0%) |
| Total | 441 (58.5%) | 313 (41.5%) |
Education in Stowell
School Enrollment in Stowell
The most common levels of schooling among the 714 students in Stowell are middle school (271 | 38.0%), high school (178 | 24.9%), and elementary school (139 | 19.5%).
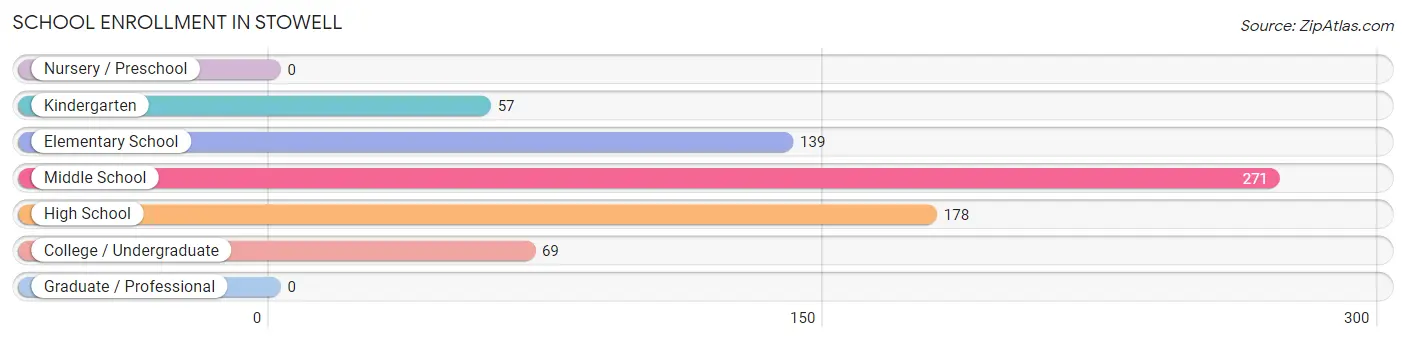
| School Level | # Students | % Students |
| Nursery / Preschool | 0 | 0.0% |
| Kindergarten | 57 | 8.0% |
| Elementary School | 139 | 19.5% |
| Middle School | 271 | 38.0% |
| High School | 178 | 24.9% |
| College / Undergraduate | 69 | 9.7% |
| Graduate / Professional | 0 | 0.0% |
| Total | 714 | 100.0% |
School Enrollment by Age by Funding Source in Stowell
Out of a total of 714 students who are enrolled in schools in Stowell, 112 (15.7%) attend a private institution, while the remaining 602 (84.3%) are enrolled in public schools. The age group of 5 to 9 year old has the highest likelihood of being enrolled in private schools, with 57 (50.4% in the age bracket) enrolled. Conversely, the age group of 15 to 17 year olds has the lowest likelihood of being enrolled in a private school, with 147 (100.0% in the age bracket) attending a public institution.
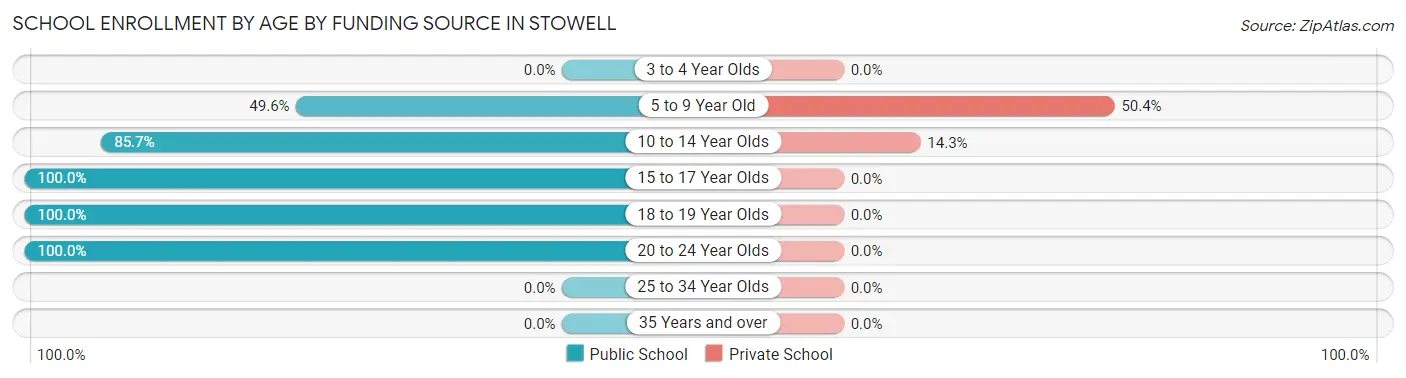
| Age Bracket | Public School | Private School |
| 3 to 4 Year Olds | 0 (0.0%) | 0 (0.0%) |
| 5 to 9 Year Old | 56 (49.6%) | 57 (50.4%) |
| 10 to 14 Year Olds | 330 (85.7%) | 55 (14.3%) |
| 15 to 17 Year Olds | 147 (100.0%) | 0 (0.0%) |
| 18 to 19 Year Olds | 23 (100.0%) | 0 (0.0%) |
| 20 to 24 Year Olds | 46 (100.0%) | 0 (0.0%) |
| 25 to 34 Year Olds | 0 (0.0%) | 0 (0.0%) |
| 35 Years and over | 0 (0.0%) | 0 (0.0%) |
| Total | 602 (84.3%) | 112 (15.7%) |
Educational Attainment by Field of Study in Stowell
Engineering (119 | 48.6%), physical & health sciences (35 | 14.3%), bio, nature & agricultural (29 | 11.8%), literature & languages (27 | 11.0%), and science & technology (19 | 7.8%) are the most common fields of study among 245 individuals in Stowell who have obtained a bachelor's degree or higher.
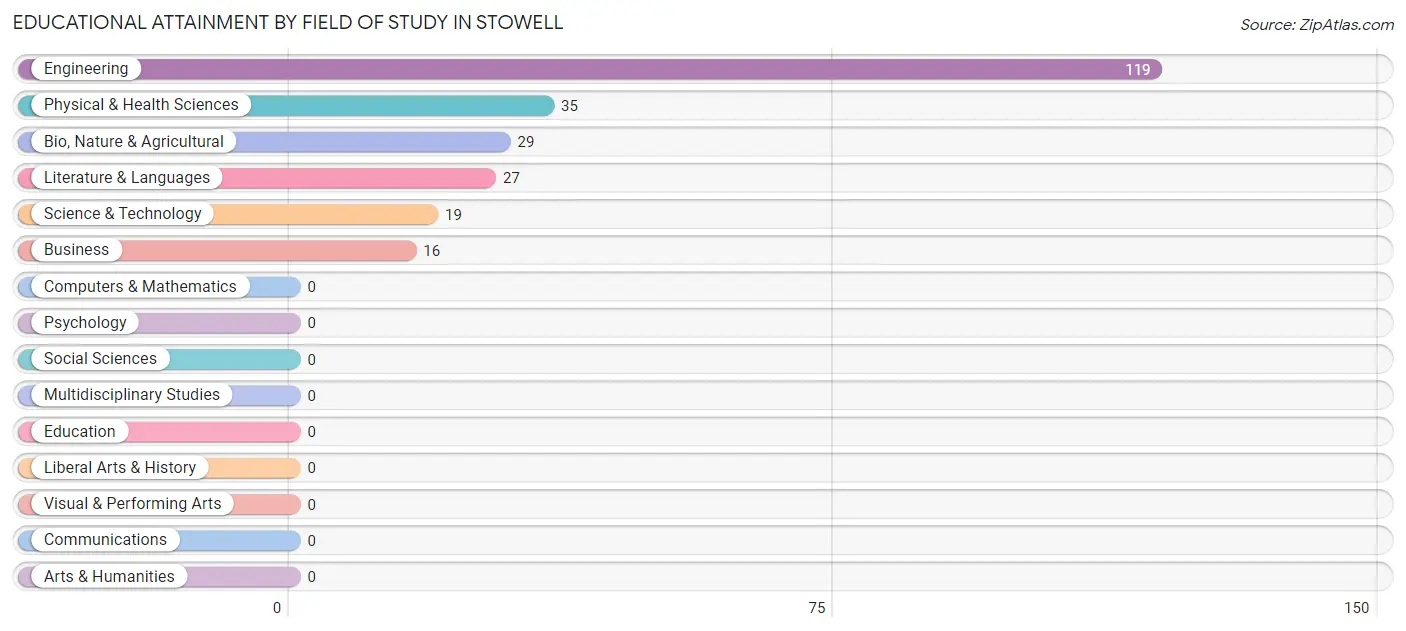
| Field of Study | # Graduates | % Graduates |
| Computers & Mathematics | 0 | 0.0% |
| Bio, Nature & Agricultural | 29 | 11.8% |
| Physical & Health Sciences | 35 | 14.3% |
| Psychology | 0 | 0.0% |
| Social Sciences | 0 | 0.0% |
| Engineering | 119 | 48.6% |
| Multidisciplinary Studies | 0 | 0.0% |
| Science & Technology | 19 | 7.8% |
| Business | 16 | 6.5% |
| Education | 0 | 0.0% |
| Literature & Languages | 27 | 11.0% |
| Liberal Arts & History | 0 | 0.0% |
| Visual & Performing Arts | 0 | 0.0% |
| Communications | 0 | 0.0% |
| Arts & Humanities | 0 | 0.0% |
| Total | 245 | 100.0% |
Transportation & Commute in Stowell
Vehicle Availability by Sex in Stowell
The most prevalent vehicle ownership categories in Stowell are males with 3 vehicles (350, accounting for 79.4%) and females with 3 vehicles (237, making up 111.8%).
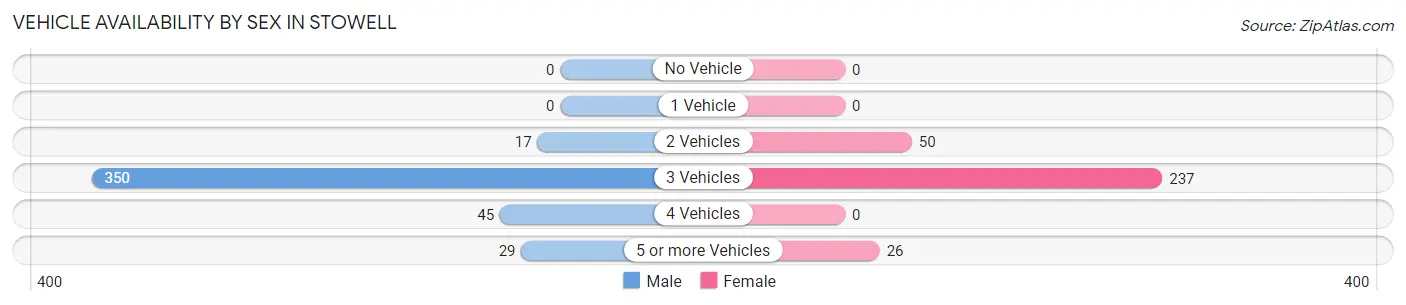
| Vehicles Available | Male | Female |
| No Vehicle | 0 (0.0%) | 0 (0.0%) |
| 1 Vehicle | 0 (0.0%) | 0 (0.0%) |
| 2 Vehicles | 17 (3.8%) | 50 (16.0%) |
| 3 Vehicles | 350 (79.4%) | 237 (75.7%) |
| 4 Vehicles | 45 (10.2%) | 0 (0.0%) |
| 5 or more Vehicles | 29 (6.6%) | 26 (8.3%) |
| Total | 441 (100.0%) | 313 (100.0%) |
Commute Time in Stowell
The most frequently occuring commute durations in Stowell are 40 to 44 minutes (298 commuters, 41.1%), 5 to 9 minutes (164 commuters, 22.6%), and 30 to 34 minutes (151 commuters, 20.8%).
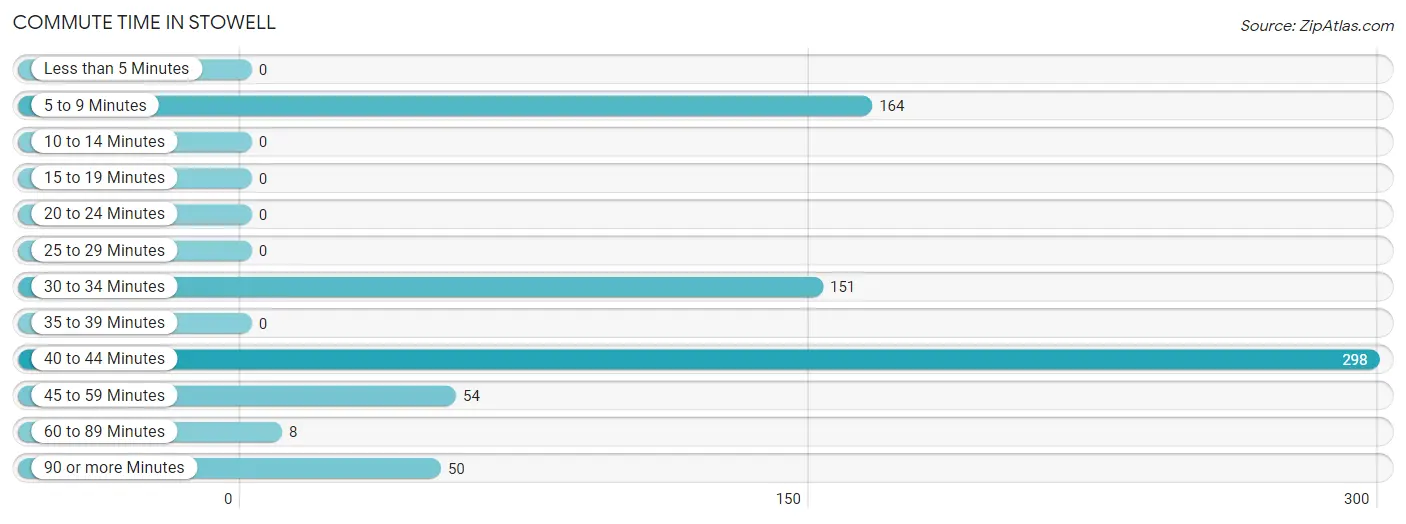
| Commute Time | # Commuters | % Commuters |
| Less than 5 Minutes | 0 | 0.0% |
| 5 to 9 Minutes | 164 | 22.6% |
| 10 to 14 Minutes | 0 | 0.0% |
| 15 to 19 Minutes | 0 | 0.0% |
| 20 to 24 Minutes | 0 | 0.0% |
| 25 to 29 Minutes | 0 | 0.0% |
| 30 to 34 Minutes | 151 | 20.8% |
| 35 to 39 Minutes | 0 | 0.0% |
| 40 to 44 Minutes | 298 | 41.1% |
| 45 to 59 Minutes | 54 | 7.4% |
| 60 to 89 Minutes | 8 | 1.1% |
| 90 or more Minutes | 50 | 6.9% |
Commute Time by Sex in Stowell
The most common commute times in Stowell are 40 to 44 minutes (231 commuters, 56.1%) for males and 5 to 9 minutes (164 commuters, 52.4%) for females.
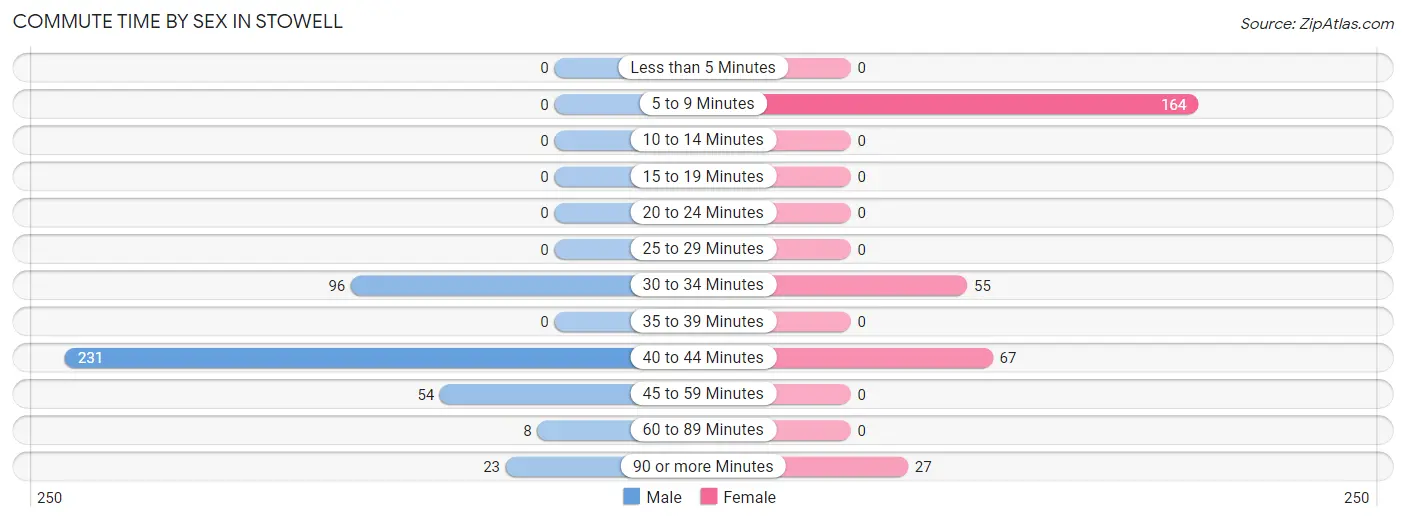
| Commute Time | Male | Female |
| Less than 5 Minutes | 0 (0.0%) | 0 (0.0%) |
| 5 to 9 Minutes | 0 (0.0%) | 164 (52.4%) |
| 10 to 14 Minutes | 0 (0.0%) | 0 (0.0%) |
| 15 to 19 Minutes | 0 (0.0%) | 0 (0.0%) |
| 20 to 24 Minutes | 0 (0.0%) | 0 (0.0%) |
| 25 to 29 Minutes | 0 (0.0%) | 0 (0.0%) |
| 30 to 34 Minutes | 96 (23.3%) | 55 (17.6%) |
| 35 to 39 Minutes | 0 (0.0%) | 0 (0.0%) |
| 40 to 44 Minutes | 231 (56.1%) | 67 (21.4%) |
| 45 to 59 Minutes | 54 (13.1%) | 0 (0.0%) |
| 60 to 89 Minutes | 8 (1.9%) | 0 (0.0%) |
| 90 or more Minutes | 23 (5.6%) | 27 (8.6%) |
Time of Departure to Work by Sex in Stowell
The most frequent times of departure to work in Stowell are 8:00 AM to 8:29 AM (213, 51.7%) for males and 4:00 PM to 11:59 PM (98, 31.3%) for females.
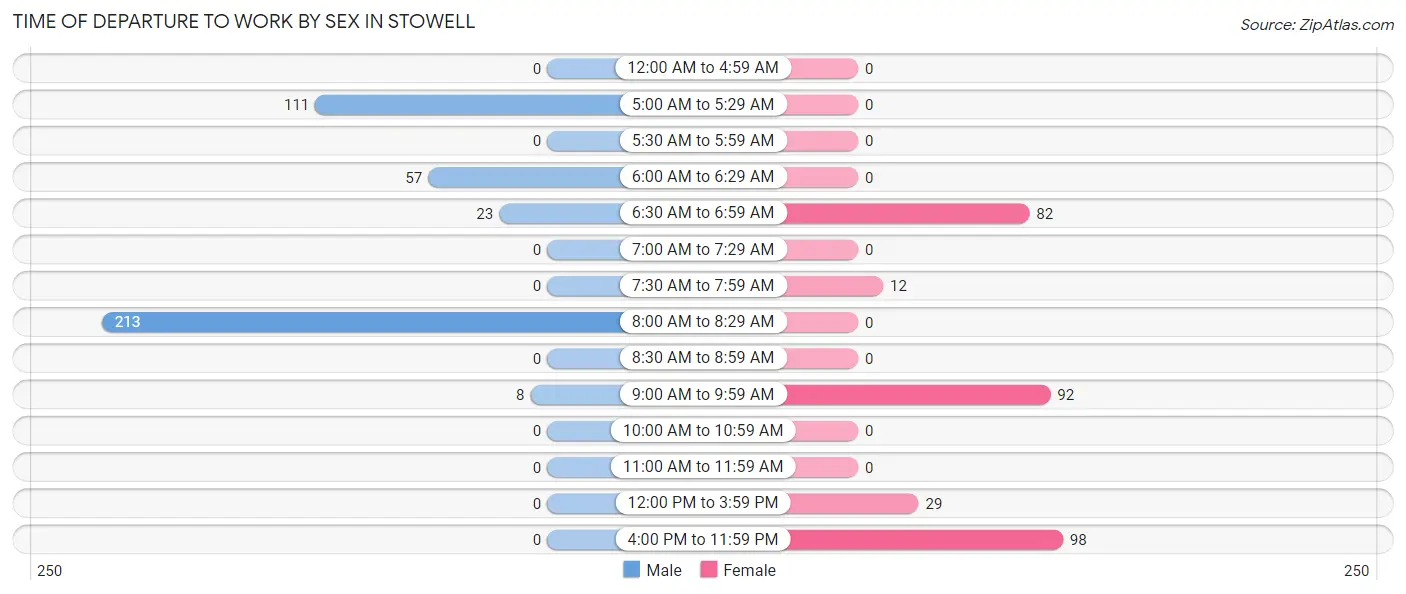
| Time of Departure | Male | Female |
| 12:00 AM to 4:59 AM | 0 (0.0%) | 0 (0.0%) |
| 5:00 AM to 5:29 AM | 111 (26.9%) | 0 (0.0%) |
| 5:30 AM to 5:59 AM | 0 (0.0%) | 0 (0.0%) |
| 6:00 AM to 6:29 AM | 57 (13.8%) | 0 (0.0%) |
| 6:30 AM to 6:59 AM | 23 (5.6%) | 82 (26.2%) |
| 7:00 AM to 7:29 AM | 0 (0.0%) | 0 (0.0%) |
| 7:30 AM to 7:59 AM | 0 (0.0%) | 12 (3.8%) |
| 8:00 AM to 8:29 AM | 213 (51.7%) | 0 (0.0%) |
| 8:30 AM to 8:59 AM | 0 (0.0%) | 0 (0.0%) |
| 9:00 AM to 9:59 AM | 8 (1.9%) | 92 (29.4%) |
| 10:00 AM to 10:59 AM | 0 (0.0%) | 0 (0.0%) |
| 11:00 AM to 11:59 AM | 0 (0.0%) | 0 (0.0%) |
| 12:00 PM to 3:59 PM | 0 (0.0%) | 29 (9.3%) |
| 4:00 PM to 11:59 PM | 0 (0.0%) | 98 (31.3%) |
| Total | 412 (100.0%) | 313 (100.0%) |
Housing Occupancy in Stowell
Occupancy by Ownership in Stowell
Of the total 622 dwellings in Stowell, owner-occupied units account for 464 (74.6%), while renter-occupied units make up 158 (25.4%).
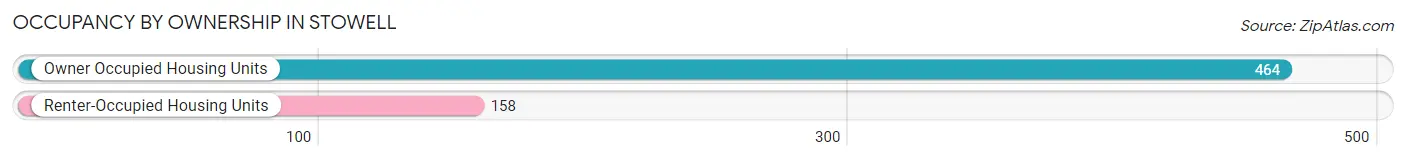
| Occupancy | # Housing Units | % Housing Units |
| Owner Occupied Housing Units | 464 | 74.6% |
| Renter-Occupied Housing Units | 158 | 25.4% |
| Total Occupied Housing Units | 622 | 100.0% |
Occupancy by Household Size in Stowell
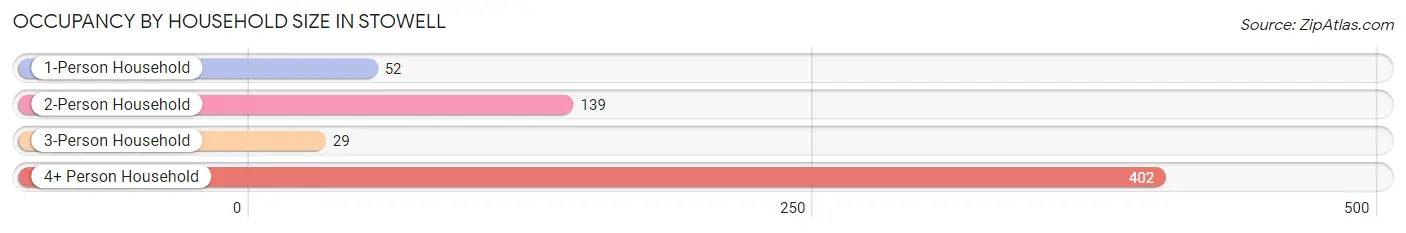
| Household Size | # Housing Units | % Housing Units |
| 1-Person Household | 52 | 8.4% |
| 2-Person Household | 139 | 22.4% |
| 3-Person Household | 29 | 4.7% |
| 4+ Person Household | 402 | 64.6% |
| Total Housing Units | 622 | 100.0% |
Occupancy by Ownership by Household Size in Stowell
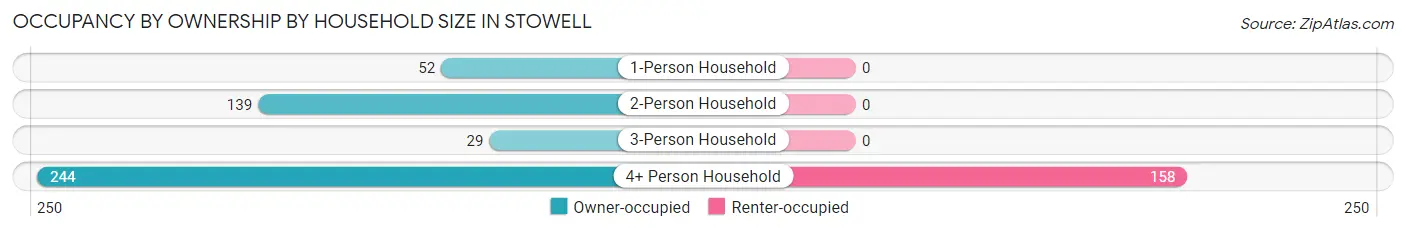
| Household Size | Owner-occupied | Renter-occupied |
| 1-Person Household | 52 (100.0%) | 0 (0.0%) |
| 2-Person Household | 139 (100.0%) | 0 (0.0%) |
| 3-Person Household | 29 (100.0%) | 0 (0.0%) |
| 4+ Person Household | 244 (60.7%) | 158 (39.3%) |
| Total Housing Units | 464 (74.6%) | 158 (25.4%) |
Occupancy by Educational Attainment in Stowell
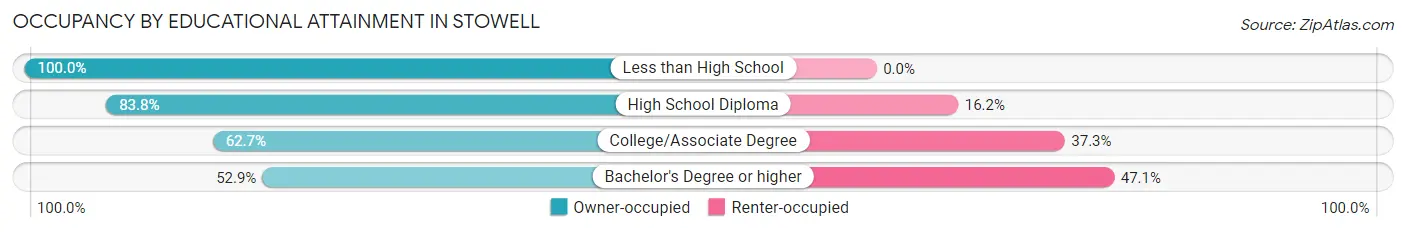
| Household Size | Owner-occupied | Renter-occupied |
| Less than High School | 52 (100.0%) | 0 (0.0%) |
| High School Diploma | 264 (83.8%) | 51 (16.2%) |
| College/Associate Degree | 84 (62.7%) | 50 (37.3%) |
| Bachelor's Degree or higher | 64 (52.9%) | 57 (47.1%) |
Occupancy by Age of Householder in Stowell
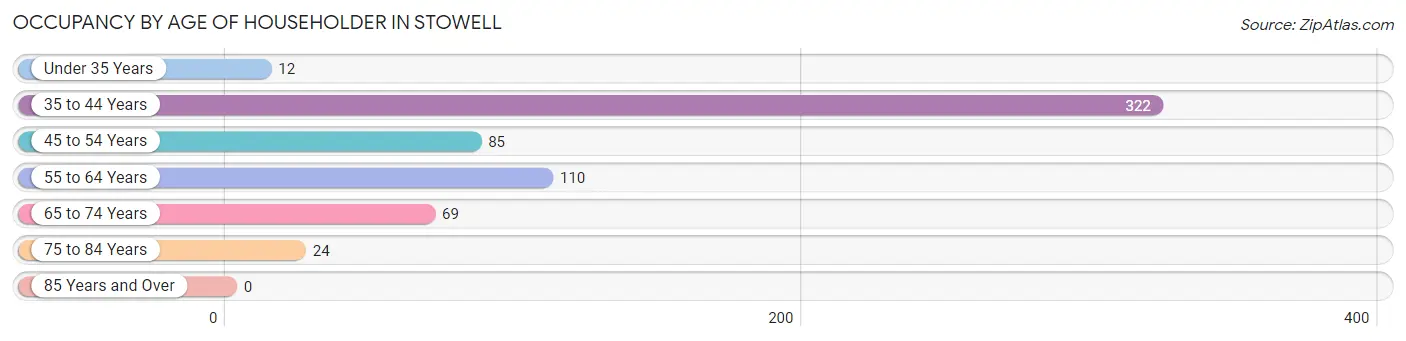
| Age Bracket | # Households | % Households |
| Under 35 Years | 12 | 1.9% |
| 35 to 44 Years | 322 | 51.8% |
| 45 to 54 Years | 85 | 13.7% |
| 55 to 64 Years | 110 | 17.7% |
| 65 to 74 Years | 69 | 11.1% |
| 75 to 84 Years | 24 | 3.9% |
| 85 Years and Over | 0 | 0.0% |
| Total | 622 | 100.0% |
Housing Finances in Stowell
Median Income by Occupancy in Stowell
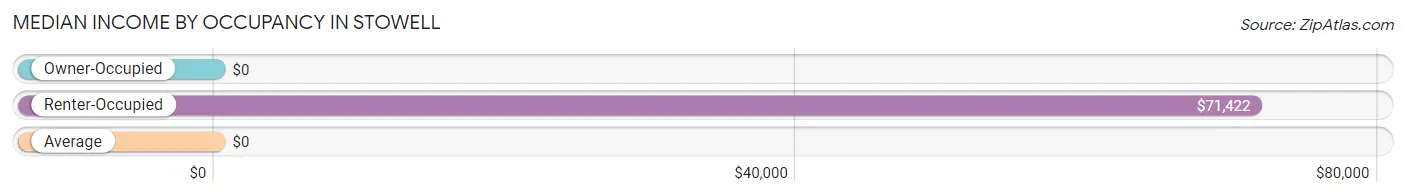
| Occupancy Type | # Households | Median Income |
| Owner-Occupied | 464 (74.6%) | $0 |
| Renter-Occupied | 158 (25.4%) | $71,422 |
| Average | 622 (100.0%) | $0 |
Occupancy by Householder Income Bracket in Stowell
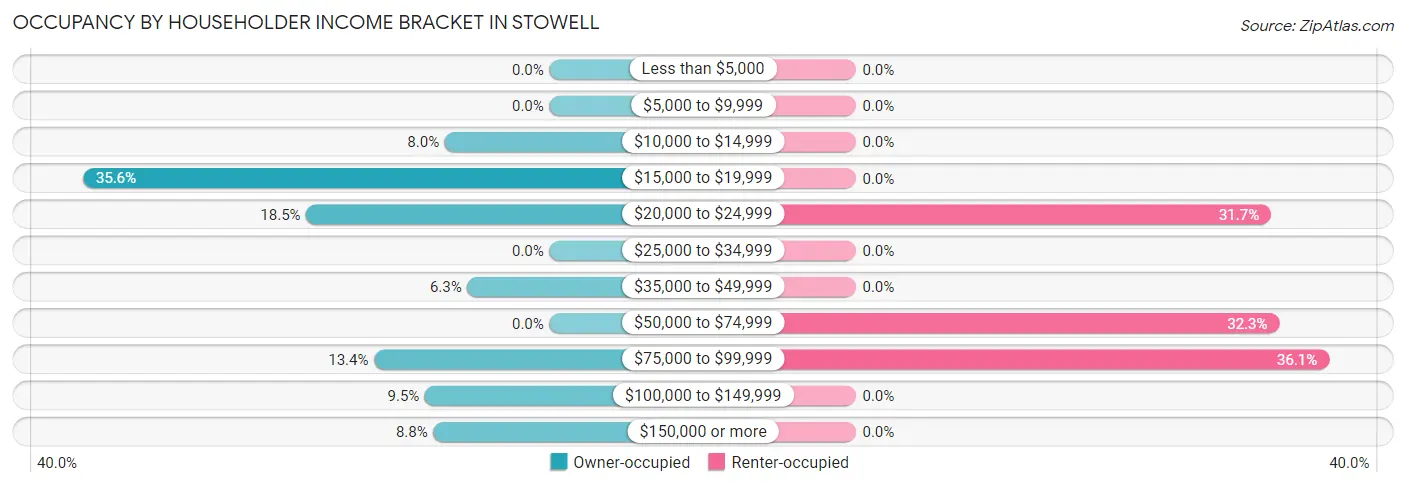
| Income Bracket | Owner-occupied | Renter-occupied |
| Less than $5,000 | 0 (0.0%) | 0 (0.0%) |
| $5,000 to $9,999 | 0 (0.0%) | 0 (0.0%) |
| $10,000 to $14,999 | 37 (8.0%) | 0 (0.0%) |
| $15,000 to $19,999 | 165 (35.6%) | 0 (0.0%) |
| $20,000 to $24,999 | 86 (18.5%) | 50 (31.7%) |
| $25,000 to $34,999 | 0 (0.0%) | 0 (0.0%) |
| $35,000 to $49,999 | 29 (6.2%) | 0 (0.0%) |
| $50,000 to $74,999 | 0 (0.0%) | 51 (32.3%) |
| $75,000 to $99,999 | 62 (13.4%) | 57 (36.1%) |
| $100,000 to $149,999 | 44 (9.5%) | 0 (0.0%) |
| $150,000 or more | 41 (8.8%) | 0 (0.0%) |
| Total | 464 (100.0%) | 158 (100.0%) |
Monthly Housing Cost Tiers in Stowell
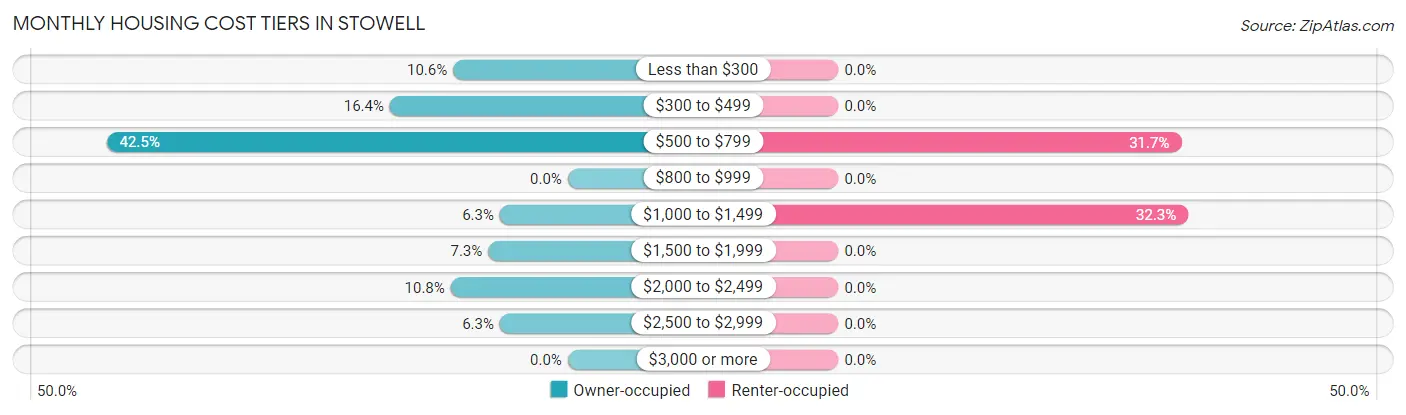
| Monthly Cost | Owner-occupied | Renter-occupied |
| Less than $300 | 49 (10.6%) | 0 (0.0%) |
| $300 to $499 | 76 (16.4%) | 0 (0.0%) |
| $500 to $799 | 197 (42.5%) | 50 (31.7%) |
| $800 to $999 | 0 (0.0%) | 0 (0.0%) |
| $1,000 to $1,499 | 29 (6.2%) | 51 (32.3%) |
| $1,500 to $1,999 | 34 (7.3%) | 0 (0.0%) |
| $2,000 to $2,499 | 50 (10.8%) | 0 (0.0%) |
| $2,500 to $2,999 | 29 (6.2%) | 0 (0.0%) |
| $3,000 or more | 0 (0.0%) | 0 (0.0%) |
| Total | 464 (100.0%) | 158 (100.0%) |
Physical Housing Characteristics in Stowell
Housing Structures in Stowell
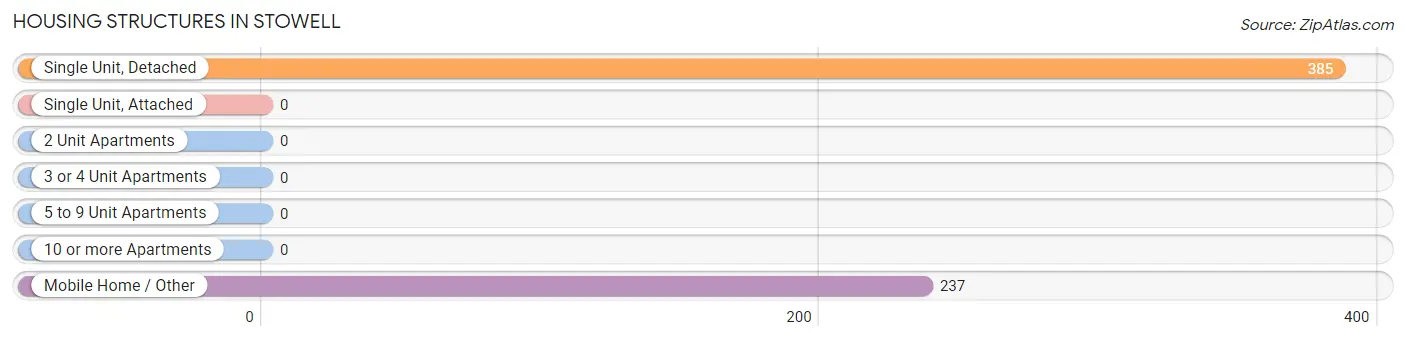
| Structure Type | # Housing Units | % Housing Units |
| Single Unit, Detached | 385 | 61.9% |
| Single Unit, Attached | 0 | 0.0% |
| 2 Unit Apartments | 0 | 0.0% |
| 3 or 4 Unit Apartments | 0 | 0.0% |
| 5 to 9 Unit Apartments | 0 | 0.0% |
| 10 or more Apartments | 0 | 0.0% |
| Mobile Home / Other | 237 | 38.1% |
| Total | 622 | 100.0% |
Housing Structures by Occupancy in Stowell
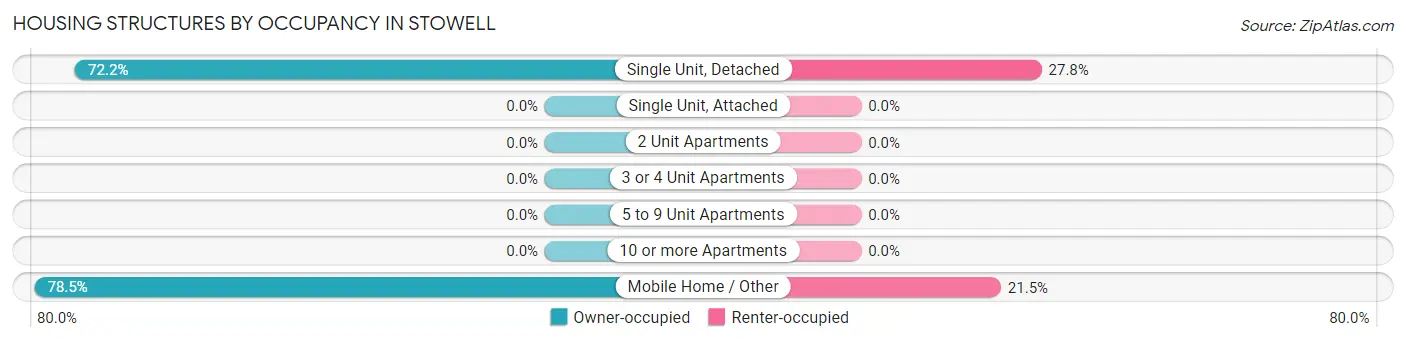
| Structure Type | Owner-occupied | Renter-occupied |
| Single Unit, Detached | 278 (72.2%) | 107 (27.8%) |
| Single Unit, Attached | 0 (0.0%) | 0 (0.0%) |
| 2 Unit Apartments | 0 (0.0%) | 0 (0.0%) |
| 3 or 4 Unit Apartments | 0 (0.0%) | 0 (0.0%) |
| 5 to 9 Unit Apartments | 0 (0.0%) | 0 (0.0%) |
| 10 or more Apartments | 0 (0.0%) | 0 (0.0%) |
| Mobile Home / Other | 186 (78.5%) | 51 (21.5%) |
| Total | 464 (74.6%) | 158 (25.4%) |
Housing Structures by Number of Rooms in Stowell
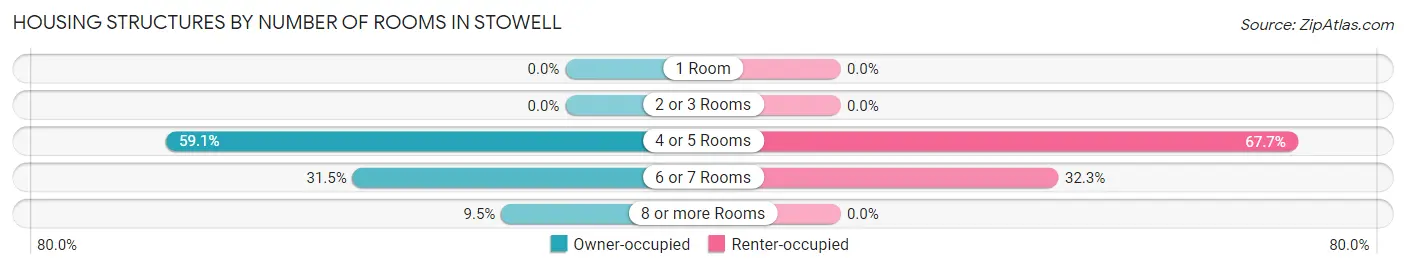
| Number of Rooms | Owner-occupied | Renter-occupied |
| 1 Room | 0 (0.0%) | 0 (0.0%) |
| 2 or 3 Rooms | 0 (0.0%) | 0 (0.0%) |
| 4 or 5 Rooms | 274 (59.1%) | 107 (67.7%) |
| 6 or 7 Rooms | 146 (31.5%) | 51 (32.3%) |
| 8 or more Rooms | 44 (9.5%) | 0 (0.0%) |
| Total | 464 (100.0%) | 158 (100.0%) |
Housing Structure by Heating Type in Stowell
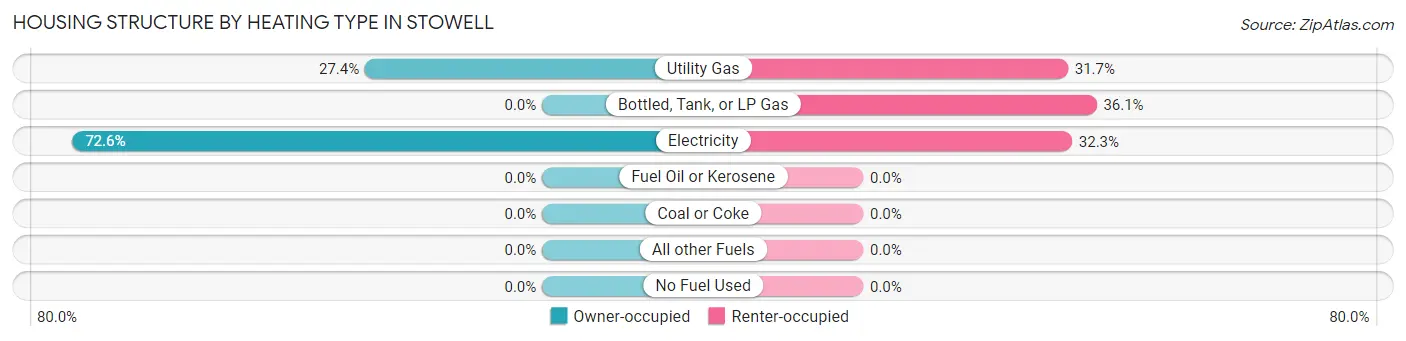
| Heating Type | Owner-occupied | Renter-occupied |
| Utility Gas | 127 (27.4%) | 50 (31.7%) |
| Bottled, Tank, or LP Gas | 0 (0.0%) | 57 (36.1%) |
| Electricity | 337 (72.6%) | 51 (32.3%) |
| Fuel Oil or Kerosene | 0 (0.0%) | 0 (0.0%) |
| Coal or Coke | 0 (0.0%) | 0 (0.0%) |
| All other Fuels | 0 (0.0%) | 0 (0.0%) |
| No Fuel Used | 0 (0.0%) | 0 (0.0%) |
| Total | 464 (100.0%) | 158 (100.0%) |
Household Vehicle Usage in Stowell
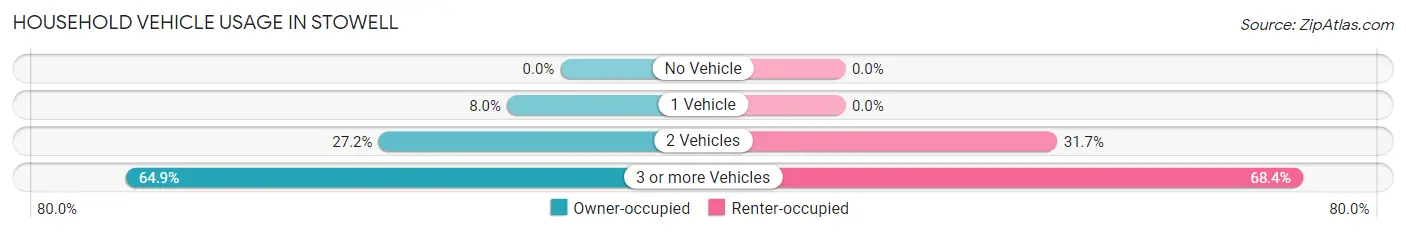
| Vehicles per Household | Owner-occupied | Renter-occupied |
| No Vehicle | 0 (0.0%) | 0 (0.0%) |
| 1 Vehicle | 37 (8.0%) | 0 (0.0%) |
| 2 Vehicles | 126 (27.2%) | 50 (31.7%) |
| 3 or more Vehicles | 301 (64.9%) | 108 (68.3%) |
| Total | 464 (100.0%) | 158 (100.0%) |
Real Estate & Mortgages in Stowell
Real Estate and Mortgage Overview in Stowell
| Characteristic | Without Mortgage | With Mortgage |
| Housing Units | 351 | 113 |
| Median Property Value | $113,300 | $222,500 |
| Median Household Income | $17,098 | $0 |
| Monthly Housing Costs | $531 | $0 |
| Real Estate Taxes | $1,653 | $0 |
Property Value by Mortgage Status in Stowell
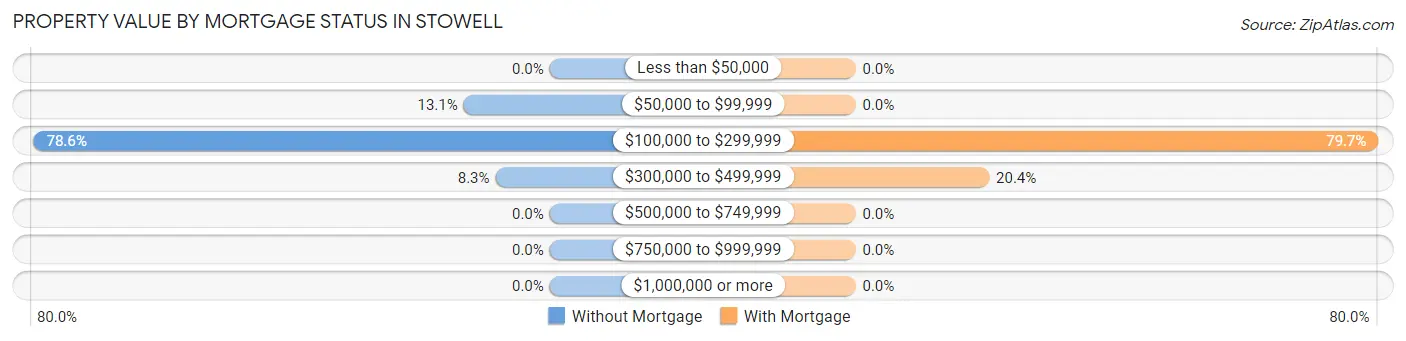
| Property Value | Without Mortgage | With Mortgage |
| Less than $50,000 | 0 (0.0%) | 0 (0.0%) |
| $50,000 to $99,999 | 46 (13.1%) | 0 (0.0%) |
| $100,000 to $299,999 | 276 (78.6%) | 90 (79.6%) |
| $300,000 to $499,999 | 29 (8.3%) | 23 (20.3%) |
| $500,000 to $749,999 | 0 (0.0%) | 0 (0.0%) |
| $750,000 to $999,999 | 0 (0.0%) | 0 (0.0%) |
| $1,000,000 or more | 0 (0.0%) | 0 (0.0%) |
| Total | 351 (100.0%) | 113 (100.0%) |
Household Income by Mortgage Status in Stowell
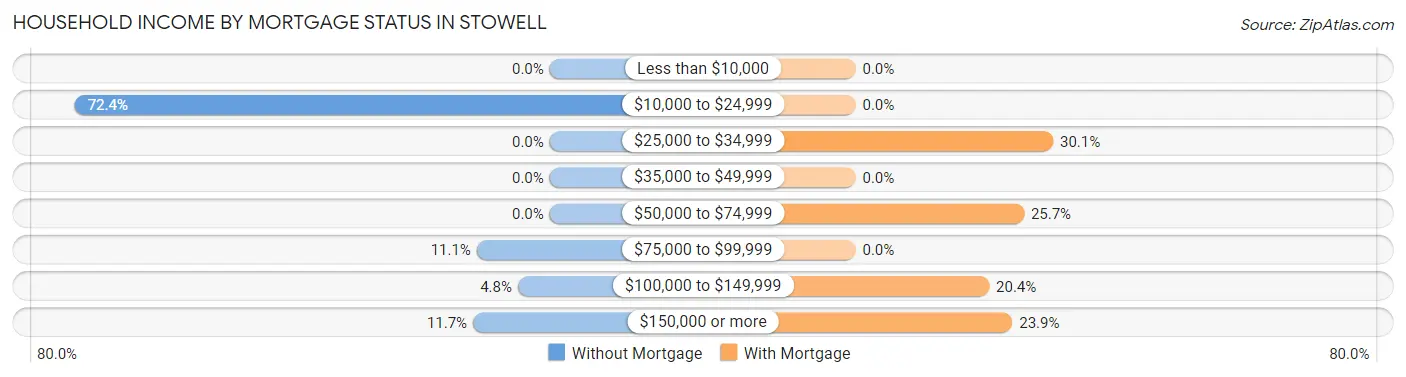
| Household Income | Without Mortgage | With Mortgage |
| Less than $10,000 | 0 (0.0%) | 0 (0.0%) |
| $10,000 to $24,999 | 254 (72.4%) | 0 (0.0%) |
| $25,000 to $34,999 | 0 (0.0%) | 34 (30.1%) |
| $35,000 to $49,999 | 0 (0.0%) | 0 (0.0%) |
| $50,000 to $74,999 | 0 (0.0%) | 29 (25.7%) |
| $75,000 to $99,999 | 39 (11.1%) | 0 (0.0%) |
| $100,000 to $149,999 | 17 (4.8%) | 23 (20.3%) |
| $150,000 or more | 41 (11.7%) | 27 (23.9%) |
| Total | 351 (100.0%) | 113 (100.0%) |
Property Value to Household Income Ratio in Stowell
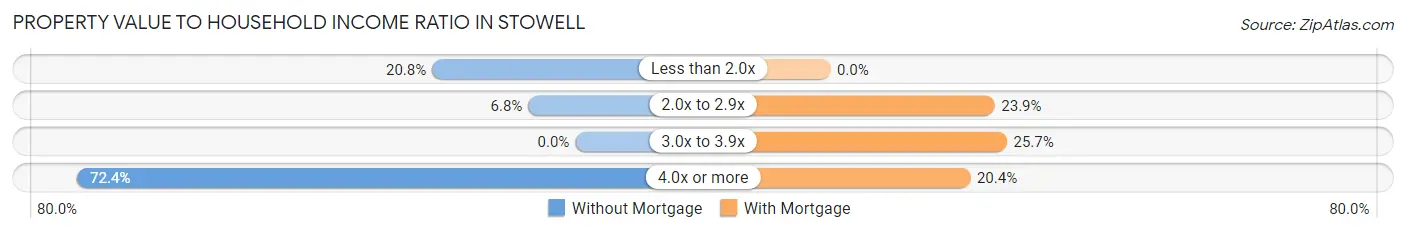
| Value-to-Income Ratio | Without Mortgage | With Mortgage |
| Less than 2.0x | 73 (20.8%) | 0 (0.0%) |
| 2.0x to 2.9x | 24 (6.8%) | 27 (23.9%) |
| 3.0x to 3.9x | 0 (0.0%) | 29 (25.7%) |
| 4.0x or more | 254 (72.4%) | 23 (20.3%) |
| Total | 351 (100.0%) | 113 (100.0%) |
Real Estate Taxes by Mortgage Status in Stowell
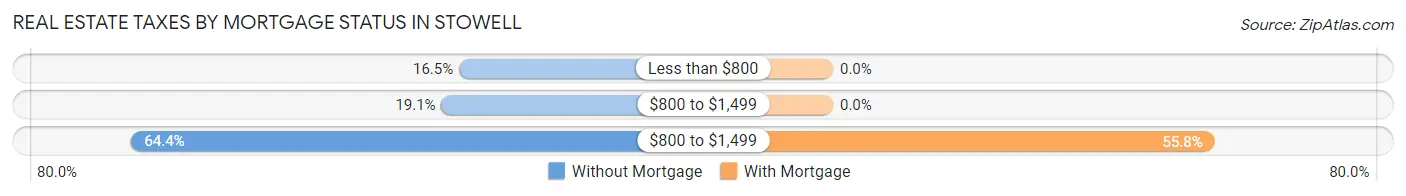
| Property Taxes | Without Mortgage | With Mortgage |
| Less than $800 | 58 (16.5%) | 0 (0.0%) |
| $800 to $1,499 | 67 (19.1%) | 0 (0.0%) |
| $800 to $1,499 | 226 (64.4%) | 63 (55.7%) |
| Total | 351 (100.0%) | 113 (100.0%) |
Health & Disability in Stowell
Health Insurance Coverage by Age in Stowell
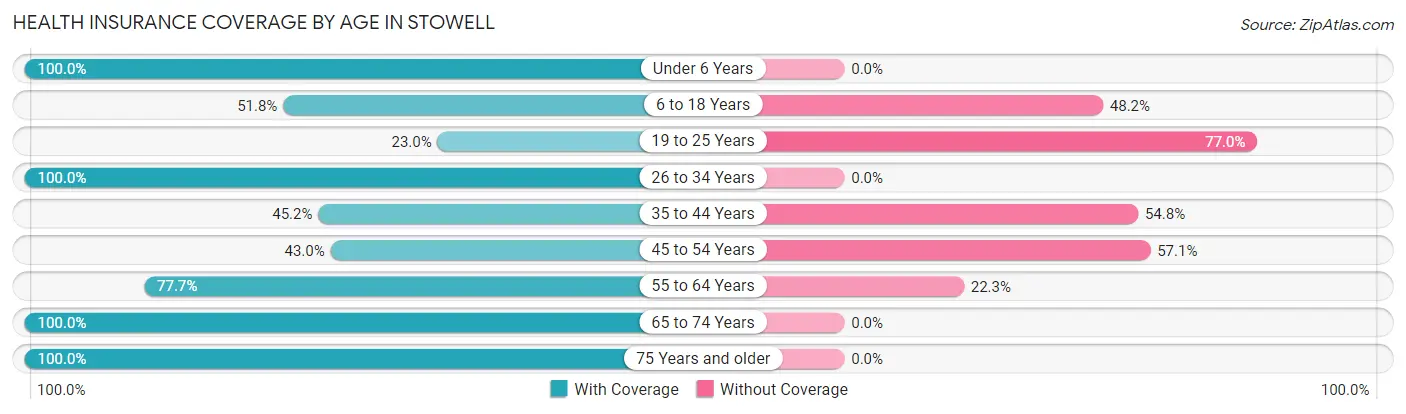
| Age Bracket | With Coverage | Without Coverage |
| Under 6 Years | 43 (100.0%) | 0 (0.0%) |
| 6 to 18 Years | 334 (51.8%) | 311 (48.2%) |
| 19 to 25 Years | 43 (23.0%) | 144 (77.0%) |
| 26 to 34 Years | 20 (100.0%) | 0 (0.0%) |
| 35 to 44 Years | 242 (45.2%) | 293 (54.8%) |
| 45 to 54 Years | 64 (42.9%) | 85 (57.1%) |
| 55 to 64 Years | 136 (77.7%) | 39 (22.3%) |
| 65 to 74 Years | 182 (100.0%) | 0 (0.0%) |
| 75 Years and older | 24 (100.0%) | 0 (0.0%) |
| Total | 1,088 (55.5%) | 872 (44.5%) |
Health Insurance Coverage by Citizenship Status in Stowell
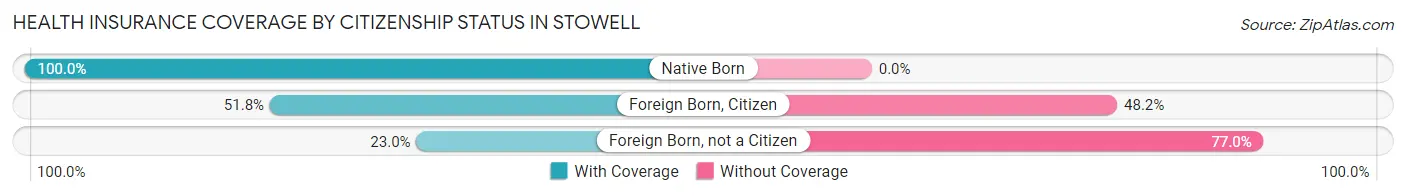
| Citizenship Status | With Coverage | Without Coverage |
| Native Born | 43 (100.0%) | 0 (0.0%) |
| Foreign Born, Citizen | 334 (51.8%) | 311 (48.2%) |
| Foreign Born, not a Citizen | 43 (23.0%) | 144 (77.0%) |
Health Insurance Coverage by Household Income in Stowell
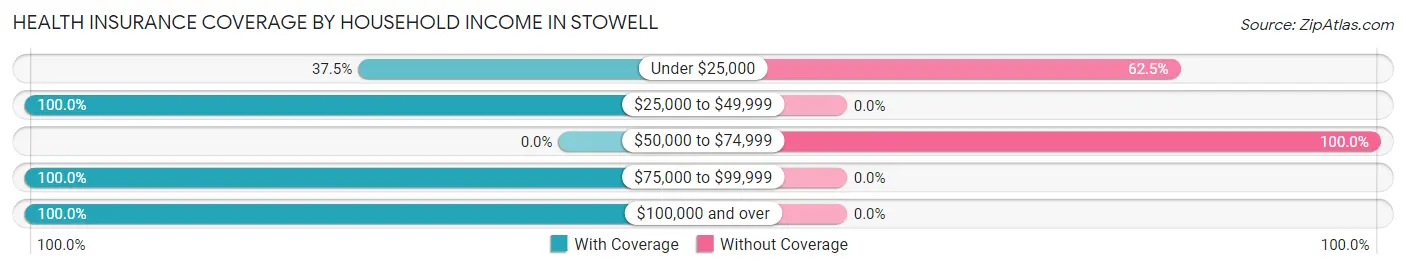
| Household Income | With Coverage | Without Coverage |
| Under $25,000 | 343 (37.5%) | 571 (62.5%) |
| $25,000 to $49,999 | 107 (100.0%) | 0 (0.0%) |
| $50,000 to $74,999 | 0 (0.0%) | 301 (100.0%) |
| $75,000 to $99,999 | 399 (100.0%) | 0 (0.0%) |
| $100,000 and over | 239 (100.0%) | 0 (0.0%) |
Public vs Private Health Insurance Coverage by Age in Stowell
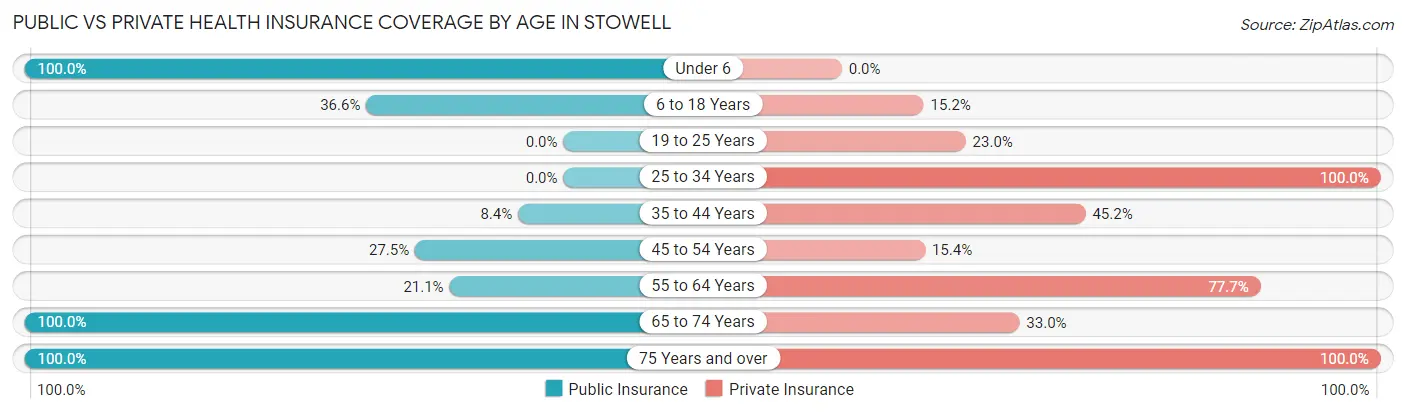
| Age Bracket | Public Insurance | Private Insurance |
| Under 6 | 43 (100.0%) | 0 (0.0%) |
| 6 to 18 Years | 236 (36.6%) | 98 (15.2%) |
| 19 to 25 Years | 0 (0.0%) | 43 (23.0%) |
| 25 to 34 Years | 0 (0.0%) | 20 (100.0%) |
| 35 to 44 Years | 45 (8.4%) | 242 (45.2%) |
| 45 to 54 Years | 41 (27.5%) | 23 (15.4%) |
| 55 to 64 Years | 37 (21.1%) | 136 (77.7%) |
| 65 to 74 Years | 182 (100.0%) | 60 (33.0%) |
| 75 Years and over | 24 (100.0%) | 24 (100.0%) |
| Total | 608 (31.0%) | 646 (33.0%) |
Disability Status by Sex by Age in Stowell
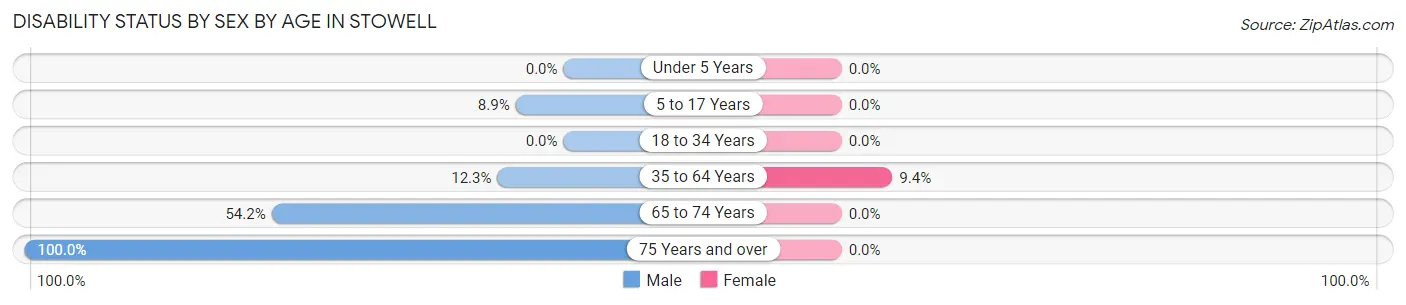
| Age Bracket | Male | Female |
| Under 5 Years | 0 (0.0%) | 0 (0.0%) |
| 5 to 17 Years | 46 (8.9%) | 0 (0.0%) |
| 18 to 34 Years | 0 (0.0%) | 0 (0.0%) |
| 35 to 64 Years | 57 (12.3%) | 37 (9.4%) |
| 65 to 74 Years | 52 (54.2%) | 0 (0.0%) |
| 75 Years and over | 24 (100.0%) | 0 (0.0%) |
Disability Class by Sex by Age in Stowell
Disability Class: Hearing Difficulty
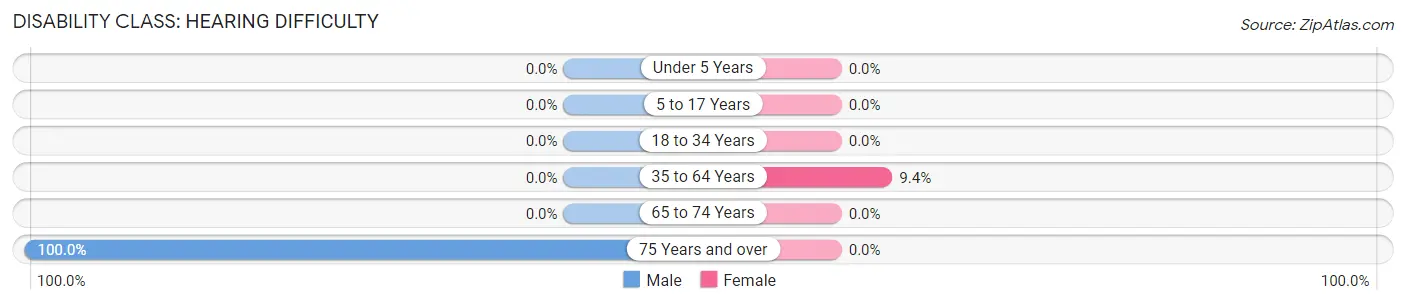
| Age Bracket | Male | Female |
| Under 5 Years | 0 (0.0%) | 0 (0.0%) |
| 5 to 17 Years | 0 (0.0%) | 0 (0.0%) |
| 18 to 34 Years | 0 (0.0%) | 0 (0.0%) |
| 35 to 64 Years | 0 (0.0%) | 37 (9.4%) |
| 65 to 74 Years | 0 (0.0%) | 0 (0.0%) |
| 75 Years and over | 24 (100.0%) | 0 (0.0%) |
Disability Class: Vision Difficulty
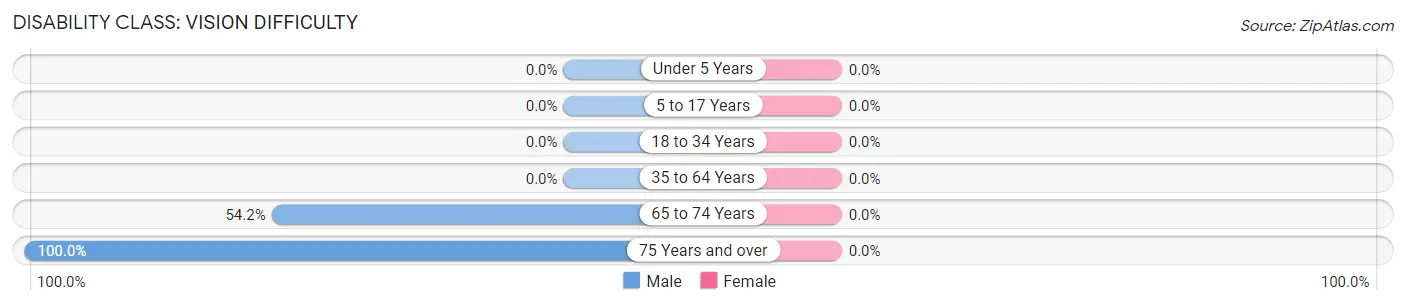
| Age Bracket | Male | Female |
| Under 5 Years | 0 (0.0%) | 0 (0.0%) |
| 5 to 17 Years | 0 (0.0%) | 0 (0.0%) |
| 18 to 34 Years | 0 (0.0%) | 0 (0.0%) |
| 35 to 64 Years | 0 (0.0%) | 0 (0.0%) |
| 65 to 74 Years | 52 (54.2%) | 0 (0.0%) |
| 75 Years and over | 24 (100.0%) | 0 (0.0%) |
Disability Class: Cognitive Difficulty

| Age Bracket | Male | Female |
| 5 to 17 Years | 46 (8.9%) | 0 (0.0%) |
| 18 to 34 Years | 0 (0.0%) | 0 (0.0%) |
| 35 to 64 Years | 57 (12.3%) | 0 (0.0%) |
| 65 to 74 Years | 52 (54.2%) | 0 (0.0%) |
| 75 Years and over | 0 (0.0%) | 0 (0.0%) |
Disability Class: Ambulatory Difficulty
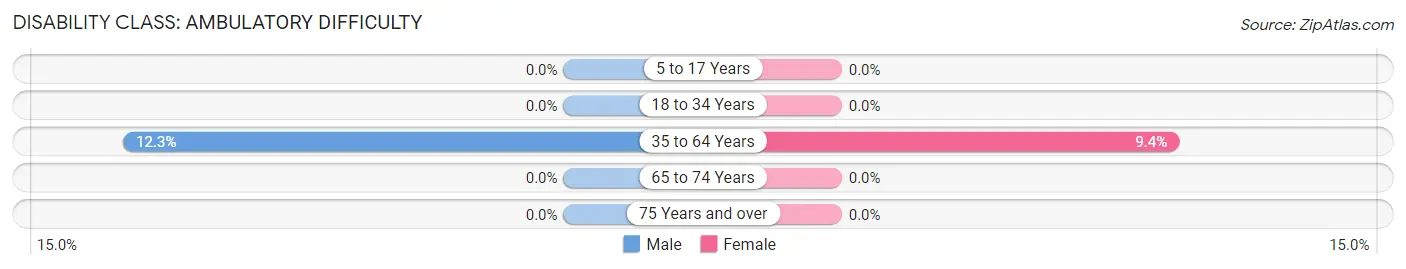
| Age Bracket | Male | Female |
| 5 to 17 Years | 0 (0.0%) | 0 (0.0%) |
| 18 to 34 Years | 0 (0.0%) | 0 (0.0%) |
| 35 to 64 Years | 57 (12.3%) | 37 (9.4%) |
| 65 to 74 Years | 0 (0.0%) | 0 (0.0%) |
| 75 Years and over | 0 (0.0%) | 0 (0.0%) |
Disability Class: Self-Care Difficulty
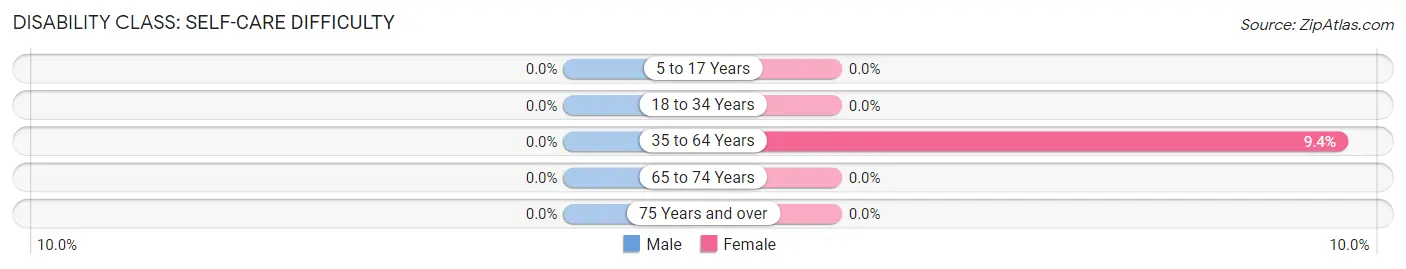
| Age Bracket | Male | Female |
| 5 to 17 Years | 0 (0.0%) | 0 (0.0%) |
| 18 to 34 Years | 0 (0.0%) | 0 (0.0%) |
| 35 to 64 Years | 0 (0.0%) | 37 (9.4%) |
| 65 to 74 Years | 0 (0.0%) | 0 (0.0%) |
| 75 Years and over | 0 (0.0%) | 0 (0.0%) |
Technology Access in Stowell
Computing Device Access in Stowell
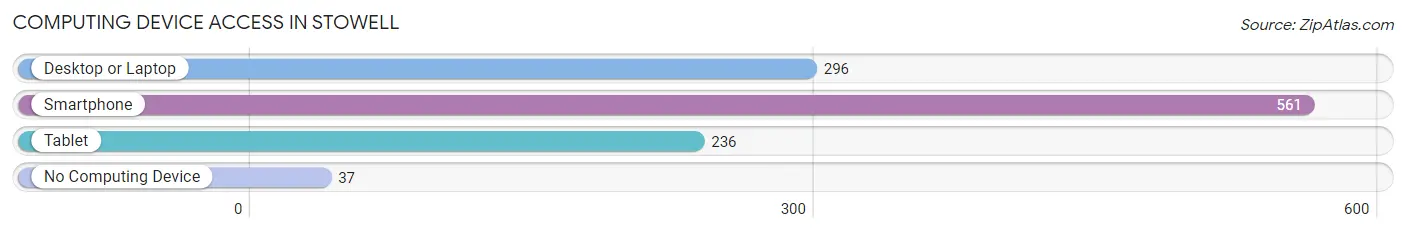
| Device Type | # Households | % Households |
| Desktop or Laptop | 296 | 47.6% |
| Smartphone | 561 | 90.2% |
| Tablet | 236 | 37.9% |
| No Computing Device | 37 | 5.9% |
| Total | 622 | 100.0% |
Internet Access in Stowell
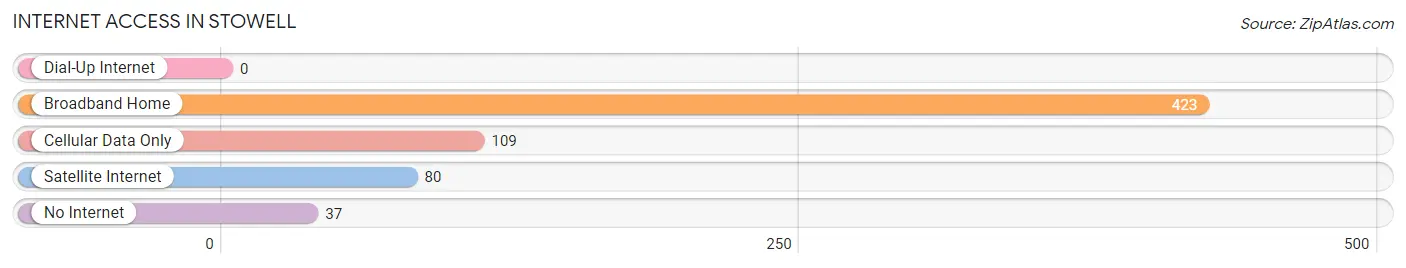
| Internet Type | # Households | % Households |
| Dial-Up Internet | 0 | 0.0% |
| Broadband Home | 423 | 68.0% |
| Cellular Data Only | 109 | 17.5% |
| Satellite Internet | 80 | 12.9% |
| No Internet | 37 | 5.9% |
| Total | 622 | 100.0% |
Stowell Summary
Stowell is a small town located in Chambers County, Texas, United States. It is situated on the western edge of the county, approximately 25 miles east of Beaumont and 25 miles west of Liberty. The population of Stowell was estimated to be 1,072 in 2019.
History
Stowell was founded in 1891 by the Stowell family, who had moved to the area from Louisiana. The town was named after the family, and the first post office was established in 1892. The town was incorporated in 1909, and the first mayor was J.W. Stowell.
In the early 1900s, Stowell was a thriving agricultural community, with cotton, corn, and sugar cane being the main crops. The town also had a sawmill, a gristmill, and a cotton gin.
In the 1920s, the town began to decline as the Great Depression hit the area. The population decreased, and many businesses closed. However, the town was able to survive and eventually began to grow again.
In the 1950s, Stowell began to experience a resurgence. The town was connected to the nearby cities of Beaumont and Liberty by a new highway, and the population began to increase. The town also began to attract new businesses, including a grocery store, a hardware store, and a gas station.
Geography
Stowell is located in Chambers County, Texas, approximately 25 miles east of Beaumont and 25 miles west of Liberty. The town is situated on the western edge of the county, and is bordered by the Trinity River to the north and the Neches River to the south.
The town has a total area of 1.2 square miles, all of which is land. The terrain is mostly flat, with some rolling hills in the area. The climate is humid subtropical, with hot summers and mild winters.
Economy
The economy of Stowell is largely based on agriculture. The town is home to several farms, which produce cotton, corn, and sugar cane. The town also has a few small businesses, including a grocery store, a hardware store, and a gas station.
The town is also home to a few manufacturing companies, including a furniture factory and a plastics factory. The town is also home to a few oil and gas companies, which are involved in the exploration and production of oil and gas in the area.
Demographics
As of the 2019 census, the population of Stowell was estimated to be 1,072. The racial makeup of the town was 79.2% White, 15.2% Hispanic or Latino, 2.7% African American, 0.9% Native American, 0.6% Asian, and 1.4% from other races.
The median household income in Stowell was $41,250, and the median family income was $45,000. The per capita income was $19,000. The town had a poverty rate of 17.2%.
Conclusion
Stowell is a small town located in Chambers County, Texas, United States. It was founded in 1891 by the Stowell family, and the population was estimated to be 1,072 in 2019. The town is situated on the western edge of the county, and is bordered by the Trinity River to the north and the Neches River to the south. The economy of Stowell is largely based on agriculture, and the town is also home to a few manufacturing companies and oil and gas companies. The racial makeup of the town was 79.2% White, 15.2% Hispanic or Latino, 2.7% African American, 0.9% Native American, 0.6% Asian, and 1.4% from other races. The median household income in Stowell was $41,250, and the median family income was $45,000. The per capita income was $19,000. The town had a poverty rate of 17.2%.
Common Questions
What is Per Capita Income in Stowell?
Per Capita income in Stowell is $19,247.
What is Inequality or Gini Index in Stowell?
Inequality or Gini Index in Stowell is 0.49.
What is the Total Population of Stowell?
Total Population of Stowell is 1,960.
What is the Total Male Population of Stowell?
Total Male Population of Stowell is 1,197.
What is the Total Female Population of Stowell?
Total Female Population of Stowell is 763.
What is the Ratio of Males per 100 Females in Stowell?
There are 156.88 Males per 100 Females in Stowell.
What is the Ratio of Females per 100 Males in Stowell?
There are 63.74 Females per 100 Males in Stowell.
What is the Median Population Age in Stowell?
Median Population Age in Stowell is 36.9 Years.
What is the Average Family Size in Stowell
Average Family Size in Stowell is 3.3 People.
What is the Average Household Size in Stowell
Average Household Size in Stowell is 3.1 People.
How Large is the Labor Force in Stowell?
There are 865 People in the Labor Forcein in Stowell.
What is the Percentage of People in the Labor Force in Stowell?
63.2% of People are in the Labor Force in Stowell.
What is the Unemployment Rate in Stowell?
Unemployment Rate in Stowell is 12.8%.