Stanton, TX Map & Demographics
Stanton Map
Stanton Overview
$32,520
PER CAPITA INCOME
$59,989
AVG FAMILY INCOME
$70,543
AVG HOUSEHOLD INCOME
40.5%
WAGE / INCOME GAP [ % ]
59.5¢/ $1
WAGE / INCOME GAP [ $ ]
0.40
INEQUALITY / GINI INDEX
2,667
TOTAL POPULATION
1,442
MALE POPULATION
1,225
FEMALE POPULATION
117.71
MALES / 100 FEMALES
84.95
FEMALES / 100 MALES
29.0
MEDIAN AGE
3.0
AVG FAMILY SIZE
2.7
AVG HOUSEHOLD SIZE
1,260
LABOR FORCE [ PEOPLE ]
69.0%
PERCENT IN LABOR FORCE
12.4%
UNEMPLOYMENT RATE
Stanton Zip Codes
Stanton Area Codes
Income in Stanton
Income Overview in Stanton
Per Capita Income in Stanton is $32,520, while median incomes of families and households are $59,989 and $70,543 respectively.
| Characteristic | Number | Measure |
| Per Capita Income | 2,667 | $32,520 |
| Median Family Income | 811 | $59,989 |
| Mean Family Income | 811 | $92,497 |
| Median Household Income | 974 | $70,543 |
| Mean Household Income | 974 | $88,274 |
| Income Deficit | 811 | $0 |
| Wage / Income Gap (%) | 2,667 | 40.45% |
| Wage / Income Gap ($) | 2,667 | 59.55¢ per $1 |
| Gini / Inequality Index | 2,667 | 0.40 |
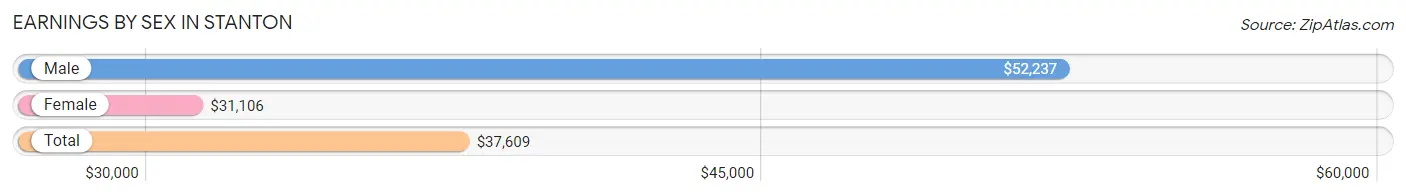
Earnings by Sex in Stanton
Average Earnings in Stanton are $37,609, $52,237 for men and $31,106 for women, a difference of 40.5%.
| Sex | Number | Average Earnings |
| Male | 740 (53.7%) | $52,237 |
| Female | 638 (46.3%) | $31,106 |
| Total | 1,378 (100.0%) | $37,609 |
Earnings by Sex by Income Bracket in Stanton
The most common earnings brackets in Stanton are $100,000+ for men (184 | 24.9%) and $2,499 or less for women (180 | 28.2%).
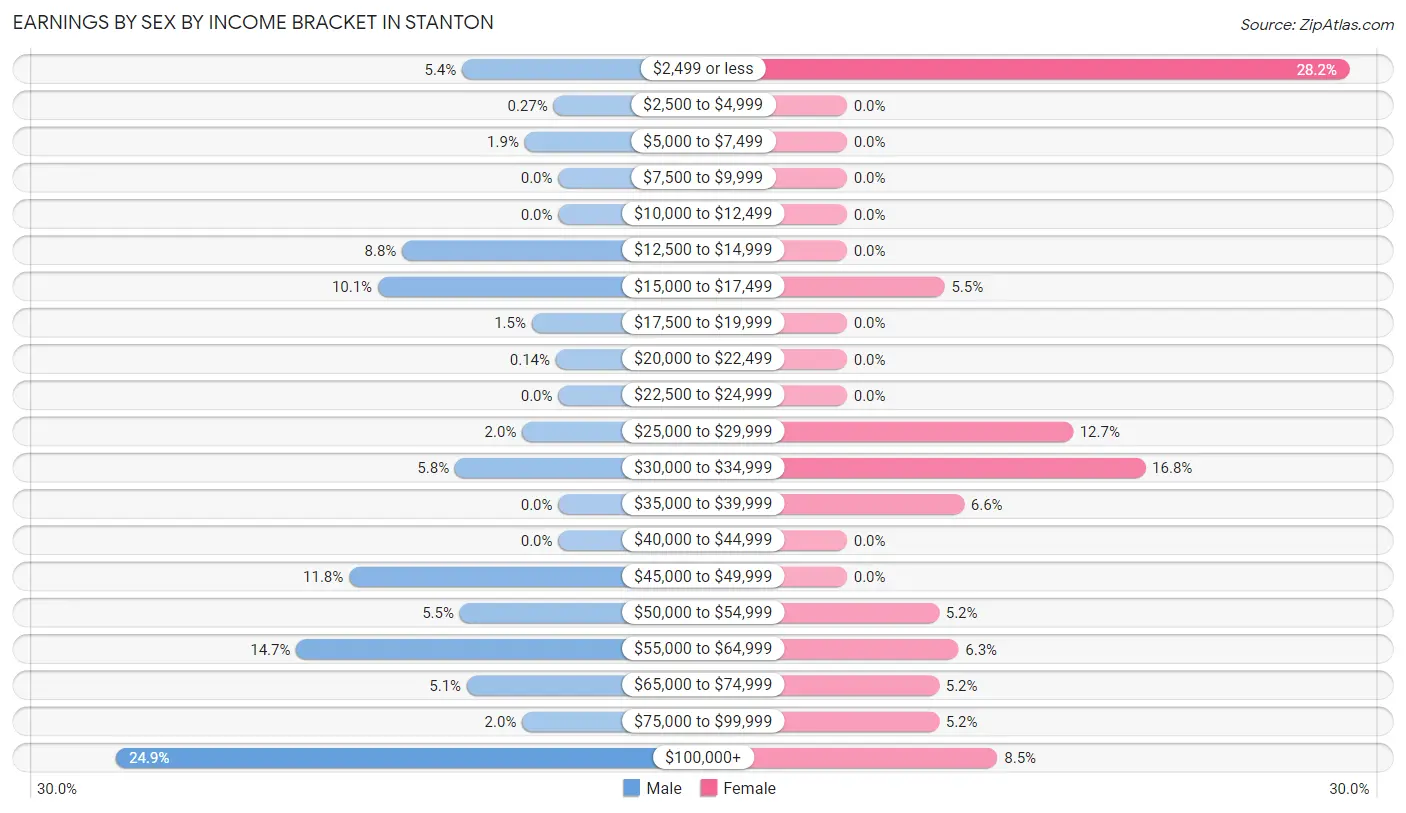
| Income | Male | Female |
| $2,499 or less | 40 (5.4%) | 180 (28.2%) |
| $2,500 to $4,999 | 2 (0.3%) | 0 (0.0%) |
| $5,000 to $7,499 | 14 (1.9%) | 0 (0.0%) |
| $7,500 to $9,999 | 0 (0.0%) | 0 (0.0%) |
| $10,000 to $12,499 | 0 (0.0%) | 0 (0.0%) |
| $12,500 to $14,999 | 65 (8.8%) | 0 (0.0%) |
| $15,000 to $17,499 | 75 (10.1%) | 35 (5.5%) |
| $17,500 to $19,999 | 11 (1.5%) | 0 (0.0%) |
| $20,000 to $22,499 | 1 (0.1%) | 0 (0.0%) |
| $22,500 to $24,999 | 0 (0.0%) | 0 (0.0%) |
| $25,000 to $29,999 | 15 (2.0%) | 81 (12.7%) |
| $30,000 to $34,999 | 43 (5.8%) | 107 (16.8%) |
| $35,000 to $39,999 | 0 (0.0%) | 42 (6.6%) |
| $40,000 to $44,999 | 0 (0.0%) | 0 (0.0%) |
| $45,000 to $49,999 | 87 (11.8%) | 0 (0.0%) |
| $50,000 to $54,999 | 41 (5.5%) | 33 (5.2%) |
| $55,000 to $64,999 | 109 (14.7%) | 40 (6.3%) |
| $65,000 to $74,999 | 38 (5.1%) | 33 (5.2%) |
| $75,000 to $99,999 | 15 (2.0%) | 33 (5.2%) |
| $100,000+ | 184 (24.9%) | 54 (8.5%) |
| Total | 740 (100.0%) | 638 (100.0%) |
Earnings by Sex by Educational Attainment in Stanton
Average earnings in Stanton are $53,580 for men and $35,395 for women, a difference of 33.9%. Men with an educational attainment of less than high school enjoy the highest average annual earnings of $53,352, while those with less than high school education earn the least with $53,352. Women with an educational attainment of high school diploma earn the most with the average annual earnings of $33,886, while those with high school diploma education have the smallest earnings of $33,886.
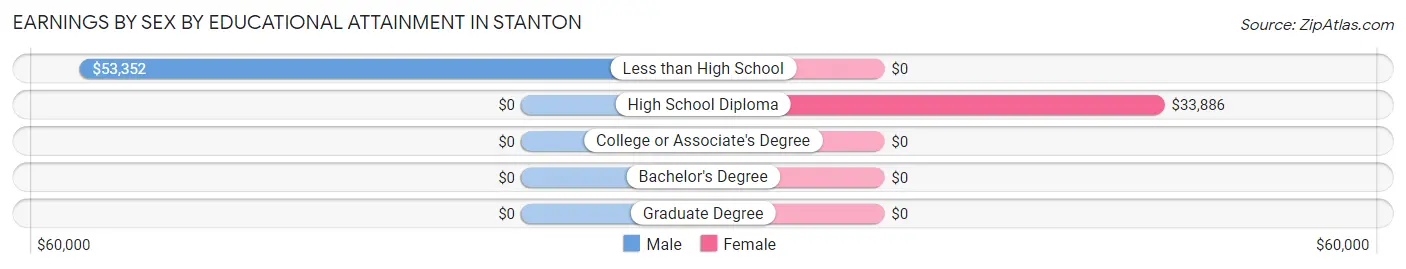
| Educational Attainment | Male Income | Female Income |
| Less than High School | $53,352 | $0 |
| High School Diploma | - | - |
| College or Associate's Degree | - | - |
| Bachelor's Degree | - | - |
| Graduate Degree | - | - |
| Total | $53,580 | $35,395 |
Family Income in Stanton
Family Income Brackets in Stanton
According to the Stanton family income data, there are 196 families falling into the $50,000 to $74,999 income range, which is the most common income bracket and makes up 24.2% of all families.
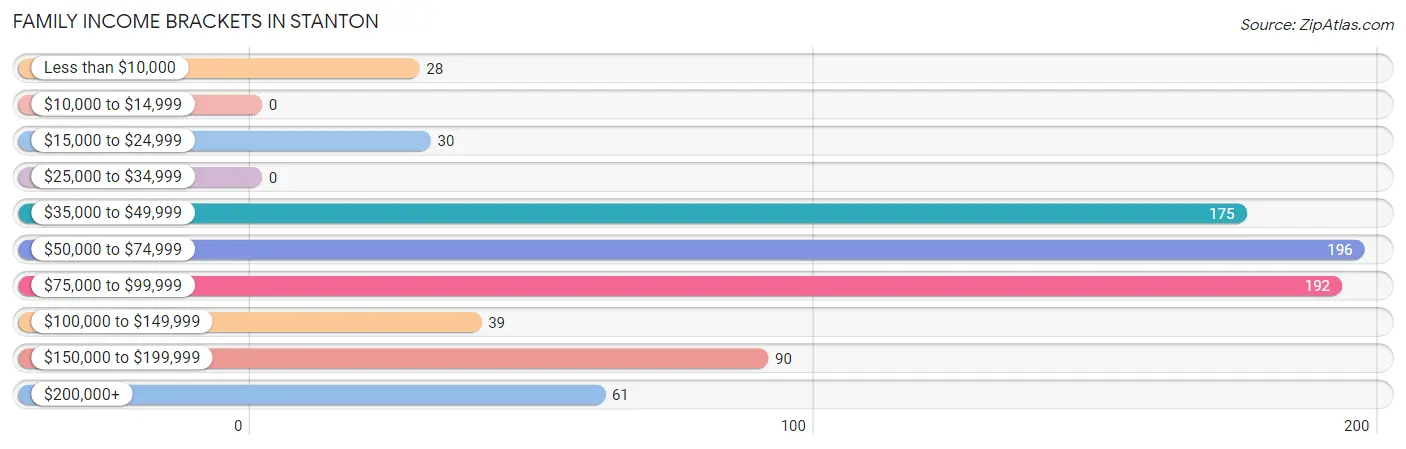
| Income Bracket | # Families | % Families |
| Less than $10,000 | 28 | 3.5% |
| $10,000 to $14,999 | 0 | 0.0% |
| $15,000 to $24,999 | 30 | 3.7% |
| $25,000 to $34,999 | 0 | 0.0% |
| $35,000 to $49,999 | 175 | 21.6% |
| $50,000 to $74,999 | 196 | 24.2% |
| $75,000 to $99,999 | 192 | 23.7% |
| $100,000 to $149,999 | 39 | 4.8% |
| $150,000 to $199,999 | 90 | 11.1% |
| $200,000+ | 61 | 7.5% |
Family Income by Famaliy Size in Stanton
2-person families (321 | 39.6%) account for the highest median family income in Stanton with $76,803 per family, while 2-person families (321 | 39.6%) have the highest median income of $38,402 per family member.
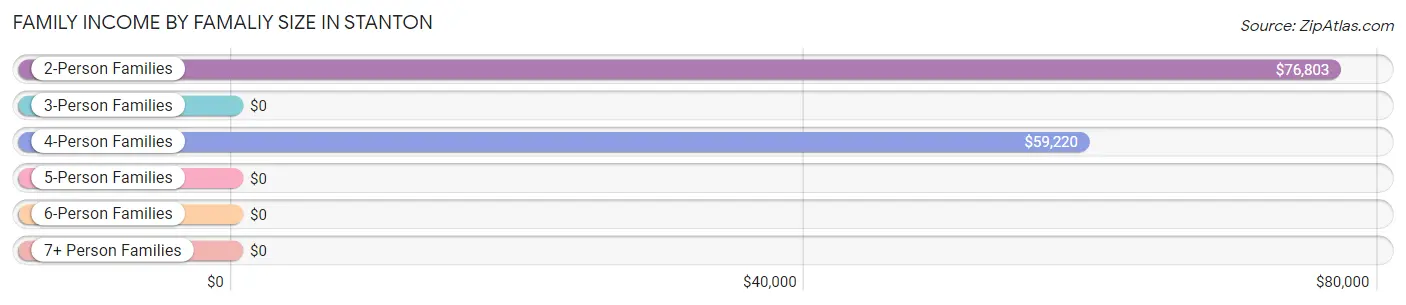
| Income Bracket | # Families | Median Income |
| 2-Person Families | 321 (39.6%) | $76,803 |
| 3-Person Families | 147 (18.1%) | $0 |
| 4-Person Families | 236 (29.1%) | $59,220 |
| 5-Person Families | 43 (5.3%) | $0 |
| 6-Person Families | 0 (0.0%) | $0 |
| 7+ Person Families | 64 (7.9%) | $0 |
| Total | 811 (100.0%) | $59,989 |
Family Income by Number of Earners in Stanton
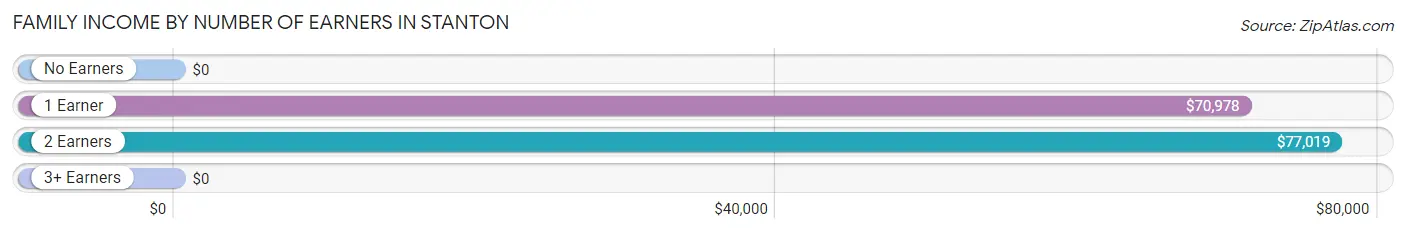
| Number of Earners | # Families | Median Income |
| No Earners | 82 (10.1%) | $0 |
| 1 Earner | 174 (21.4%) | $70,978 |
| 2 Earners | 448 (55.2%) | $77,019 |
| 3+ Earners | 107 (13.2%) | $0 |
| Total | 811 (100.0%) | $59,989 |
Household Income in Stanton
Household Income Brackets in Stanton
With 239 households falling in the category, the $50,000 to $74,999 income range is the most frequent in Stanton, accounting for 24.5% of all households.
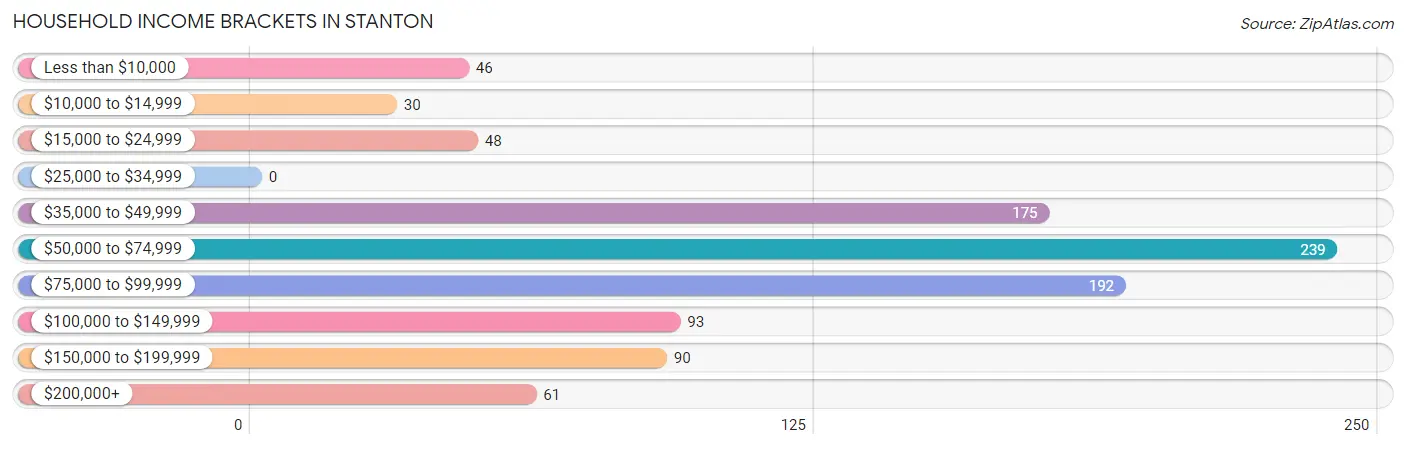
| Income Bracket | # Households | % Households |
| Less than $10,000 | 46 | 4.7% |
| $10,000 to $14,999 | 30 | 3.1% |
| $15,000 to $24,999 | 48 | 4.9% |
| $25,000 to $34,999 | 0 | 0.0% |
| $35,000 to $49,999 | 175 | 18.0% |
| $50,000 to $74,999 | 239 | 24.5% |
| $75,000 to $99,999 | 192 | 19.7% |
| $100,000 to $149,999 | 93 | 9.5% |
| $150,000 to $199,999 | 90 | 9.2% |
| $200,000+ | 61 | 6.3% |
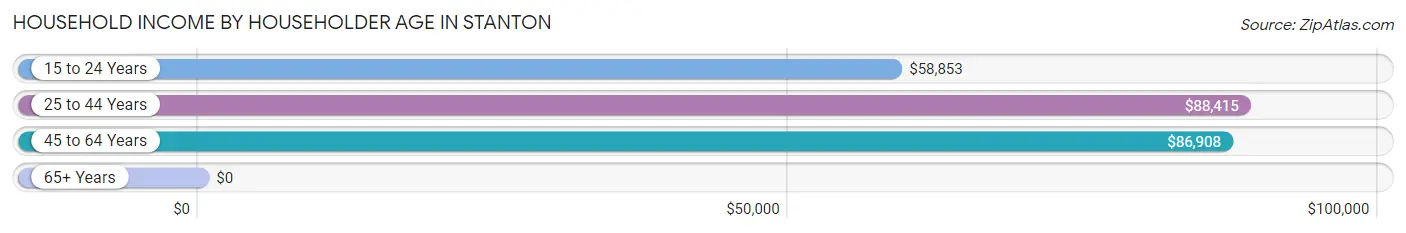
Household Income by Householder Age in Stanton
The median household income in Stanton is $70,543, with the highest median household income of $88,415 found in the 25 to 44 years age bracket for the primary householder. A total of 338 households (34.7%) fall into this category. Meanwhile, the 65+ years age bracket for the primary householder has the lowest median household income of $0, with 139 households (14.3%) in this group.
| Income Bracket | # Households | Median Income |
| 15 to 24 Years | 204 (20.9%) | $58,853 |
| 25 to 44 Years | 338 (34.7%) | $88,415 |
| 45 to 64 Years | 293 (30.1%) | $86,908 |
| 65+ Years | 139 (14.3%) | $0 |
| Total | 974 (100.0%) | $70,543 |
Poverty in Stanton
Income Below Poverty by Sex and Age in Stanton
With 14.3% poverty level for males and 25.1% for females among the residents of Stanton, 16 and 17 year old males and under 5 year old females are the most vulnerable to poverty, with 23 males (100.0%) and 68 females (60.2%) in their respective age groups living below the poverty level.
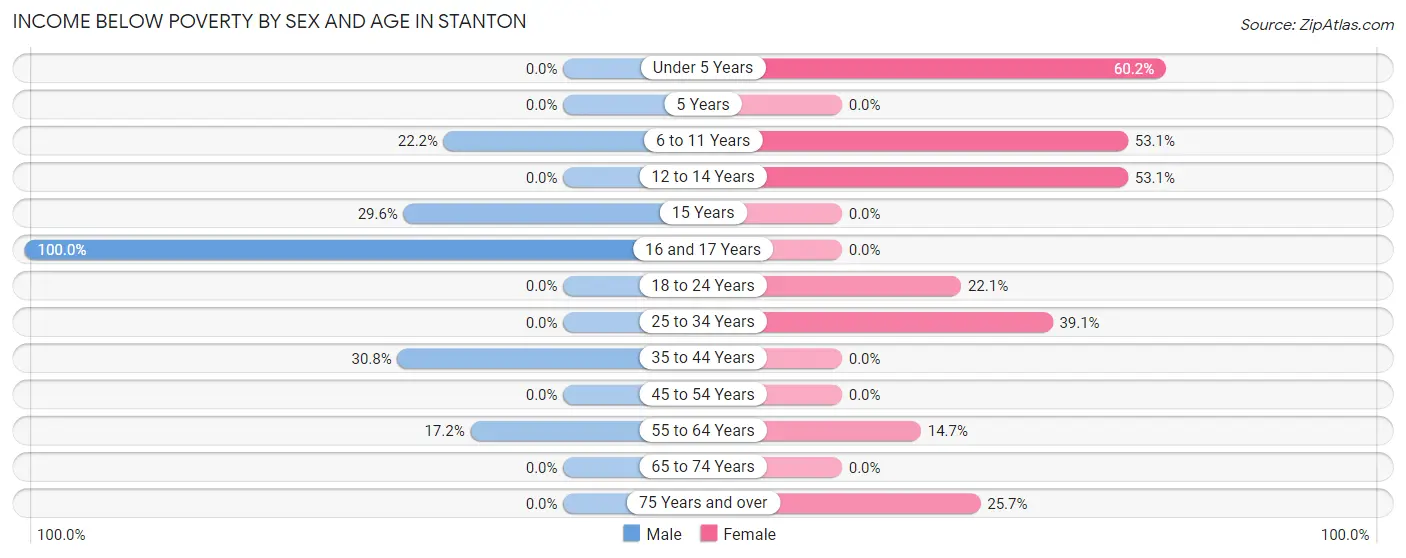
| Age Bracket | Male | Female |
| Under 5 Years | 0 (0.0%) | 68 (60.2%) |
| 5 Years | 0 (0.0%) | 0 (0.0%) |
| 6 to 11 Years | 61 (22.2%) | 43 (53.1%) |
| 12 to 14 Years | 0 (0.0%) | 43 (53.1%) |
| 15 Years | 24 (29.6%) | 0 (0.0%) |
| 16 and 17 Years | 23 (100.0%) | 0 (0.0%) |
| 18 to 24 Years | 0 (0.0%) | 48 (22.1%) |
| 25 to 34 Years | 0 (0.0%) | 52 (39.1%) |
| 35 to 44 Years | 64 (30.8%) | 0 (0.0%) |
| 45 to 54 Years | 0 (0.0%) | 0 (0.0%) |
| 55 to 64 Years | 30 (17.2%) | 28 (14.7%) |
| 65 to 74 Years | 0 (0.0%) | 0 (0.0%) |
| 75 Years and over | 0 (0.0%) | 18 (25.7%) |
| Total | 202 (14.3%) | 300 (25.1%) |
Income Above Poverty by Sex and Age in Stanton
According to the poverty statistics in Stanton, males aged under 5 years and females aged 35 to 44 years are the age groups that are most secure financially, with 100.0% of males and 100.0% of females in these age groups living above the poverty line.
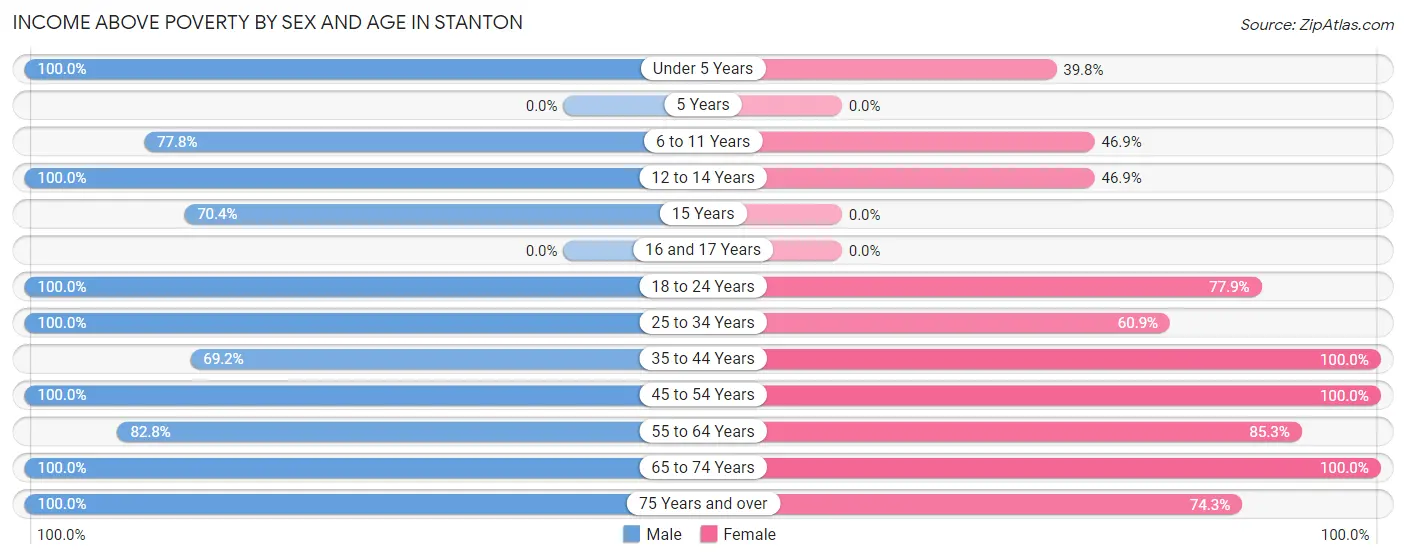
| Age Bracket | Male | Female |
| Under 5 Years | 122 (100.0%) | 45 (39.8%) |
| 5 Years | 0 (0.0%) | 0 (0.0%) |
| 6 to 11 Years | 214 (77.8%) | 38 (46.9%) |
| 12 to 14 Years | 88 (100.0%) | 38 (46.9%) |
| 15 Years | 57 (70.4%) | 0 (0.0%) |
| 16 and 17 Years | 0 (0.0%) | 0 (0.0%) |
| 18 to 24 Years | 241 (100.0%) | 169 (77.9%) |
| 25 to 34 Years | 57 (100.0%) | 81 (60.9%) |
| 35 to 44 Years | 144 (69.2%) | 159 (100.0%) |
| 45 to 54 Years | 43 (100.0%) | 122 (100.0%) |
| 55 to 64 Years | 144 (82.8%) | 163 (85.3%) |
| 65 to 74 Years | 39 (100.0%) | 30 (100.0%) |
| 75 Years and over | 61 (100.0%) | 52 (74.3%) |
| Total | 1,210 (85.7%) | 897 (74.9%) |
Income Below Poverty Among Married-Couple Families in Stanton
The poverty statistics for married-couple families in Stanton show that 9.6% or 64 of the total 669 families live below the poverty line. Families with 5 or more children have the highest poverty rate of 100.0%, comprising of 64 families. On the other hand, families with no children have the lowest poverty rate of 0.0%, which includes 0 families.
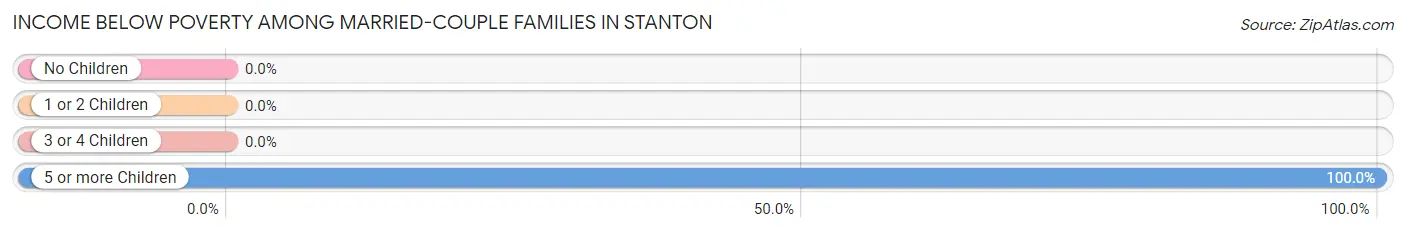
| Children | Above Poverty | Below Poverty |
| No Children | 275 (100.0%) | 0 (0.0%) |
| 1 or 2 Children | 287 (100.0%) | 0 (0.0%) |
| 3 or 4 Children | 43 (100.0%) | 0 (0.0%) |
| 5 or more Children | 0 (0.0%) | 64 (100.0%) |
| Total | 605 (90.4%) | 64 (9.6%) |
Income Below Poverty Among Single-Parent Households in Stanton
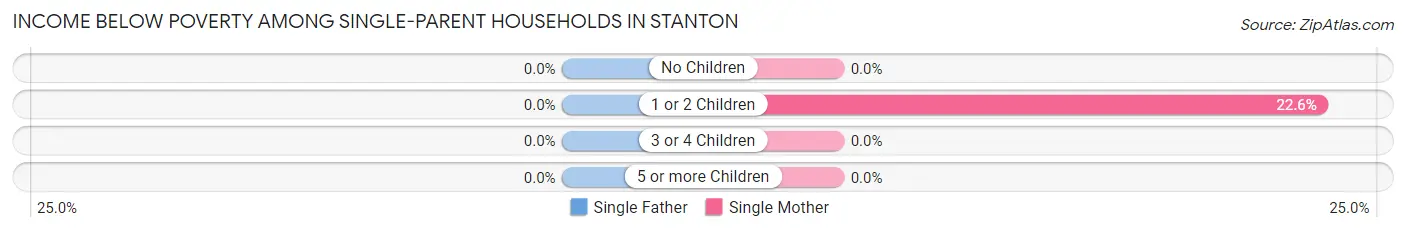
| Children | Single Father | Single Mother |
| No Children | 0 (0.0%) | 0 (0.0%) |
| 1 or 2 Children | 0 (0.0%) | 28 (22.6%) |
| 3 or 4 Children | 0 (0.0%) | 0 (0.0%) |
| 5 or more Children | 0 (0.0%) | 0 (0.0%) |
| Total | 0 (0.0%) | 28 (19.7%) |
Income Below Poverty Among Married-Couple vs Single-Parent Households in Stanton
The poverty data for Stanton shows that 64 of the married-couple family households (9.6%) and 28 of the single-parent households (19.7%) are living below the poverty level. Within the married-couple family households, those with 5 or more children have the highest poverty rate, with 64 households (100.0%) falling below the poverty line. Among the single-parent households, those with 1 or 2 children have the highest poverty rate, with 28 household (22.6%) living below poverty.
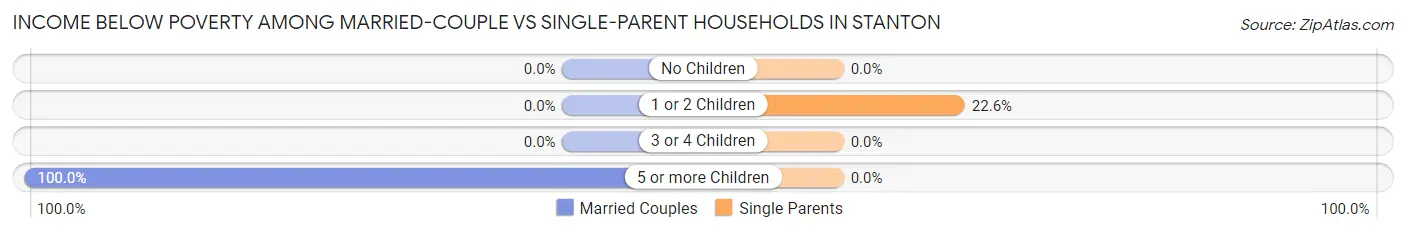
| Children | Married-Couple Families | Single-Parent Households |
| No Children | 0 (0.0%) | 0 (0.0%) |
| 1 or 2 Children | 0 (0.0%) | 28 (22.6%) |
| 3 or 4 Children | 0 (0.0%) | 0 (0.0%) |
| 5 or more Children | 64 (100.0%) | 0 (0.0%) |
| Total | 64 (9.6%) | 28 (19.7%) |
Race in Stanton
The most populous races in Stanton are Hispanic or Latino (1,971 | 73.9%), White / Caucasian (1,949 | 73.1%), and Some other Race (411 | 15.4%).
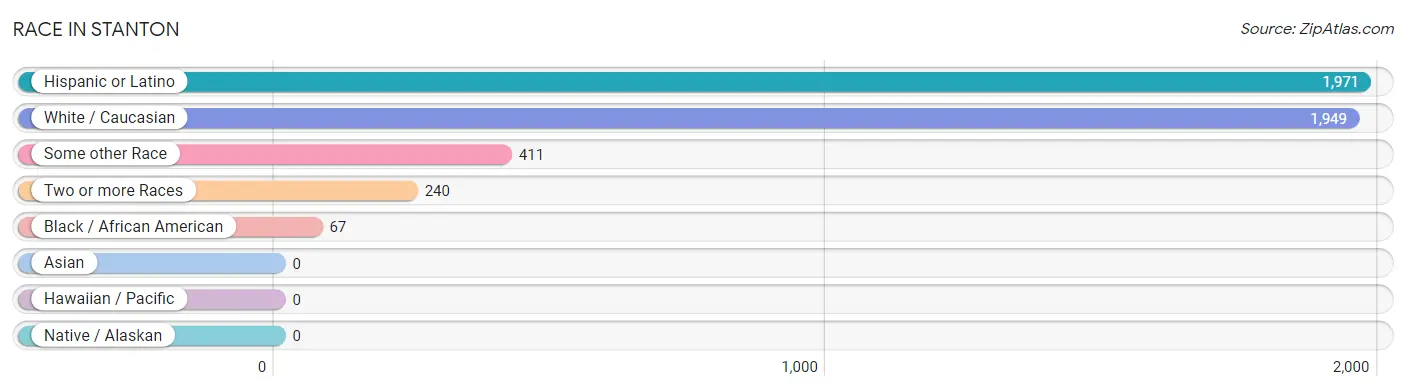
| Race | # Population | % Population |
| Asian | 0 | 0.0% |
| Black / African American | 67 | 2.5% |
| Hawaiian / Pacific | 0 | 0.0% |
| Hispanic or Latino | 1,971 | 73.9% |
| Native / Alaskan | 0 | 0.0% |
| White / Caucasian | 1,949 | 73.1% |
| Two or more Races | 240 | 9.0% |
| Some other Race | 411 | 15.4% |
| Total | 2,667 | 100.0% |
Ancestry in Stanton
The most populous ancestries reported in Stanton are Mexican (1,971 | 73.9%), American (158 | 5.9%), Irish (92 | 3.5%), German (62 | 2.3%), and Scottish (39 | 1.5%), together accounting for 87.0% of all Stanton residents.
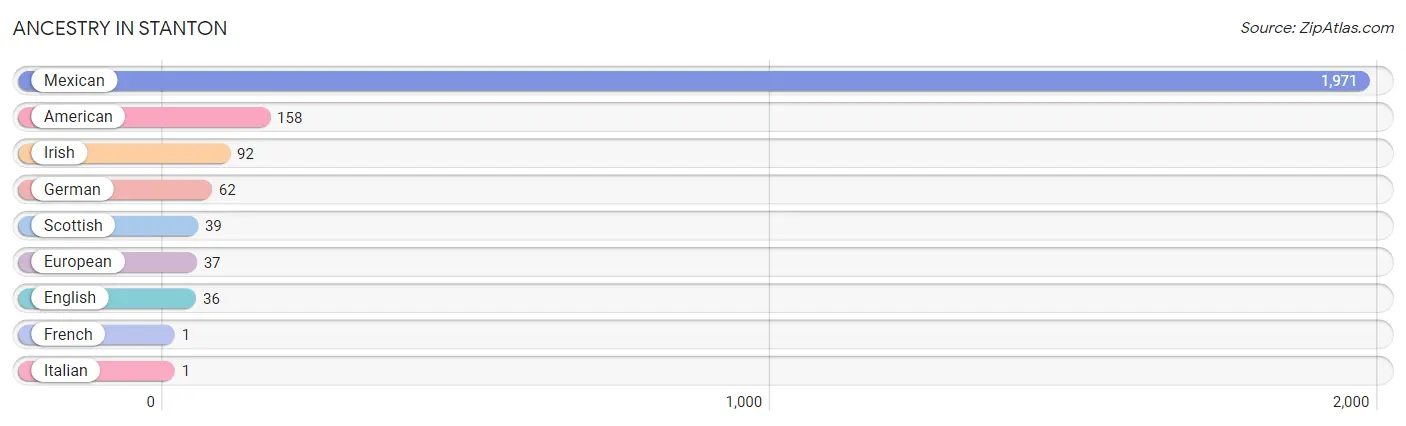
| Ancestry | # Population | % Population |
| American | 158 | 5.9% |
| English | 36 | 1.3% |
| European | 37 | 1.4% |
| French | 1 | 0.0% |
| German | 62 | 2.3% |
| Irish | 92 | 3.5% |
| Italian | 1 | 0.0% |
| Mexican | 1,971 | 73.9% |
| Scottish | 39 | 1.5% | View All 9 Rows |
Immigrants in Stanton
The most numerous immigrant groups reported in Stanton came from Central America (208 | 7.8%), Latin America (208 | 7.8%), and Mexico (208 | 7.8%), together accounting for 23.4% of all Stanton residents.
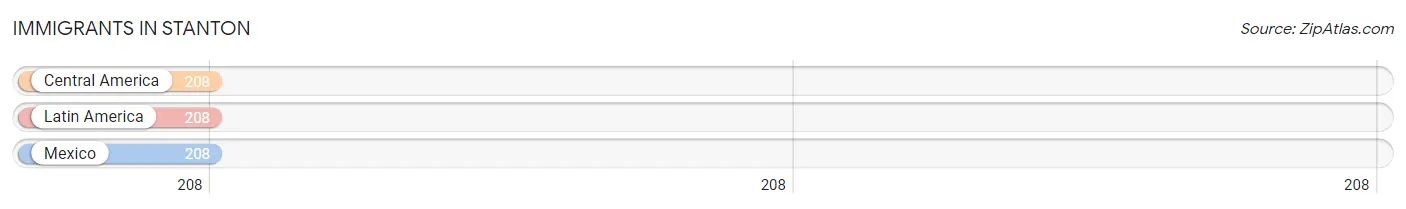
| Immigration Origin | # Population | % Population |
| Central America | 208 | 7.8% |
| Latin America | 208 | 7.8% |
| Mexico | 208 | 7.8% | View All 3 Rows |
Sex and Age in Stanton
Sex and Age in Stanton
The most populous age groups in Stanton are 20 to 24 Years (226 | 15.7%) for men and 20 to 24 Years (217 | 17.7%) for women.
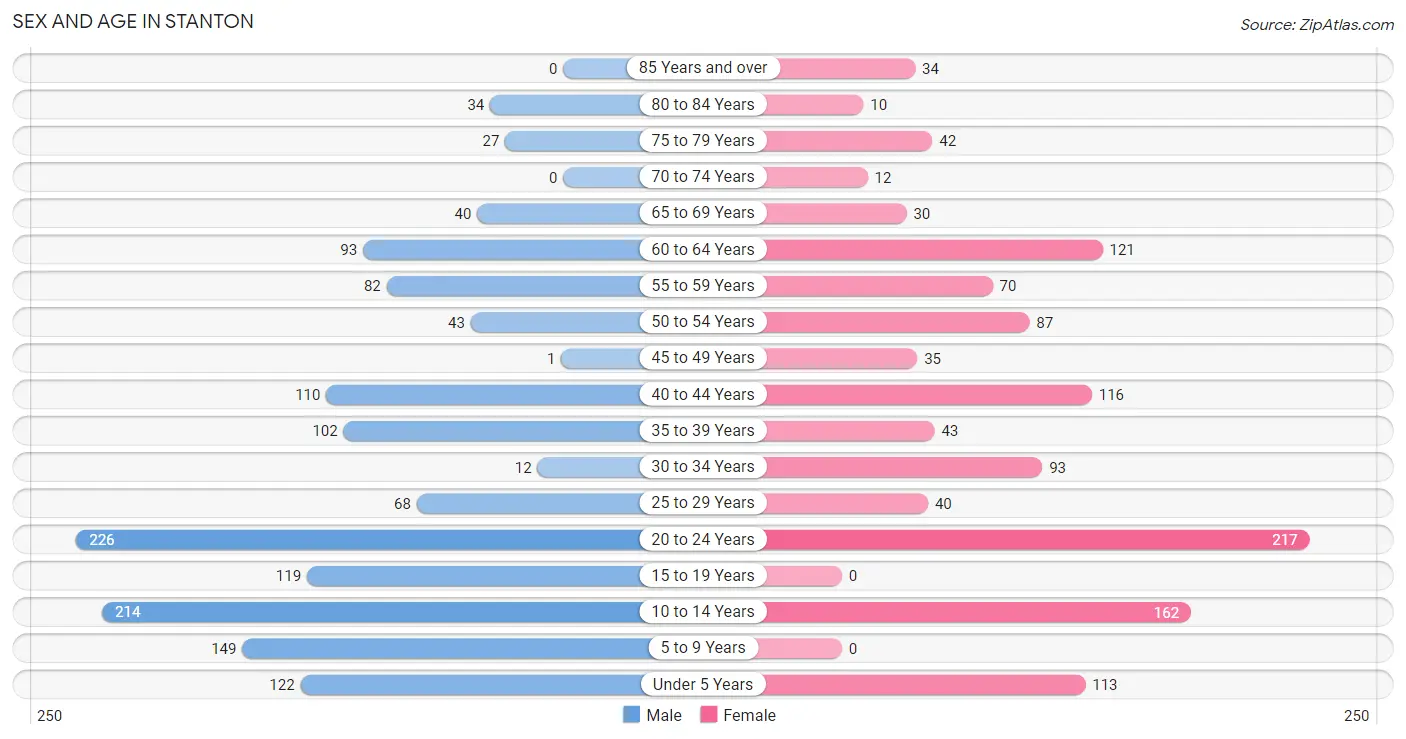
| Age Bracket | Male | Female |
| Under 5 Years | 122 (8.5%) | 113 (9.2%) |
| 5 to 9 Years | 149 (10.3%) | 0 (0.0%) |
| 10 to 14 Years | 214 (14.8%) | 162 (13.2%) |
| 15 to 19 Years | 119 (8.3%) | 0 (0.0%) |
| 20 to 24 Years | 226 (15.7%) | 217 (17.7%) |
| 25 to 29 Years | 68 (4.7%) | 40 (3.3%) |
| 30 to 34 Years | 12 (0.8%) | 93 (7.6%) |
| 35 to 39 Years | 102 (7.1%) | 43 (3.5%) |
| 40 to 44 Years | 110 (7.6%) | 116 (9.5%) |
| 45 to 49 Years | 1 (0.1%) | 35 (2.9%) |
| 50 to 54 Years | 43 (3.0%) | 87 (7.1%) |
| 55 to 59 Years | 82 (5.7%) | 70 (5.7%) |
| 60 to 64 Years | 93 (6.5%) | 121 (9.9%) |
| 65 to 69 Years | 40 (2.8%) | 30 (2.5%) |
| 70 to 74 Years | 0 (0.0%) | 12 (1.0%) |
| 75 to 79 Years | 27 (1.9%) | 42 (3.4%) |
| 80 to 84 Years | 34 (2.4%) | 10 (0.8%) |
| 85 Years and over | 0 (0.0%) | 34 (2.8%) |
| Total | 1,442 (100.0%) | 1,225 (100.0%) |
Families and Households in Stanton
Median Family Size in Stanton
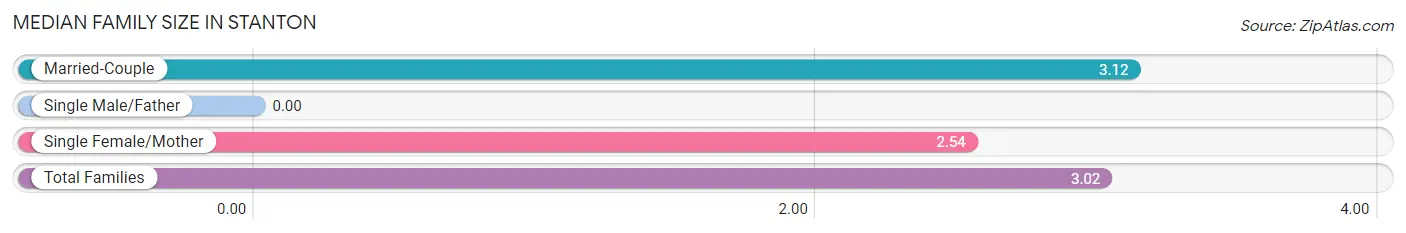
| Family Type | # Families | Family Size |
| Married-Couple | 669 (82.5%) | 3.12 |
| Single Male/Father | 0 (0.0%) | - |
| Single Female/Mother | 142 (17.5%) | 2.54 |
| Total Families | 811 (100.0%) | 3.02 |
Median Household Size in Stanton
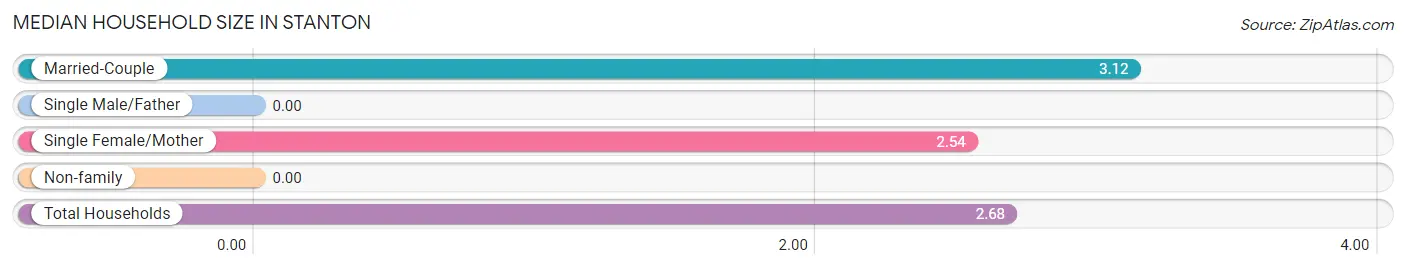
| Household Type | # Households | Household Size |
| Married-Couple | 669 (68.7%) | 3.12 |
| Single Male/Father | 0 (0.0%) | - |
| Single Female/Mother | 142 (14.6%) | 2.54 |
| Non-family | 163 (16.7%) | - |
| Total Households | 974 (100.0%) | 2.68 |
Household Size by Marriage Status in Stanton
Out of a total of 974 households in Stanton, 811 (83.3%) are family households, while 163 (16.7%) are nonfamily households. The most numerous type of family households are 2-person households, comprising 321, and the most common type of nonfamily households are 1-person households, comprising 163.
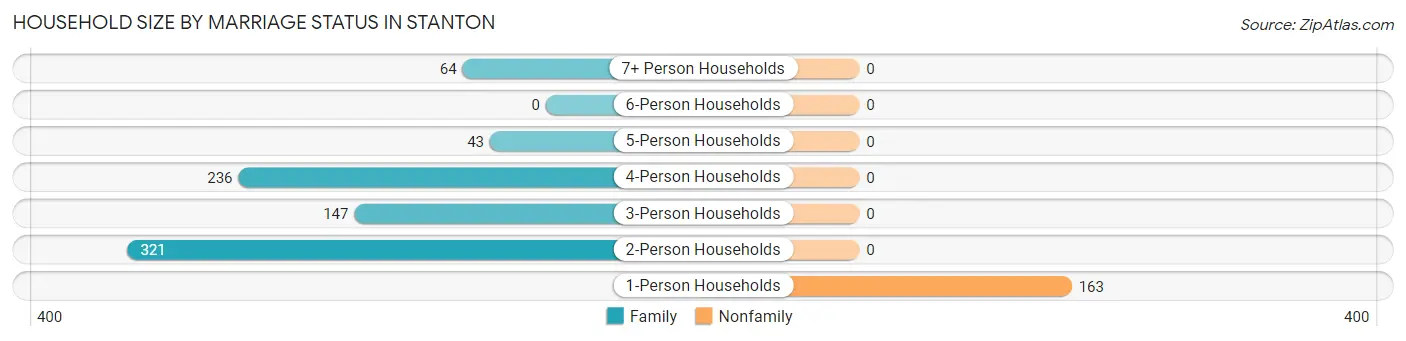
| Household Size | Family Households | Nonfamily Households |
| 1-Person Households | - | 163 (16.7%) |
| 2-Person Households | 321 (33.0%) | 0 (0.0%) |
| 3-Person Households | 147 (15.1%) | 0 (0.0%) |
| 4-Person Households | 236 (24.2%) | 0 (0.0%) |
| 5-Person Households | 43 (4.4%) | 0 (0.0%) |
| 6-Person Households | 0 (0.0%) | 0 (0.0%) |
| 7+ Person Households | 64 (6.6%) | 0 (0.0%) |
| Total | 811 (83.3%) | 163 (16.7%) |
Female Fertility in Stanton
Fertility by Age in Stanton
Average fertility rate in Stanton is 165.0 births per 1,000 women. Women in the age bracket of 20 to 34 years have the highest fertility rate with 271.0 births per 1,000 women. Women in the age bracket of 20 to 34 years acount for 100.0% of all women with births.
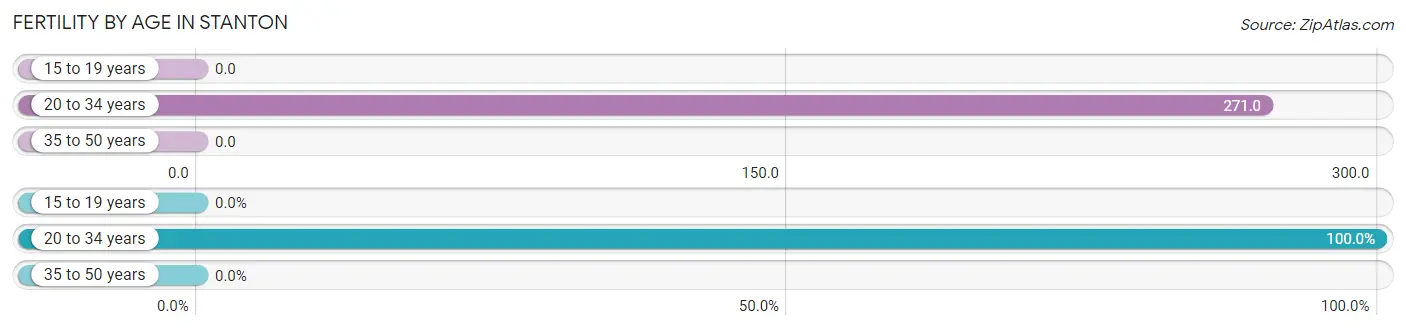
| Age Bracket | Women with Births | Births / 1,000 Women |
| 15 to 19 years | 0 (0.0%) | 0.0 |
| 20 to 34 years | 95 (100.0%) | 271.0 |
| 35 to 50 years | 0 (0.0%) | 0.0 |
| Total | 95 (100.0%) | 165.0 |
Fertility by Age by Marriage Status in Stanton
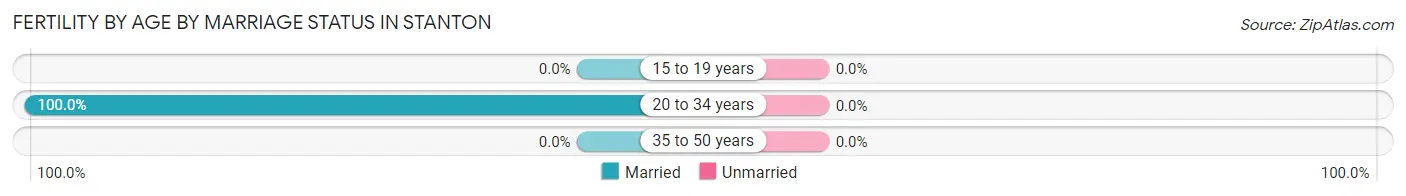
| Age Bracket | Married | Unmarried |
| 15 to 19 years | 0 (0.0%) | 0 (0.0%) |
| 20 to 34 years | 95 (100.0%) | 0 (0.0%) |
| 35 to 50 years | 0 (0.0%) | 0 (0.0%) |
| Total | 95 (100.0%) | 0 (0.0%) |
Fertility by Education in Stanton
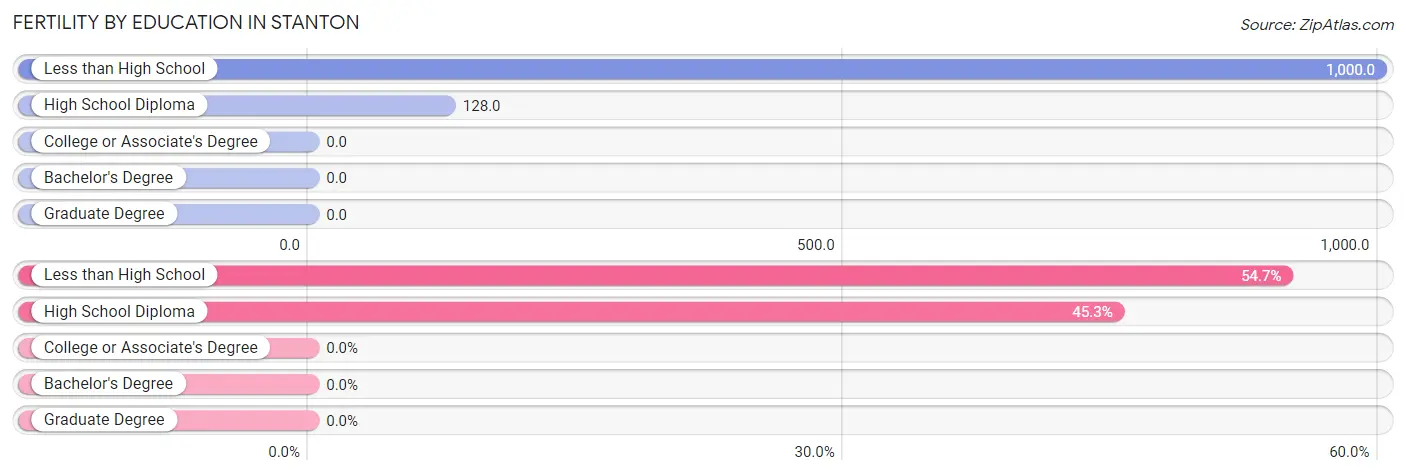
| Educational Attainment | Women with Births | Births / 1,000 Women |
| Less than High School | 52 (54.7%) | 1,000.0 |
| High School Diploma | 43 (45.3%) | 128.0 |
| College or Associate's Degree | 0 (0.0%) | 0.0 |
| Bachelor's Degree | 0 (0.0%) | 0.0 |
| Graduate Degree | 0 (0.0%) | 0.0 |
| Total | 95 (100.0%) | 165.0 |
Fertility by Education by Marriage Status in Stanton
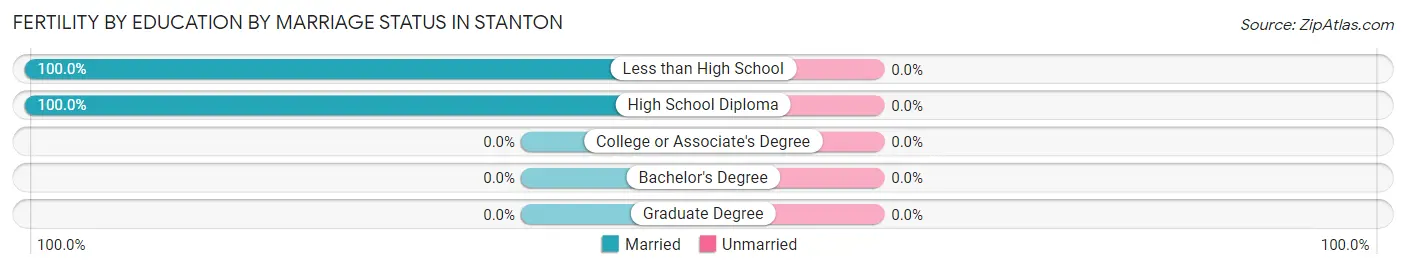
| Educational Attainment | Married | Unmarried |
| Less than High School | 52 (100.0%) | 0 (0.0%) |
| High School Diploma | 43 (100.0%) | 0 (0.0%) |
| College or Associate's Degree | 0 (0.0%) | 0 (0.0%) |
| Bachelor's Degree | 0 (0.0%) | 0 (0.0%) |
| Graduate Degree | 0 (0.0%) | 0 (0.0%) |
| Total | 95 (100.0%) | 0 (0.0%) |
Employment Characteristics in Stanton
Employment by Class of Employer in Stanton
Among the 1,031 employed individuals in Stanton, private company employees (711 | 69.0%), local government employees (184 | 17.8%), and state government employees (77 | 7.5%) make up the most common classes of employment.
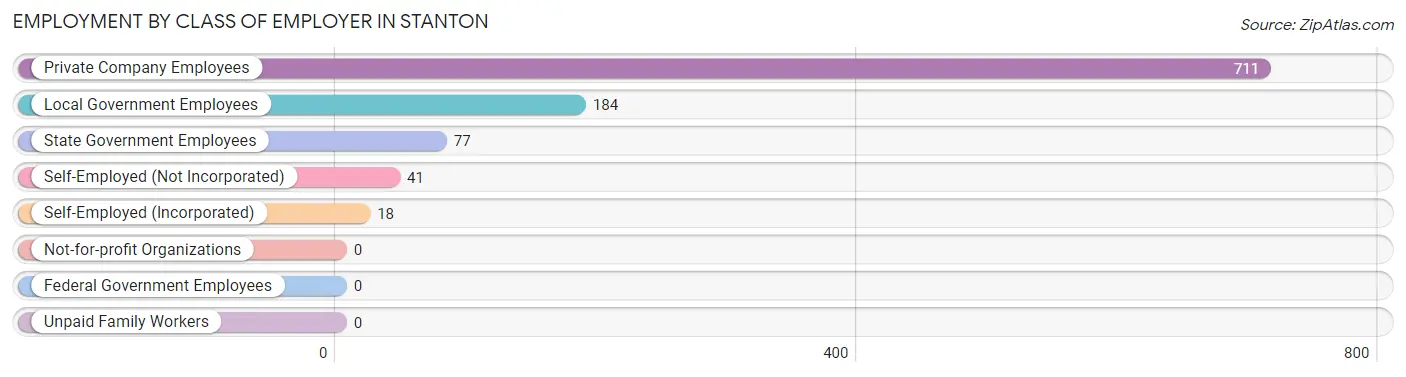
| Employer Class | # Employees | % Employees |
| Private Company Employees | 711 | 69.0% |
| Self-Employed (Incorporated) | 18 | 1.8% |
| Self-Employed (Not Incorporated) | 41 | 4.0% |
| Not-for-profit Organizations | 0 | 0.0% |
| Local Government Employees | 184 | 17.8% |
| State Government Employees | 77 | 7.5% |
| Federal Government Employees | 0 | 0.0% |
| Unpaid Family Workers | 0 | 0.0% |
| Total | 1,031 | 100.0% |
Employment Status by Age in Stanton
According to the labor force statistics for Stanton, out of the total population over 16 years of age (1,826), 69.0% or 1,260 individuals are in the labor force, with 12.4% or 156 of them unemployed. The age group with the highest labor force participation rate is 25 to 29 years, with 89.8% or 97 individuals in the labor force. Within the labor force, the 30 to 34 years age range has the highest percentage of unemployed individuals, with 44.1% or 41 of them being unemployed.
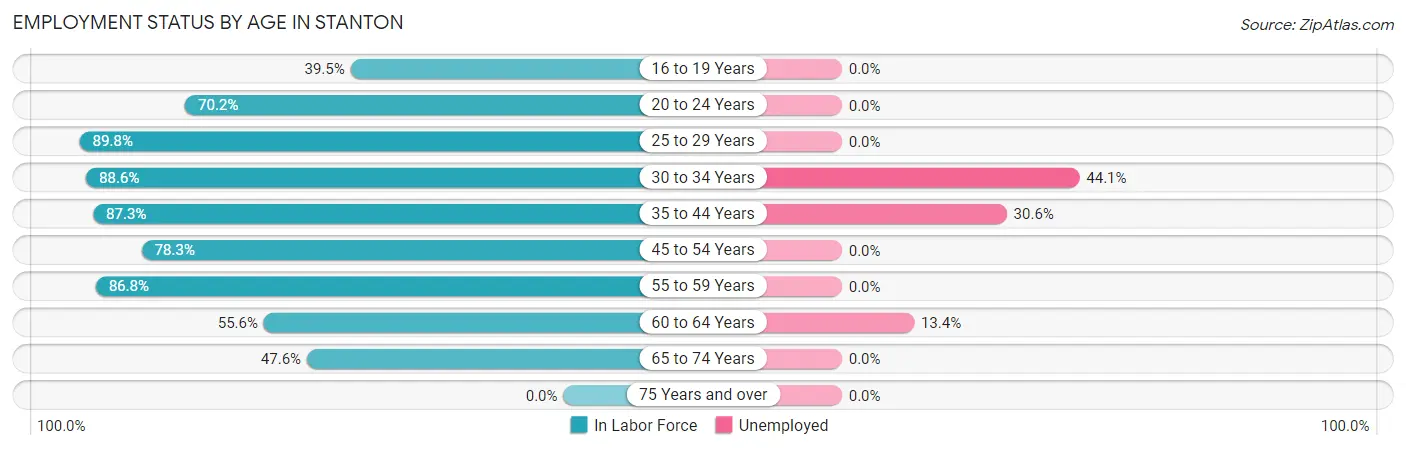
| Age Bracket | In Labor Force | Unemployed |
| 16 to 19 Years | 15 (39.5%) | 0 (0.0%) |
| 20 to 24 Years | 311 (70.2%) | 0 (0.0%) |
| 25 to 29 Years | 97 (89.8%) | 0 (0.0%) |
| 30 to 34 Years | 93 (88.6%) | 41 (44.1%) |
| 35 to 44 Years | 324 (87.3%) | 99 (30.6%) |
| 45 to 54 Years | 130 (78.3%) | 0 (0.0%) |
| 55 to 59 Years | 132 (86.8%) | 0 (0.0%) |
| 60 to 64 Years | 119 (55.6%) | 16 (13.4%) |
| 65 to 74 Years | 39 (47.6%) | 0 (0.0%) |
| 75 Years and over | 0 (0.0%) | 0 (0.0%) |
| Total | 1,260 (69.0%) | 156 (12.4%) |
Employment Status by Educational Attainment in Stanton
According to labor force statistics for Stanton, 80.2% of individuals (895) out of the total population between 25 and 64 years of age (1,116) are in the labor force, with 17.4% or 156 of them being unemployed. The group with the highest labor force participation rate are those with the educational attainment of bachelor's degree or higher, with 100.0% or 150 individuals in the labor force. Within the labor force, individuals with college / associate degree education have the highest percentage of unemployment, with 36.7% or 105 of them being unemployed.
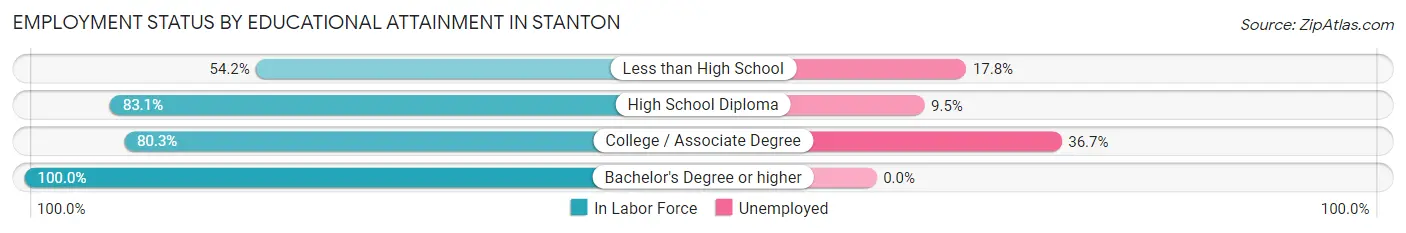
| Educational Attainment | In Labor Force | Unemployed |
| Less than High School | 90 (54.2%) | 30 (17.8%) |
| High School Diploma | 369 (83.1%) | 42 (9.5%) |
| College / Associate Degree | 286 (80.3%) | 131 (36.7%) |
| Bachelor's Degree or higher | 150 (100.0%) | 0 (0.0%) |
| Total | 895 (80.2%) | 194 (17.4%) |
Employment Occupations by Sex in Stanton
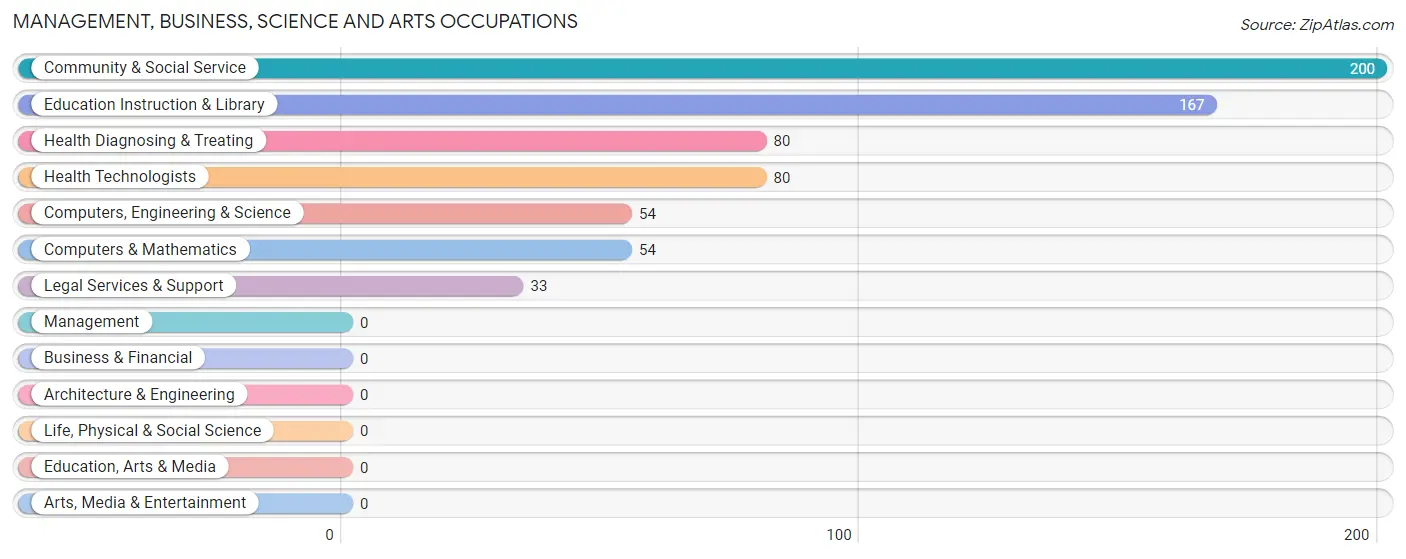
Management, Business, Science and Arts Occupations
The most common Management, Business, Science and Arts occupations in Stanton are Community & Social Service (200 | 18.1%), Education Instruction & Library (167 | 15.1%), Health Diagnosing & Treating (80 | 7.2%), Health Technologists (80 | 7.2%), and Computers, Engineering & Science (54 | 4.9%).
Management, Business, Science and Arts Occupations by Sex
Within the Management, Business, Science and Arts occupations in Stanton, the most male-oriented occupations are Health Diagnosing & Treating (71.3%), and Health Technologists (71.3%), while the most female-oriented occupations are Computers, Engineering & Science (100.0%), Computers & Mathematics (100.0%), and Community & Social Service (100.0%).
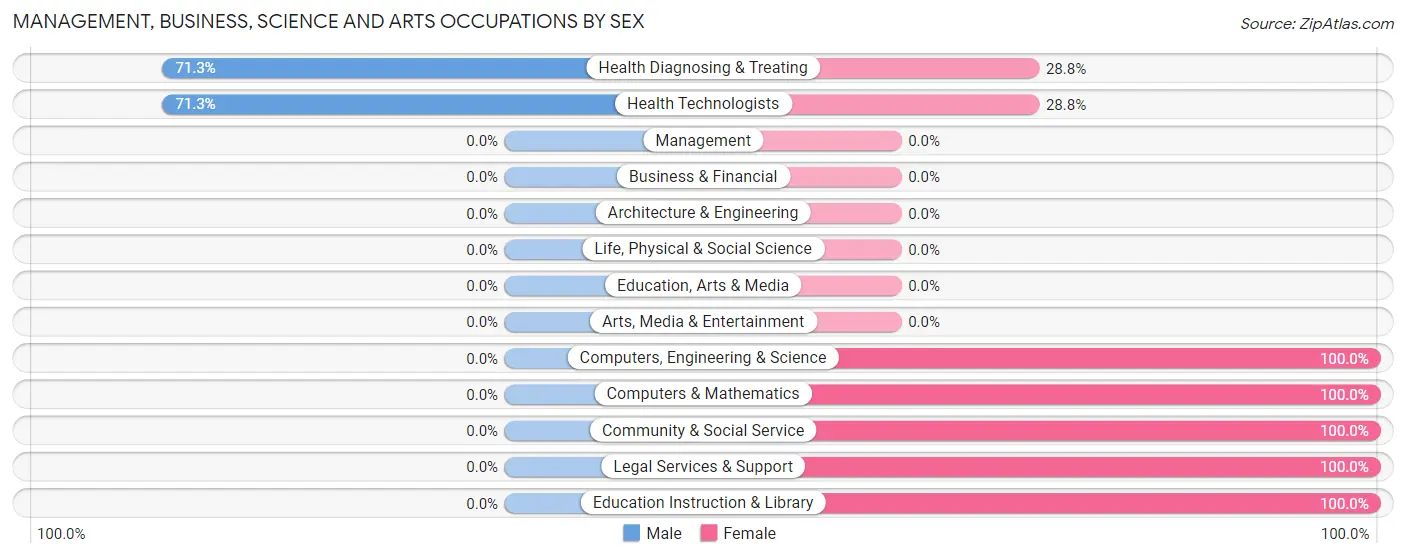
| Occupation | Male | Female |
| Management | 0 (0.0%) | 0 (0.0%) |
| Business & Financial | 0 (0.0%) | 0 (0.0%) |
| Computers, Engineering & Science | 0 (0.0%) | 54 (100.0%) |
| Computers & Mathematics | 0 (0.0%) | 54 (100.0%) |
| Architecture & Engineering | 0 (0.0%) | 0 (0.0%) |
| Life, Physical & Social Science | 0 (0.0%) | 0 (0.0%) |
| Community & Social Service | 0 (0.0%) | 200 (100.0%) |
| Education, Arts & Media | 0 (0.0%) | 0 (0.0%) |
| Legal Services & Support | 0 (0.0%) | 33 (100.0%) |
| Education Instruction & Library | 0 (0.0%) | 167 (100.0%) |
| Arts, Media & Entertainment | 0 (0.0%) | 0 (0.0%) |
| Health Diagnosing & Treating | 57 (71.3%) | 23 (28.7%) |
| Health Technologists | 57 (71.3%) | 23 (28.7%) |
| Total (Category) | 57 (17.1%) | 277 (82.9%) |
| Total (Overall) | 598 (54.2%) | 506 (45.8%) |
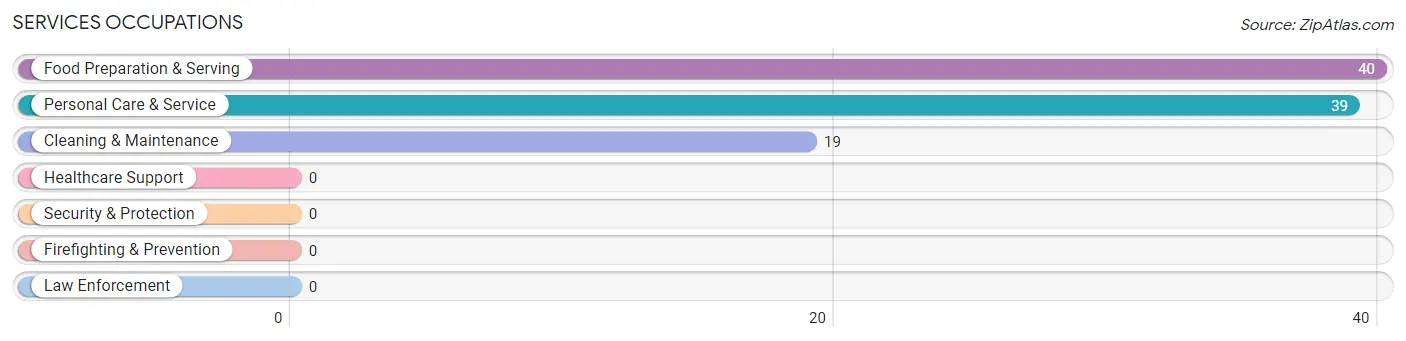
Services Occupations
The most common Services occupations in Stanton are Food Preparation & Serving (40 | 3.6%), Personal Care & Service (39 | 3.5%), and Cleaning & Maintenance (19 | 1.7%).
Services Occupations by Sex
Within the Services occupations in Stanton, the most male-oriented occupations are Personal Care & Service (100.0%), and Food Preparation & Serving (35.0%), while the most female-oriented occupations are Cleaning & Maintenance (100.0%), and Food Preparation & Serving (65.0%).
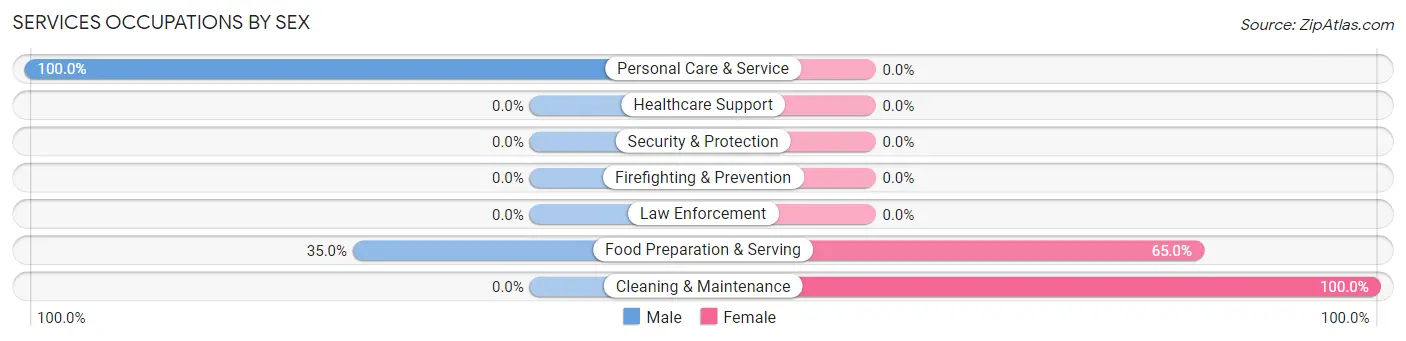
| Occupation | Male | Female |
| Healthcare Support | 0 (0.0%) | 0 (0.0%) |
| Security & Protection | 0 (0.0%) | 0 (0.0%) |
| Firefighting & Prevention | 0 (0.0%) | 0 (0.0%) |
| Law Enforcement | 0 (0.0%) | 0 (0.0%) |
| Food Preparation & Serving | 14 (35.0%) | 26 (65.0%) |
| Cleaning & Maintenance | 0 (0.0%) | 19 (100.0%) |
| Personal Care & Service | 39 (100.0%) | 0 (0.0%) |
| Total (Category) | 53 (54.1%) | 45 (45.9%) |
| Total (Overall) | 598 (54.2%) | 506 (45.8%) |
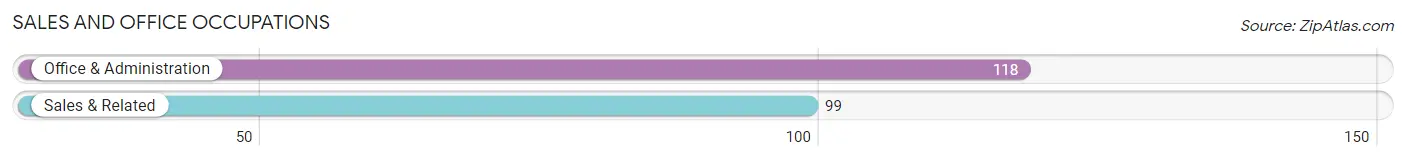
Sales and Office Occupations
The most common Sales and Office occupations in Stanton are Office & Administration (118 | 10.7%), and Sales & Related (99 | 9.0%).
Sales and Office Occupations by Sex
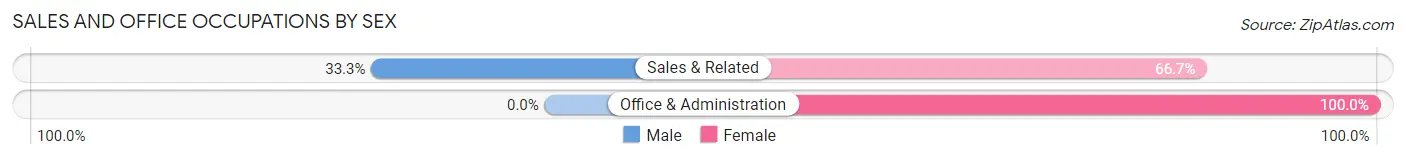
| Occupation | Male | Female |
| Sales & Related | 33 (33.3%) | 66 (66.7%) |
| Office & Administration | 0 (0.0%) | 118 (100.0%) |
| Total (Category) | 33 (15.2%) | 184 (84.8%) |
| Total (Overall) | 598 (54.2%) | 506 (45.8%) |
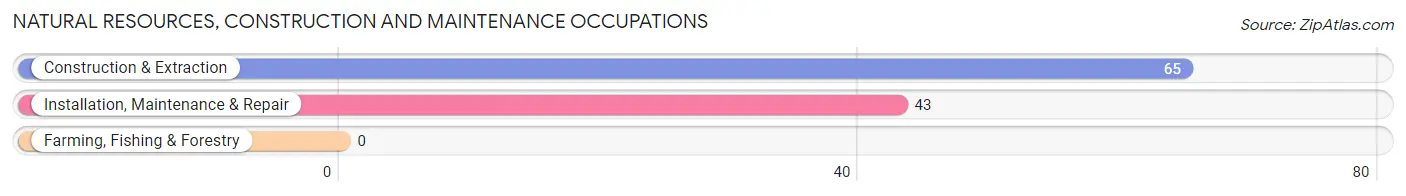
Natural Resources, Construction and Maintenance Occupations
The most common Natural Resources, Construction and Maintenance occupations in Stanton are Construction & Extraction (65 | 5.9%), and Installation, Maintenance & Repair (43 | 3.9%).
Natural Resources, Construction and Maintenance Occupations by Sex
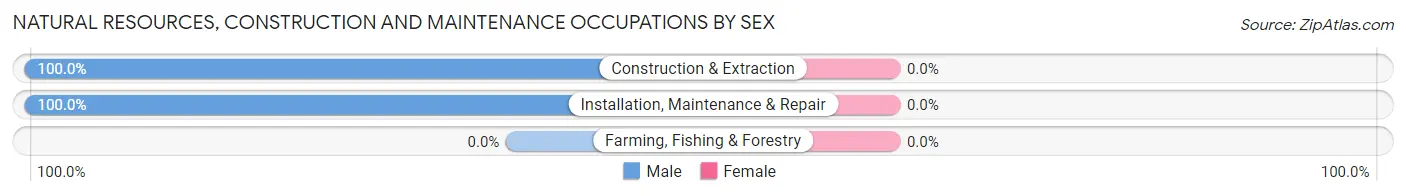
| Occupation | Male | Female |
| Farming, Fishing & Forestry | 0 (0.0%) | 0 (0.0%) |
| Construction & Extraction | 65 (100.0%) | 0 (0.0%) |
| Installation, Maintenance & Repair | 43 (100.0%) | 0 (0.0%) |
| Total (Category) | 108 (100.0%) | 0 (0.0%) |
| Total (Overall) | 598 (54.2%) | 506 (45.8%) |
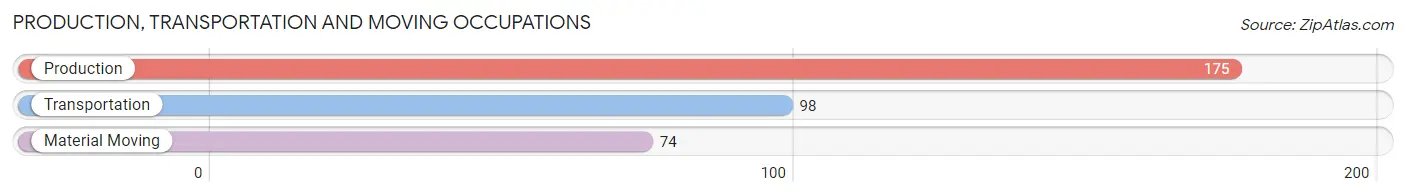
Production, Transportation and Moving Occupations
The most common Production, Transportation and Moving occupations in Stanton are Production (175 | 15.9%), Transportation (98 | 8.9%), and Material Moving (74 | 6.7%).
Production, Transportation and Moving Occupations by Sex
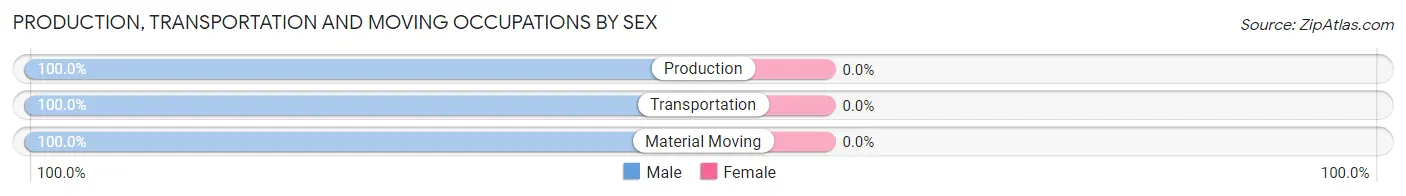
| Occupation | Male | Female |
| Production | 175 (100.0%) | 0 (0.0%) |
| Transportation | 98 (100.0%) | 0 (0.0%) |
| Material Moving | 74 (100.0%) | 0 (0.0%) |
| Total (Category) | 347 (100.0%) | 0 (0.0%) |
| Total (Overall) | 598 (54.2%) | 506 (45.8%) |
Employment Industries by Sex in Stanton
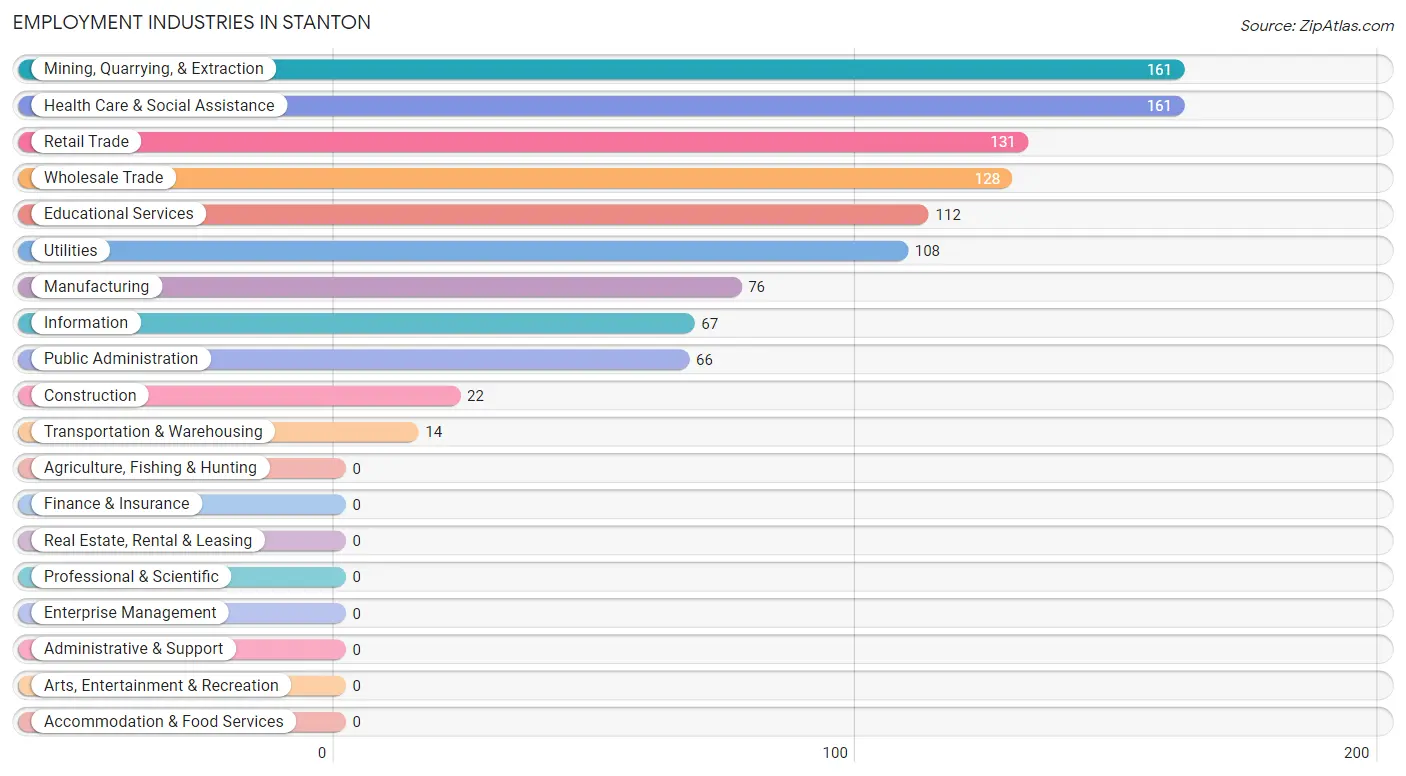
Employment Industries in Stanton
The major employment industries in Stanton include Mining, Quarrying, & Extraction (161 | 14.6%), Health Care & Social Assistance (161 | 14.6%), Retail Trade (131 | 11.9%), Wholesale Trade (128 | 11.6%), and Educational Services (112 | 10.1%).
Employment Industries by Sex in Stanton
The Stanton industries that see more men than women are Mining, Quarrying, & Extraction (100.0%), Construction (100.0%), and Wholesale Trade (100.0%), whereas the industries that tend to have a higher number of women are Educational Services (100.0%), Public Administration (100.0%), and Information (77.6%).
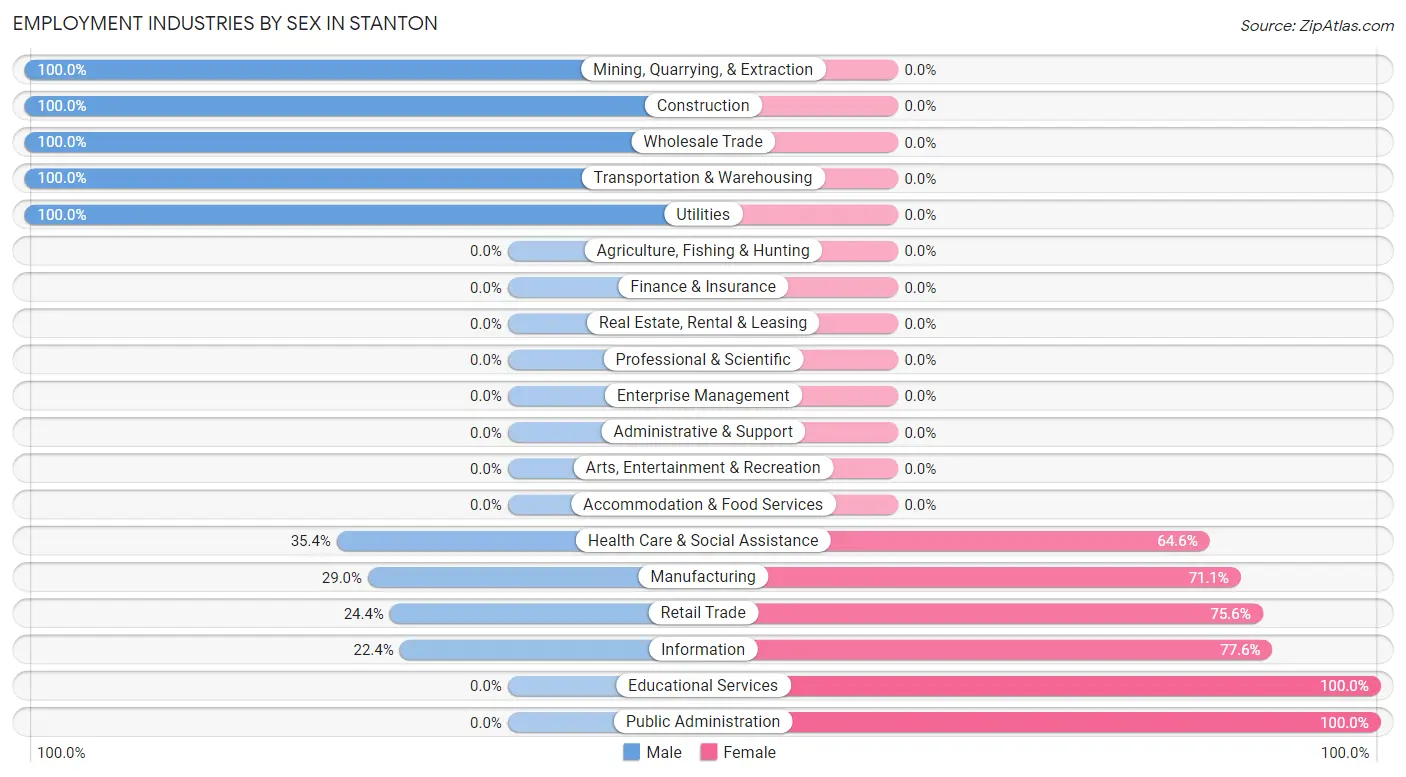
| Industry | Male | Female |
| Agriculture, Fishing & Hunting | 0 (0.0%) | 0 (0.0%) |
| Mining, Quarrying, & Extraction | 161 (100.0%) | 0 (0.0%) |
| Construction | 22 (100.0%) | 0 (0.0%) |
| Manufacturing | 22 (28.9%) | 54 (71.1%) |
| Wholesale Trade | 128 (100.0%) | 0 (0.0%) |
| Retail Trade | 32 (24.4%) | 99 (75.6%) |
| Transportation & Warehousing | 14 (100.0%) | 0 (0.0%) |
| Utilities | 108 (100.0%) | 0 (0.0%) |
| Information | 15 (22.4%) | 52 (77.6%) |
| Finance & Insurance | 0 (0.0%) | 0 (0.0%) |
| Real Estate, Rental & Leasing | 0 (0.0%) | 0 (0.0%) |
| Professional & Scientific | 0 (0.0%) | 0 (0.0%) |
| Enterprise Management | 0 (0.0%) | 0 (0.0%) |
| Administrative & Support | 0 (0.0%) | 0 (0.0%) |
| Educational Services | 0 (0.0%) | 112 (100.0%) |
| Health Care & Social Assistance | 57 (35.4%) | 104 (64.6%) |
| Arts, Entertainment & Recreation | 0 (0.0%) | 0 (0.0%) |
| Accommodation & Food Services | 0 (0.0%) | 0 (0.0%) |
| Public Administration | 0 (0.0%) | 66 (100.0%) |
| Total | 598 (54.2%) | 506 (45.8%) |
Education in Stanton
School Enrollment in Stanton
The most common levels of schooling among the 745 students in Stanton are elementary school (209 | 28.1%), high school (169 | 22.7%), and middle school (167 | 22.4%).
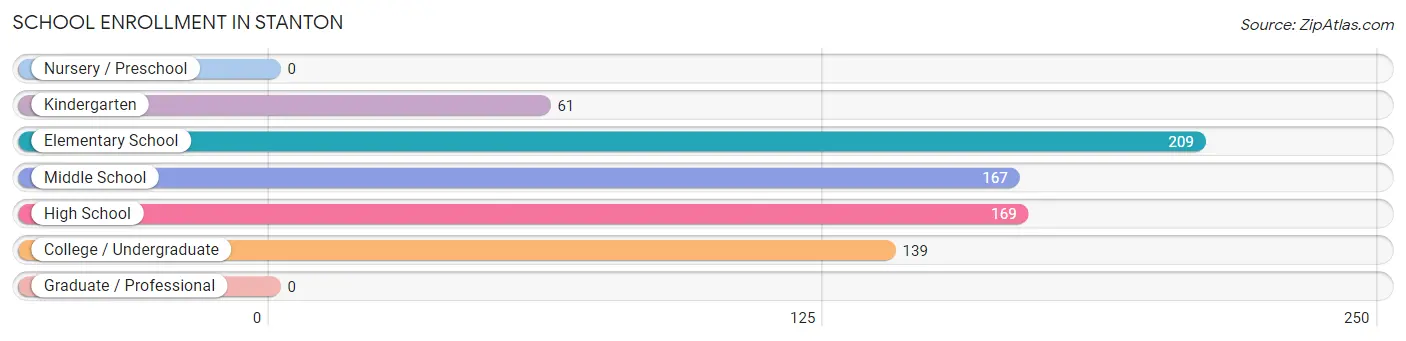
| School Level | # Students | % Students |
| Nursery / Preschool | 0 | 0.0% |
| Kindergarten | 61 | 8.2% |
| Elementary School | 209 | 28.1% |
| Middle School | 167 | 22.4% |
| High School | 169 | 22.7% |
| College / Undergraduate | 139 | 18.7% |
| Graduate / Professional | 0 | 0.0% |
| Total | 745 | 100.0% |
School Enrollment by Age by Funding Source in Stanton
Out of a total of 745 students who are enrolled in schools in Stanton, 76 (10.2%) attend a private institution, while the remaining 669 (89.8%) are enrolled in public schools. The age group of 10 to 14 year olds has the highest likelihood of being enrolled in private schools, with 76 (20.2% in the age bracket) enrolled. Conversely, the age group of 5 to 9 year old has the lowest likelihood of being enrolled in a private school, with 149 (100.0% in the age bracket) attending a public institution.
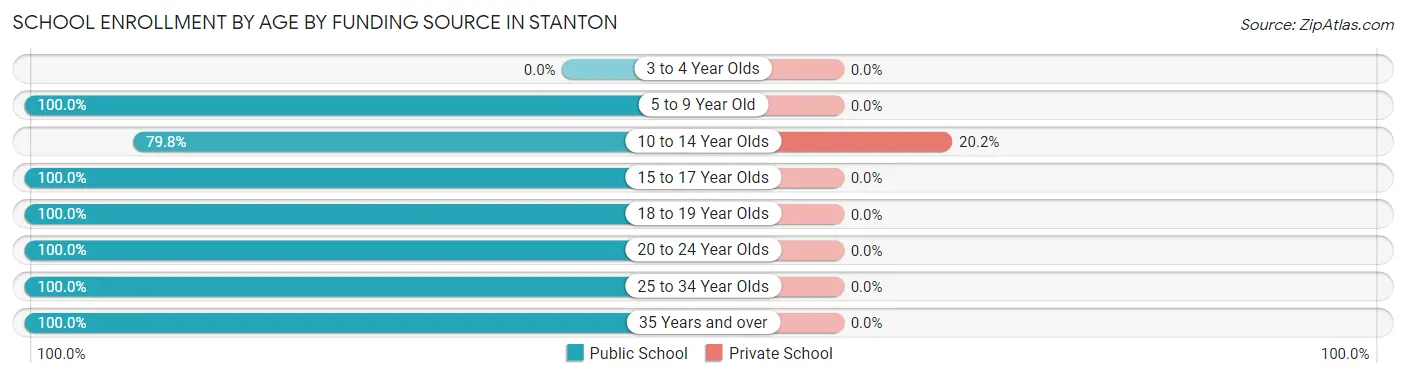
| Age Bracket | Public School | Private School |
| 3 to 4 Year Olds | 0 (0.0%) | 0 (0.0%) |
| 5 to 9 Year Old | 149 (100.0%) | 0 (0.0%) |
| 10 to 14 Year Olds | 300 (79.8%) | 76 (20.2%) |
| 15 to 17 Year Olds | 81 (100.0%) | 0 (0.0%) |
| 18 to 19 Year Olds | 15 (100.0%) | 0 (0.0%) |
| 20 to 24 Year Olds | 48 (100.0%) | 0 (0.0%) |
| 25 to 34 Year Olds | 41 (100.0%) | 0 (0.0%) |
| 35 Years and over | 35 (100.0%) | 0 (0.0%) |
| Total | 669 (89.8%) | 76 (10.2%) |
Educational Attainment by Field of Study in Stanton
Arts & humanities (92 | 45.8%), communications (40 | 19.9%), bio, nature & agricultural (39 | 19.4%), business (18 | 9.0%), and education (12 | 6.0%) are the most common fields of study among 201 individuals in Stanton who have obtained a bachelor's degree or higher.
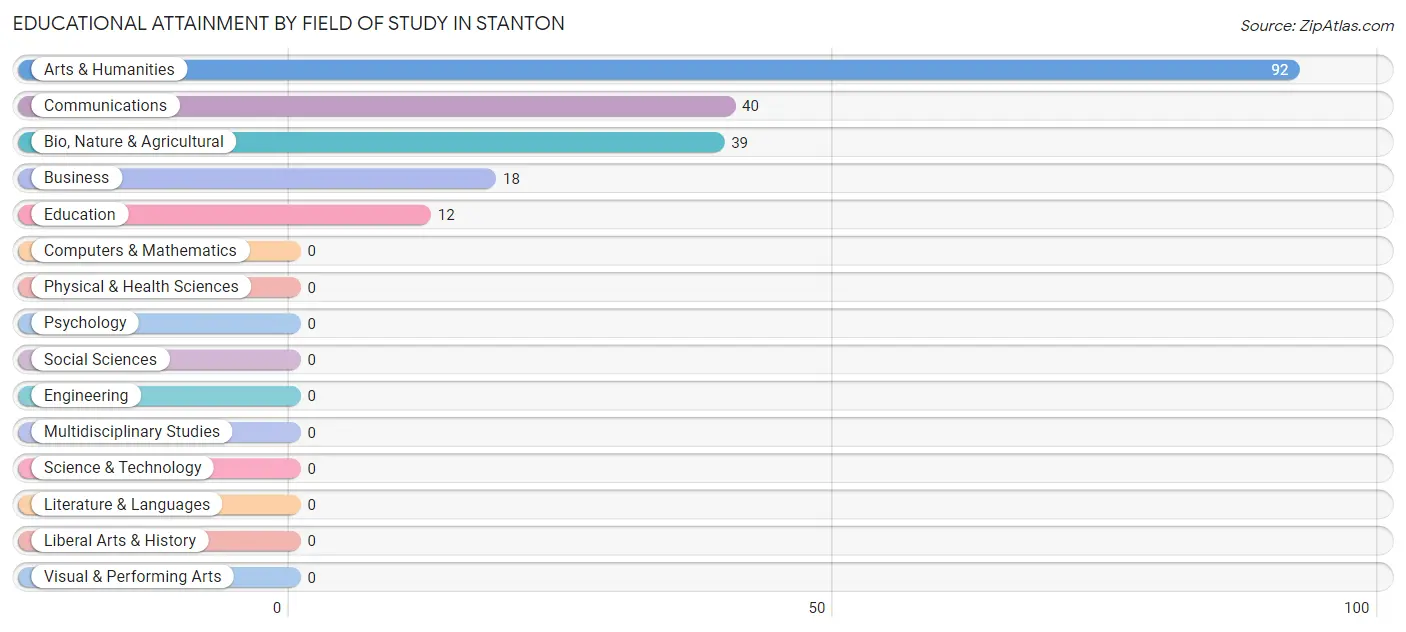
| Field of Study | # Graduates | % Graduates |
| Computers & Mathematics | 0 | 0.0% |
| Bio, Nature & Agricultural | 39 | 19.4% |
| Physical & Health Sciences | 0 | 0.0% |
| Psychology | 0 | 0.0% |
| Social Sciences | 0 | 0.0% |
| Engineering | 0 | 0.0% |
| Multidisciplinary Studies | 0 | 0.0% |
| Science & Technology | 0 | 0.0% |
| Business | 18 | 9.0% |
| Education | 12 | 6.0% |
| Literature & Languages | 0 | 0.0% |
| Liberal Arts & History | 0 | 0.0% |
| Visual & Performing Arts | 0 | 0.0% |
| Communications | 40 | 19.9% |
| Arts & Humanities | 92 | 45.8% |
| Total | 201 | 100.0% |
Transportation & Commute in Stanton
Vehicle Availability by Sex in Stanton
The most prevalent vehicle ownership categories in Stanton are males with 2 vehicles (251, accounting for 42.0%) and females with 2 vehicles (131, making up 58.0%).
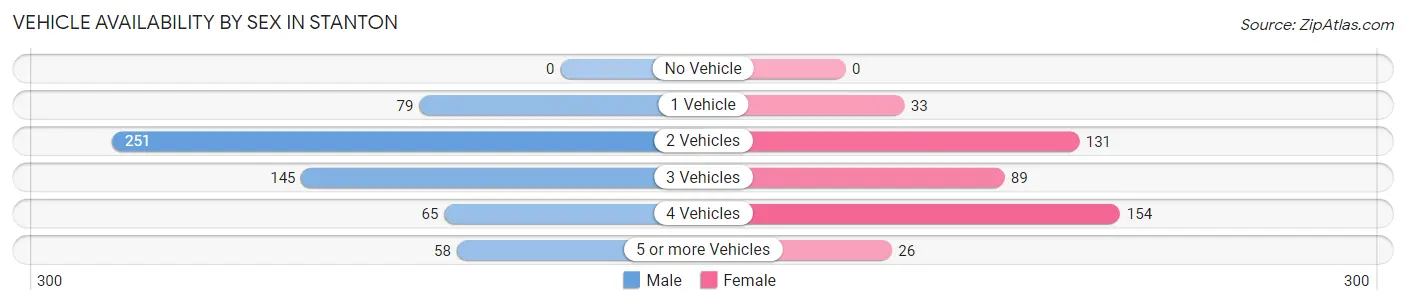
| Vehicles Available | Male | Female |
| No Vehicle | 0 (0.0%) | 0 (0.0%) |
| 1 Vehicle | 79 (13.2%) | 33 (7.6%) |
| 2 Vehicles | 251 (42.0%) | 131 (30.2%) |
| 3 Vehicles | 145 (24.2%) | 89 (20.5%) |
| 4 Vehicles | 65 (10.9%) | 154 (35.6%) |
| 5 or more Vehicles | 58 (9.7%) | 26 (6.0%) |
| Total | 598 (100.0%) | 433 (100.0%) |
Commute Time in Stanton
The most frequently occuring commute durations in Stanton are 20 to 24 minutes (322 commuters, 31.2%), 5 to 9 minutes (217 commuters, 21.0%), and 30 to 34 minutes (201 commuters, 19.5%).
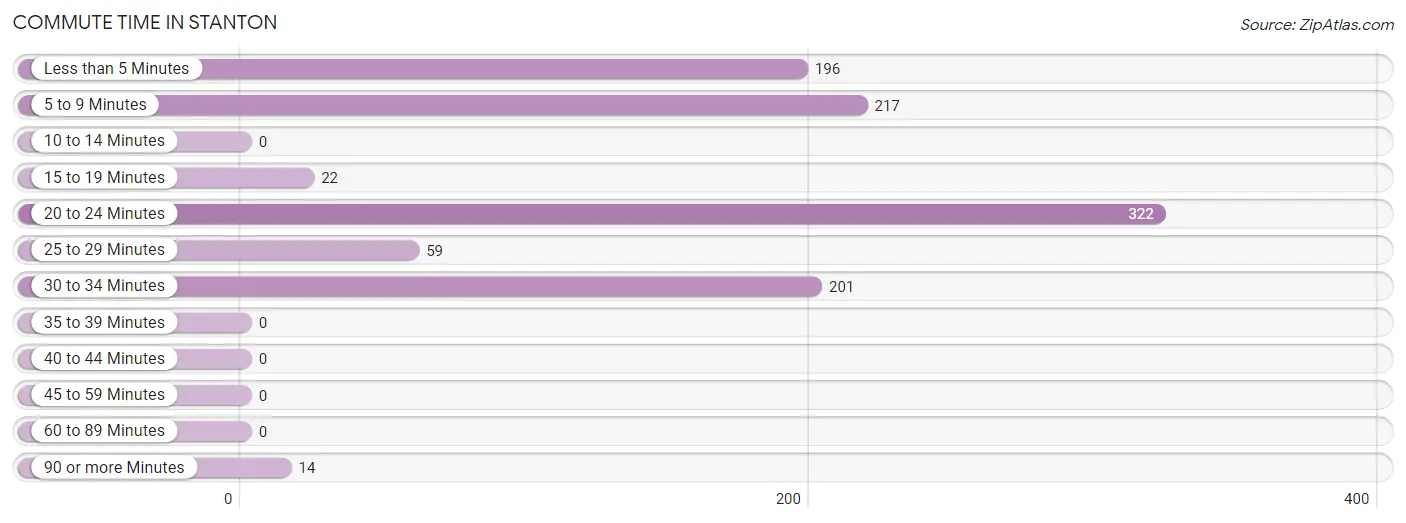
| Commute Time | # Commuters | % Commuters |
| Less than 5 Minutes | 196 | 19.0% |
| 5 to 9 Minutes | 217 | 21.0% |
| 10 to 14 Minutes | 0 | 0.0% |
| 15 to 19 Minutes | 22 | 2.1% |
| 20 to 24 Minutes | 322 | 31.2% |
| 25 to 29 Minutes | 59 | 5.7% |
| 30 to 34 Minutes | 201 | 19.5% |
| 35 to 39 Minutes | 0 | 0.0% |
| 40 to 44 Minutes | 0 | 0.0% |
| 45 to 59 Minutes | 0 | 0.0% |
| 60 to 89 Minutes | 0 | 0.0% |
| 90 or more Minutes | 14 | 1.4% |
Commute Time by Sex in Stanton
The most common commute times in Stanton are 20 to 24 minutes (303 commuters, 50.7%) for males and less than 5 minutes (157 commuters, 36.3%) for females.
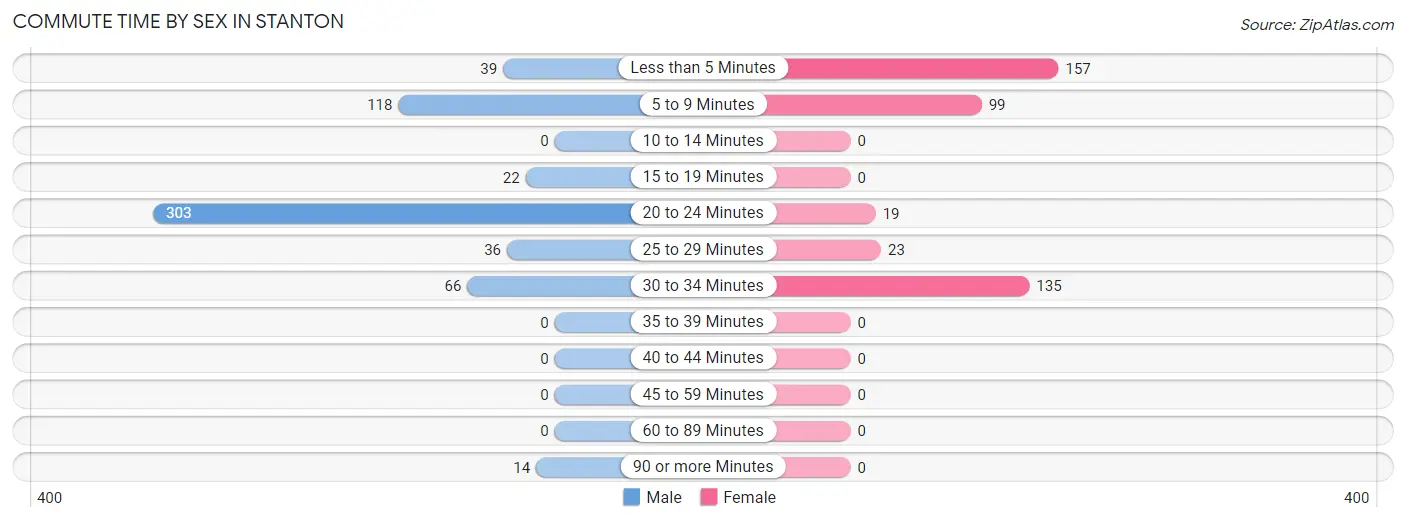
| Commute Time | Male | Female |
| Less than 5 Minutes | 39 (6.5%) | 157 (36.3%) |
| 5 to 9 Minutes | 118 (19.7%) | 99 (22.9%) |
| 10 to 14 Minutes | 0 (0.0%) | 0 (0.0%) |
| 15 to 19 Minutes | 22 (3.7%) | 0 (0.0%) |
| 20 to 24 Minutes | 303 (50.7%) | 19 (4.4%) |
| 25 to 29 Minutes | 36 (6.0%) | 23 (5.3%) |
| 30 to 34 Minutes | 66 (11.0%) | 135 (31.2%) |
| 35 to 39 Minutes | 0 (0.0%) | 0 (0.0%) |
| 40 to 44 Minutes | 0 (0.0%) | 0 (0.0%) |
| 45 to 59 Minutes | 0 (0.0%) | 0 (0.0%) |
| 60 to 89 Minutes | 0 (0.0%) | 0 (0.0%) |
| 90 or more Minutes | 14 (2.3%) | 0 (0.0%) |
Time of Departure to Work by Sex in Stanton
The most frequent times of departure to work in Stanton are 7:00 AM to 7:29 AM (252, 42.1%) for males and 7:00 AM to 7:29 AM (94, 21.7%) for females.
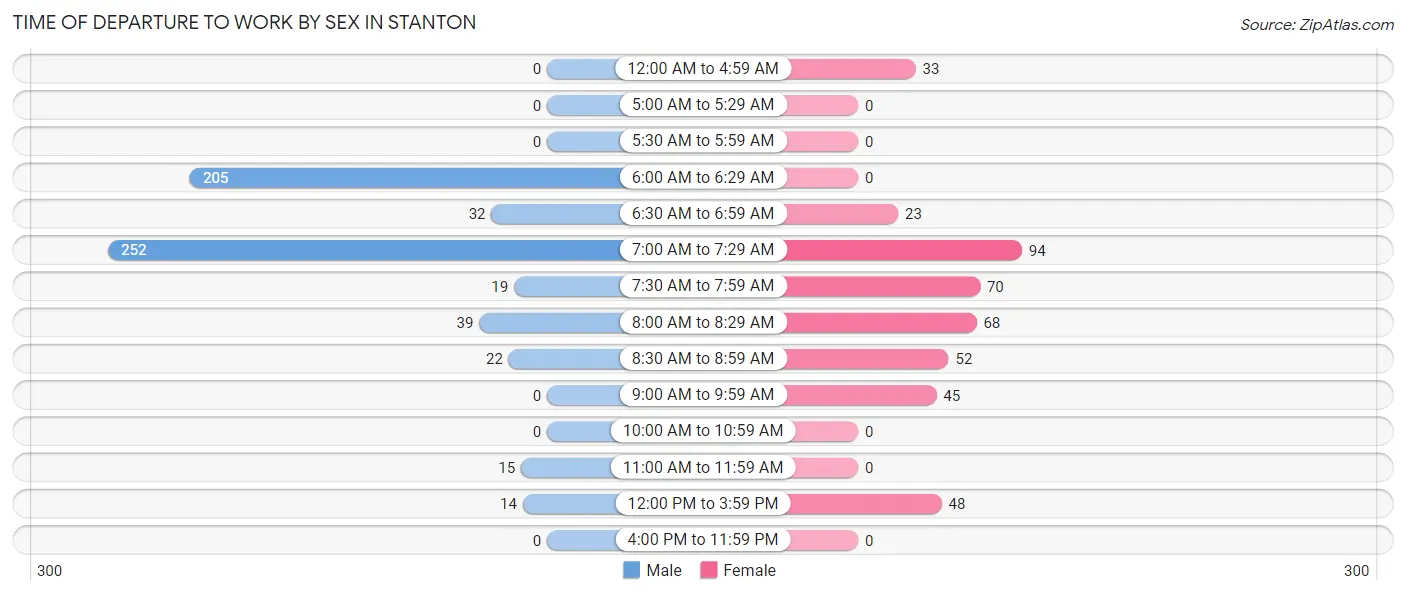
| Time of Departure | Male | Female |
| 12:00 AM to 4:59 AM | 0 (0.0%) | 33 (7.6%) |
| 5:00 AM to 5:29 AM | 0 (0.0%) | 0 (0.0%) |
| 5:30 AM to 5:59 AM | 0 (0.0%) | 0 (0.0%) |
| 6:00 AM to 6:29 AM | 205 (34.3%) | 0 (0.0%) |
| 6:30 AM to 6:59 AM | 32 (5.3%) | 23 (5.3%) |
| 7:00 AM to 7:29 AM | 252 (42.1%) | 94 (21.7%) |
| 7:30 AM to 7:59 AM | 19 (3.2%) | 70 (16.2%) |
| 8:00 AM to 8:29 AM | 39 (6.5%) | 68 (15.7%) |
| 8:30 AM to 8:59 AM | 22 (3.7%) | 52 (12.0%) |
| 9:00 AM to 9:59 AM | 0 (0.0%) | 45 (10.4%) |
| 10:00 AM to 10:59 AM | 0 (0.0%) | 0 (0.0%) |
| 11:00 AM to 11:59 AM | 15 (2.5%) | 0 (0.0%) |
| 12:00 PM to 3:59 PM | 14 (2.3%) | 48 (11.1%) |
| 4:00 PM to 11:59 PM | 0 (0.0%) | 0 (0.0%) |
| Total | 598 (100.0%) | 433 (100.0%) |
Housing Occupancy in Stanton
Occupancy by Ownership in Stanton
Of the total 974 dwellings in Stanton, owner-occupied units account for 495 (50.8%), while renter-occupied units make up 479 (49.2%).
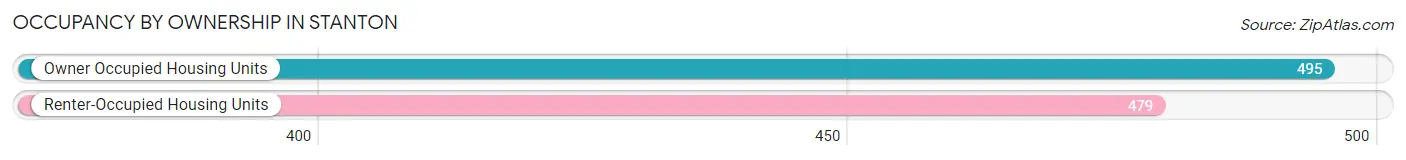
| Occupancy | # Housing Units | % Housing Units |
| Owner Occupied Housing Units | 495 | 50.8% |
| Renter-Occupied Housing Units | 479 | 49.2% |
| Total Occupied Housing Units | 974 | 100.0% |
Occupancy by Household Size in Stanton
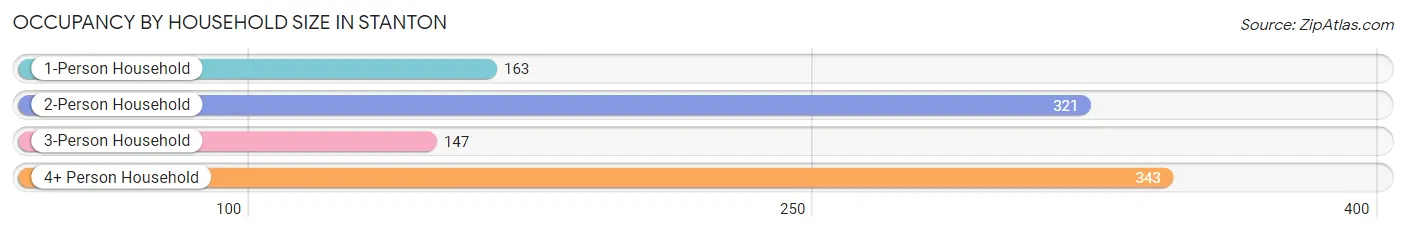
| Household Size | # Housing Units | % Housing Units |
| 1-Person Household | 163 | 16.7% |
| 2-Person Household | 321 | 33.0% |
| 3-Person Household | 147 | 15.1% |
| 4+ Person Household | 343 | 35.2% |
| Total Housing Units | 974 | 100.0% |
Occupancy by Ownership by Household Size in Stanton
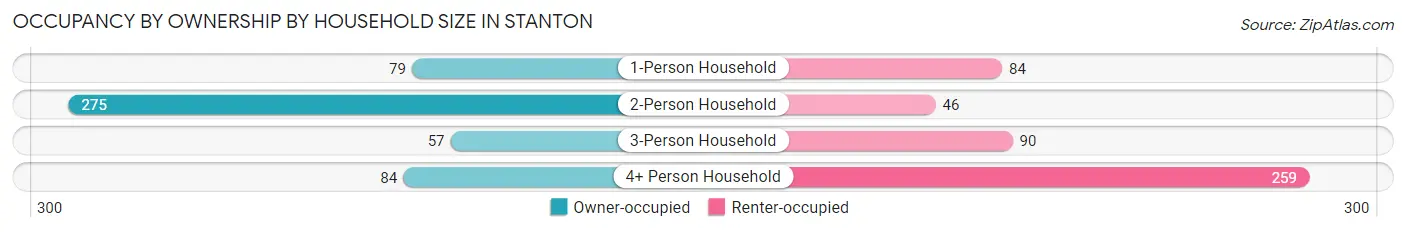
| Household Size | Owner-occupied | Renter-occupied |
| 1-Person Household | 79 (48.5%) | 84 (51.5%) |
| 2-Person Household | 275 (85.7%) | 46 (14.3%) |
| 3-Person Household | 57 (38.8%) | 90 (61.2%) |
| 4+ Person Household | 84 (24.5%) | 259 (75.5%) |
| Total Housing Units | 495 (50.8%) | 479 (49.2%) |
Occupancy by Educational Attainment in Stanton
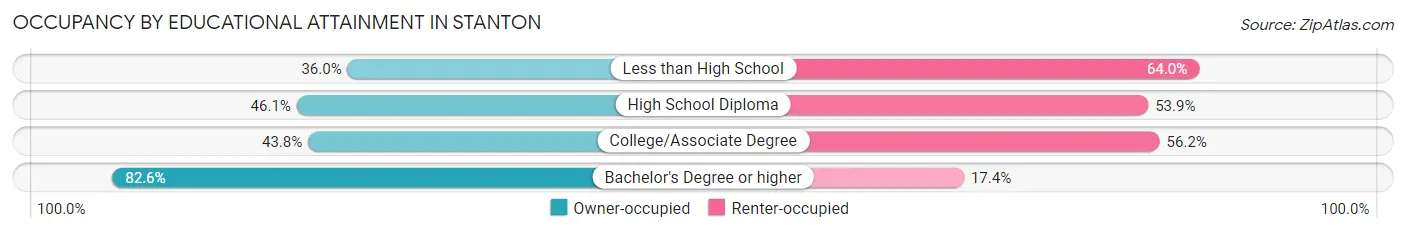
| Household Size | Owner-occupied | Renter-occupied |
| Less than High School | 77 (36.0%) | 137 (64.0%) |
| High School Diploma | 146 (46.1%) | 171 (53.9%) |
| College/Associate Degree | 106 (43.8%) | 136 (56.2%) |
| Bachelor's Degree or higher | 166 (82.6%) | 35 (17.4%) |
Occupancy by Age of Householder in Stanton
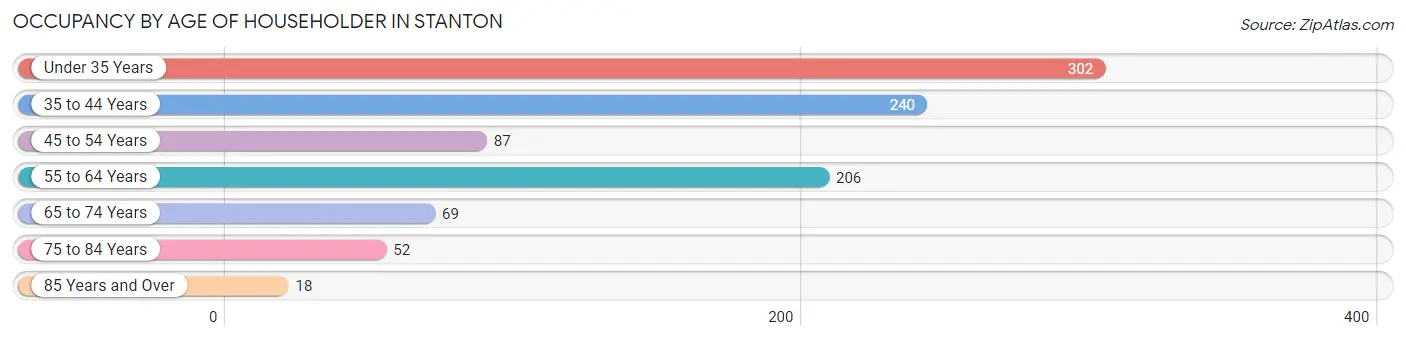
| Age Bracket | # Households | % Households |
| Under 35 Years | 302 | 31.0% |
| 35 to 44 Years | 240 | 24.6% |
| 45 to 54 Years | 87 | 8.9% |
| 55 to 64 Years | 206 | 21.1% |
| 65 to 74 Years | 69 | 7.1% |
| 75 to 84 Years | 52 | 5.3% |
| 85 Years and Over | 18 | 1.8% |
| Total | 974 | 100.0% |
Housing Finances in Stanton
Median Income by Occupancy in Stanton
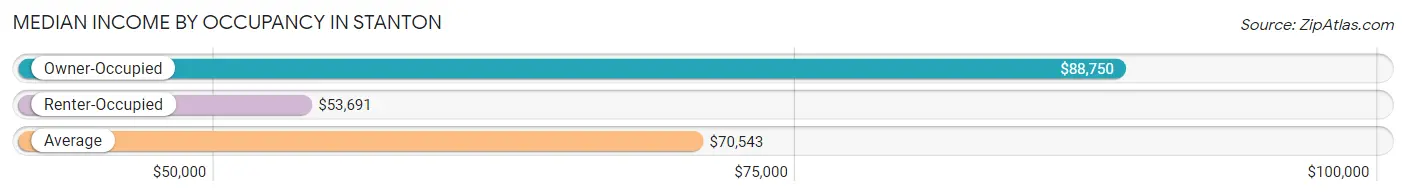
| Occupancy Type | # Households | Median Income |
| Owner-Occupied | 495 (50.8%) | $88,750 |
| Renter-Occupied | 479 (49.2%) | $53,691 |
| Average | 974 (100.0%) | $70,543 |
Occupancy by Householder Income Bracket in Stanton
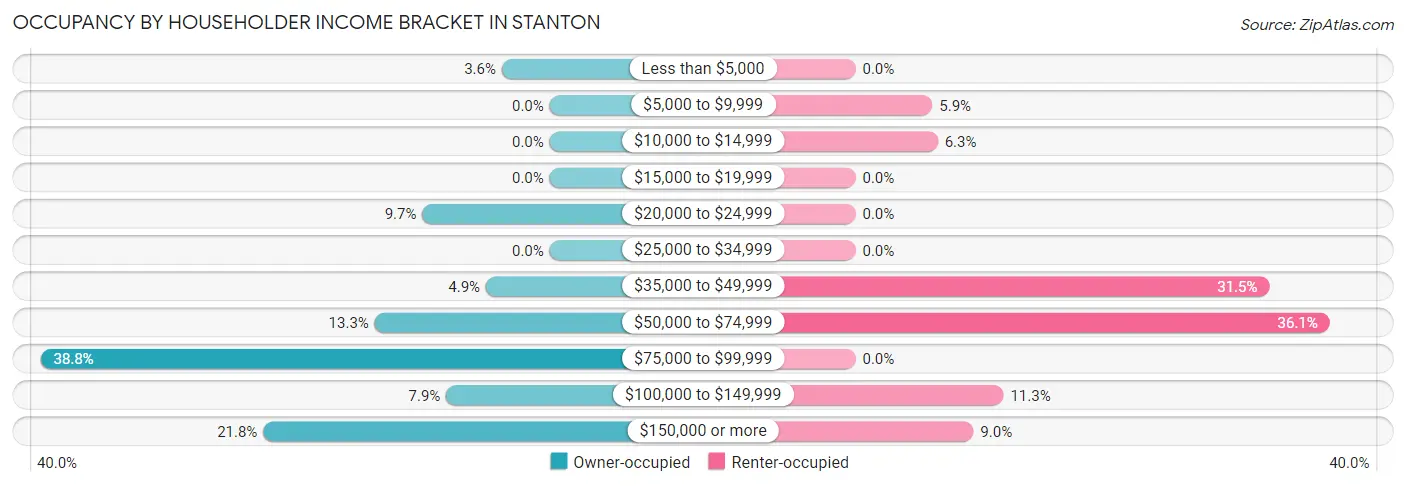
| Income Bracket | Owner-occupied | Renter-occupied |
| Less than $5,000 | 18 (3.6%) | 0 (0.0%) |
| $5,000 to $9,999 | 0 (0.0%) | 28 (5.9%) |
| $10,000 to $14,999 | 0 (0.0%) | 30 (6.3%) |
| $15,000 to $19,999 | 0 (0.0%) | 0 (0.0%) |
| $20,000 to $24,999 | 48 (9.7%) | 0 (0.0%) |
| $25,000 to $34,999 | 0 (0.0%) | 0 (0.0%) |
| $35,000 to $49,999 | 24 (4.9%) | 151 (31.5%) |
| $50,000 to $74,999 | 66 (13.3%) | 173 (36.1%) |
| $75,000 to $99,999 | 192 (38.8%) | 0 (0.0%) |
| $100,000 to $149,999 | 39 (7.9%) | 54 (11.3%) |
| $150,000 or more | 108 (21.8%) | 43 (9.0%) |
| Total | 495 (100.0%) | 479 (100.0%) |
Monthly Housing Cost Tiers in Stanton
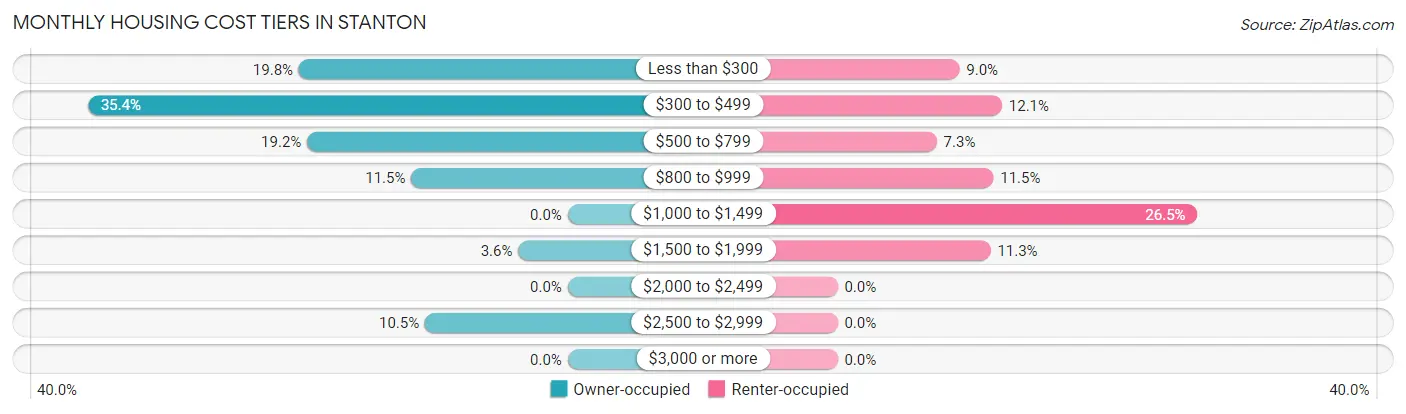
| Monthly Cost | Owner-occupied | Renter-occupied |
| Less than $300 | 98 (19.8%) | 43 (9.0%) |
| $300 to $499 | 175 (35.3%) | 58 (12.1%) |
| $500 to $799 | 95 (19.2%) | 35 (7.3%) |
| $800 to $999 | 57 (11.5%) | 55 (11.5%) |
| $1,000 to $1,499 | 0 (0.0%) | 127 (26.5%) |
| $1,500 to $1,999 | 18 (3.6%) | 54 (11.3%) |
| $2,000 to $2,499 | 0 (0.0%) | 0 (0.0%) |
| $2,500 to $2,999 | 52 (10.5%) | 0 (0.0%) |
| $3,000 or more | 0 (0.0%) | 0 (0.0%) |
| Total | 495 (100.0%) | 479 (100.0%) |
Physical Housing Characteristics in Stanton
Housing Structures in Stanton
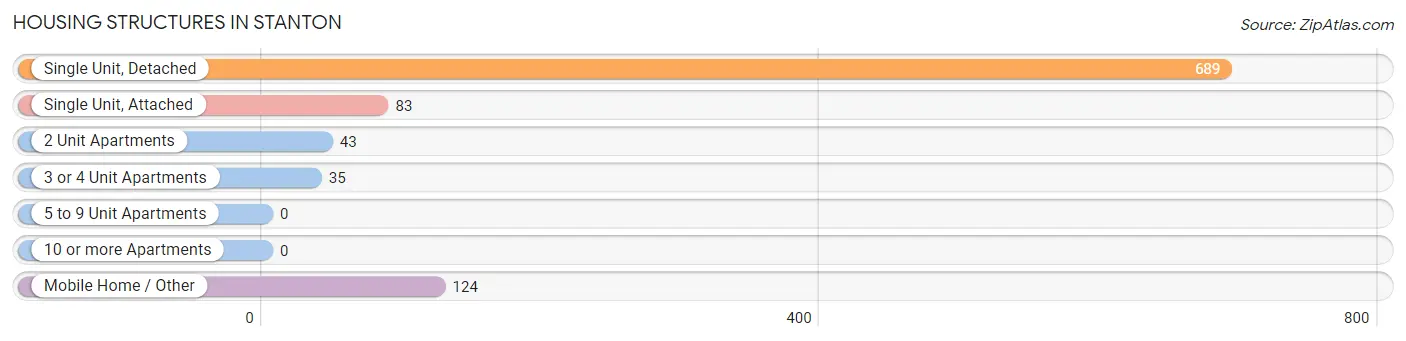
| Structure Type | # Housing Units | % Housing Units |
| Single Unit, Detached | 689 | 70.7% |
| Single Unit, Attached | 83 | 8.5% |
| 2 Unit Apartments | 43 | 4.4% |
| 3 or 4 Unit Apartments | 35 | 3.6% |
| 5 to 9 Unit Apartments | 0 | 0.0% |
| 10 or more Apartments | 0 | 0.0% |
| Mobile Home / Other | 124 | 12.7% |
| Total | 974 | 100.0% |
Housing Structures by Occupancy in Stanton
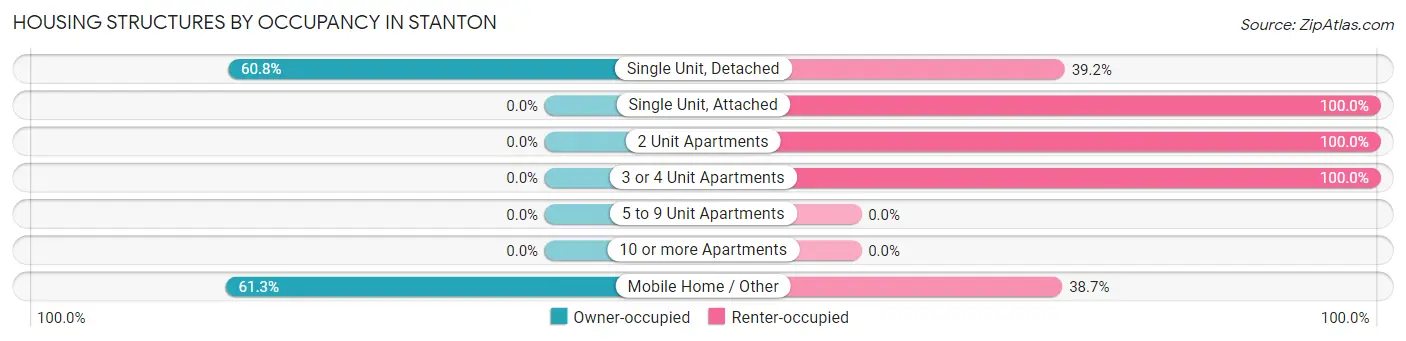
| Structure Type | Owner-occupied | Renter-occupied |
| Single Unit, Detached | 419 (60.8%) | 270 (39.2%) |
| Single Unit, Attached | 0 (0.0%) | 83 (100.0%) |
| 2 Unit Apartments | 0 (0.0%) | 43 (100.0%) |
| 3 or 4 Unit Apartments | 0 (0.0%) | 35 (100.0%) |
| 5 to 9 Unit Apartments | 0 (0.0%) | 0 (0.0%) |
| 10 or more Apartments | 0 (0.0%) | 0 (0.0%) |
| Mobile Home / Other | 76 (61.3%) | 48 (38.7%) |
| Total | 495 (50.8%) | 479 (49.2%) |
Housing Structures by Number of Rooms in Stanton
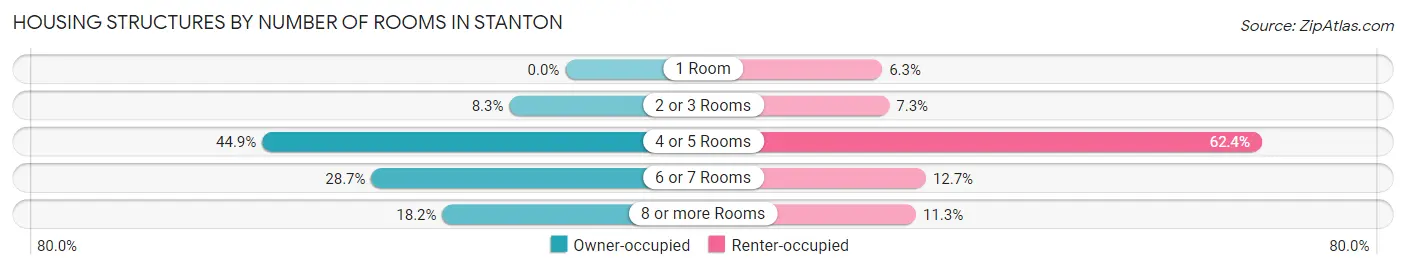
| Number of Rooms | Owner-occupied | Renter-occupied |
| 1 Room | 0 (0.0%) | 30 (6.3%) |
| 2 or 3 Rooms | 41 (8.3%) | 35 (7.3%) |
| 4 or 5 Rooms | 222 (44.9%) | 299 (62.4%) |
| 6 or 7 Rooms | 142 (28.7%) | 61 (12.7%) |
| 8 or more Rooms | 90 (18.2%) | 54 (11.3%) |
| Total | 495 (100.0%) | 479 (100.0%) |
Housing Structure by Heating Type in Stanton
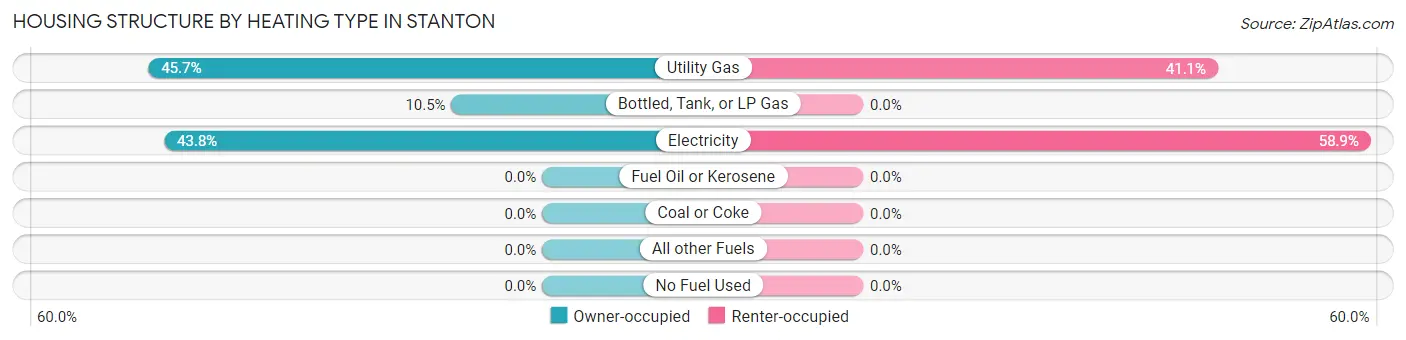
| Heating Type | Owner-occupied | Renter-occupied |
| Utility Gas | 226 (45.7%) | 197 (41.1%) |
| Bottled, Tank, or LP Gas | 52 (10.5%) | 0 (0.0%) |
| Electricity | 217 (43.8%) | 282 (58.9%) |
| Fuel Oil or Kerosene | 0 (0.0%) | 0 (0.0%) |
| Coal or Coke | 0 (0.0%) | 0 (0.0%) |
| All other Fuels | 0 (0.0%) | 0 (0.0%) |
| No Fuel Used | 0 (0.0%) | 0 (0.0%) |
| Total | 495 (100.0%) | 479 (100.0%) |
Household Vehicle Usage in Stanton
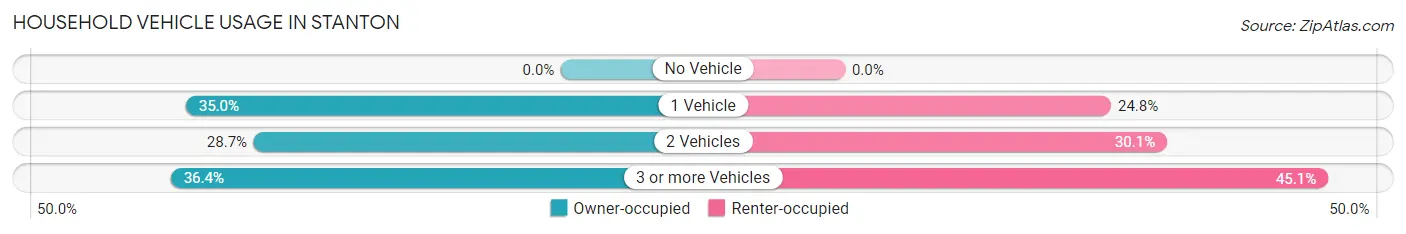
| Vehicles per Household | Owner-occupied | Renter-occupied |
| No Vehicle | 0 (0.0%) | 0 (0.0%) |
| 1 Vehicle | 173 (34.9%) | 119 (24.8%) |
| 2 Vehicles | 142 (28.7%) | 144 (30.1%) |
| 3 or more Vehicles | 180 (36.4%) | 216 (45.1%) |
| Total | 495 (100.0%) | 479 (100.0%) |
Real Estate & Mortgages in Stanton
Real Estate and Mortgage Overview in Stanton
| Characteristic | Without Mortgage | With Mortgage |
| Housing Units | 443 | 52 |
| Median Property Value | $88,800 | $0 |
| Median Household Income | $90,320 | $0 |
| Monthly Housing Costs | $406 | $0 |
| Real Estate Taxes | $1,098 | $0 |
Property Value by Mortgage Status in Stanton
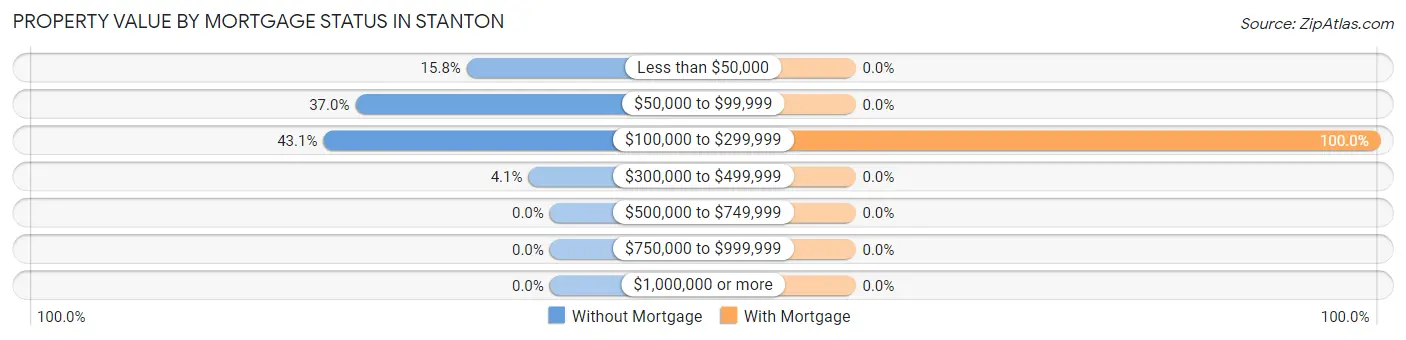
| Property Value | Without Mortgage | With Mortgage |
| Less than $50,000 | 70 (15.8%) | 0 (0.0%) |
| $50,000 to $99,999 | 164 (37.0%) | 0 (0.0%) |
| $100,000 to $299,999 | 191 (43.1%) | 52 (100.0%) |
| $300,000 to $499,999 | 18 (4.1%) | 0 (0.0%) |
| $500,000 to $749,999 | 0 (0.0%) | 0 (0.0%) |
| $750,000 to $999,999 | 0 (0.0%) | 0 (0.0%) |
| $1,000,000 or more | 0 (0.0%) | 0 (0.0%) |
| Total | 443 (100.0%) | 52 (100.0%) |
Household Income by Mortgage Status in Stanton
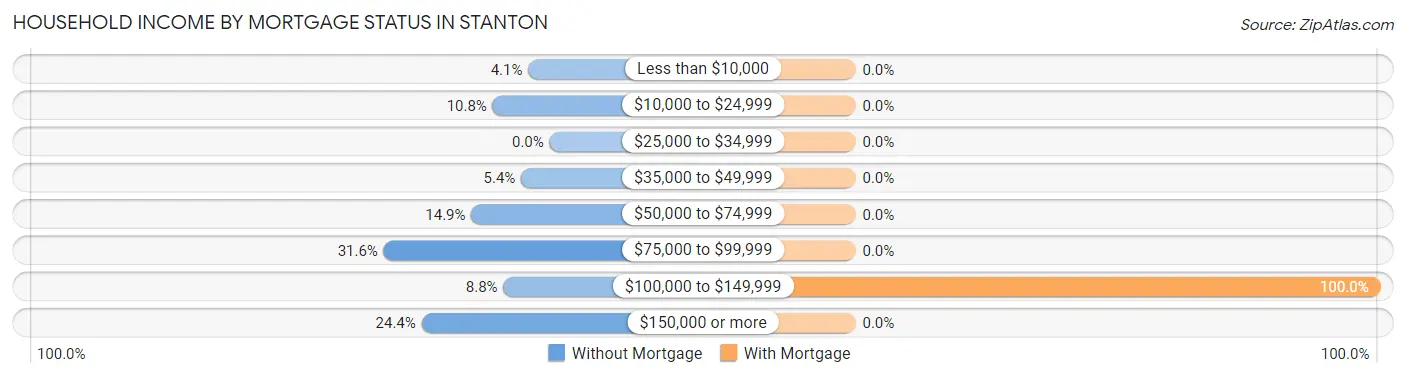
| Household Income | Without Mortgage | With Mortgage |
| Less than $10,000 | 18 (4.1%) | 0 (0.0%) |
| $10,000 to $24,999 | 48 (10.8%) | 0 (0.0%) |
| $25,000 to $34,999 | 0 (0.0%) | 0 (0.0%) |
| $35,000 to $49,999 | 24 (5.4%) | 0 (0.0%) |
| $50,000 to $74,999 | 66 (14.9%) | 0 (0.0%) |
| $75,000 to $99,999 | 140 (31.6%) | 0 (0.0%) |
| $100,000 to $149,999 | 39 (8.8%) | 52 (100.0%) |
| $150,000 or more | 108 (24.4%) | 0 (0.0%) |
| Total | 443 (100.0%) | 52 (100.0%) |
Property Value to Household Income Ratio in Stanton
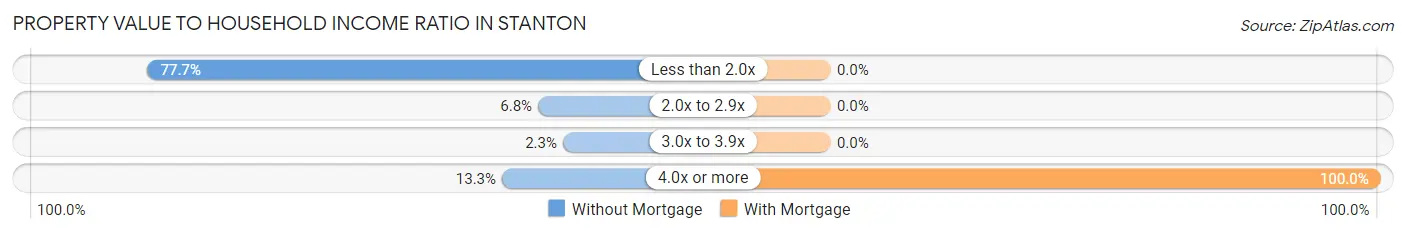
| Value-to-Income Ratio | Without Mortgage | With Mortgage |
| Less than 2.0x | 344 (77.6%) | 0 (0.0%) |
| 2.0x to 2.9x | 30 (6.8%) | 0 (0.0%) |
| 3.0x to 3.9x | 10 (2.3%) | 0 (0.0%) |
| 4.0x or more | 59 (13.3%) | 52 (100.0%) |
| Total | 443 (100.0%) | 52 (100.0%) |
Real Estate Taxes by Mortgage Status in Stanton
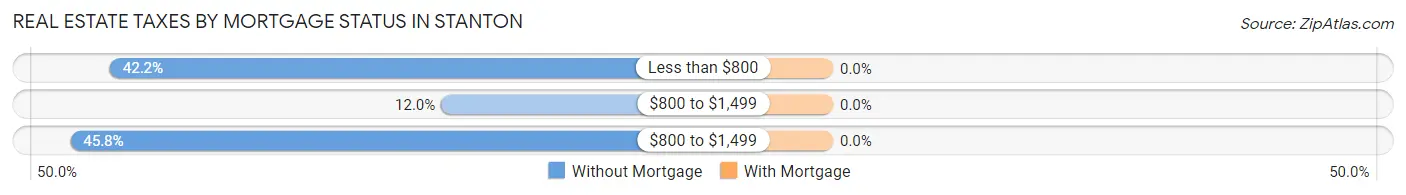
| Property Taxes | Without Mortgage | With Mortgage |
| Less than $800 | 187 (42.2%) | 0 (0.0%) |
| $800 to $1,499 | 53 (12.0%) | 0 (0.0%) |
| $800 to $1,499 | 203 (45.8%) | 0 (0.0%) |
| Total | 443 (100.0%) | 52 (100.0%) |
Health & Disability in Stanton
Health Insurance Coverage by Age in Stanton
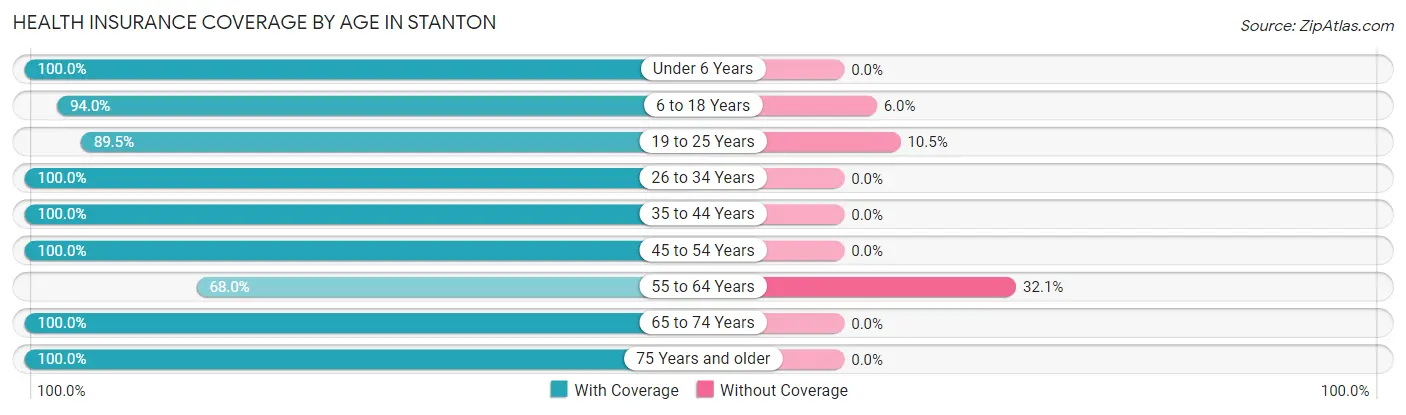
| Age Bracket | With Coverage | Without Coverage |
| Under 6 Years | 235 (100.0%) | 0 (0.0%) |
| 6 to 18 Years | 591 (94.0%) | 38 (6.0%) |
| 19 to 25 Years | 410 (89.5%) | 48 (10.5%) |
| 26 to 34 Years | 190 (100.0%) | 0 (0.0%) |
| 35 to 44 Years | 367 (100.0%) | 0 (0.0%) |
| 45 to 54 Years | 165 (100.0%) | 0 (0.0%) |
| 55 to 64 Years | 248 (67.9%) | 117 (32.1%) |
| 65 to 74 Years | 69 (100.0%) | 0 (0.0%) |
| 75 Years and older | 131 (100.0%) | 0 (0.0%) |
| Total | 2,406 (92.2%) | 203 (7.8%) |
Health Insurance Coverage by Citizenship Status in Stanton
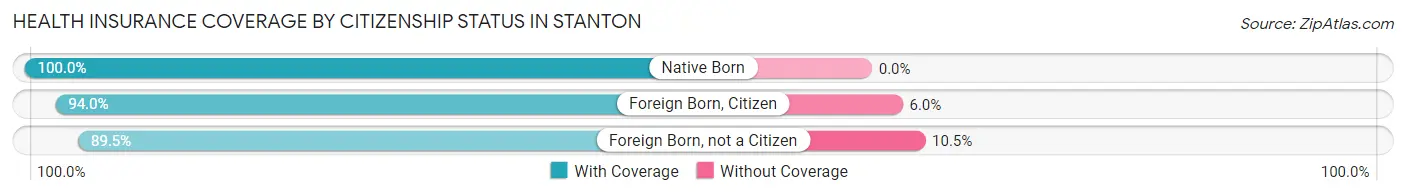
| Citizenship Status | With Coverage | Without Coverage |
| Native Born | 235 (100.0%) | 0 (0.0%) |
| Foreign Born, Citizen | 591 (94.0%) | 38 (6.0%) |
| Foreign Born, not a Citizen | 410 (89.5%) | 48 (10.5%) |
Health Insurance Coverage by Household Income in Stanton
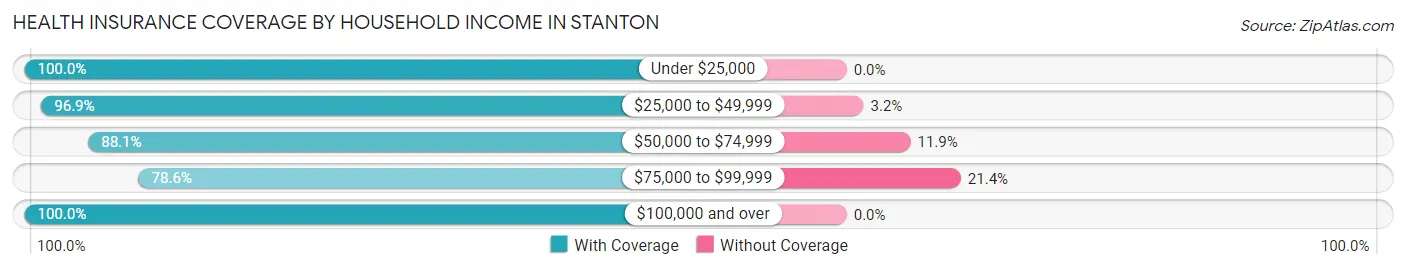
| Household Income | With Coverage | Without Coverage |
| Under $25,000 | 181 (100.0%) | 0 (0.0%) |
| $25,000 to $49,999 | 430 (96.9%) | 14 (3.2%) |
| $50,000 to $74,999 | 686 (88.1%) | 93 (11.9%) |
| $75,000 to $99,999 | 353 (78.6%) | 96 (21.4%) |
| $100,000 and over | 756 (100.0%) | 0 (0.0%) |
Public vs Private Health Insurance Coverage by Age in Stanton
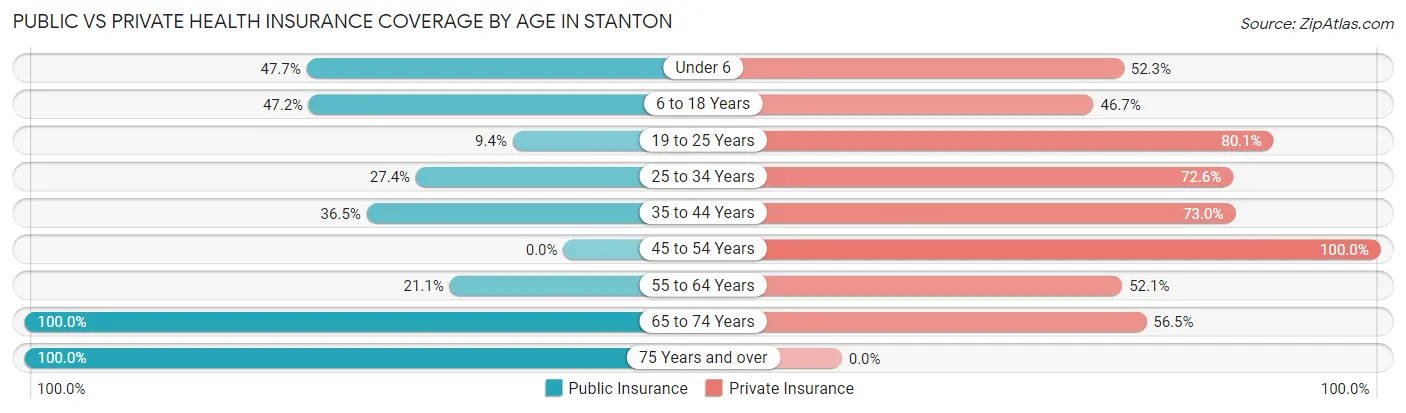
| Age Bracket | Public Insurance | Private Insurance |
| Under 6 | 112 (47.7%) | 123 (52.3%) |
| 6 to 18 Years | 297 (47.2%) | 294 (46.7%) |
| 19 to 25 Years | 43 (9.4%) | 367 (80.1%) |
| 25 to 34 Years | 52 (27.4%) | 138 (72.6%) |
| 35 to 44 Years | 134 (36.5%) | 268 (73.0%) |
| 45 to 54 Years | 0 (0.0%) | 165 (100.0%) |
| 55 to 64 Years | 77 (21.1%) | 190 (52.0%) |
| 65 to 74 Years | 69 (100.0%) | 39 (56.5%) |
| 75 Years and over | 131 (100.0%) | 0 (0.0%) |
| Total | 915 (35.1%) | 1,584 (60.7%) |
Disability Status by Sex by Age in Stanton
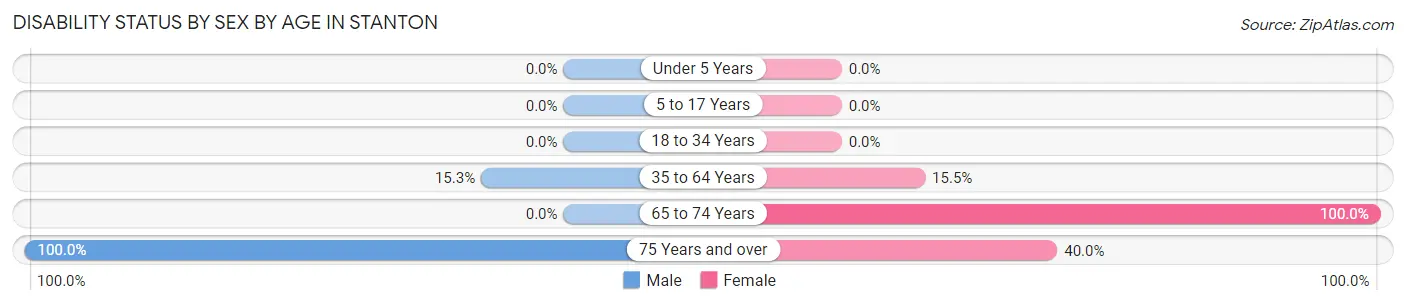
| Age Bracket | Male | Female |
| Under 5 Years | 0 (0.0%) | 0 (0.0%) |
| 5 to 17 Years | 0 (0.0%) | 0 (0.0%) |
| 18 to 34 Years | 0 (0.0%) | 0 (0.0%) |
| 35 to 64 Years | 65 (15.3%) | 73 (15.5%) |
| 65 to 74 Years | 0 (0.0%) | 30 (100.0%) |
| 75 Years and over | 61 (100.0%) | 28 (40.0%) |
Disability Class by Sex by Age in Stanton
Disability Class: Hearing Difficulty
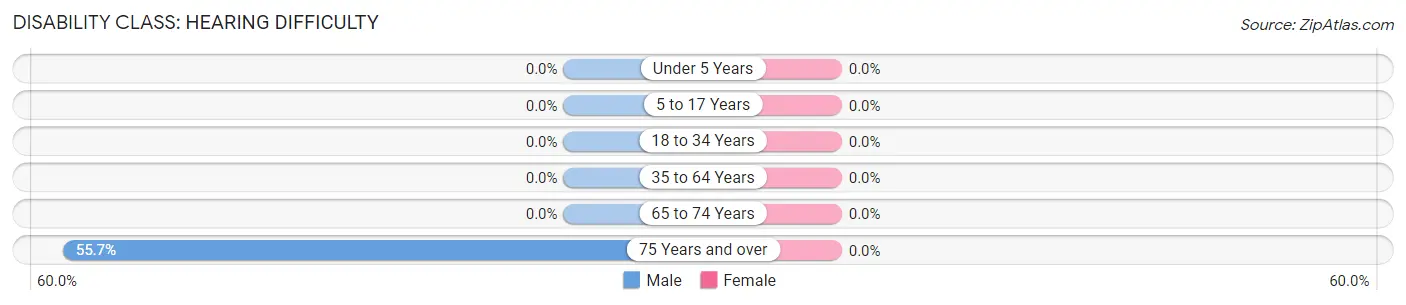
| Age Bracket | Male | Female |
| Under 5 Years | 0 (0.0%) | 0 (0.0%) |
| 5 to 17 Years | 0 (0.0%) | 0 (0.0%) |
| 18 to 34 Years | 0 (0.0%) | 0 (0.0%) |
| 35 to 64 Years | 0 (0.0%) | 0 (0.0%) |
| 65 to 74 Years | 0 (0.0%) | 0 (0.0%) |
| 75 Years and over | 34 (55.7%) | 0 (0.0%) |
Disability Class: Vision Difficulty
| Age Bracket | Male | Female |
| Under 5 Years | 0 (0.0%) | 0 (0.0%) |
| 5 to 17 Years | 0 (0.0%) | 0 (0.0%) |
| 18 to 34 Years | 0 (0.0%) | 0 (0.0%) |
| 35 to 64 Years | 0 (0.0%) | 0 (0.0%) |
| 65 to 74 Years | 0 (0.0%) | 0 (0.0%) |
| 75 Years and over | 0 (0.0%) | 0 (0.0%) |
Disability Class: Cognitive Difficulty
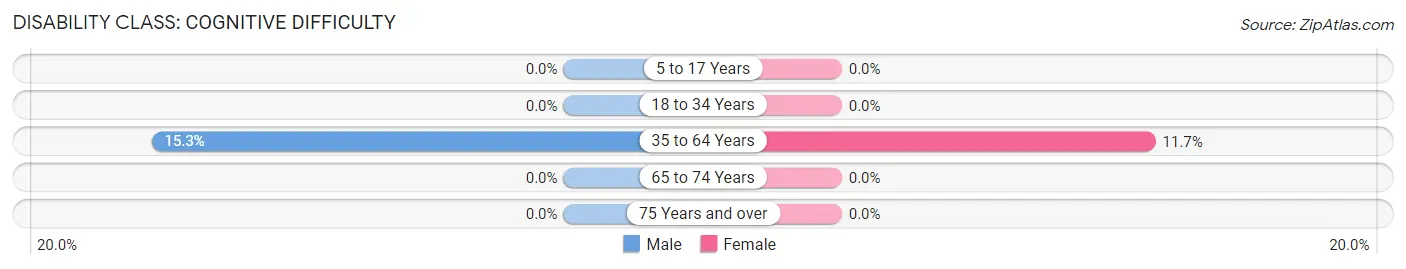
| Age Bracket | Male | Female |
| 5 to 17 Years | 0 (0.0%) | 0 (0.0%) |
| 18 to 34 Years | 0 (0.0%) | 0 (0.0%) |
| 35 to 64 Years | 65 (15.3%) | 55 (11.7%) |
| 65 to 74 Years | 0 (0.0%) | 0 (0.0%) |
| 75 Years and over | 0 (0.0%) | 0 (0.0%) |
Disability Class: Ambulatory Difficulty
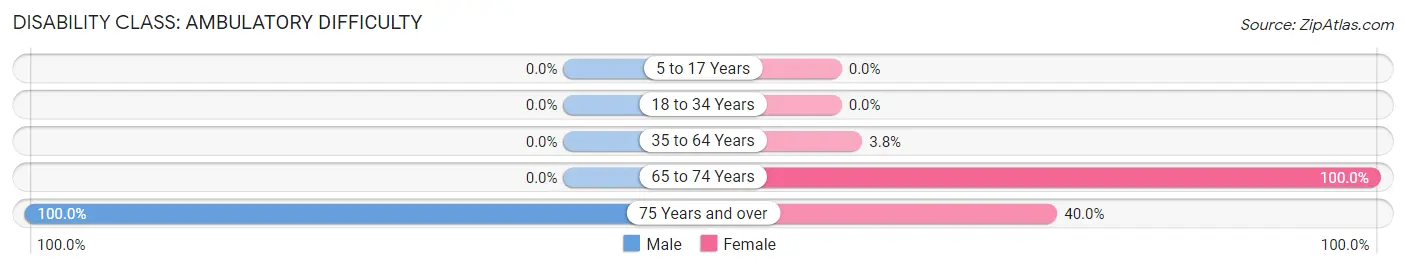
| Age Bracket | Male | Female |
| 5 to 17 Years | 0 (0.0%) | 0 (0.0%) |
| 18 to 34 Years | 0 (0.0%) | 0 (0.0%) |
| 35 to 64 Years | 0 (0.0%) | 18 (3.8%) |
| 65 to 74 Years | 0 (0.0%) | 30 (100.0%) |
| 75 Years and over | 61 (100.0%) | 28 (40.0%) |
Disability Class: Self-Care Difficulty
| Age Bracket | Male | Female |
| 5 to 17 Years | 0 (0.0%) | 0 (0.0%) |
| 18 to 34 Years | 0 (0.0%) | 0 (0.0%) |
| 35 to 64 Years | 0 (0.0%) | 0 (0.0%) |
| 65 to 74 Years | 0 (0.0%) | 0 (0.0%) |
| 75 Years and over | 0 (0.0%) | 0 (0.0%) |
Technology Access in Stanton
Computing Device Access in Stanton
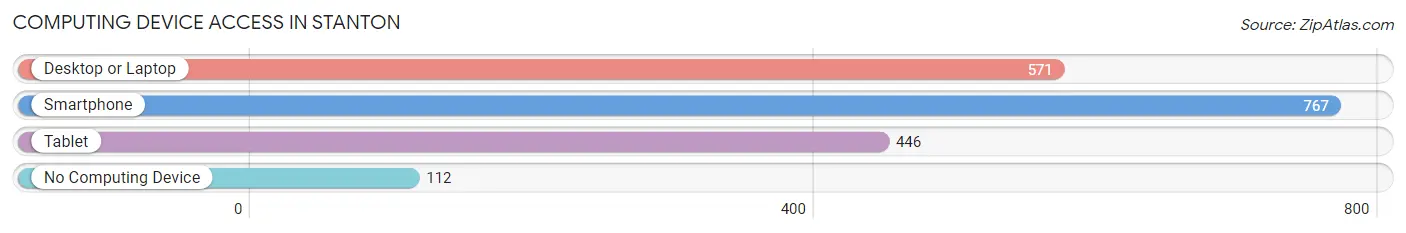
| Device Type | # Households | % Households |
| Desktop or Laptop | 571 | 58.6% |
| Smartphone | 767 | 78.7% |
| Tablet | 446 | 45.8% |
| No Computing Device | 112 | 11.5% |
| Total | 974 | 100.0% |
Internet Access in Stanton
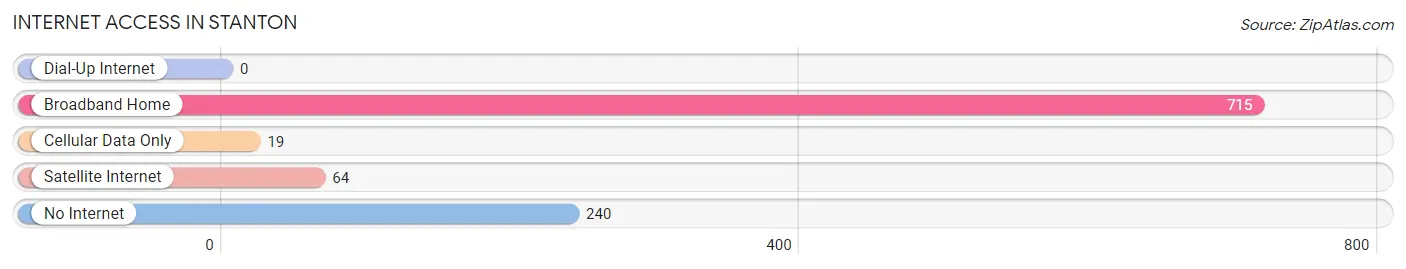
| Internet Type | # Households | % Households |
| Dial-Up Internet | 0 | 0.0% |
| Broadband Home | 715 | 73.4% |
| Cellular Data Only | 19 | 1.9% |
| Satellite Internet | 64 | 6.6% |
| No Internet | 240 | 24.6% |
| Total | 974 | 100.0% |
Stanton Summary
Stanton is a small city located in Martin County, Texas, United States. It is the county seat of Martin County and is located in the heart of the Texas South Plains. The population of Stanton was 2,845 at the 2010 census.
History
Stanton was founded in 1881 by the Texas and Pacific Railway. The town was named after Edwin Stanton, the Secretary of War under President Abraham Lincoln. The town was incorporated in 1883 and was the first town in Martin County.
Stanton was a major center of the cotton industry in the early 20th century. The town was home to several cotton gins and cottonseed oil mills. The town also had a large number of cotton warehouses and cotton compressors.
Geography
Stanton is located at the intersection of U.S. Route 87 and State Highway 137 in Martin County. The city is situated in the Texas South Plains region, which is characterized by flat terrain and sandy soils. The city is located approximately 25 miles south of Lubbock and approximately 50 miles north of Midland.
The climate in Stanton is semi-arid, with hot summers and mild winters. The average annual temperature is 64°F, and the average annual precipitation is 17.5 inches.
Economy
The economy of Stanton is largely based on agriculture. The city is home to several cotton gins and cottonseed oil mills, as well as a number of other agricultural businesses. The city is also home to several manufacturing companies, including a plastics plant and a metal fabrication plant.
The city is also home to a number of retail businesses, including several restaurants, a grocery store, and a variety of other shops.
Demographics
As of the 2010 census, the population of Stanton was 2,845. The racial makeup of the city was 79.3% White, 0.7% African American, 0.3% Native American, 0.2% Asian, 0.1% Pacific Islander, 17.7% from other races, and 1.9% from two or more races. Hispanic or Latino of any race were 37.2% of the population.
The median income for a household in the city was $30,938, and the median income for a family was $35,938. The per capita income for the city was $15,938. About 18.2% of families and 22.2% of the population were below the poverty line, including 28.2% of those under age 18 and 16.2% of those age 65 or over.
Common Questions
What is Per Capita Income in Stanton?
Per Capita income in Stanton is $32,520.
What is the Median Family Income in Stanton?
Median Family Income in Stanton is $59,989.
What is the Median Household income in Stanton?
Median Household Income in Stanton is $70,543.
What is Income or Wage Gap in Stanton?
Income or Wage Gap in Stanton is 40.5%.
Women in Stanton earn 59.5 cents for every dollar earned by a man.
What is Inequality or Gini Index in Stanton?
Inequality or Gini Index in Stanton is 0.40.
What is the Total Population of Stanton?
Total Population of Stanton is 2,667.
What is the Total Male Population of Stanton?
Total Male Population of Stanton is 1,442.
What is the Total Female Population of Stanton?
Total Female Population of Stanton is 1,225.
What is the Ratio of Males per 100 Females in Stanton?
There are 117.71 Males per 100 Females in Stanton.
What is the Ratio of Females per 100 Males in Stanton?
There are 84.95 Females per 100 Males in Stanton.
What is the Median Population Age in Stanton?
Median Population Age in Stanton is 29.0 Years.
What is the Average Family Size in Stanton
Average Family Size in Stanton is 3.0 People.
What is the Average Household Size in Stanton
Average Household Size in Stanton is 2.7 People.
How Large is the Labor Force in Stanton?
There are 1,260 People in the Labor Forcein in Stanton.
What is the Percentage of People in the Labor Force in Stanton?
69.0% of People are in the Labor Force in Stanton.
What is the Unemployment Rate in Stanton?
Unemployment Rate in Stanton is 12.4%.