Springtown, TX Map & Demographics
Springtown Map
Springtown Overview
$28,708
PER CAPITA INCOME
$76,053
AVG FAMILY INCOME
$69,500
AVG HOUSEHOLD INCOME
29.1%
WAGE / INCOME GAP [ % ]
70.9¢/ $1
WAGE / INCOME GAP [ $ ]
$10,704
FAMILY INCOME DEFICIT
0.39
INEQUALITY / GINI INDEX
3,232
TOTAL POPULATION
1,535
MALE POPULATION
1,697
FEMALE POPULATION
90.45
MALES / 100 FEMALES
110.55
FEMALES / 100 MALES
31.1
MEDIAN AGE
3.2
AVG FAMILY SIZE
2.9
AVG HOUSEHOLD SIZE
1,743
LABOR FORCE [ PEOPLE ]
67.5%
PERCENT IN LABOR FORCE
2.8%
UNEMPLOYMENT RATE
Springtown Zip Codes
Income in Springtown
Income Overview in Springtown
Per Capita Income in Springtown is $28,708, while median incomes of families and households are $76,053 and $69,500 respectively.
| Characteristic | Number | Measure |
| Per Capita Income | 3,232 | $28,708 |
| Median Family Income | 822 | $76,053 |
| Mean Family Income | 822 | $85,092 |
| Median Household Income | 1,116 | $69,500 |
| Mean Household Income | 1,116 | $77,166 |
| Income Deficit | 822 | $10,704 |
| Wage / Income Gap (%) | 3,232 | 29.10% |
| Wage / Income Gap ($) | 3,232 | 70.90¢ per $1 |
| Gini / Inequality Index | 3,232 | 0.39 |
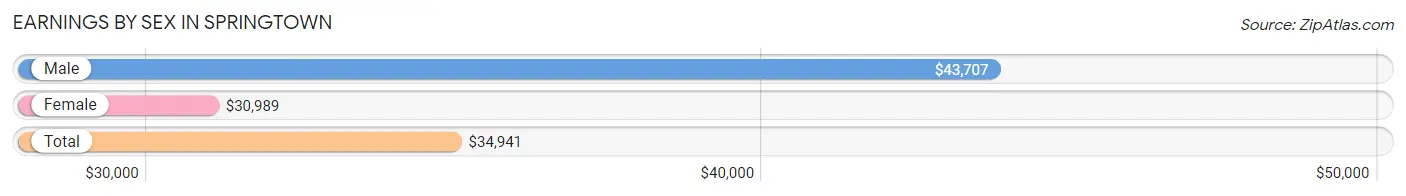
Earnings by Sex in Springtown
Average Earnings in Springtown are $34,941, $43,707 for men and $30,989 for women, a difference of 29.1%.
| Sex | Number | Average Earnings |
| Male | 998 (56.3%) | $43,707 |
| Female | 775 (43.7%) | $30,989 |
| Total | 1,773 (100.0%) | $34,941 |
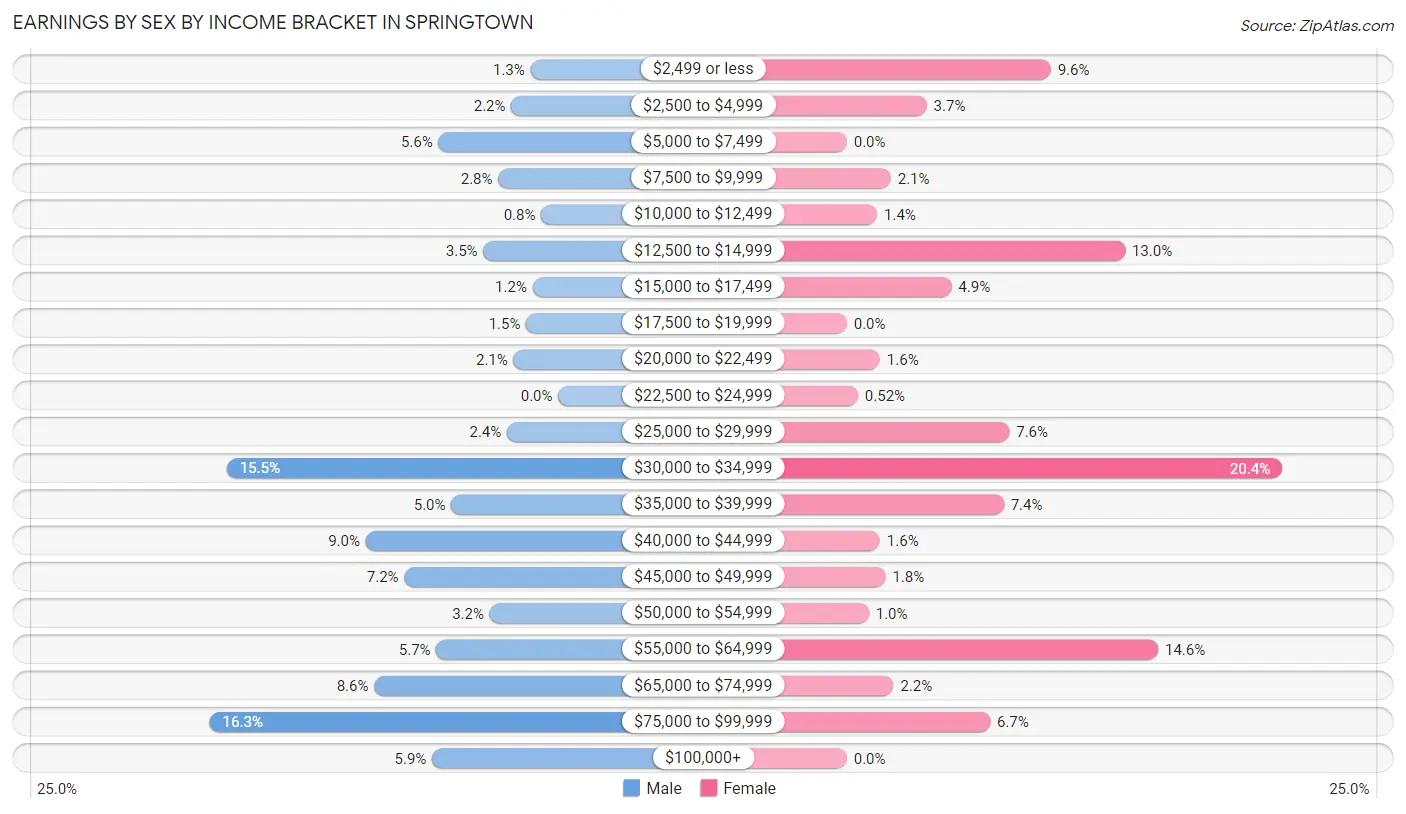
Earnings by Sex by Income Bracket in Springtown
The most common earnings brackets in Springtown are $75,000 to $99,999 for men (163 | 16.3%) and $30,000 to $34,999 for women (158 | 20.4%).
| Income | Male | Female |
| $2,499 or less | 13 (1.3%) | 74 (9.6%) |
| $2,500 to $4,999 | 22 (2.2%) | 29 (3.7%) |
| $5,000 to $7,499 | 56 (5.6%) | 0 (0.0%) |
| $7,500 to $9,999 | 28 (2.8%) | 16 (2.1%) |
| $10,000 to $12,499 | 8 (0.8%) | 11 (1.4%) |
| $12,500 to $14,999 | 35 (3.5%) | 101 (13.0%) |
| $15,000 to $17,499 | 12 (1.2%) | 38 (4.9%) |
| $17,500 to $19,999 | 15 (1.5%) | 0 (0.0%) |
| $20,000 to $22,499 | 21 (2.1%) | 12 (1.5%) |
| $22,500 to $24,999 | 0 (0.0%) | 4 (0.5%) |
| $25,000 to $29,999 | 24 (2.4%) | 59 (7.6%) |
| $30,000 to $34,999 | 155 (15.5%) | 158 (20.4%) |
| $35,000 to $39,999 | 50 (5.0%) | 57 (7.3%) |
| $40,000 to $44,999 | 90 (9.0%) | 12 (1.5%) |
| $45,000 to $49,999 | 72 (7.2%) | 14 (1.8%) |
| $50,000 to $54,999 | 32 (3.2%) | 8 (1.0%) |
| $55,000 to $64,999 | 57 (5.7%) | 113 (14.6%) |
| $65,000 to $74,999 | 86 (8.6%) | 17 (2.2%) |
| $75,000 to $99,999 | 163 (16.3%) | 52 (6.7%) |
| $100,000+ | 59 (5.9%) | 0 (0.0%) |
| Total | 998 (100.0%) | 775 (100.0%) |
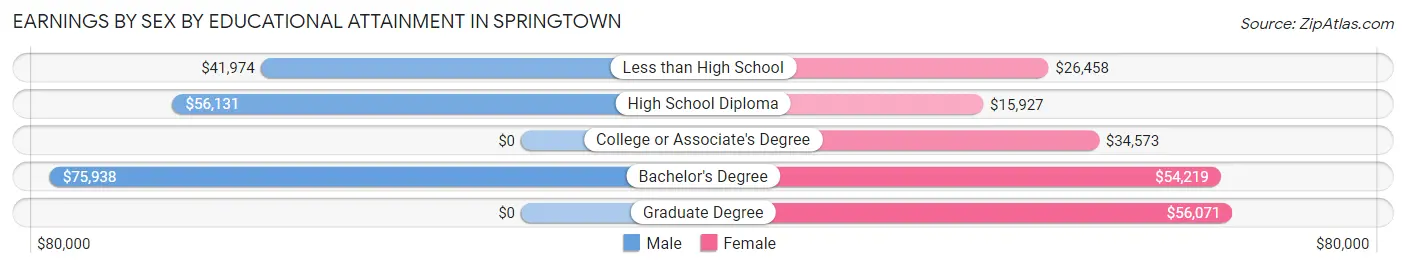
Earnings by Sex by Educational Attainment in Springtown
Average earnings in Springtown are $49,348 for men and $34,557 for women, a difference of 30.0%. Men with an educational attainment of bachelor's degree enjoy the highest average annual earnings of $75,938, while those with less than high school education earn the least with $41,974. Women with an educational attainment of graduate degree earn the most with the average annual earnings of $56,071, while those with high school diploma education have the smallest earnings of $15,927.
| Educational Attainment | Male Income | Female Income |
| Less than High School | $41,974 | $26,458 |
| High School Diploma | $56,131 | $15,927 |
| College or Associate's Degree | - | - |
| Bachelor's Degree | $75,938 | $54,219 |
| Graduate Degree | - | - |
| Total | $49,348 | $34,557 |
Family Income in Springtown
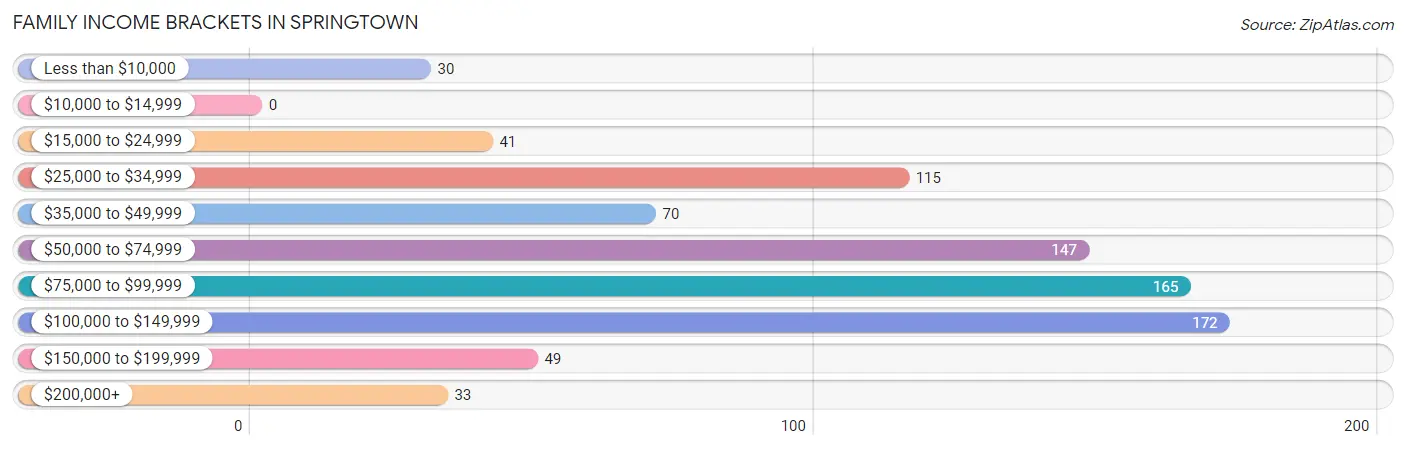
Family Income Brackets in Springtown
According to the Springtown family income data, there are 172 families falling into the $100,000 to $149,999 income range, which is the most common income bracket and makes up 20.9% of all families.
| Income Bracket | # Families | % Families |
| Less than $10,000 | 30 | 3.6% |
| $10,000 to $14,999 | 0 | 0.0% |
| $15,000 to $24,999 | 41 | 5.0% |
| $25,000 to $34,999 | 115 | 14.0% |
| $35,000 to $49,999 | 70 | 8.5% |
| $50,000 to $74,999 | 147 | 17.9% |
| $75,000 to $99,999 | 165 | 20.1% |
| $100,000 to $149,999 | 172 | 20.9% |
| $150,000 to $199,999 | 49 | 6.0% |
| $200,000+ | 33 | 4.0% |
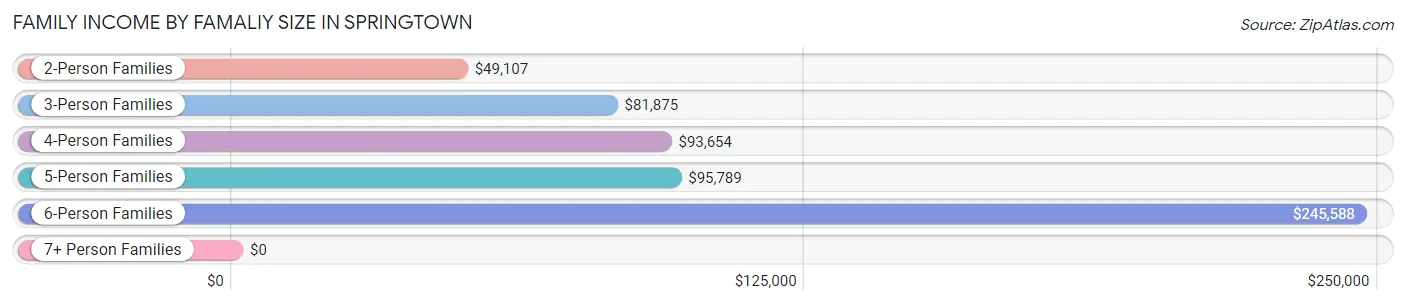
Family Income by Famaliy Size in Springtown
6-person families (36 | 4.4%) account for the highest median family income in Springtown with $245,588 per family, while 6-person families (36 | 4.4%) have the highest median income of $40,931 per family member.
| Income Bracket | # Families | Median Income |
| 2-Person Families | 416 (50.6%) | $49,107 |
| 3-Person Families | 199 (24.2%) | $81,875 |
| 4-Person Families | 124 (15.1%) | $93,654 |
| 5-Person Families | 40 (4.9%) | $95,789 |
| 6-Person Families | 36 (4.4%) | $245,588 |
| 7+ Person Families | 7 (0.9%) | $0 |
| Total | 822 (100.0%) | $76,053 |
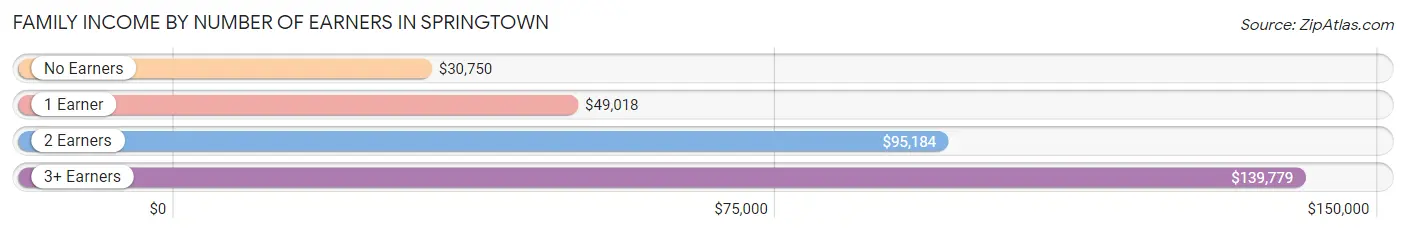
Family Income by Number of Earners in Springtown
The median family income in Springtown is $76,053, with families comprising 3+ earners (96) having the highest median family income of $139,779, while families with no earners (113) have the lowest median family income of $30,750, accounting for 11.7% and 13.8% of families, respectively.
| Number of Earners | # Families | Median Income |
| No Earners | 113 (13.8%) | $30,750 |
| 1 Earner | 318 (38.7%) | $49,018 |
| 2 Earners | 295 (35.9%) | $95,184 |
| 3+ Earners | 96 (11.7%) | $139,779 |
| Total | 822 (100.0%) | $76,053 |
Household Income in Springtown
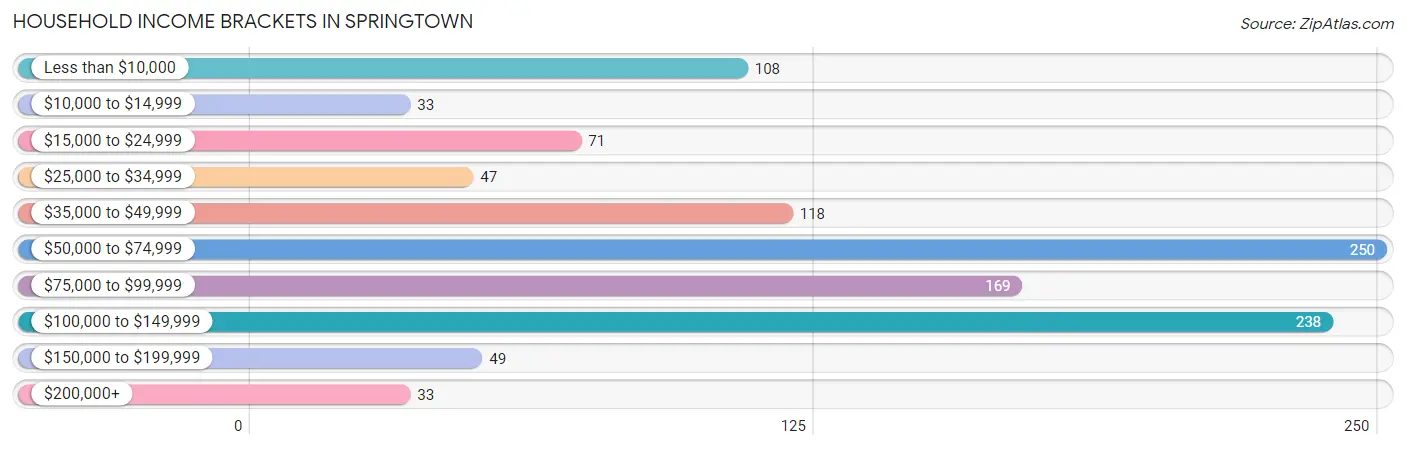
Household Income Brackets in Springtown
With 250 households falling in the category, the $50,000 to $74,999 income range is the most frequent in Springtown, accounting for 22.4% of all households. In contrast, only 33 households (3.0%) fall into the $10,000 to $14,999 income bracket, making it the least populous group.
| Income Bracket | # Households | % Households |
| Less than $10,000 | 108 | 9.7% |
| $10,000 to $14,999 | 33 | 3.0% |
| $15,000 to $24,999 | 71 | 6.4% |
| $25,000 to $34,999 | 47 | 4.2% |
| $35,000 to $49,999 | 118 | 10.6% |
| $50,000 to $74,999 | 250 | 22.4% |
| $75,000 to $99,999 | 169 | 15.1% |
| $100,000 to $149,999 | 238 | 21.3% |
| $150,000 to $199,999 | 49 | 4.4% |
| $200,000+ | 33 | 3.0% |
Household Income by Householder Age in Springtown
The median household income in Springtown is $69,500, with the highest median household income of $112,292 found in the 45 to 64 years age bracket for the primary householder. A total of 357 households (32.0%) fall into this category. Meanwhile, the 65+ years age bracket for the primary householder has the lowest median household income of $38,250, with 275 households (24.6%) in this group.
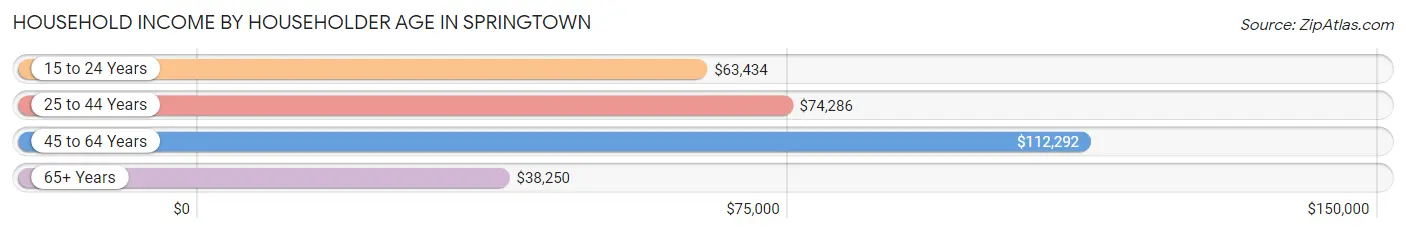
| Income Bracket | # Households | Median Income |
| 15 to 24 Years | 138 (12.4%) | $63,434 |
| 25 to 44 Years | 346 (31.0%) | $74,286 |
| 45 to 64 Years | 357 (32.0%) | $112,292 |
| 65+ Years | 275 (24.6%) | $38,250 |
| Total | 1,116 (100.0%) | $69,500 |
Poverty in Springtown
Income Below Poverty by Sex and Age in Springtown
With 6.3% poverty level for males and 14.3% for females among the residents of Springtown, 5 year old males and 12 to 14 year old females are the most vulnerable to poverty, with 4 males (100.0%) and 31 females (50.8%) in their respective age groups living below the poverty level.
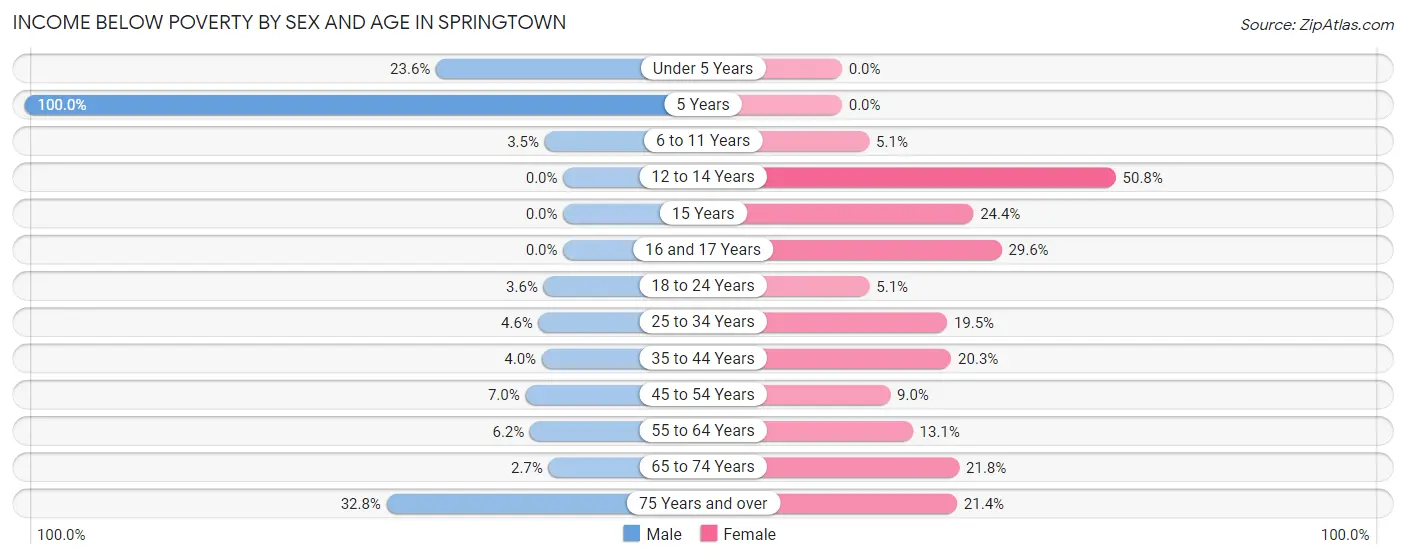
| Age Bracket | Male | Female |
| Under 5 Years | 17 (23.6%) | 0 (0.0%) |
| 5 Years | 4 (100.0%) | 0 (0.0%) |
| 6 to 11 Years | 3 (3.5%) | 6 (5.1%) |
| 12 to 14 Years | 0 (0.0%) | 31 (50.8%) |
| 15 Years | 0 (0.0%) | 10 (24.4%) |
| 16 and 17 Years | 0 (0.0%) | 8 (29.6%) |
| 18 to 24 Years | 9 (3.6%) | 14 (5.1%) |
| 25 to 34 Years | 16 (4.6%) | 41 (19.5%) |
| 35 to 44 Years | 7 (4.0%) | 40 (20.3%) |
| 45 to 54 Years | 12 (7.0%) | 14 (9.0%) |
| 55 to 64 Years | 5 (6.2%) | 23 (13.1%) |
| 65 to 74 Years | 4 (2.7%) | 27 (21.8%) |
| 75 Years and over | 20 (32.8%) | 28 (21.4%) |
| Total | 97 (6.3%) | 242 (14.3%) |
Income Above Poverty by Sex and Age in Springtown
According to the poverty statistics in Springtown, males aged 12 to 14 years and females aged under 5 years are the age groups that are most secure financially, with 100.0% of males and 100.0% of females in these age groups living above the poverty line.
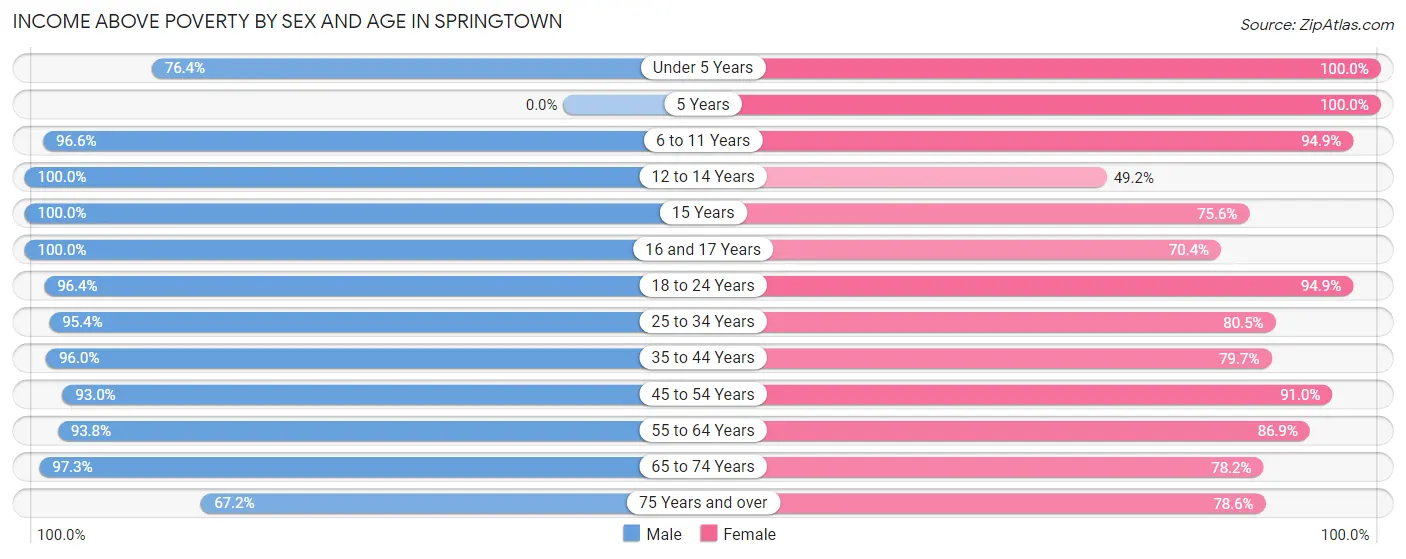
| Age Bracket | Male | Female |
| Under 5 Years | 55 (76.4%) | 168 (100.0%) |
| 5 Years | 0 (0.0%) | 15 (100.0%) |
| 6 to 11 Years | 84 (96.6%) | 112 (94.9%) |
| 12 to 14 Years | 71 (100.0%) | 30 (49.2%) |
| 15 Years | 7 (100.0%) | 31 (75.6%) |
| 16 and 17 Years | 57 (100.0%) | 19 (70.4%) |
| 18 to 24 Years | 238 (96.4%) | 260 (94.9%) |
| 25 to 34 Years | 333 (95.4%) | 169 (80.5%) |
| 35 to 44 Years | 169 (96.0%) | 157 (79.7%) |
| 45 to 54 Years | 159 (93.0%) | 142 (91.0%) |
| 55 to 64 Years | 76 (93.8%) | 152 (86.9%) |
| 65 to 74 Years | 142 (97.3%) | 97 (78.2%) |
| 75 Years and over | 41 (67.2%) | 103 (78.6%) |
| Total | 1,432 (93.7%) | 1,455 (85.7%) |
Income Below Poverty Among Married-Couple Families in Springtown
The poverty statistics for married-couple families in Springtown show that 8.2% or 41 of the total 499 families live below the poverty line. Families with no children have the highest poverty rate of 13.8%, comprising of 35 families. On the other hand, families with 3 or 4 children have the lowest poverty rate of 0.0%, which includes 0 families.
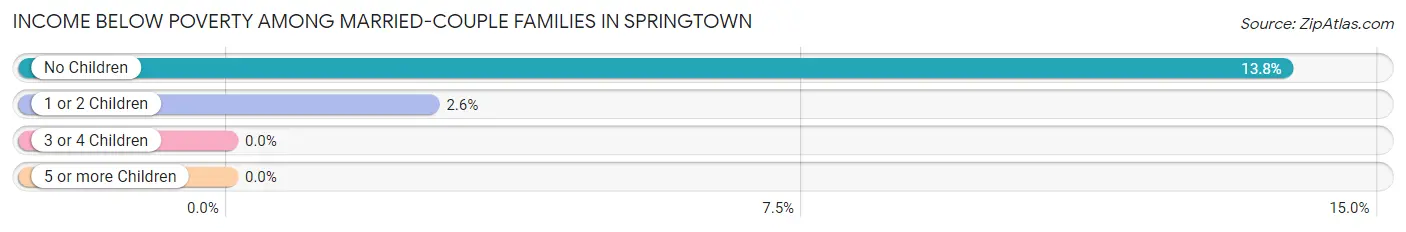
| Children | Above Poverty | Below Poverty |
| No Children | 219 (86.2%) | 35 (13.8%) |
| 1 or 2 Children | 222 (97.4%) | 6 (2.6%) |
| 3 or 4 Children | 17 (100.0%) | 0 (0.0%) |
| 5 or more Children | 0 (0.0%) | 0 (0.0%) |
| Total | 458 (91.8%) | 41 (8.2%) |
Income Below Poverty Among Single-Parent Households in Springtown
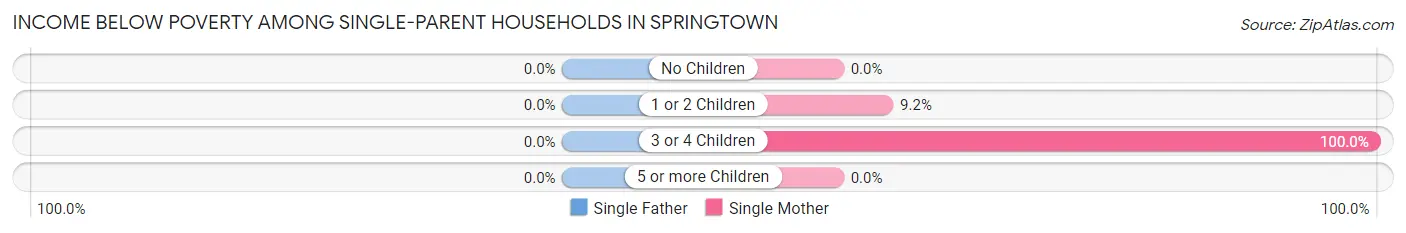
| Children | Single Father | Single Mother |
| No Children | 0 (0.0%) | 0 (0.0%) |
| 1 or 2 Children | 0 (0.0%) | 20 (9.2%) |
| 3 or 4 Children | 0 (0.0%) | 6 (100.0%) |
| 5 or more Children | 0 (0.0%) | 0 (0.0%) |
| Total | 0 (0.0%) | 26 (10.9%) |
Income Below Poverty Among Married-Couple vs Single-Parent Households in Springtown
The poverty data for Springtown shows that 41 of the married-couple family households (8.2%) and 26 of the single-parent households (8.1%) are living below the poverty level. Within the married-couple family households, those with no children have the highest poverty rate, with 35 households (13.8%) falling below the poverty line. Among the single-parent households, those with 3 or 4 children have the highest poverty rate, with 6 household (100.0%) living below poverty.
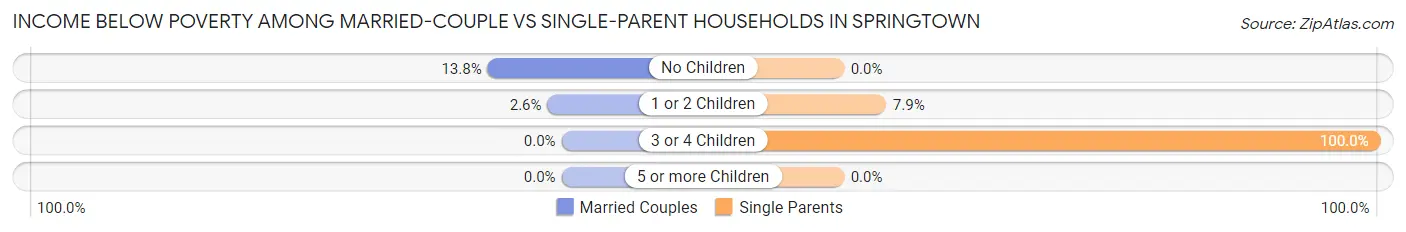
| Children | Married-Couple Families | Single-Parent Households |
| No Children | 35 (13.8%) | 0 (0.0%) |
| 1 or 2 Children | 6 (2.6%) | 20 (7.9%) |
| 3 or 4 Children | 0 (0.0%) | 6 (100.0%) |
| 5 or more Children | 0 (0.0%) | 0 (0.0%) |
| Total | 41 (8.2%) | 26 (8.1%) |
Race in Springtown
The most populous races in Springtown are White / Caucasian (2,811 | 87.0%), Two or more Races (352 | 10.9%), and Hispanic or Latino (260 | 8.0%).
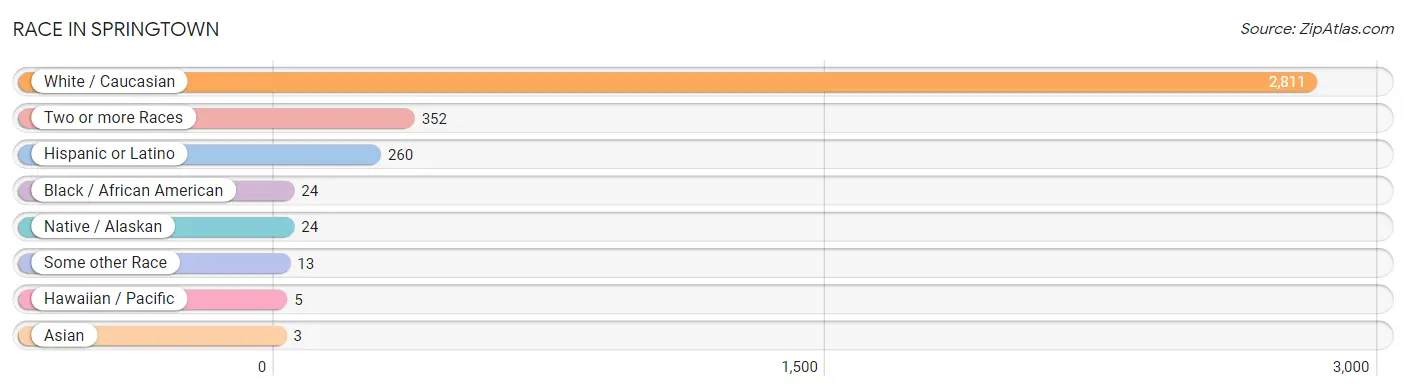
| Race | # Population | % Population |
| Asian | 3 | 0.1% |
| Black / African American | 24 | 0.7% |
| Hawaiian / Pacific | 5 | 0.2% |
| Hispanic or Latino | 260 | 8.0% |
| Native / Alaskan | 24 | 0.7% |
| White / Caucasian | 2,811 | 87.0% |
| Two or more Races | 352 | 10.9% |
| Some other Race | 13 | 0.4% |
| Total | 3,232 | 100.0% |
Ancestry in Springtown
The most populous ancestries reported in Springtown are German (464 | 14.4%), American (407 | 12.6%), English (378 | 11.7%), Mexican (227 | 7.0%), and Irish (217 | 6.7%), together accounting for 52.4% of all Springtown residents.
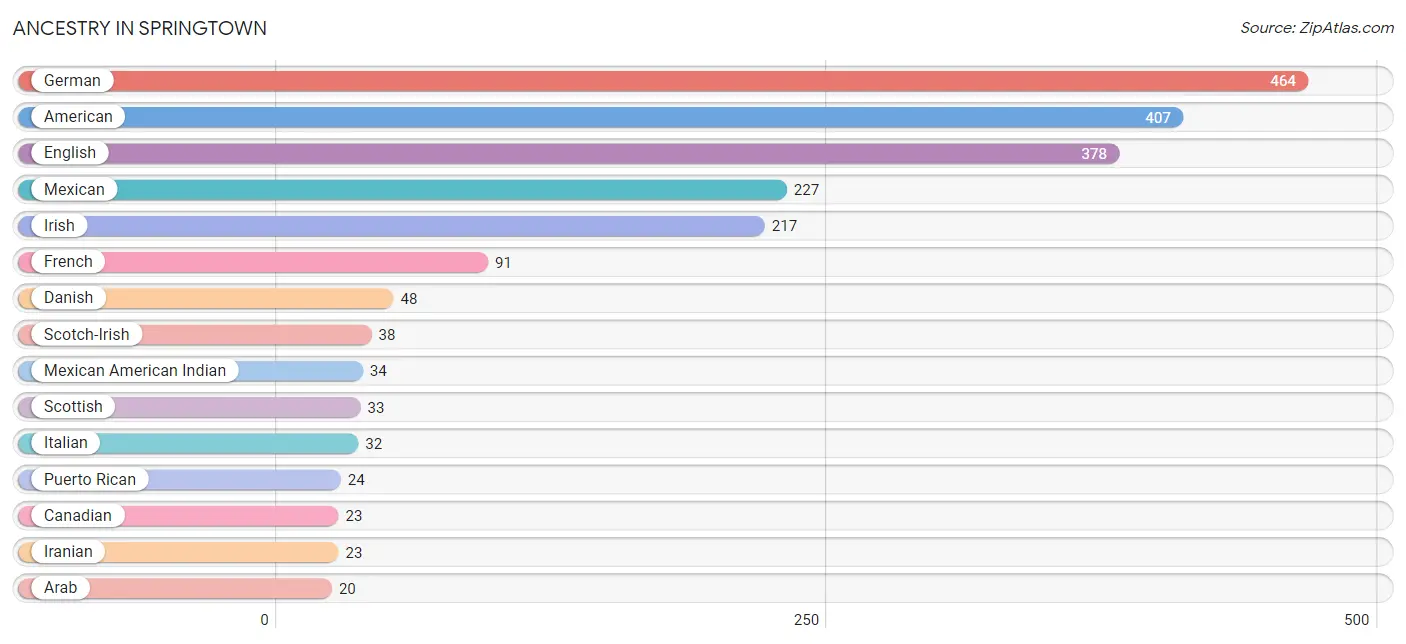
| Ancestry | # Population | % Population |
| American | 407 | 12.6% |
| Arab | 20 | 0.6% |
| Canadian | 23 | 0.7% |
| Central American Indian | 16 | 0.5% |
| Choctaw | 6 | 0.2% |
| Danish | 48 | 1.5% |
| Dutch | 17 | 0.5% |
| English | 378 | 11.7% |
| European | 16 | 0.5% |
| French | 91 | 2.8% |
| German | 464 | 14.4% |
| Guamanian / Chamorro | 3 | 0.1% |
| Hungarian | 5 | 0.2% |
| Iranian | 23 | 0.7% |
| Irish | 217 | 6.7% |
| Italian | 32 | 1.0% |
| Jordanian | 20 | 0.6% |
| Laotian | 3 | 0.1% |
| Mexican | 227 | 7.0% |
| Mexican American Indian | 34 | 1.1% |
| Native Hawaiian | 7 | 0.2% |
| Norwegian | 15 | 0.5% |
| Pennsylvania German | 6 | 0.2% |
| Polish | 9 | 0.3% |
| Pueblo | 9 | 0.3% |
| Puerto Rican | 24 | 0.7% |
| Russian | 9 | 0.3% |
| Samoan | 2 | 0.1% |
| Scandinavian | 3 | 0.1% |
| Scotch-Irish | 38 | 1.2% |
| Scottish | 33 | 1.0% |
| Sioux | 3 | 0.1% |
| Slovak | 5 | 0.2% |
| Spaniard | 9 | 0.3% |
| Swedish | 5 | 0.2% |
| Swiss | 3 | 0.1% | View All 36 Rows |
Immigrants in Springtown
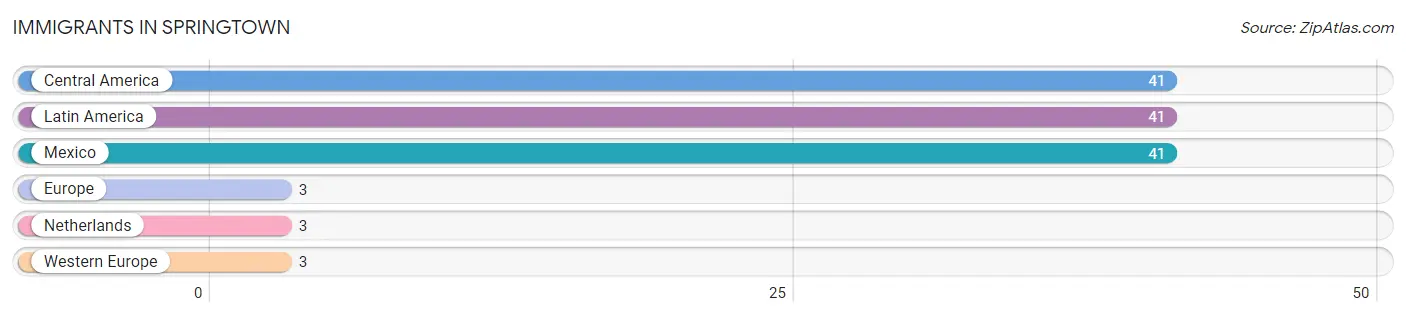
The most numerous immigrant groups reported in Springtown came from Central America (41 | 1.3%), Latin America (41 | 1.3%), Mexico (41 | 1.3%), Europe (3 | 0.1%), and Netherlands (3 | 0.1%), together accounting for 4.0% of all Springtown residents.
| Immigration Origin | # Population | % Population |
| Central America | 41 | 1.3% |
| Europe | 3 | 0.1% |
| Latin America | 41 | 1.3% |
| Mexico | 41 | 1.3% |
| Netherlands | 3 | 0.1% |
| Western Europe | 3 | 0.1% | View All 6 Rows |
Sex and Age in Springtown
Sex and Age in Springtown
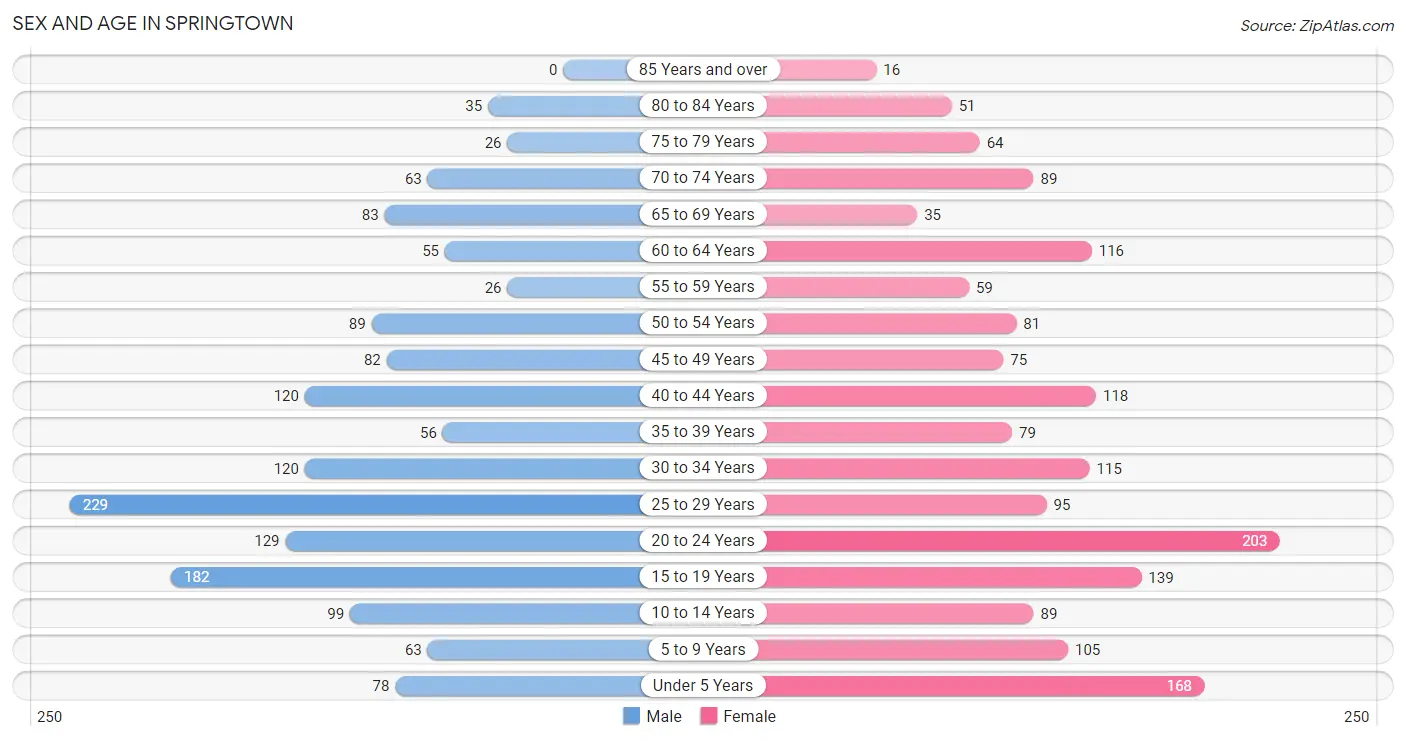
The most populous age groups in Springtown are 25 to 29 Years (229 | 14.9%) for men and 20 to 24 Years (203 | 12.0%) for women.
| Age Bracket | Male | Female |
| Under 5 Years | 78 (5.1%) | 168 (9.9%) |
| 5 to 9 Years | 63 (4.1%) | 105 (6.2%) |
| 10 to 14 Years | 99 (6.5%) | 89 (5.2%) |
| 15 to 19 Years | 182 (11.9%) | 139 (8.2%) |
| 20 to 24 Years | 129 (8.4%) | 203 (12.0%) |
| 25 to 29 Years | 229 (14.9%) | 95 (5.6%) |
| 30 to 34 Years | 120 (7.8%) | 115 (6.8%) |
| 35 to 39 Years | 56 (3.6%) | 79 (4.7%) |
| 40 to 44 Years | 120 (7.8%) | 118 (7.0%) |
| 45 to 49 Years | 82 (5.3%) | 75 (4.4%) |
| 50 to 54 Years | 89 (5.8%) | 81 (4.8%) |
| 55 to 59 Years | 26 (1.7%) | 59 (3.5%) |
| 60 to 64 Years | 55 (3.6%) | 116 (6.8%) |
| 65 to 69 Years | 83 (5.4%) | 35 (2.1%) |
| 70 to 74 Years | 63 (4.1%) | 89 (5.2%) |
| 75 to 79 Years | 26 (1.7%) | 64 (3.8%) |
| 80 to 84 Years | 35 (2.3%) | 51 (3.0%) |
| 85 Years and over | 0 (0.0%) | 16 (0.9%) |
| Total | 1,535 (100.0%) | 1,697 (100.0%) |
Families and Households in Springtown
Median Family Size in Springtown
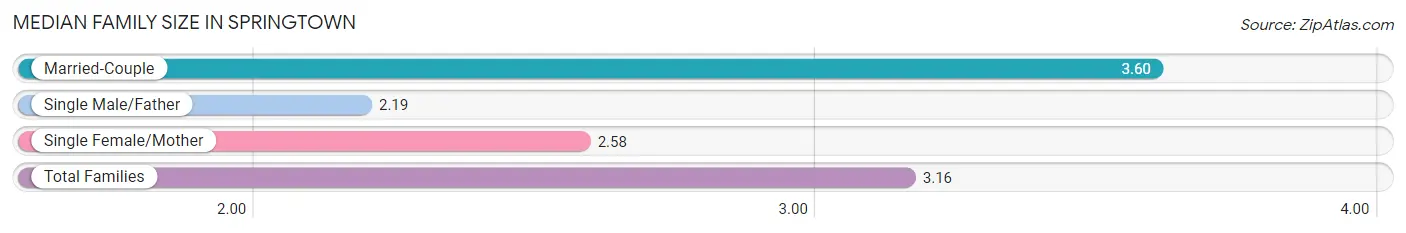
The median family size in Springtown is 3.16 persons per family, with married-couple families (499 | 60.7%) accounting for the largest median family size of 3.6 persons per family. On the other hand, single male/father families (85 | 10.3%) represent the smallest median family size with 2.19 persons per family.
| Family Type | # Families | Family Size |
| Married-Couple | 499 (60.7%) | 3.60 |
| Single Male/Father | 85 (10.3%) | 2.19 |
| Single Female/Mother | 238 (28.9%) | 2.58 |
| Total Families | 822 (100.0%) | 3.16 |
Median Household Size in Springtown
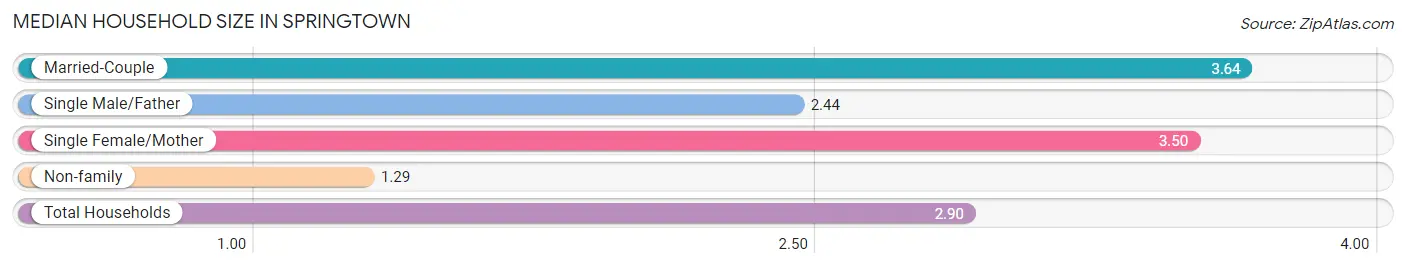
The median household size in Springtown is 2.90 persons per household, with married-couple households (499 | 44.7%) accounting for the largest median household size of 3.64 persons per household. non-family households (294 | 26.3%) represent the smallest median household size with 1.29 persons per household.
| Household Type | # Households | Household Size |
| Married-Couple | 499 (44.7%) | 3.64 |
| Single Male/Father | 85 (7.6%) | 2.44 |
| Single Female/Mother | 238 (21.3%) | 3.50 |
| Non-family | 294 (26.3%) | 1.29 |
| Total Households | 1,116 (100.0%) | 2.90 |
Household Size by Marriage Status in Springtown
Out of a total of 1,116 households in Springtown, 822 (73.7%) are family households, while 294 (26.3%) are nonfamily households. The most numerous type of family households are 3-person households, comprising 335, and the most common type of nonfamily households are 1-person households, comprising 271.
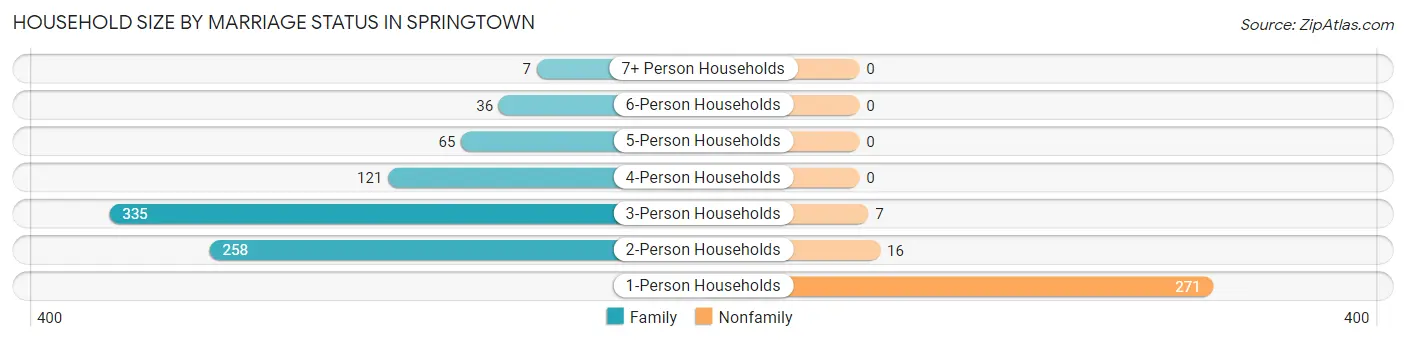
| Household Size | Family Households | Nonfamily Households |
| 1-Person Households | - | 271 (24.3%) |
| 2-Person Households | 258 (23.1%) | 16 (1.4%) |
| 3-Person Households | 335 (30.0%) | 7 (0.6%) |
| 4-Person Households | 121 (10.8%) | 0 (0.0%) |
| 5-Person Households | 65 (5.8%) | 0 (0.0%) |
| 6-Person Households | 36 (3.2%) | 0 (0.0%) |
| 7+ Person Households | 7 (0.6%) | 0 (0.0%) |
| Total | 822 (73.7%) | 294 (26.3%) |
Female Fertility in Springtown
Fertility by Age in Springtown
Average fertility rate in Springtown is 124.0 births per 1,000 women. Women in the age bracket of 20 to 34 years have the highest fertility rate with 191.0 births per 1,000 women. Women in the age bracket of 20 to 34 years acount for 74.5% of all women with births.
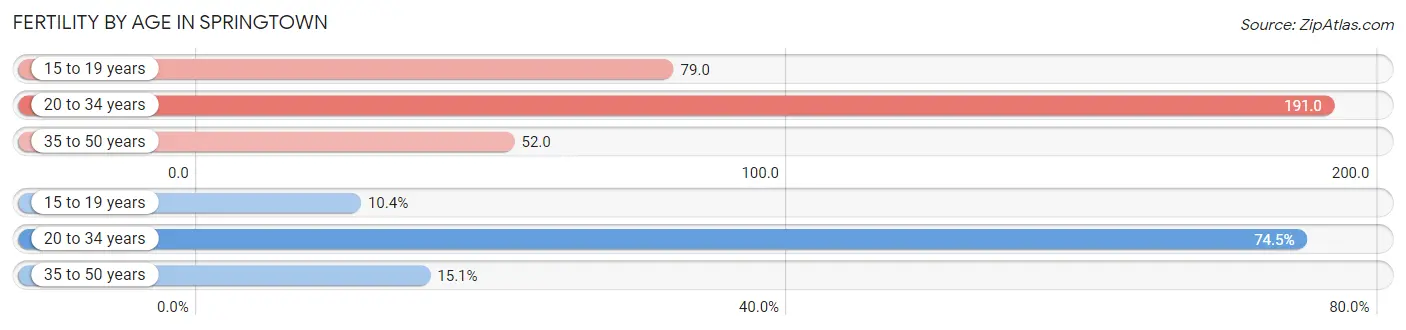
| Age Bracket | Women with Births | Births / 1,000 Women |
| 15 to 19 years | 11 (10.4%) | 79.0 |
| 20 to 34 years | 79 (74.5%) | 191.0 |
| 35 to 50 years | 16 (15.1%) | 52.0 |
| Total | 106 (100.0%) | 124.0 |
Fertility by Age by Marriage Status in Springtown
92.5% of women with births (106) in Springtown are married. The highest percentage of unmarried women with births falls into 20 to 34 years age bracket with 10.1% of them unmarried at the time of birth, while the lowest percentage of unmarried women with births belong to 15 to 19 years age bracket with 0.0% of them unmarried.
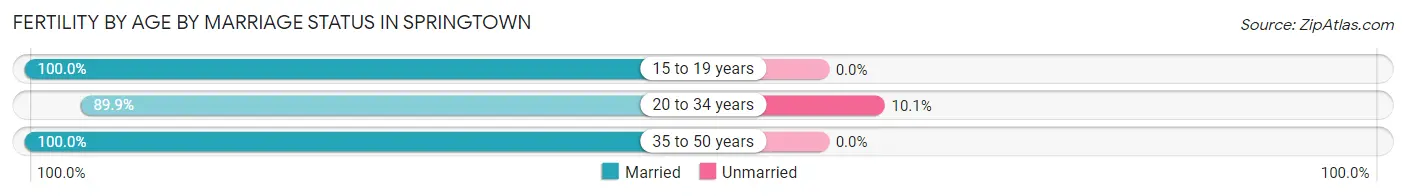
| Age Bracket | Married | Unmarried |
| 15 to 19 years | 11 (100.0%) | 0 (0.0%) |
| 20 to 34 years | 71 (89.9%) | 8 (10.1%) |
| 35 to 50 years | 16 (100.0%) | 0 (0.0%) |
| Total | 98 (92.4%) | 8 (7.5%) |
Fertility by Education in Springtown
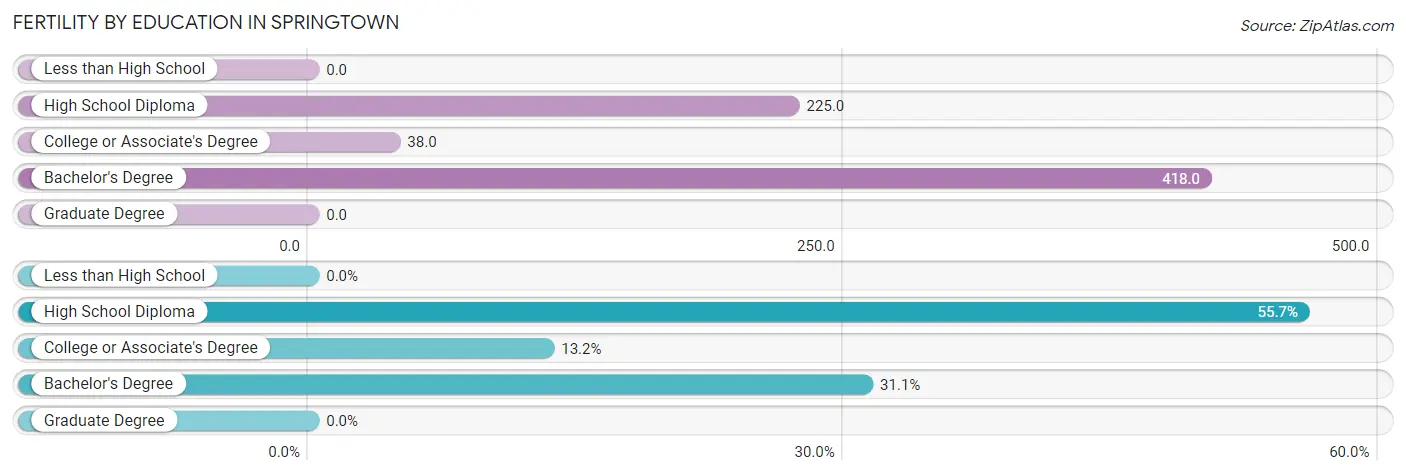
| Educational Attainment | Women with Births | Births / 1,000 Women |
| Less than High School | 0 (0.0%) | 0.0 |
| High School Diploma | 59 (55.7%) | 225.0 |
| College or Associate's Degree | 14 (13.2%) | 38.0 |
| Bachelor's Degree | 33 (31.1%) | 418.0 |
| Graduate Degree | 0 (0.0%) | 0.0 |
| Total | 106 (100.0%) | 124.0 |
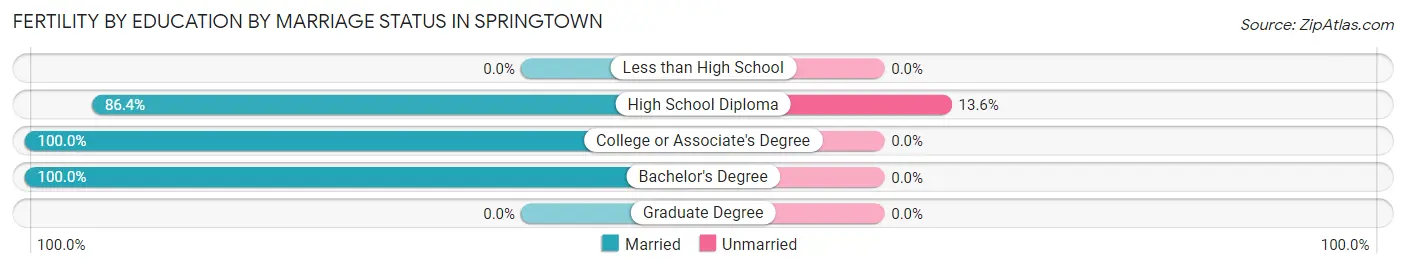
Fertility by Education by Marriage Status in Springtown
7.5% of women with births in Springtown are unmarried. Women with the educational attainment of college or associate's degree are most likely to be married with 100.0% of them married at childbirth, while women with the educational attainment of high school diploma are least likely to be married with 13.6% of them unmarried at childbirth.
| Educational Attainment | Married | Unmarried |
| Less than High School | 0 (0.0%) | 0 (0.0%) |
| High School Diploma | 51 (86.4%) | 8 (13.6%) |
| College or Associate's Degree | 14 (100.0%) | 0 (0.0%) |
| Bachelor's Degree | 33 (100.0%) | 0 (0.0%) |
| Graduate Degree | 0 (0.0%) | 0 (0.0%) |
| Total | 98 (92.4%) | 8 (7.5%) |
Employment Characteristics in Springtown
Employment by Class of Employer in Springtown
Among the 1,677 employed individuals in Springtown, private company employees (1,078 | 64.3%), local government employees (335 | 20.0%), and self-employed (not incorporated) (72 | 4.3%) make up the most common classes of employment.

| Employer Class | # Employees | % Employees |
| Private Company Employees | 1,078 | 64.3% |
| Self-Employed (Incorporated) | 42 | 2.5% |
| Self-Employed (Not Incorporated) | 72 | 4.3% |
| Not-for-profit Organizations | 30 | 1.8% |
| Local Government Employees | 335 | 20.0% |
| State Government Employees | 50 | 3.0% |
| Federal Government Employees | 59 | 3.5% |
| Unpaid Family Workers | 11 | 0.7% |
| Total | 1,677 | 100.0% |
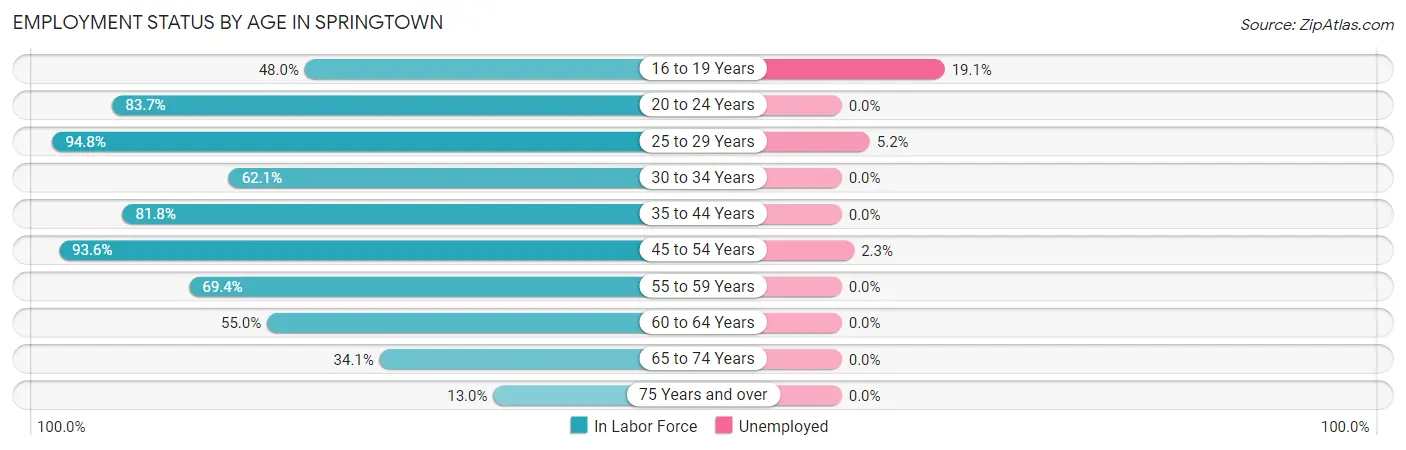
Employment Status by Age in Springtown
According to the labor force statistics for Springtown, out of the total population over 16 years of age (2,582), 67.5% or 1,743 individuals are in the labor force, with 2.8% or 49 of them unemployed. The age group with the highest labor force participation rate is 25 to 29 years, with 94.8% or 307 individuals in the labor force. Within the labor force, the 16 to 19 years age range has the highest percentage of unemployed individuals, with 19.1% or 25 of them being unemployed.
| Age Bracket | In Labor Force | Unemployed |
| 16 to 19 Years | 131 (48.0%) | 25 (19.1%) |
| 20 to 24 Years | 278 (83.7%) | 0 (0.0%) |
| 25 to 29 Years | 307 (94.8%) | 16 (5.2%) |
| 30 to 34 Years | 146 (62.1%) | 0 (0.0%) |
| 35 to 44 Years | 305 (81.8%) | 0 (0.0%) |
| 45 to 54 Years | 306 (93.6%) | 7 (2.3%) |
| 55 to 59 Years | 59 (69.4%) | 0 (0.0%) |
| 60 to 64 Years | 94 (55.0%) | 0 (0.0%) |
| 65 to 74 Years | 92 (34.1%) | 0 (0.0%) |
| 75 Years and over | 25 (13.0%) | 0 (0.0%) |
| Total | 1,743 (67.5%) | 49 (2.8%) |
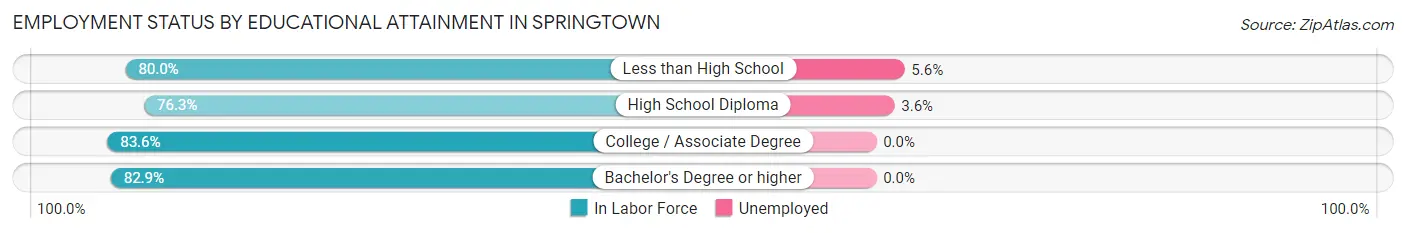
Employment Status by Educational Attainment in Springtown
According to labor force statistics for Springtown, 80.3% of individuals (1,217) out of the total population between 25 and 64 years of age (1,515) are in the labor force, with 1.9% or 23 of them being unemployed. The group with the highest labor force participation rate are those with the educational attainment of college / associate degree, with 83.6% or 493 individuals in the labor force. Within the labor force, individuals with less than high school education have the highest percentage of unemployment, with 5.6% or 7 of them being unemployed.
| Educational Attainment | In Labor Force | Unemployed |
| Less than High School | 124 (80.0%) | 9 (5.6%) |
| High School Diploma | 445 (76.3%) | 21 (3.6%) |
| College / Associate Degree | 493 (83.6%) | 0 (0.0%) |
| Bachelor's Degree or higher | 155 (82.9%) | 0 (0.0%) |
| Total | 1,217 (80.3%) | 29 (1.9%) |
Employment Occupations by Sex in Springtown
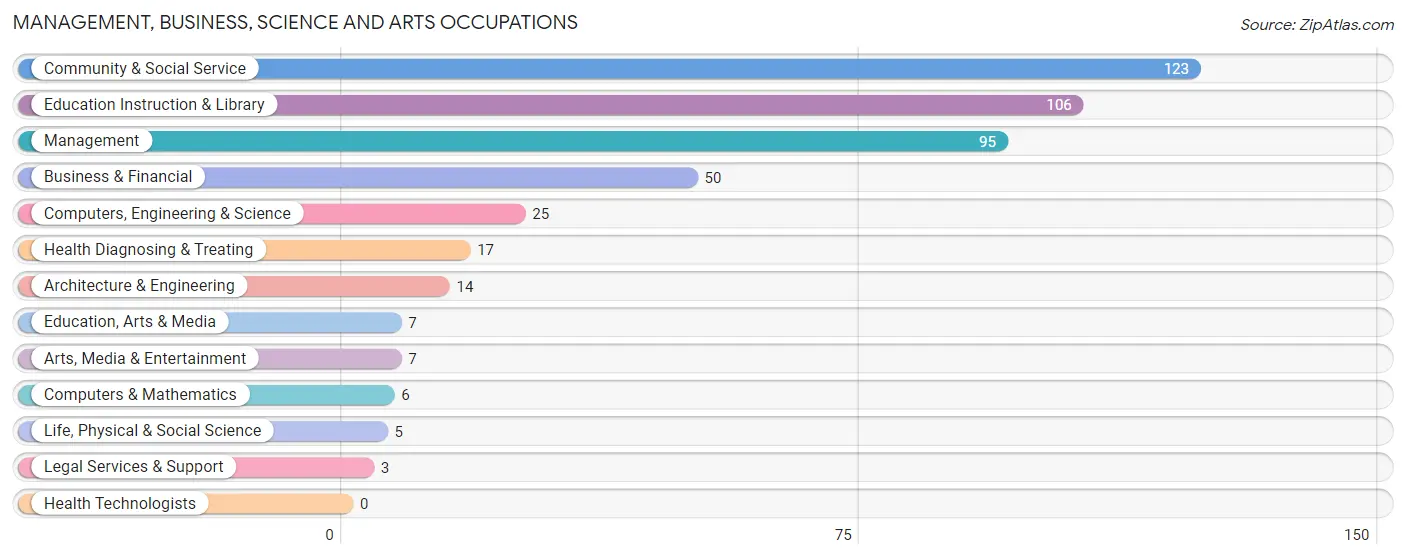
Management, Business, Science and Arts Occupations
The most common Management, Business, Science and Arts occupations in Springtown are Community & Social Service (123 | 7.3%), Education Instruction & Library (106 | 6.2%), Management (95 | 5.6%), Business & Financial (50 | 2.9%), and Computers, Engineering & Science (25 | 1.5%).
Management, Business, Science and Arts Occupations by Sex
Within the Management, Business, Science and Arts occupations in Springtown, the most male-oriented occupations are Computers & Mathematics (100.0%), Life, Physical & Social Science (100.0%), and Computers, Engineering & Science (64.0%), while the most female-oriented occupations are Legal Services & Support (100.0%), Arts, Media & Entertainment (100.0%), and Health Diagnosing & Treating (100.0%).
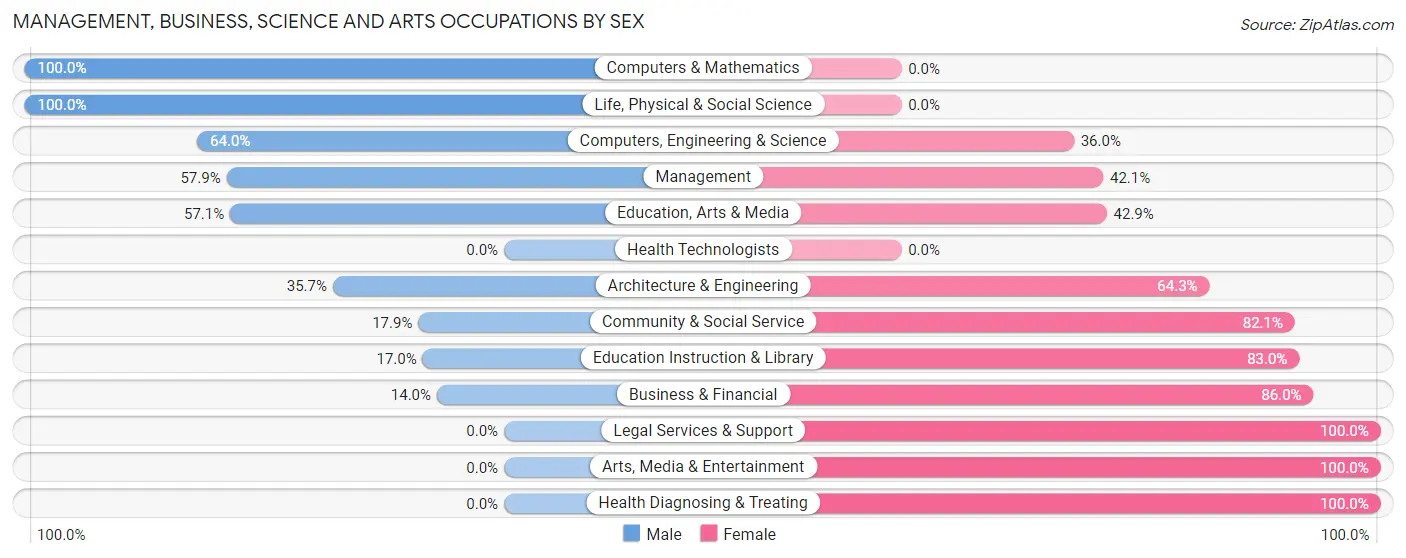
| Occupation | Male | Female |
| Management | 55 (57.9%) | 40 (42.1%) |
| Business & Financial | 7 (14.0%) | 43 (86.0%) |
| Computers, Engineering & Science | 16 (64.0%) | 9 (36.0%) |
| Computers & Mathematics | 6 (100.0%) | 0 (0.0%) |
| Architecture & Engineering | 5 (35.7%) | 9 (64.3%) |
| Life, Physical & Social Science | 5 (100.0%) | 0 (0.0%) |
| Community & Social Service | 22 (17.9%) | 101 (82.1%) |
| Education, Arts & Media | 4 (57.1%) | 3 (42.9%) |
| Legal Services & Support | 0 (0.0%) | 3 (100.0%) |
| Education Instruction & Library | 18 (17.0%) | 88 (83.0%) |
| Arts, Media & Entertainment | 0 (0.0%) | 7 (100.0%) |
| Health Diagnosing & Treating | 0 (0.0%) | 17 (100.0%) |
| Health Technologists | 0 (0.0%) | 0 (0.0%) |
| Total (Category) | 100 (32.3%) | 210 (67.7%) |
| Total (Overall) | 977 (57.6%) | 718 (42.4%) |
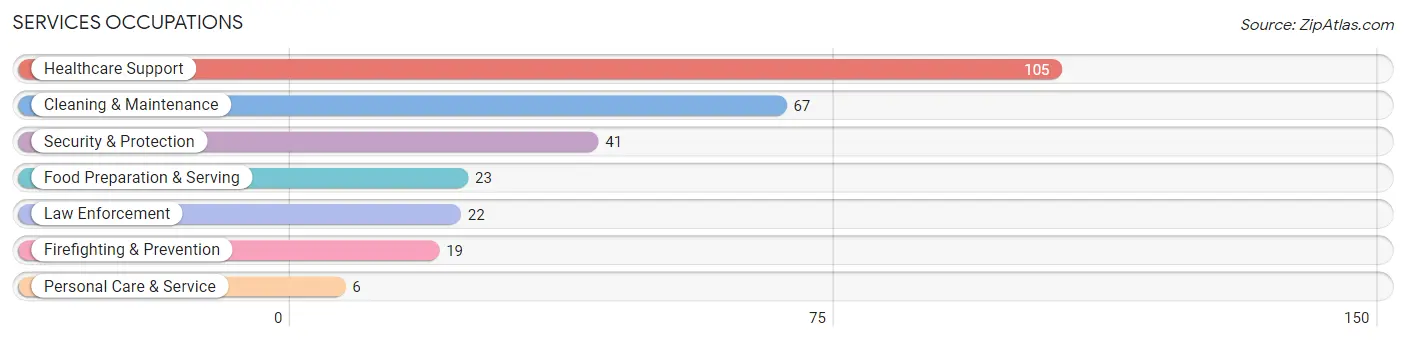
Services Occupations
The most common Services occupations in Springtown are Healthcare Support (105 | 6.2%), Cleaning & Maintenance (67 | 4.0%), Security & Protection (41 | 2.4%), Food Preparation & Serving (23 | 1.4%), and Law Enforcement (22 | 1.3%).
Services Occupations by Sex
Within the Services occupations in Springtown, the most male-oriented occupations are Security & Protection (100.0%), Firefighting & Prevention (100.0%), and Law Enforcement (100.0%), while the most female-oriented occupations are Healthcare Support (100.0%), Food Preparation & Serving (100.0%), and Personal Care & Service (100.0%).
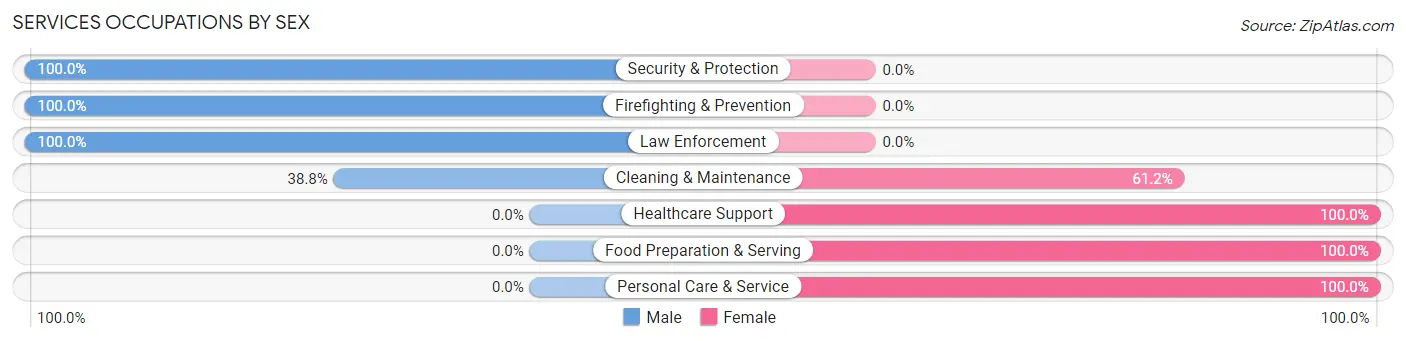
| Occupation | Male | Female |
| Healthcare Support | 0 (0.0%) | 105 (100.0%) |
| Security & Protection | 41 (100.0%) | 0 (0.0%) |
| Firefighting & Prevention | 19 (100.0%) | 0 (0.0%) |
| Law Enforcement | 22 (100.0%) | 0 (0.0%) |
| Food Preparation & Serving | 0 (0.0%) | 23 (100.0%) |
| Cleaning & Maintenance | 26 (38.8%) | 41 (61.2%) |
| Personal Care & Service | 0 (0.0%) | 6 (100.0%) |
| Total (Category) | 67 (27.7%) | 175 (72.3%) |
| Total (Overall) | 977 (57.6%) | 718 (42.4%) |
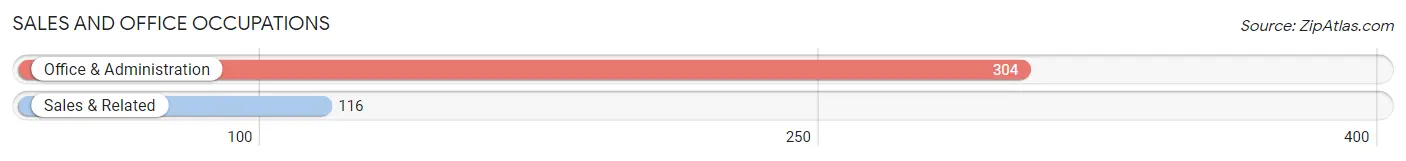
Sales and Office Occupations
The most common Sales and Office occupations in Springtown are Office & Administration (304 | 17.9%), and Sales & Related (116 | 6.8%).
Sales and Office Occupations by Sex
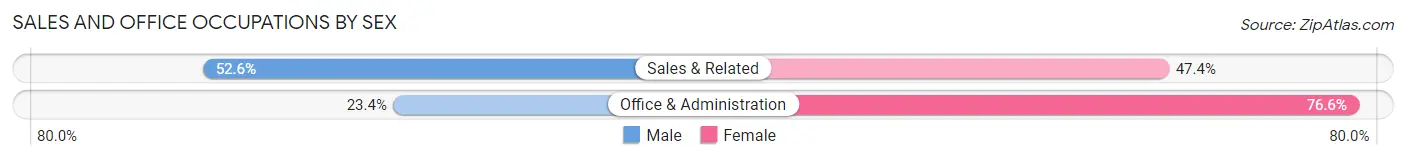
| Occupation | Male | Female |
| Sales & Related | 61 (52.6%) | 55 (47.4%) |
| Office & Administration | 71 (23.4%) | 233 (76.6%) |
| Total (Category) | 132 (31.4%) | 288 (68.6%) |
| Total (Overall) | 977 (57.6%) | 718 (42.4%) |
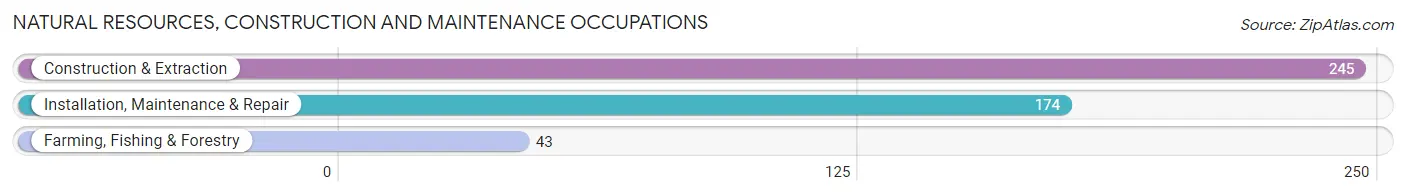
Natural Resources, Construction and Maintenance Occupations
The most common Natural Resources, Construction and Maintenance occupations in Springtown are Construction & Extraction (245 | 14.4%), Installation, Maintenance & Repair (174 | 10.3%), and Farming, Fishing & Forestry (43 | 2.5%).
Natural Resources, Construction and Maintenance Occupations by Sex
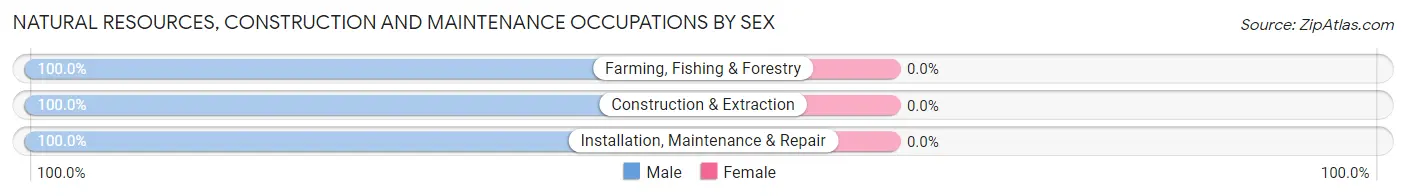
| Occupation | Male | Female |
| Farming, Fishing & Forestry | 43 (100.0%) | 0 (0.0%) |
| Construction & Extraction | 245 (100.0%) | 0 (0.0%) |
| Installation, Maintenance & Repair | 174 (100.0%) | 0 (0.0%) |
| Total (Category) | 462 (100.0%) | 0 (0.0%) |
| Total (Overall) | 977 (57.6%) | 718 (42.4%) |
Production, Transportation and Moving Occupations
The most common Production, Transportation and Moving occupations in Springtown are Production (108 | 6.4%), Transportation (96 | 5.7%), and Material Moving (57 | 3.4%).
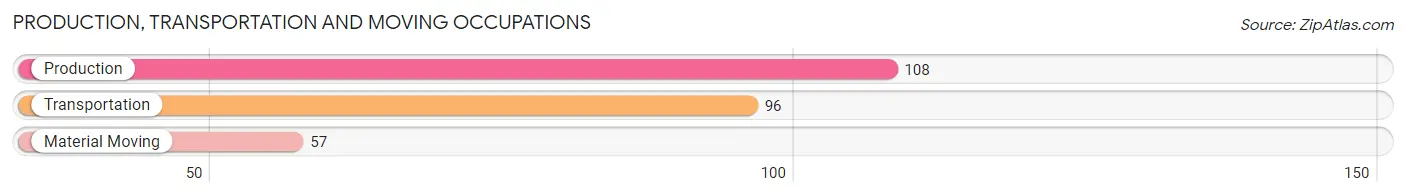
Production, Transportation and Moving Occupations by Sex
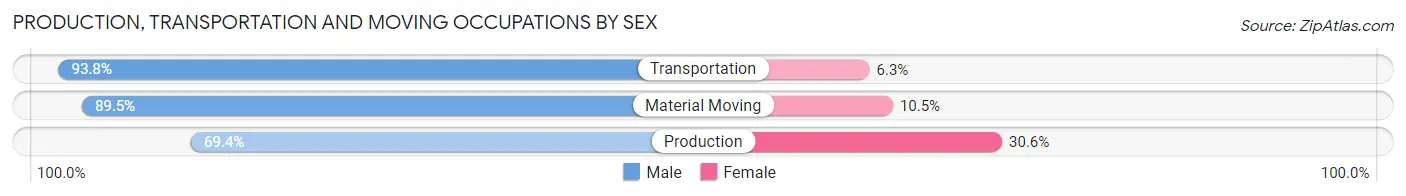
| Occupation | Male | Female |
| Production | 75 (69.4%) | 33 (30.6%) |
| Transportation | 90 (93.8%) | 6 (6.2%) |
| Material Moving | 51 (89.5%) | 6 (10.5%) |
| Total (Category) | 216 (82.8%) | 45 (17.2%) |
| Total (Overall) | 977 (57.6%) | 718 (42.4%) |
Employment Industries by Sex in Springtown
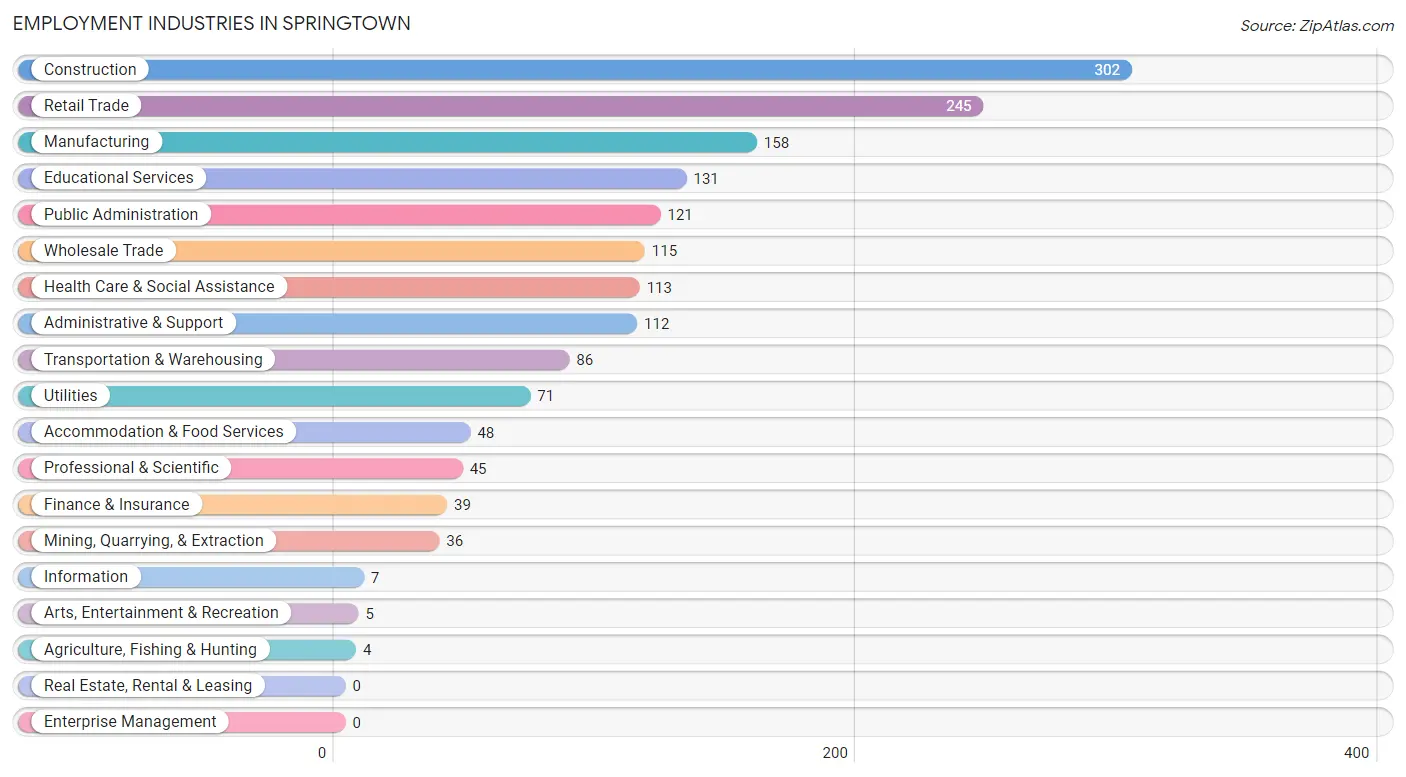
Employment Industries in Springtown
The major employment industries in Springtown include Construction (302 | 17.8%), Retail Trade (245 | 14.4%), Manufacturing (158 | 9.3%), Educational Services (131 | 7.7%), and Public Administration (121 | 7.1%).
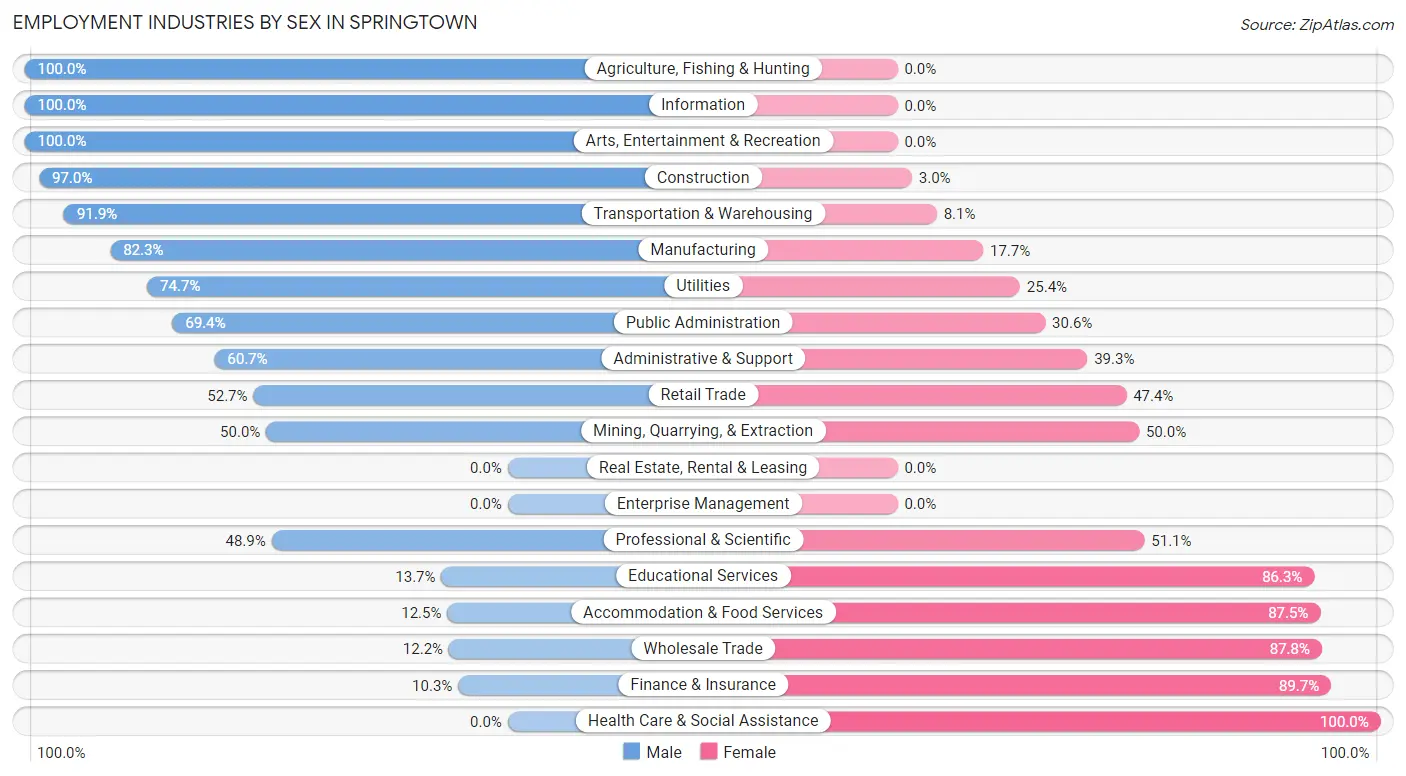
Employment Industries by Sex in Springtown
The Springtown industries that see more men than women are Agriculture, Fishing & Hunting (100.0%), Information (100.0%), and Arts, Entertainment & Recreation (100.0%), whereas the industries that tend to have a higher number of women are Health Care & Social Assistance (100.0%), Finance & Insurance (89.7%), and Wholesale Trade (87.8%).
| Industry | Male | Female |
| Agriculture, Fishing & Hunting | 4 (100.0%) | 0 (0.0%) |
| Mining, Quarrying, & Extraction | 18 (50.0%) | 18 (50.0%) |
| Construction | 293 (97.0%) | 9 (3.0%) |
| Manufacturing | 130 (82.3%) | 28 (17.7%) |
| Wholesale Trade | 14 (12.2%) | 101 (87.8%) |
| Retail Trade | 129 (52.6%) | 116 (47.3%) |
| Transportation & Warehousing | 79 (91.9%) | 7 (8.1%) |
| Utilities | 53 (74.7%) | 18 (25.4%) |
| Information | 7 (100.0%) | 0 (0.0%) |
| Finance & Insurance | 4 (10.3%) | 35 (89.7%) |
| Real Estate, Rental & Leasing | 0 (0.0%) | 0 (0.0%) |
| Professional & Scientific | 22 (48.9%) | 23 (51.1%) |
| Enterprise Management | 0 (0.0%) | 0 (0.0%) |
| Administrative & Support | 68 (60.7%) | 44 (39.3%) |
| Educational Services | 18 (13.7%) | 113 (86.3%) |
| Health Care & Social Assistance | 0 (0.0%) | 113 (100.0%) |
| Arts, Entertainment & Recreation | 5 (100.0%) | 0 (0.0%) |
| Accommodation & Food Services | 6 (12.5%) | 42 (87.5%) |
| Public Administration | 84 (69.4%) | 37 (30.6%) |
| Total | 977 (57.6%) | 718 (42.4%) |
Education in Springtown
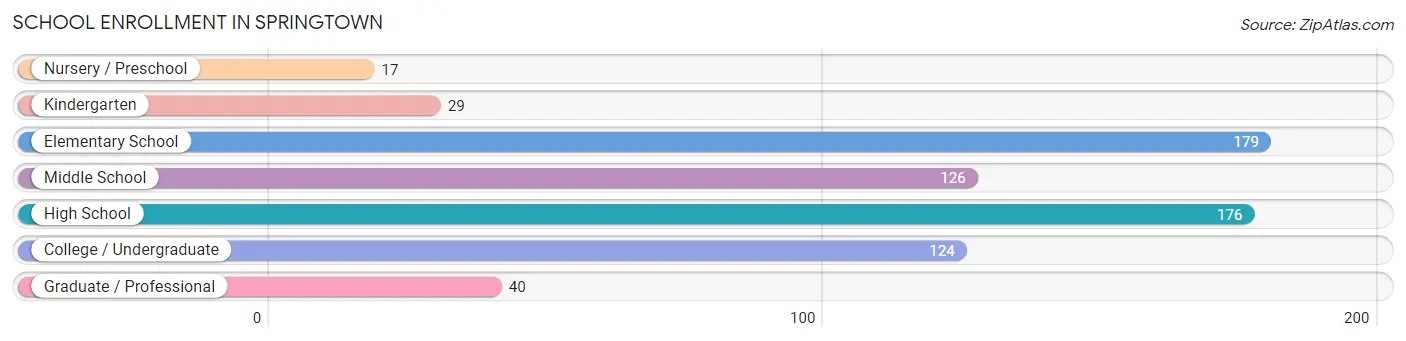
School Enrollment in Springtown
The most common levels of schooling among the 691 students in Springtown are elementary school (179 | 25.9%), high school (176 | 25.5%), and middle school (126 | 18.2%).
| School Level | # Students | % Students |
| Nursery / Preschool | 17 | 2.5% |
| Kindergarten | 29 | 4.2% |
| Elementary School | 179 | 25.9% |
| Middle School | 126 | 18.2% |
| High School | 176 | 25.5% |
| College / Undergraduate | 124 | 17.9% |
| Graduate / Professional | 40 | 5.8% |
| Total | 691 | 100.0% |
School Enrollment by Age by Funding Source in Springtown
Out of a total of 691 students who are enrolled in schools in Springtown, 70 (10.1%) attend a private institution, while the remaining 621 (89.9%) are enrolled in public schools. The age group of 3 to 4 year olds has the highest likelihood of being enrolled in private schools, with 13 (48.1% in the age bracket) enrolled. Conversely, the age group of 18 to 19 year olds has the lowest likelihood of being enrolled in a private school, with 66 (100.0% in the age bracket) attending a public institution.
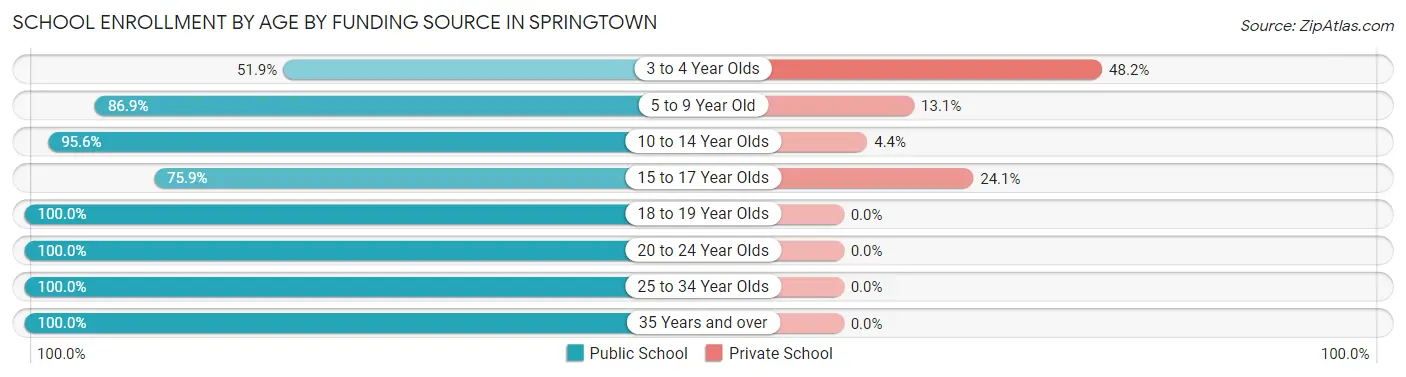
| Age Bracket | Public School | Private School |
| 3 to 4 Year Olds | 14 (51.8%) | 13 (48.1%) |
| 5 to 9 Year Old | 139 (86.9%) | 21 (13.1%) |
| 10 to 14 Year Olds | 174 (95.6%) | 8 (4.4%) |
| 15 to 17 Year Olds | 88 (75.9%) | 28 (24.1%) |
| 18 to 19 Year Olds | 66 (100.0%) | 0 (0.0%) |
| 20 to 24 Year Olds | 91 (100.0%) | 0 (0.0%) |
| 25 to 34 Year Olds | 9 (100.0%) | 0 (0.0%) |
| 35 Years and over | 40 (100.0%) | 0 (0.0%) |
| Total | 621 (89.9%) | 70 (10.1%) |
Educational Attainment by Field of Study in Springtown
Arts & humanities (67 | 25.3%), education (45 | 17.0%), physical & health sciences (35 | 13.2%), business (20 | 7.5%), and psychology (15 | 5.7%) are the most common fields of study among 265 individuals in Springtown who have obtained a bachelor's degree or higher.
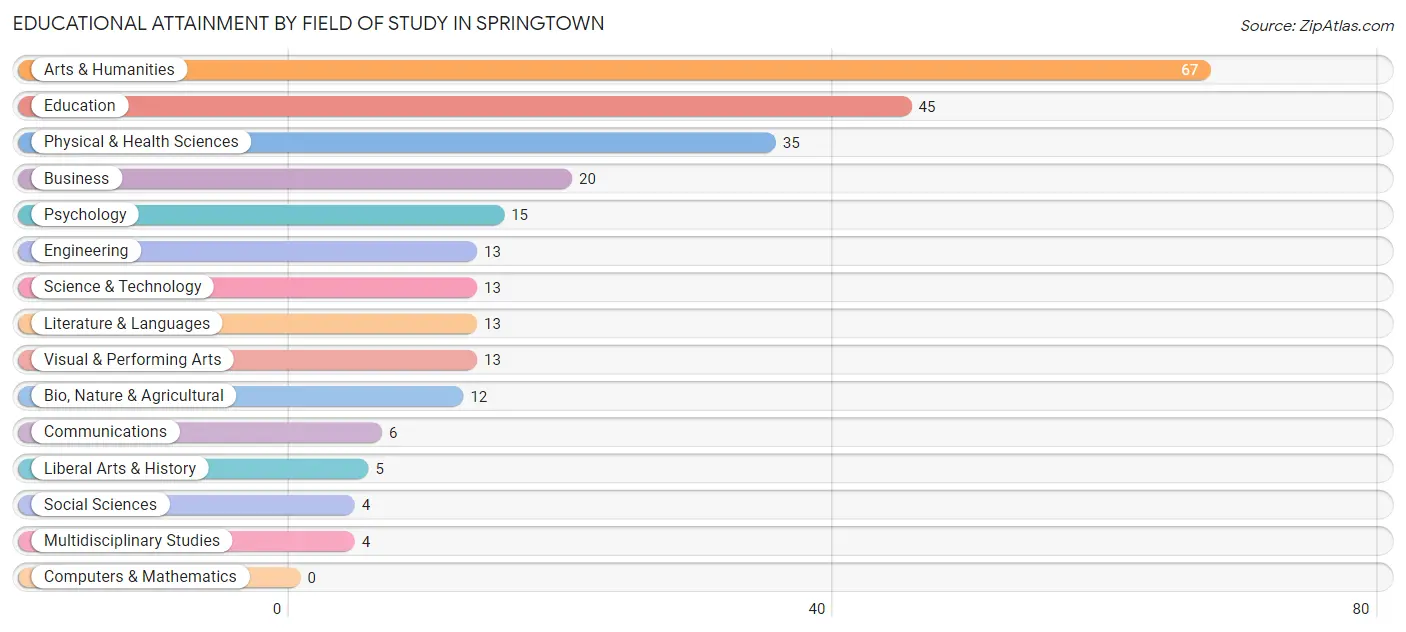
| Field of Study | # Graduates | % Graduates |
| Computers & Mathematics | 0 | 0.0% |
| Bio, Nature & Agricultural | 12 | 4.5% |
| Physical & Health Sciences | 35 | 13.2% |
| Psychology | 15 | 5.7% |
| Social Sciences | 4 | 1.5% |
| Engineering | 13 | 4.9% |
| Multidisciplinary Studies | 4 | 1.5% |
| Science & Technology | 13 | 4.9% |
| Business | 20 | 7.5% |
| Education | 45 | 17.0% |
| Literature & Languages | 13 | 4.9% |
| Liberal Arts & History | 5 | 1.9% |
| Visual & Performing Arts | 13 | 4.9% |
| Communications | 6 | 2.3% |
| Arts & Humanities | 67 | 25.3% |
| Total | 265 | 100.0% |
Transportation & Commute in Springtown
Vehicle Availability by Sex in Springtown
The most prevalent vehicle ownership categories in Springtown are males with 2 vehicles (481, accounting for 50.0%) and females with 2 vehicles (346, making up 67.2%).
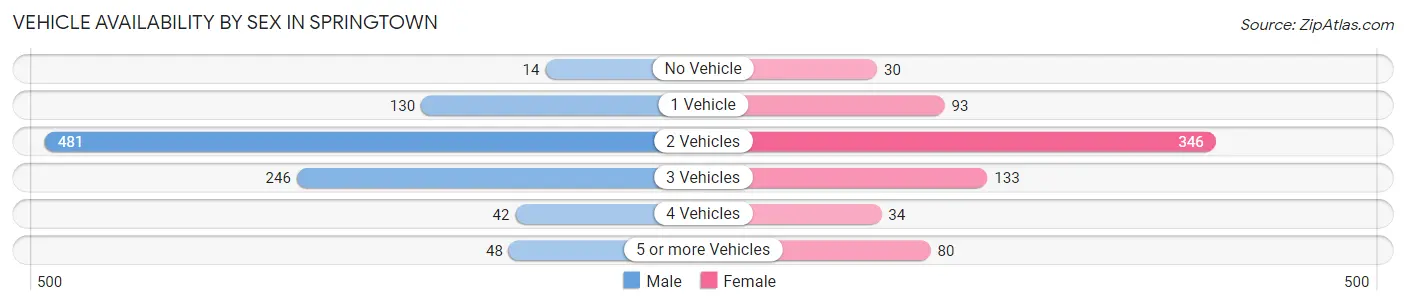
| Vehicles Available | Male | Female |
| No Vehicle | 14 (1.5%) | 30 (4.2%) |
| 1 Vehicle | 130 (13.5%) | 93 (13.0%) |
| 2 Vehicles | 481 (50.0%) | 346 (48.3%) |
| 3 Vehicles | 246 (25.6%) | 133 (18.6%) |
| 4 Vehicles | 42 (4.4%) | 34 (4.8%) |
| 5 or more Vehicles | 48 (5.0%) | 80 (11.2%) |
| Total | 961 (100.0%) | 716 (100.0%) |
Commute Time in Springtown
The most frequently occuring commute durations in Springtown are 45 to 59 minutes (404 commuters, 24.6%), 5 to 9 minutes (249 commuters, 15.1%), and 90 or more minutes (178 commuters, 10.8%).
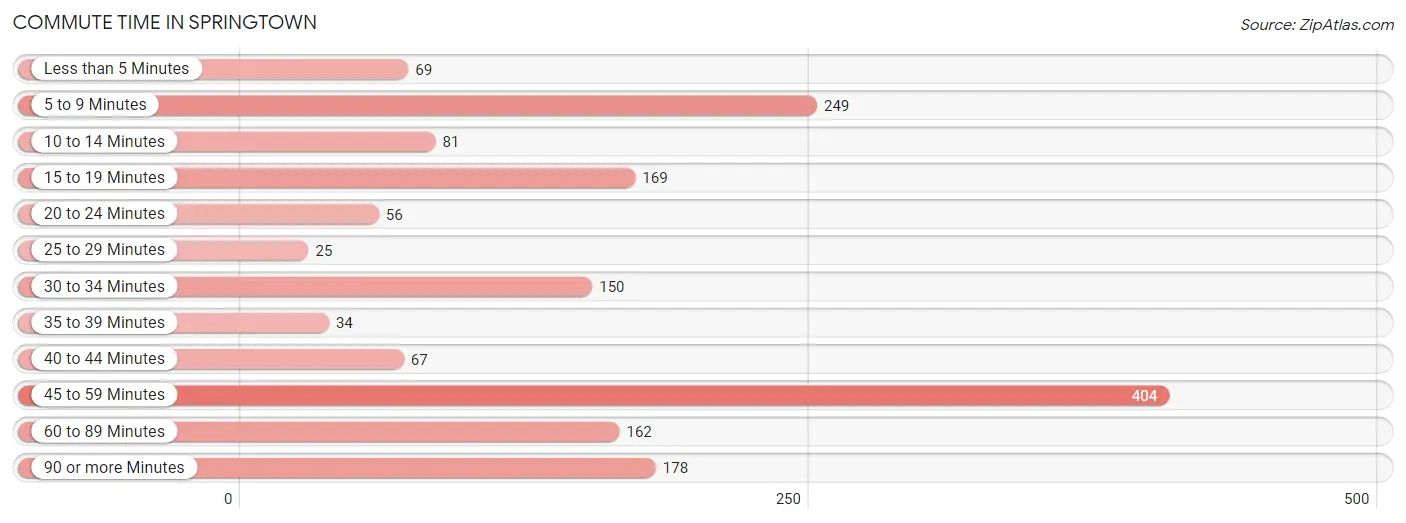
| Commute Time | # Commuters | % Commuters |
| Less than 5 Minutes | 69 | 4.2% |
| 5 to 9 Minutes | 249 | 15.1% |
| 10 to 14 Minutes | 81 | 4.9% |
| 15 to 19 Minutes | 169 | 10.3% |
| 20 to 24 Minutes | 56 | 3.4% |
| 25 to 29 Minutes | 25 | 1.5% |
| 30 to 34 Minutes | 150 | 9.1% |
| 35 to 39 Minutes | 34 | 2.1% |
| 40 to 44 Minutes | 67 | 4.1% |
| 45 to 59 Minutes | 404 | 24.6% |
| 60 to 89 Minutes | 162 | 9.9% |
| 90 or more Minutes | 178 | 10.8% |
Commute Time by Sex in Springtown
The most common commute times in Springtown are 45 to 59 minutes (344 commuters, 36.1%) for males and 5 to 9 minutes (142 commuters, 20.6%) for females.
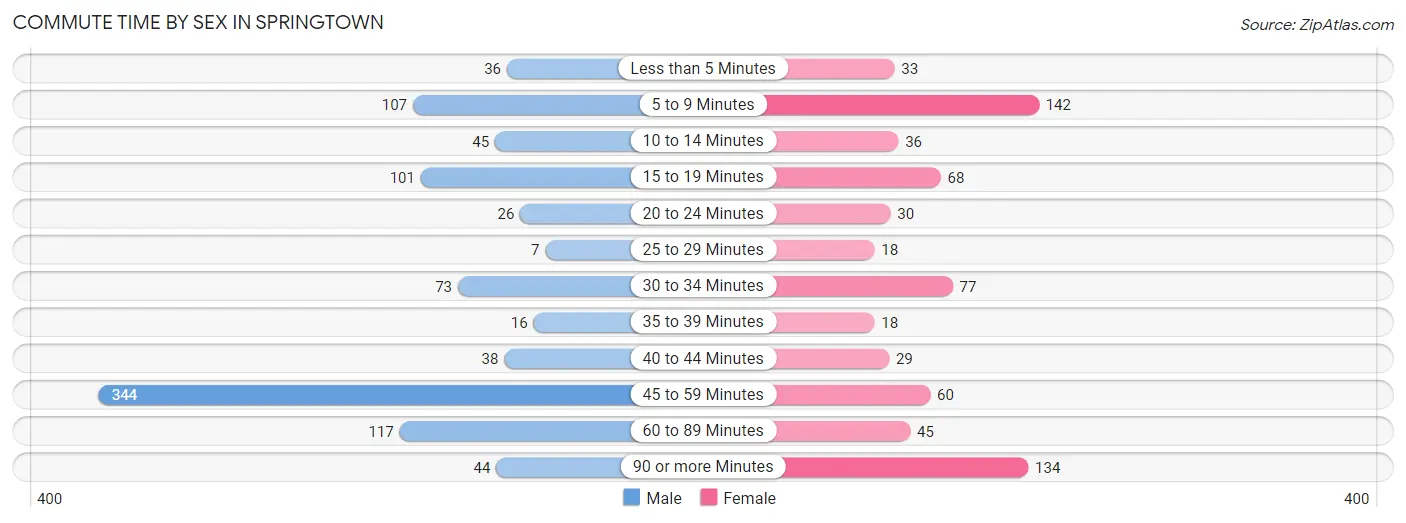
| Commute Time | Male | Female |
| Less than 5 Minutes | 36 (3.8%) | 33 (4.8%) |
| 5 to 9 Minutes | 107 (11.2%) | 142 (20.6%) |
| 10 to 14 Minutes | 45 (4.7%) | 36 (5.2%) |
| 15 to 19 Minutes | 101 (10.6%) | 68 (9.9%) |
| 20 to 24 Minutes | 26 (2.7%) | 30 (4.3%) |
| 25 to 29 Minutes | 7 (0.7%) | 18 (2.6%) |
| 30 to 34 Minutes | 73 (7.6%) | 77 (11.2%) |
| 35 to 39 Minutes | 16 (1.7%) | 18 (2.6%) |
| 40 to 44 Minutes | 38 (4.0%) | 29 (4.2%) |
| 45 to 59 Minutes | 344 (36.1%) | 60 (8.7%) |
| 60 to 89 Minutes | 117 (12.3%) | 45 (6.5%) |
| 90 or more Minutes | 44 (4.6%) | 134 (19.4%) |
Time of Departure to Work by Sex in Springtown
The most frequent times of departure to work in Springtown are 6:30 AM to 6:59 AM (225, 23.6%) for males and 6:00 AM to 6:29 AM (135, 19.6%) for females.
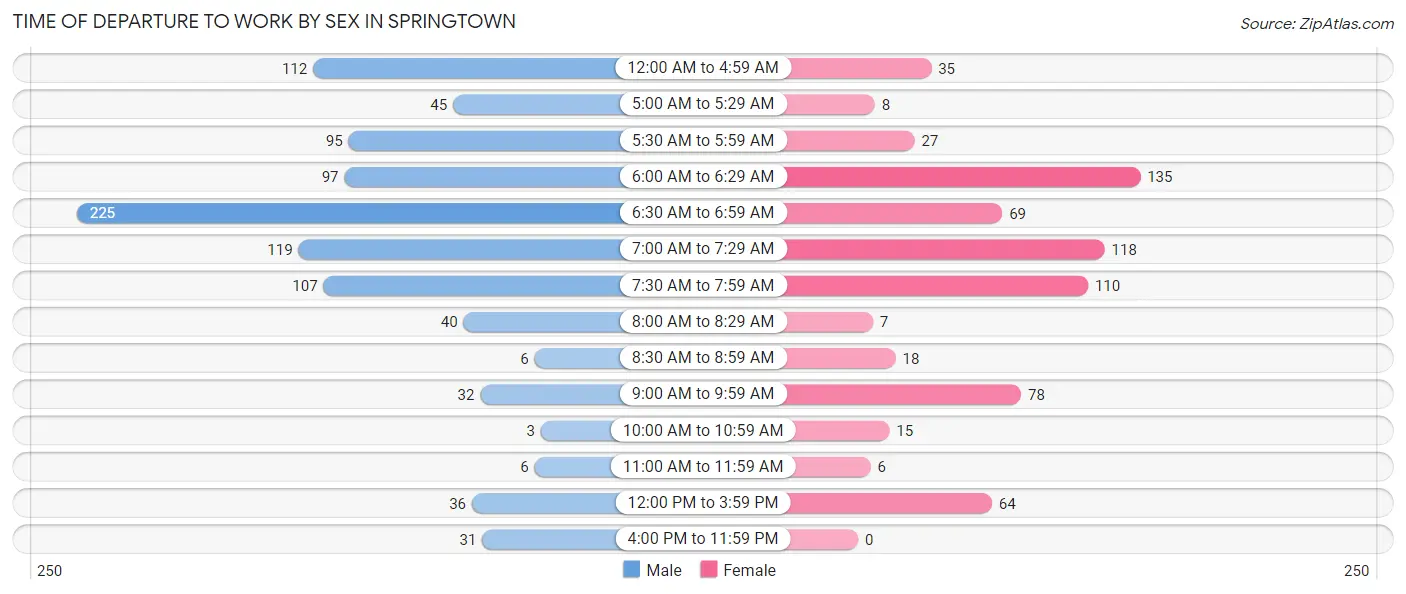
| Time of Departure | Male | Female |
| 12:00 AM to 4:59 AM | 112 (11.7%) | 35 (5.1%) |
| 5:00 AM to 5:29 AM | 45 (4.7%) | 8 (1.2%) |
| 5:30 AM to 5:59 AM | 95 (10.0%) | 27 (3.9%) |
| 6:00 AM to 6:29 AM | 97 (10.2%) | 135 (19.6%) |
| 6:30 AM to 6:59 AM | 225 (23.6%) | 69 (10.0%) |
| 7:00 AM to 7:29 AM | 119 (12.5%) | 118 (17.1%) |
| 7:30 AM to 7:59 AM | 107 (11.2%) | 110 (15.9%) |
| 8:00 AM to 8:29 AM | 40 (4.2%) | 7 (1.0%) |
| 8:30 AM to 8:59 AM | 6 (0.6%) | 18 (2.6%) |
| 9:00 AM to 9:59 AM | 32 (3.4%) | 78 (11.3%) |
| 10:00 AM to 10:59 AM | 3 (0.3%) | 15 (2.2%) |
| 11:00 AM to 11:59 AM | 6 (0.6%) | 6 (0.9%) |
| 12:00 PM to 3:59 PM | 36 (3.8%) | 64 (9.3%) |
| 4:00 PM to 11:59 PM | 31 (3.3%) | 0 (0.0%) |
| Total | 954 (100.0%) | 690 (100.0%) |
Housing Occupancy in Springtown
Occupancy by Ownership in Springtown
Of the total 1,116 dwellings in Springtown, owner-occupied units account for 671 (60.1%), while renter-occupied units make up 445 (39.9%).
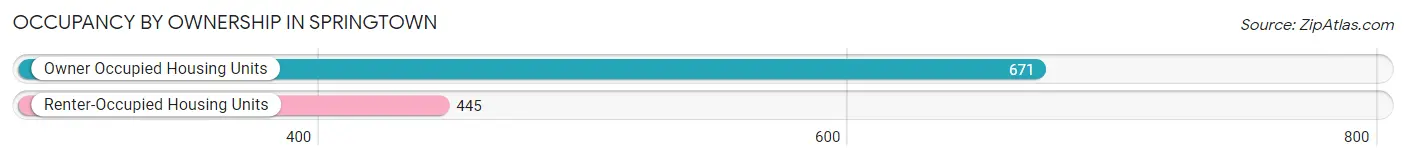
| Occupancy | # Housing Units | % Housing Units |
| Owner Occupied Housing Units | 671 | 60.1% |
| Renter-Occupied Housing Units | 445 | 39.9% |
| Total Occupied Housing Units | 1,116 | 100.0% |
Occupancy by Household Size in Springtown
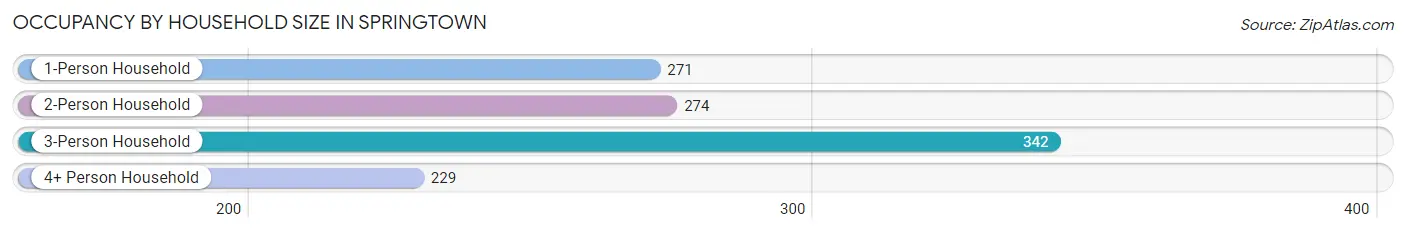
| Household Size | # Housing Units | % Housing Units |
| 1-Person Household | 271 | 24.3% |
| 2-Person Household | 274 | 24.5% |
| 3-Person Household | 342 | 30.6% |
| 4+ Person Household | 229 | 20.5% |
| Total Housing Units | 1,116 | 100.0% |
Occupancy by Ownership by Household Size in Springtown
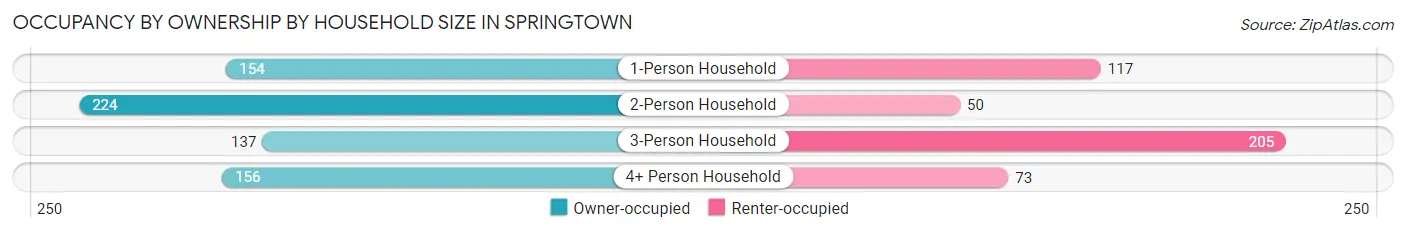
| Household Size | Owner-occupied | Renter-occupied |
| 1-Person Household | 154 (56.8%) | 117 (43.2%) |
| 2-Person Household | 224 (81.8%) | 50 (18.2%) |
| 3-Person Household | 137 (40.1%) | 205 (59.9%) |
| 4+ Person Household | 156 (68.1%) | 73 (31.9%) |
| Total Housing Units | 671 (60.1%) | 445 (39.9%) |
Occupancy by Educational Attainment in Springtown
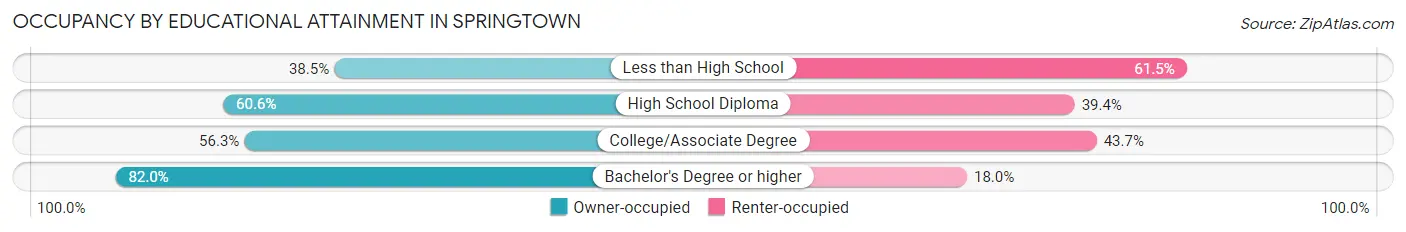
| Household Size | Owner-occupied | Renter-occupied |
| Less than High School | 35 (38.5%) | 56 (61.5%) |
| High School Diploma | 208 (60.6%) | 135 (39.4%) |
| College/Associate Degree | 287 (56.3%) | 223 (43.7%) |
| Bachelor's Degree or higher | 141 (82.0%) | 31 (18.0%) |
Occupancy by Age of Householder in Springtown
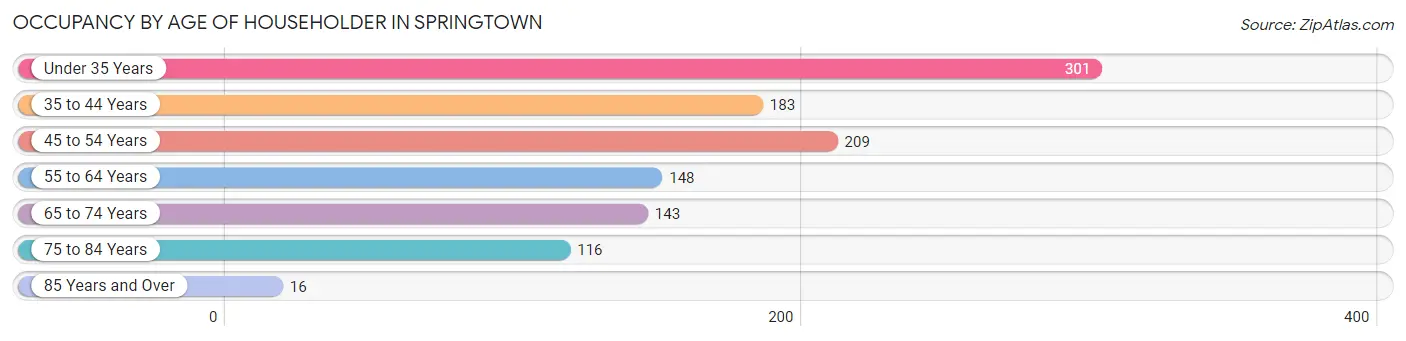
| Age Bracket | # Households | % Households |
| Under 35 Years | 301 | 27.0% |
| 35 to 44 Years | 183 | 16.4% |
| 45 to 54 Years | 209 | 18.7% |
| 55 to 64 Years | 148 | 13.3% |
| 65 to 74 Years | 143 | 12.8% |
| 75 to 84 Years | 116 | 10.4% |
| 85 Years and Over | 16 | 1.4% |
| Total | 1,116 | 100.0% |
Housing Finances in Springtown
Median Income by Occupancy in Springtown
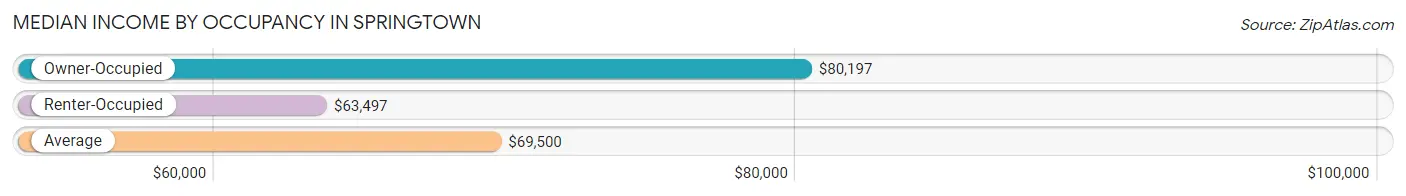
| Occupancy Type | # Households | Median Income |
| Owner-Occupied | 671 (60.1%) | $80,197 |
| Renter-Occupied | 445 (39.9%) | $63,497 |
| Average | 1,116 (100.0%) | $69,500 |
Occupancy by Householder Income Bracket in Springtown
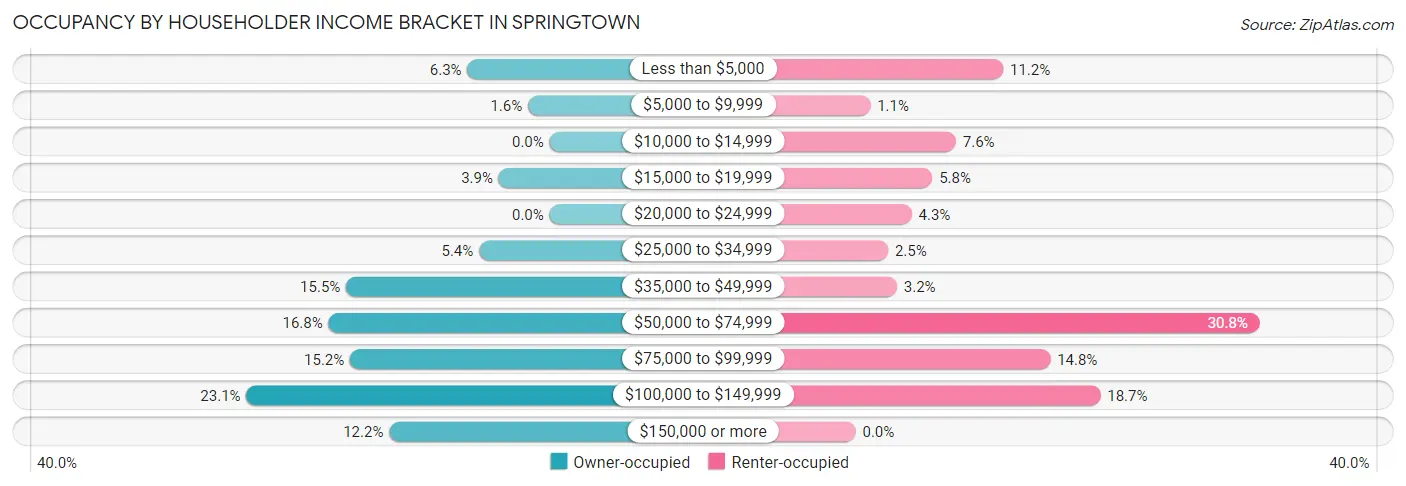
| Income Bracket | Owner-occupied | Renter-occupied |
| Less than $5,000 | 42 (6.3%) | 50 (11.2%) |
| $5,000 to $9,999 | 11 (1.6%) | 5 (1.1%) |
| $10,000 to $14,999 | 0 (0.0%) | 34 (7.6%) |
| $15,000 to $19,999 | 26 (3.9%) | 26 (5.8%) |
| $20,000 to $24,999 | 0 (0.0%) | 19 (4.3%) |
| $25,000 to $34,999 | 36 (5.4%) | 11 (2.5%) |
| $35,000 to $49,999 | 104 (15.5%) | 14 (3.2%) |
| $50,000 to $74,999 | 113 (16.8%) | 137 (30.8%) |
| $75,000 to $99,999 | 102 (15.2%) | 66 (14.8%) |
| $100,000 to $149,999 | 155 (23.1%) | 83 (18.6%) |
| $150,000 or more | 82 (12.2%) | 0 (0.0%) |
| Total | 671 (100.0%) | 445 (100.0%) |
Monthly Housing Cost Tiers in Springtown
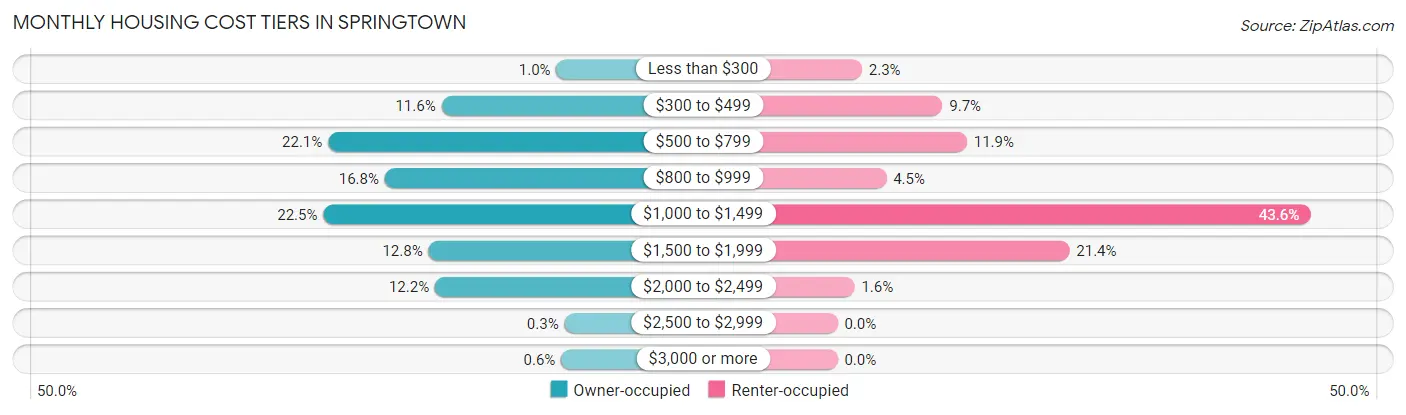
| Monthly Cost | Owner-occupied | Renter-occupied |
| Less than $300 | 7 (1.0%) | 10 (2.2%) |
| $300 to $499 | 78 (11.6%) | 43 (9.7%) |
| $500 to $799 | 148 (22.1%) | 53 (11.9%) |
| $800 to $999 | 113 (16.8%) | 20 (4.5%) |
| $1,000 to $1,499 | 151 (22.5%) | 194 (43.6%) |
| $1,500 to $1,999 | 86 (12.8%) | 95 (21.3%) |
| $2,000 to $2,499 | 82 (12.2%) | 7 (1.6%) |
| $2,500 to $2,999 | 2 (0.3%) | 0 (0.0%) |
| $3,000 or more | 4 (0.6%) | 0 (0.0%) |
| Total | 671 (100.0%) | 445 (100.0%) |
Physical Housing Characteristics in Springtown
Housing Structures in Springtown
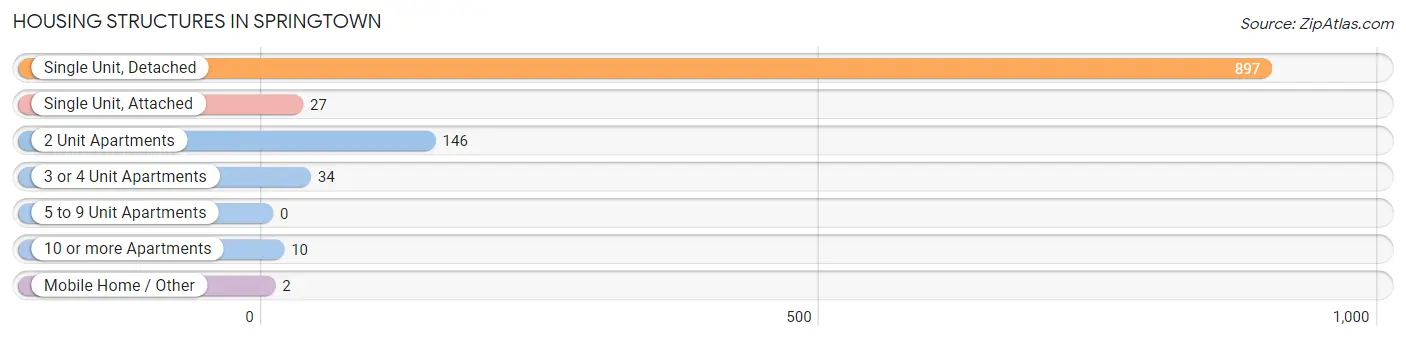
| Structure Type | # Housing Units | % Housing Units |
| Single Unit, Detached | 897 | 80.4% |
| Single Unit, Attached | 27 | 2.4% |
| 2 Unit Apartments | 146 | 13.1% |
| 3 or 4 Unit Apartments | 34 | 3.0% |
| 5 to 9 Unit Apartments | 0 | 0.0% |
| 10 or more Apartments | 10 | 0.9% |
| Mobile Home / Other | 2 | 0.2% |
| Total | 1,116 | 100.0% |
Housing Structures by Occupancy in Springtown
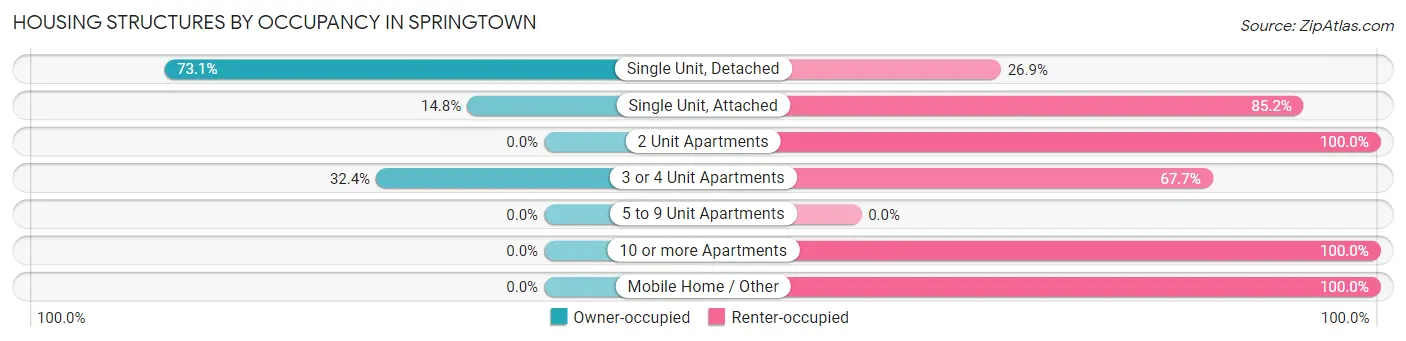
| Structure Type | Owner-occupied | Renter-occupied |
| Single Unit, Detached | 656 (73.1%) | 241 (26.9%) |
| Single Unit, Attached | 4 (14.8%) | 23 (85.2%) |
| 2 Unit Apartments | 0 (0.0%) | 146 (100.0%) |
| 3 or 4 Unit Apartments | 11 (32.4%) | 23 (67.6%) |
| 5 to 9 Unit Apartments | 0 (0.0%) | 0 (0.0%) |
| 10 or more Apartments | 0 (0.0%) | 10 (100.0%) |
| Mobile Home / Other | 0 (0.0%) | 2 (100.0%) |
| Total | 671 (60.1%) | 445 (39.9%) |
Housing Structures by Number of Rooms in Springtown
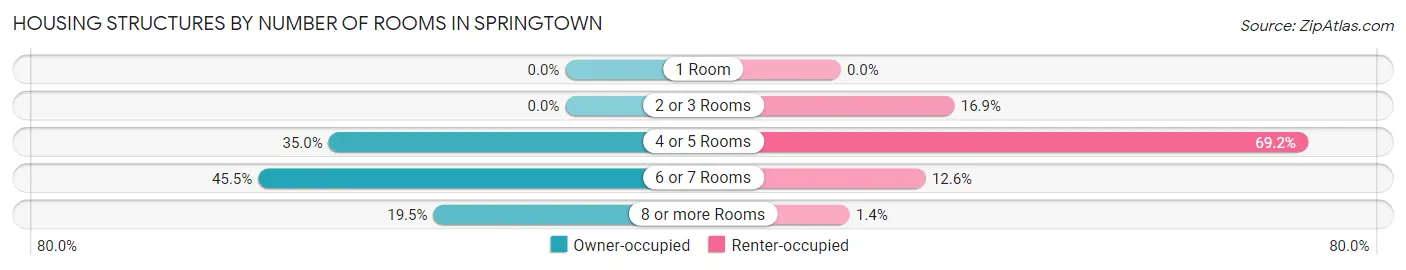
| Number of Rooms | Owner-occupied | Renter-occupied |
| 1 Room | 0 (0.0%) | 0 (0.0%) |
| 2 or 3 Rooms | 0 (0.0%) | 75 (16.9%) |
| 4 or 5 Rooms | 235 (35.0%) | 308 (69.2%) |
| 6 or 7 Rooms | 305 (45.5%) | 56 (12.6%) |
| 8 or more Rooms | 131 (19.5%) | 6 (1.3%) |
| Total | 671 (100.0%) | 445 (100.0%) |
Housing Structure by Heating Type in Springtown
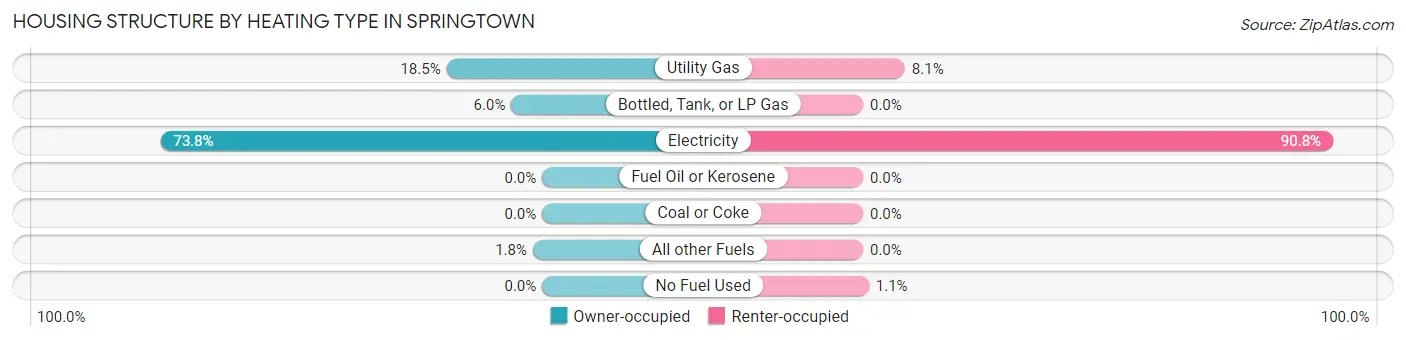
| Heating Type | Owner-occupied | Renter-occupied |
| Utility Gas | 124 (18.5%) | 36 (8.1%) |
| Bottled, Tank, or LP Gas | 40 (6.0%) | 0 (0.0%) |
| Electricity | 495 (73.8%) | 404 (90.8%) |
| Fuel Oil or Kerosene | 0 (0.0%) | 0 (0.0%) |
| Coal or Coke | 0 (0.0%) | 0 (0.0%) |
| All other Fuels | 12 (1.8%) | 0 (0.0%) |
| No Fuel Used | 0 (0.0%) | 5 (1.1%) |
| Total | 671 (100.0%) | 445 (100.0%) |
Household Vehicle Usage in Springtown
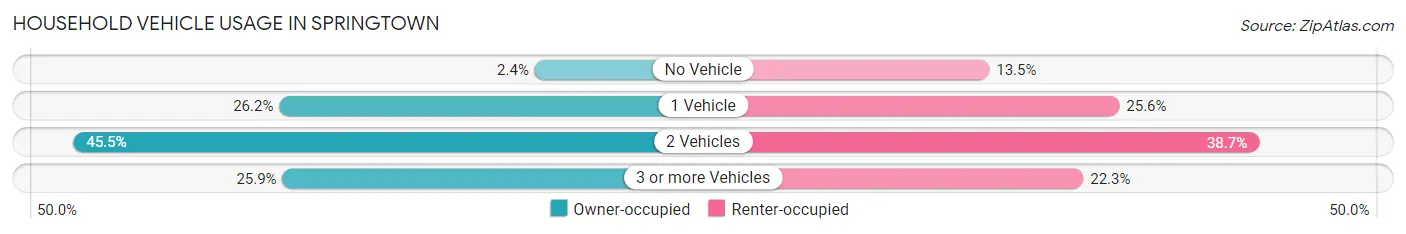
| Vehicles per Household | Owner-occupied | Renter-occupied |
| No Vehicle | 16 (2.4%) | 60 (13.5%) |
| 1 Vehicle | 176 (26.2%) | 114 (25.6%) |
| 2 Vehicles | 305 (45.5%) | 172 (38.7%) |
| 3 or more Vehicles | 174 (25.9%) | 99 (22.3%) |
| Total | 671 (100.0%) | 445 (100.0%) |
Real Estate & Mortgages in Springtown
Real Estate and Mortgage Overview in Springtown
| Characteristic | Without Mortgage | With Mortgage |
| Housing Units | 320 | 351 |
| Median Property Value | $178,800 | $210,100 |
| Median Household Income | $68,000 | $60 |
| Monthly Housing Costs | $711 | $4 |
| Real Estate Taxes | $2,615 | $9 |
Property Value by Mortgage Status in Springtown
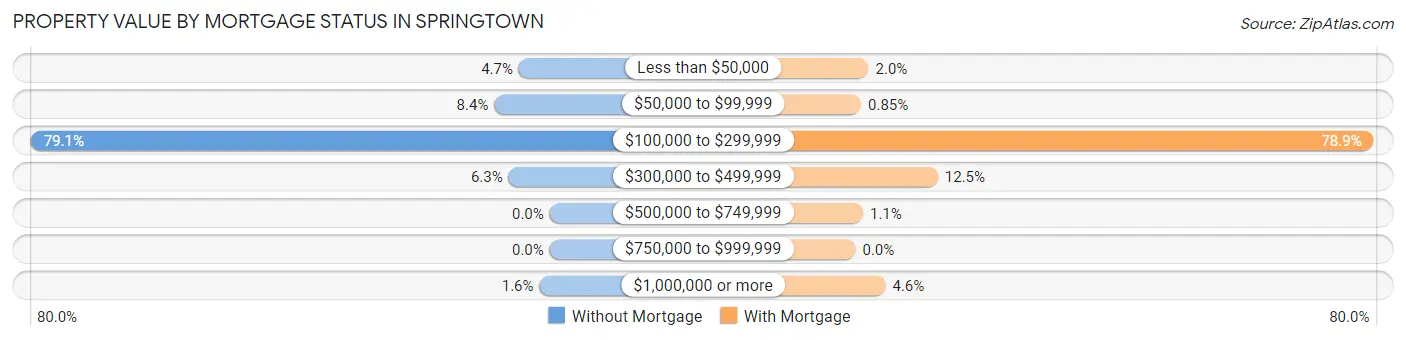
| Property Value | Without Mortgage | With Mortgage |
| Less than $50,000 | 15 (4.7%) | 7 (2.0%) |
| $50,000 to $99,999 | 27 (8.4%) | 3 (0.9%) |
| $100,000 to $299,999 | 253 (79.1%) | 277 (78.9%) |
| $300,000 to $499,999 | 20 (6.2%) | 44 (12.5%) |
| $500,000 to $749,999 | 0 (0.0%) | 4 (1.1%) |
| $750,000 to $999,999 | 0 (0.0%) | 0 (0.0%) |
| $1,000,000 or more | 5 (1.6%) | 16 (4.6%) |
| Total | 320 (100.0%) | 351 (100.0%) |
Household Income by Mortgage Status in Springtown
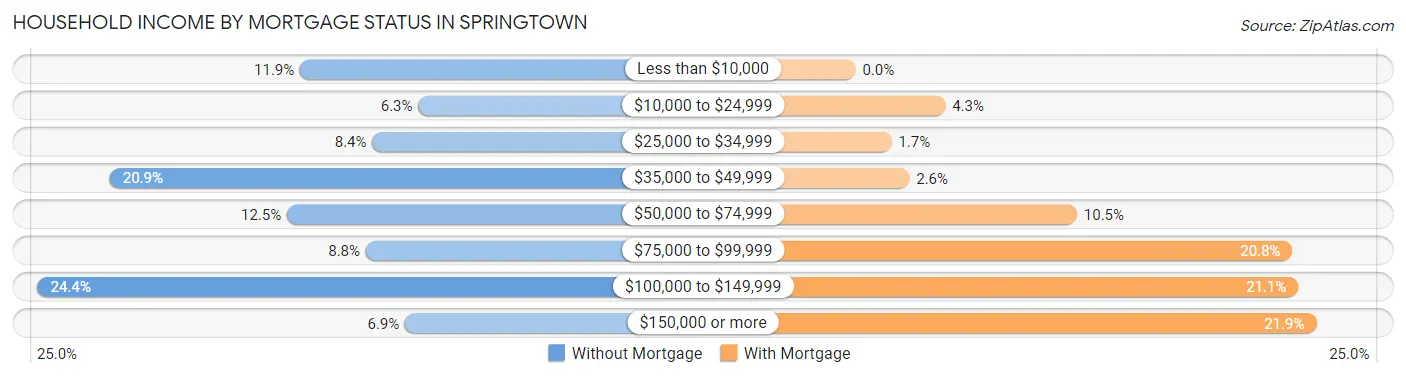
| Household Income | Without Mortgage | With Mortgage |
| Less than $10,000 | 38 (11.9%) | 0 (0.0%) |
| $10,000 to $24,999 | 20 (6.2%) | 15 (4.3%) |
| $25,000 to $34,999 | 27 (8.4%) | 6 (1.7%) |
| $35,000 to $49,999 | 67 (20.9%) | 9 (2.6%) |
| $50,000 to $74,999 | 40 (12.5%) | 37 (10.5%) |
| $75,000 to $99,999 | 28 (8.7%) | 73 (20.8%) |
| $100,000 to $149,999 | 78 (24.4%) | 74 (21.1%) |
| $150,000 or more | 22 (6.9%) | 77 (21.9%) |
| Total | 320 (100.0%) | 351 (100.0%) |
Property Value to Household Income Ratio in Springtown
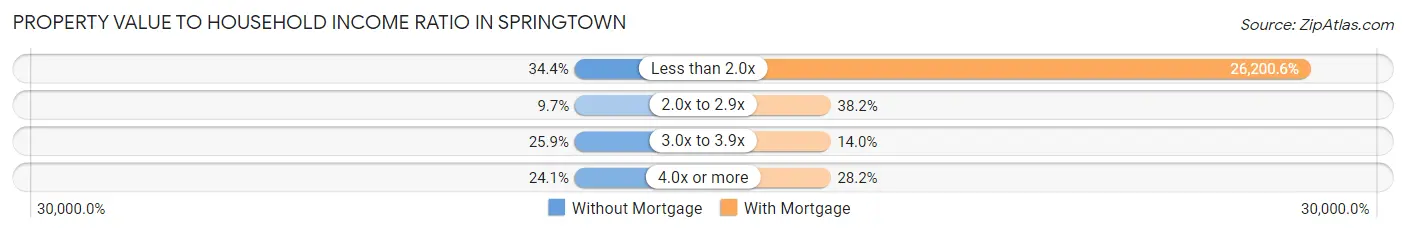
| Value-to-Income Ratio | Without Mortgage | With Mortgage |
| Less than 2.0x | 110 (34.4%) | 91,964 (26,200.6%) |
| 2.0x to 2.9x | 31 (9.7%) | 134 (38.2%) |
| 3.0x to 3.9x | 83 (25.9%) | 49 (14.0%) |
| 4.0x or more | 77 (24.1%) | 99 (28.2%) |
| Total | 320 (100.0%) | 351 (100.0%) |
Real Estate Taxes by Mortgage Status in Springtown
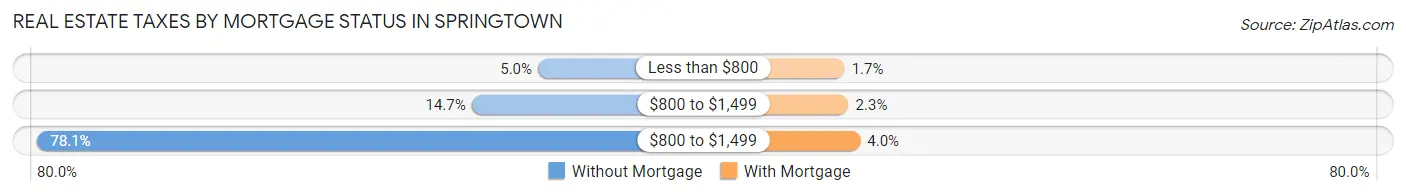
| Property Taxes | Without Mortgage | With Mortgage |
| Less than $800 | 16 (5.0%) | 6 (1.7%) |
| $800 to $1,499 | 47 (14.7%) | 8 (2.3%) |
| $800 to $1,499 | 250 (78.1%) | 14 (4.0%) |
| Total | 320 (100.0%) | 351 (100.0%) |
Health & Disability in Springtown
Health Insurance Coverage by Age in Springtown
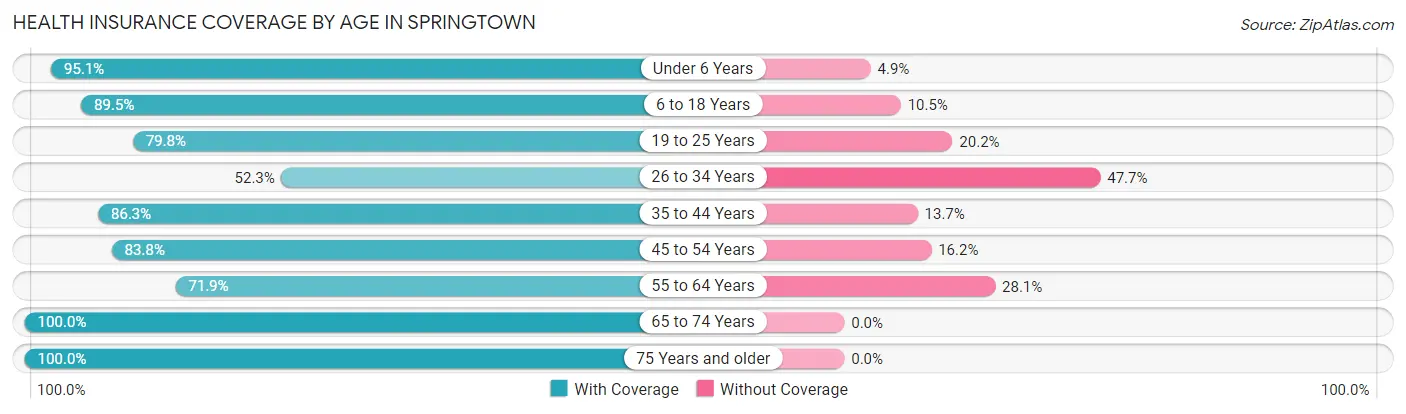
| Age Bracket | With Coverage | Without Coverage |
| Under 6 Years | 252 (95.1%) | 13 (4.9%) |
| 6 to 18 Years | 468 (89.5%) | 55 (10.5%) |
| 19 to 25 Years | 396 (79.8%) | 100 (20.2%) |
| 26 to 34 Years | 277 (52.3%) | 253 (47.7%) |
| 35 to 44 Years | 322 (86.3%) | 51 (13.7%) |
| 45 to 54 Years | 274 (83.8%) | 53 (16.2%) |
| 55 to 64 Years | 184 (71.9%) | 72 (28.1%) |
| 65 to 74 Years | 270 (100.0%) | 0 (0.0%) |
| 75 Years and older | 192 (100.0%) | 0 (0.0%) |
| Total | 2,635 (81.5%) | 597 (18.5%) |
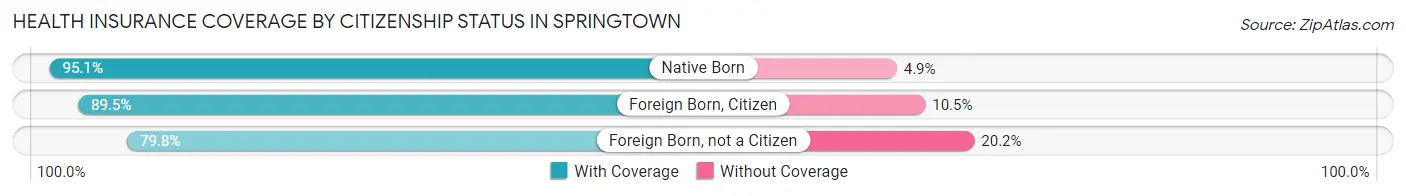
Health Insurance Coverage by Citizenship Status in Springtown
| Citizenship Status | With Coverage | Without Coverage |
| Native Born | 252 (95.1%) | 13 (4.9%) |
| Foreign Born, Citizen | 468 (89.5%) | 55 (10.5%) |
| Foreign Born, not a Citizen | 396 (79.8%) | 100 (20.2%) |
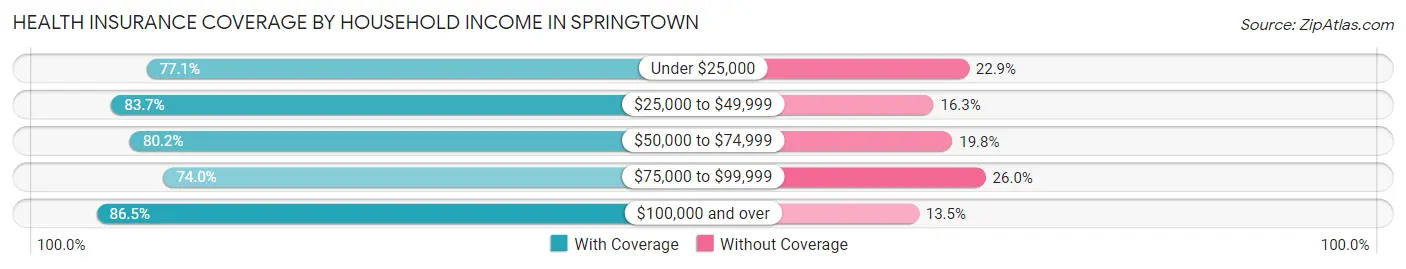
Health Insurance Coverage by Household Income in Springtown
| Household Income | With Coverage | Without Coverage |
| Under $25,000 | 263 (77.1%) | 78 (22.9%) |
| $25,000 to $49,999 | 242 (83.7%) | 47 (16.3%) |
| $50,000 to $74,999 | 641 (80.2%) | 158 (19.8%) |
| $75,000 to $99,999 | 418 (74.0%) | 147 (26.0%) |
| $100,000 and over | 1,071 (86.5%) | 167 (13.5%) |
Public vs Private Health Insurance Coverage by Age in Springtown
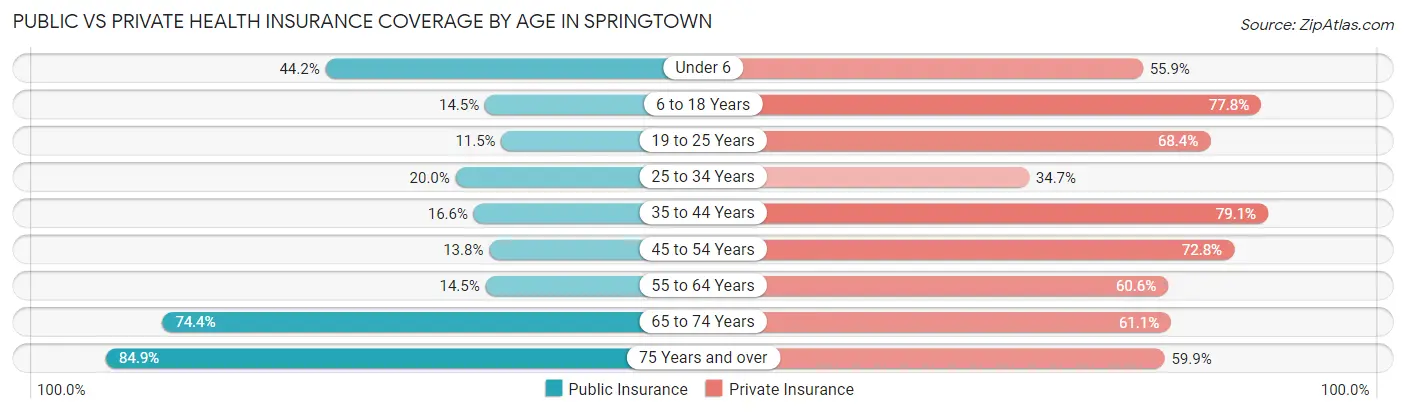
| Age Bracket | Public Insurance | Private Insurance |
| Under 6 | 117 (44.2%) | 148 (55.8%) |
| 6 to 18 Years | 76 (14.5%) | 407 (77.8%) |
| 19 to 25 Years | 57 (11.5%) | 339 (68.3%) |
| 25 to 34 Years | 106 (20.0%) | 184 (34.7%) |
| 35 to 44 Years | 62 (16.6%) | 295 (79.1%) |
| 45 to 54 Years | 45 (13.8%) | 238 (72.8%) |
| 55 to 64 Years | 37 (14.4%) | 155 (60.6%) |
| 65 to 74 Years | 201 (74.4%) | 165 (61.1%) |
| 75 Years and over | 163 (84.9%) | 115 (59.9%) |
| Total | 864 (26.7%) | 2,046 (63.3%) |
Disability Status by Sex by Age in Springtown
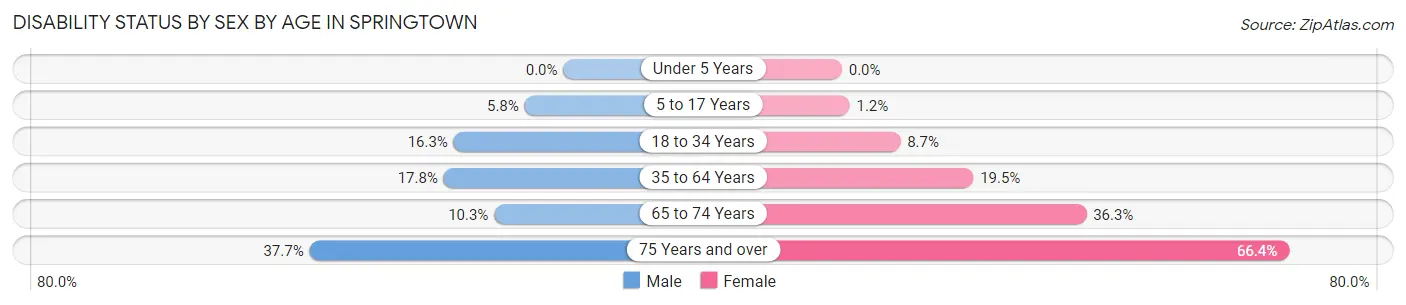
| Age Bracket | Male | Female |
| Under 5 Years | 0 (0.0%) | 0 (0.0%) |
| 5 to 17 Years | 13 (5.8%) | 3 (1.1%) |
| 18 to 34 Years | 97 (16.3%) | 42 (8.7%) |
| 35 to 64 Years | 76 (17.8%) | 103 (19.5%) |
| 65 to 74 Years | 15 (10.3%) | 45 (36.3%) |
| 75 Years and over | 23 (37.7%) | 87 (66.4%) |
Disability Class by Sex by Age in Springtown
Disability Class: Hearing Difficulty
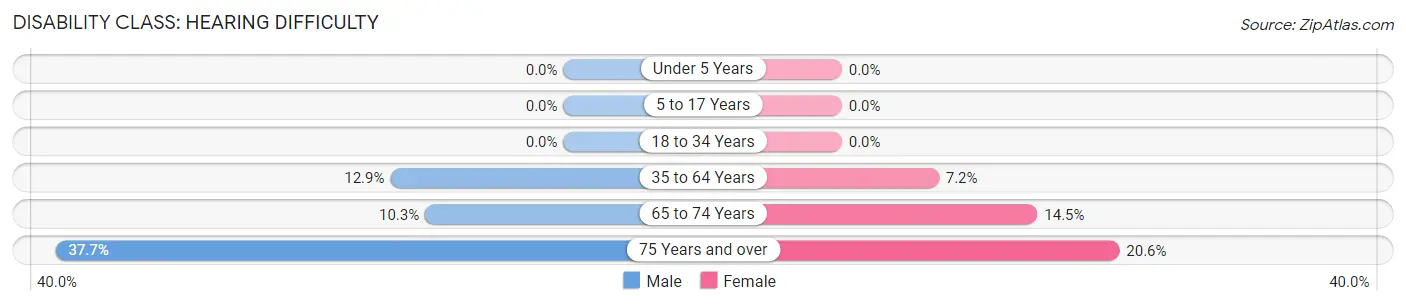
| Age Bracket | Male | Female |
| Under 5 Years | 0 (0.0%) | 0 (0.0%) |
| 5 to 17 Years | 0 (0.0%) | 0 (0.0%) |
| 18 to 34 Years | 0 (0.0%) | 0 (0.0%) |
| 35 to 64 Years | 55 (12.9%) | 38 (7.2%) |
| 65 to 74 Years | 15 (10.3%) | 18 (14.5%) |
| 75 Years and over | 23 (37.7%) | 27 (20.6%) |
Disability Class: Vision Difficulty
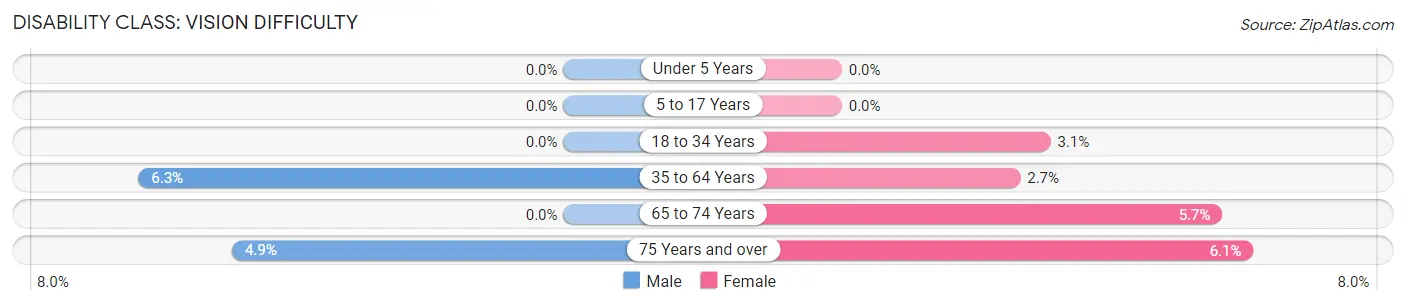
| Age Bracket | Male | Female |
| Under 5 Years | 0 (0.0%) | 0 (0.0%) |
| 5 to 17 Years | 0 (0.0%) | 0 (0.0%) |
| 18 to 34 Years | 0 (0.0%) | 15 (3.1%) |
| 35 to 64 Years | 27 (6.3%) | 14 (2.6%) |
| 65 to 74 Years | 0 (0.0%) | 7 (5.7%) |
| 75 Years and over | 3 (4.9%) | 8 (6.1%) |
Disability Class: Cognitive Difficulty
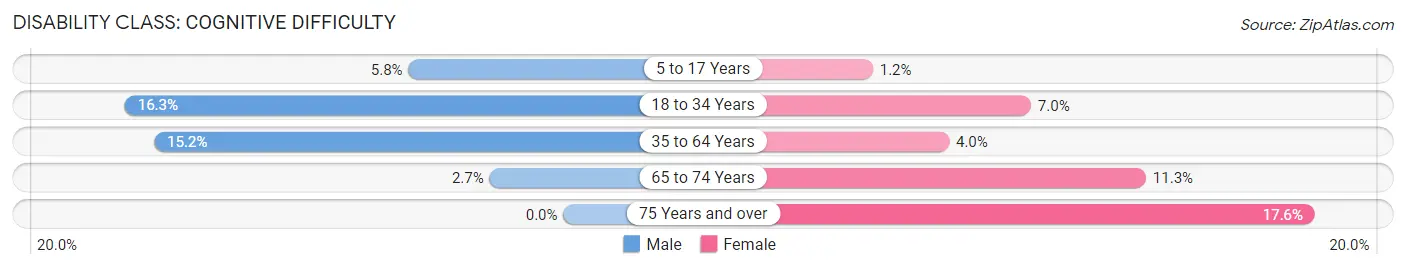
| Age Bracket | Male | Female |
| 5 to 17 Years | 13 (5.8%) | 3 (1.1%) |
| 18 to 34 Years | 97 (16.3%) | 34 (7.0%) |
| 35 to 64 Years | 65 (15.2%) | 21 (4.0%) |
| 65 to 74 Years | 4 (2.7%) | 14 (11.3%) |
| 75 Years and over | 0 (0.0%) | 23 (17.6%) |
Disability Class: Ambulatory Difficulty
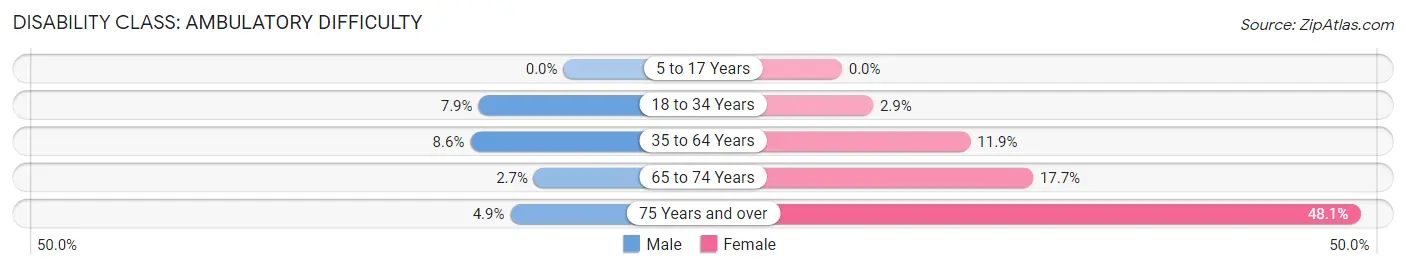
| Age Bracket | Male | Female |
| 5 to 17 Years | 0 (0.0%) | 0 (0.0%) |
| 18 to 34 Years | 47 (7.9%) | 14 (2.9%) |
| 35 to 64 Years | 37 (8.6%) | 63 (11.9%) |
| 65 to 74 Years | 4 (2.7%) | 22 (17.7%) |
| 75 Years and over | 3 (4.9%) | 63 (48.1%) |
Disability Class: Self-Care Difficulty
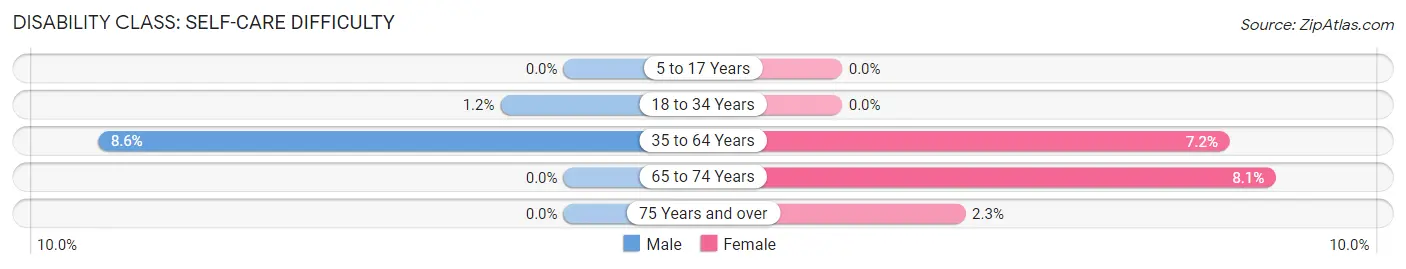
| Age Bracket | Male | Female |
| 5 to 17 Years | 0 (0.0%) | 0 (0.0%) |
| 18 to 34 Years | 7 (1.2%) | 0 (0.0%) |
| 35 to 64 Years | 37 (8.6%) | 38 (7.2%) |
| 65 to 74 Years | 0 (0.0%) | 10 (8.1%) |
| 75 Years and over | 0 (0.0%) | 3 (2.3%) |
Technology Access in Springtown
Computing Device Access in Springtown
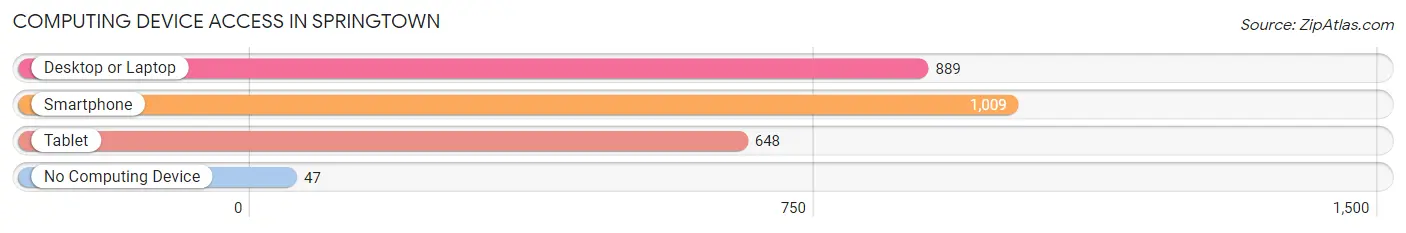
| Device Type | # Households | % Households |
| Desktop or Laptop | 889 | 79.7% |
| Smartphone | 1,009 | 90.4% |
| Tablet | 648 | 58.1% |
| No Computing Device | 47 | 4.2% |
| Total | 1,116 | 100.0% |
Internet Access in Springtown
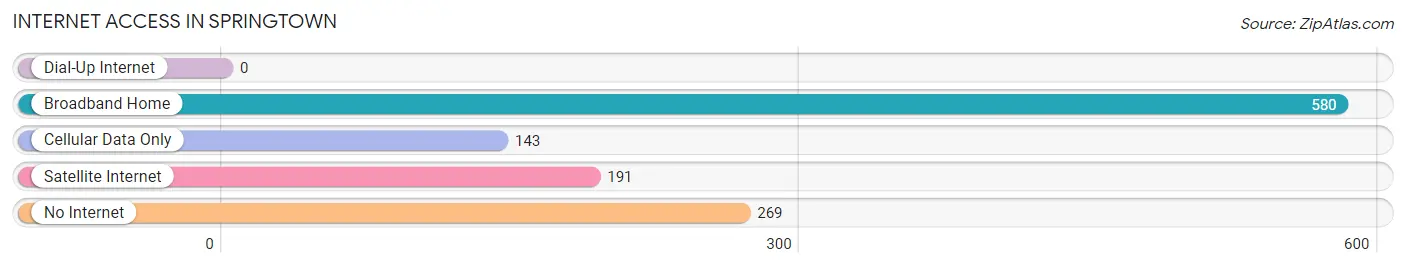
| Internet Type | # Households | % Households |
| Dial-Up Internet | 0 | 0.0% |
| Broadband Home | 580 | 52.0% |
| Cellular Data Only | 143 | 12.8% |
| Satellite Internet | 191 | 17.1% |
| No Internet | 269 | 24.1% |
| Total | 1,116 | 100.0% |
Springtown Summary
Springtown is a small town located in Parker County, Texas, United States. It is situated about 25 miles northwest of Fort Worth and is part of the Dallas-Fort Worth-Arlington metropolitan area. The population of Springtown was 2,717 at the 2010 census.
Geography
Springtown is located at 32°58'25" North, 97°45'45" West (32.973611, -97.762500). According to the United States Census Bureau, the town has a total area of 2.2 square miles (5.7 km2), all of it land.
History
The area that is now Springtown was first settled in the late 1800s by a group of settlers from Missouri. The town was originally known as "Springtown" because of the numerous springs in the area. The town was officially incorporated in 1891.
In the early 1900s, the town was a thriving agricultural community, with cotton, corn, and wheat being the main crops. The town also had a number of businesses, including a bank, a hotel, a blacksmith shop, and a general store.
In the 1950s, the town began to experience a decline in population as people moved away to larger cities. However, in the late 1970s, the town began to experience a resurgence in population as people moved back to the area.
Economy
The economy of Springtown is largely based on agriculture and light manufacturing. The town is home to a number of small businesses, including a feed store, a hardware store, and a lumber yard.
The town is also home to a number of small manufacturing companies, including a plastics manufacturer, a metal fabricator, and a machine shop.
Demographics
As of the 2010 census, there were 2,717 people, 1,039 households, and 745 families residing in the town. The population density was 1,220.7 people per square mile (470.2/km2). There were 1,093 housing units at an average density of 489.2 per square mile (189.2/km2). The racial makeup of the town was 87.2% White, 0.7% African American, 0.7% Native American, 0.2% Asian, 0.1% Pacific Islander, 9.7% from other races, and 1.4% from two or more races. Hispanic or Latino of any race were 18.2% of the population.
There were 1,039 households, out of which 33.2% had children under the age of 18 living with them, 54.2% were married couples living together, 12.2% had a female householder with no husband present, and 28.2% were non-families. 24.2% of all households were made up of individuals, and 11.2% had someone living alone who was 65 years of age or older. The average household size was 2.62 and the average family size was 3.09.
In the town, the population was spread out, with 27.2% under the age of 18, 8.2% from 18 to 24, 27.2% from 25 to 44, 22.2% from 45 to 64, and 15.2% who were 65 years of age or older. The median age was 36 years. For every 100 females, there were 94.2 males. For every 100 females age 18 and over, there were 90.2 males.
The median income for a household in the town was $35,000, and the median income for a family was $41,000. Males had a median income of $30,000 versus $21,000 for females. The per capita income for the town was $17,000. About 10.2% of families and 12.2% of the population were below the poverty line, including 16.2% of those under age 18 and 8.2% of those age 65 or over.
Common Questions
What is Per Capita Income in Springtown?
Per Capita income in Springtown is $28,708.
What is the Median Family Income in Springtown?
Median Family Income in Springtown is $76,053.
What is the Median Household income in Springtown?
Median Household Income in Springtown is $69,500.
What is Income or Wage Gap in Springtown?
Income or Wage Gap in Springtown is 29.1%.
Women in Springtown earn 70.9 cents for every dollar earned by a man.
What is Family Income Deficit in Springtown?
Family Income Deficit in Springtown is $10,704.
Families that are below poverty line in Springtown earn $10,704 less on average than the poverty threshold level.
What is Inequality or Gini Index in Springtown?
Inequality or Gini Index in Springtown is 0.39.
What is the Total Population of Springtown?
Total Population of Springtown is 3,232.
What is the Total Male Population of Springtown?
Total Male Population of Springtown is 1,535.
What is the Total Female Population of Springtown?
Total Female Population of Springtown is 1,697.
What is the Ratio of Males per 100 Females in Springtown?
There are 90.45 Males per 100 Females in Springtown.
What is the Ratio of Females per 100 Males in Springtown?
There are 110.55 Females per 100 Males in Springtown.
What is the Median Population Age in Springtown?
Median Population Age in Springtown is 31.1 Years.
What is the Average Family Size in Springtown
Average Family Size in Springtown is 3.2 People.
What is the Average Household Size in Springtown
Average Household Size in Springtown is 2.9 People.
How Large is the Labor Force in Springtown?
There are 1,743 People in the Labor Forcein in Springtown.
What is the Percentage of People in the Labor Force in Springtown?
67.5% of People are in the Labor Force in Springtown.
What is the Unemployment Rate in Springtown?
Unemployment Rate in Springtown is 2.8%.