Somerville, TX Map & Demographics
Somerville Map
Somerville Overview
$30,565
PER CAPITA INCOME
$69,219
AVG FAMILY INCOME
$59,394
AVG HOUSEHOLD INCOME
53.3%
WAGE / INCOME GAP [ % ]
46.7¢/ $1
WAGE / INCOME GAP [ $ ]
0.52
INEQUALITY / GINI INDEX
1,246
TOTAL POPULATION
571
MALE POPULATION
675
FEMALE POPULATION
84.59
MALES / 100 FEMALES
118.21
FEMALES / 100 MALES
43.4
MEDIAN AGE
2.8
AVG FAMILY SIZE
2.3
AVG HOUSEHOLD SIZE
460
LABOR FORCE [ PEOPLE ]
47.1%
PERCENT IN LABOR FORCE
1.1%
UNEMPLOYMENT RATE
Somerville Zip Codes
Somerville Area Codes
Income in Somerville
Income Overview in Somerville
Per Capita Income in Somerville is $30,565, while median incomes of families and households are $69,219 and $59,394 respectively.
| Characteristic | Number | Measure |
| Per Capita Income | 1,246 | $30,565 |
| Median Family Income | 358 | $69,219 |
| Mean Family Income | 358 | $89,706 |
| Median Household Income | 540 | $59,394 |
| Mean Household Income | 540 | $73,160 |
| Income Deficit | 358 | $0 |
| Wage / Income Gap (%) | 1,246 | 53.30% |
| Wage / Income Gap ($) | 1,246 | 46.70¢ per $1 |
| Gini / Inequality Index | 1,246 | 0.52 |
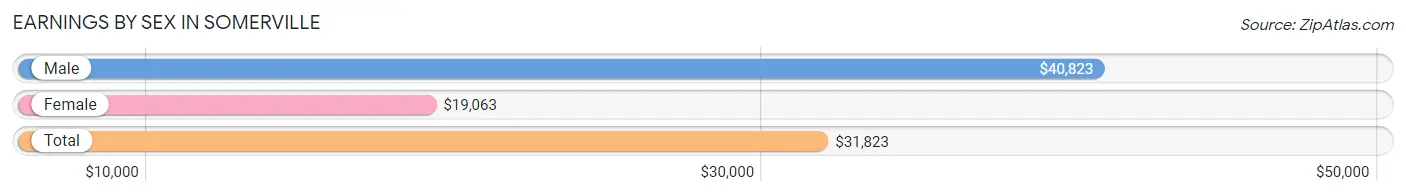
Earnings by Sex in Somerville
Average Earnings in Somerville are $31,823, $40,823 for men and $19,063 for women, a difference of 53.3%.
| Sex | Number | Average Earnings |
| Male | 223 (46.6%) | $40,823 |
| Female | 256 (53.4%) | $19,063 |
| Total | 479 (100.0%) | $31,823 |
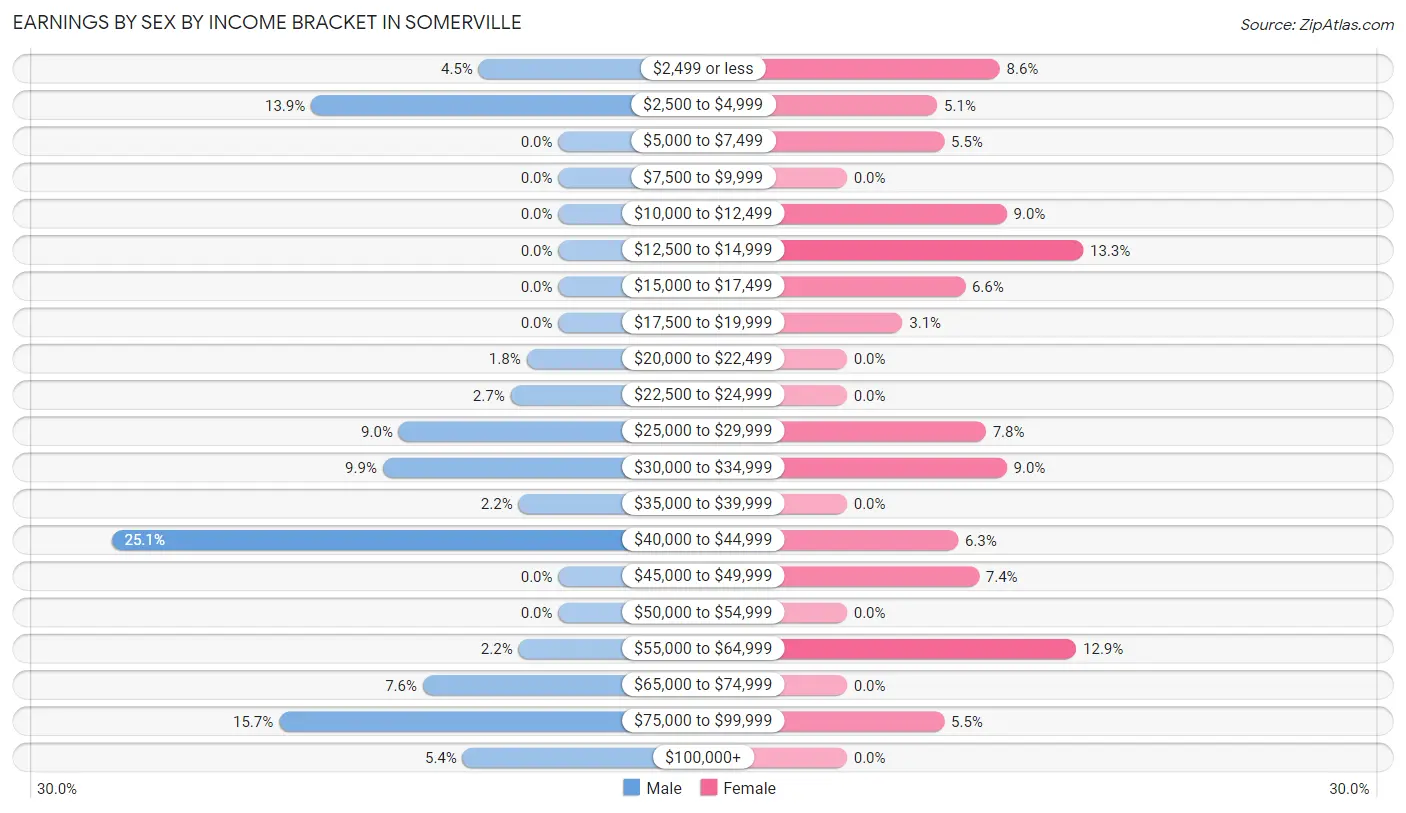
Earnings by Sex by Income Bracket in Somerville
The most common earnings brackets in Somerville are $40,000 to $44,999 for men (56 | 25.1%) and $12,500 to $14,999 for women (34 | 13.3%).
| Income | Male | Female |
| $2,499 or less | 10 (4.5%) | 22 (8.6%) |
| $2,500 to $4,999 | 31 (13.9%) | 13 (5.1%) |
| $5,000 to $7,499 | 0 (0.0%) | 14 (5.5%) |
| $7,500 to $9,999 | 0 (0.0%) | 0 (0.0%) |
| $10,000 to $12,499 | 0 (0.0%) | 23 (9.0%) |
| $12,500 to $14,999 | 0 (0.0%) | 34 (13.3%) |
| $15,000 to $17,499 | 0 (0.0%) | 17 (6.6%) |
| $17,500 to $19,999 | 0 (0.0%) | 8 (3.1%) |
| $20,000 to $22,499 | 4 (1.8%) | 0 (0.0%) |
| $22,500 to $24,999 | 6 (2.7%) | 0 (0.0%) |
| $25,000 to $29,999 | 20 (9.0%) | 20 (7.8%) |
| $30,000 to $34,999 | 22 (9.9%) | 23 (9.0%) |
| $35,000 to $39,999 | 5 (2.2%) | 0 (0.0%) |
| $40,000 to $44,999 | 56 (25.1%) | 16 (6.2%) |
| $45,000 to $49,999 | 0 (0.0%) | 19 (7.4%) |
| $50,000 to $54,999 | 0 (0.0%) | 0 (0.0%) |
| $55,000 to $64,999 | 5 (2.2%) | 33 (12.9%) |
| $65,000 to $74,999 | 17 (7.6%) | 0 (0.0%) |
| $75,000 to $99,999 | 35 (15.7%) | 14 (5.5%) |
| $100,000+ | 12 (5.4%) | 0 (0.0%) |
| Total | 223 (100.0%) | 256 (100.0%) |
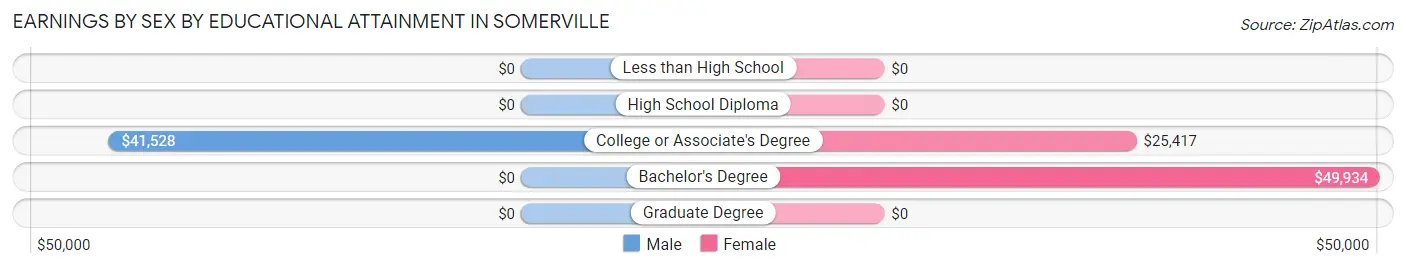
Earnings by Sex by Educational Attainment in Somerville
Average earnings in Somerville are $41,646 for men and $25,313 for women, a difference of 39.2%. Men with an educational attainment of college or associate's degree enjoy the highest average annual earnings of $41,528, while those with college or associate's degree education earn the least with $41,528. Women with an educational attainment of bachelor's degree earn the most with the average annual earnings of $49,934, while those with college or associate's degree education have the smallest earnings of $25,417.
| Educational Attainment | Male Income | Female Income |
| Less than High School | - | - |
| High School Diploma | - | - |
| College or Associate's Degree | $41,528 | $25,417 |
| Bachelor's Degree | - | - |
| Graduate Degree | - | - |
| Total | $41,646 | $25,313 |
Family Income in Somerville
Family Income Brackets in Somerville
According to the Somerville family income data, there are 100 families falling into the $50,000 to $74,999 income range, which is the most common income bracket and makes up 27.9% of all families.
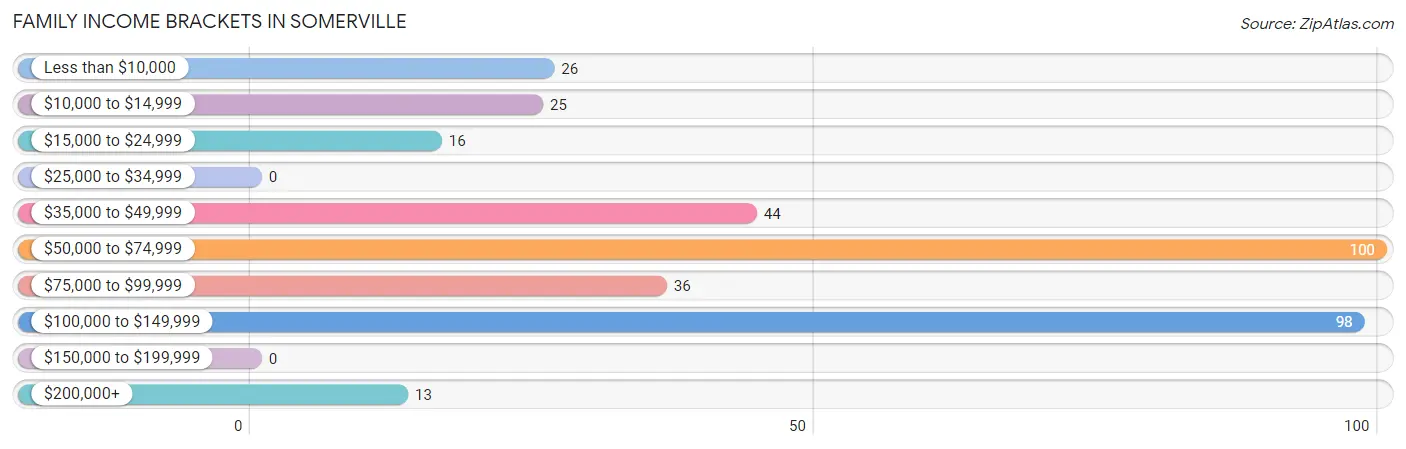
| Income Bracket | # Families | % Families |
| Less than $10,000 | 26 | 7.3% |
| $10,000 to $14,999 | 25 | 7.0% |
| $15,000 to $24,999 | 16 | 4.5% |
| $25,000 to $34,999 | 0 | 0.0% |
| $35,000 to $49,999 | 44 | 12.3% |
| $50,000 to $74,999 | 100 | 27.9% |
| $75,000 to $99,999 | 36 | 10.1% |
| $100,000 to $149,999 | 98 | 27.4% |
| $150,000 to $199,999 | 0 | 0.0% |
| $200,000+ | 13 | 3.6% |
Family Income by Famaliy Size in Somerville
5-person families (54 | 15.1%) account for the highest median family income in Somerville with $75,000 per family, while 2-person families (219 | 61.2%) have the highest median income of $33,188 per family member.
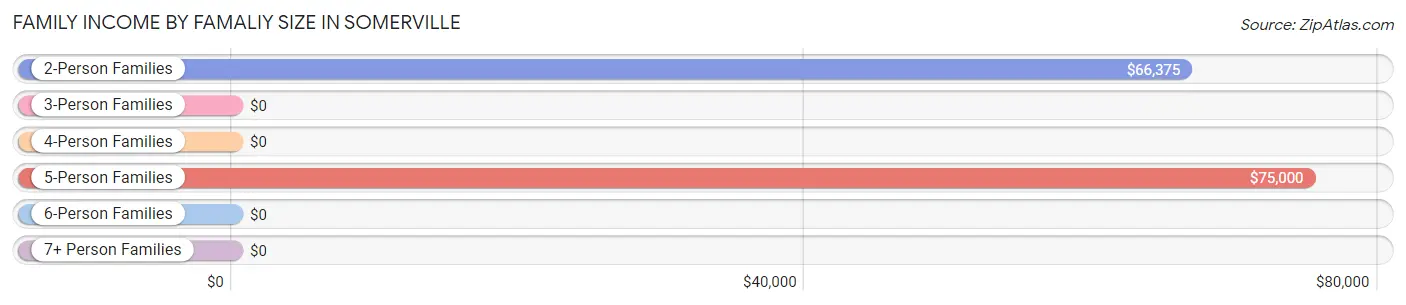
| Income Bracket | # Families | Median Income |
| 2-Person Families | 219 (61.2%) | $66,375 |
| 3-Person Families | 36 (10.1%) | $0 |
| 4-Person Families | 32 (8.9%) | $0 |
| 5-Person Families | 54 (15.1%) | $75,000 |
| 6-Person Families | 0 (0.0%) | $0 |
| 7+ Person Families | 17 (4.8%) | $0 |
| Total | 358 (100.0%) | $69,219 |
Family Income by Number of Earners in Somerville
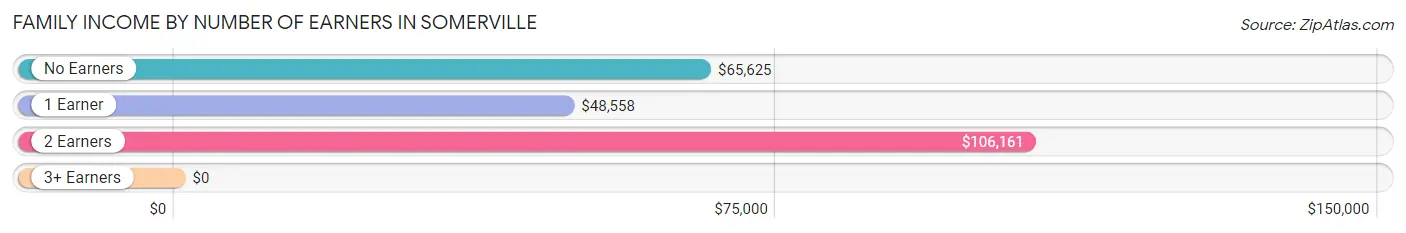
| Number of Earners | # Families | Median Income |
| No Earners | 85 (23.7%) | $65,625 |
| 1 Earner | 147 (41.1%) | $48,558 |
| 2 Earners | 109 (30.4%) | $106,161 |
| 3+ Earners | 17 (4.8%) | $0 |
| Total | 358 (100.0%) | $69,219 |
Household Income in Somerville
Household Income Brackets in Somerville
With 143 households falling in the category, the $50,000 to $74,999 income range is the most frequent in Somerville, accounting for 26.5% of all households.
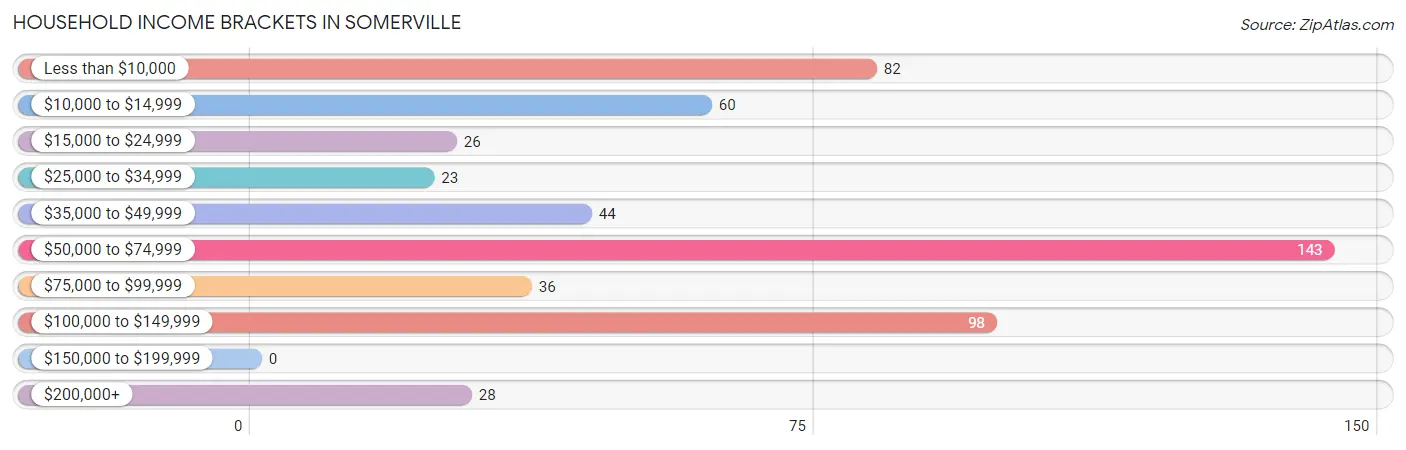
| Income Bracket | # Households | % Households |
| Less than $10,000 | 82 | 15.2% |
| $10,000 to $14,999 | 60 | 11.1% |
| $15,000 to $24,999 | 26 | 4.8% |
| $25,000 to $34,999 | 23 | 4.3% |
| $35,000 to $49,999 | 44 | 8.1% |
| $50,000 to $74,999 | 143 | 26.5% |
| $75,000 to $99,999 | 36 | 6.7% |
| $100,000 to $149,999 | 98 | 18.1% |
| $150,000 to $199,999 | 0 | 0.0% |
| $200,000+ | 28 | 5.2% |
Household Income by Householder Age in Somerville
The median household income in Somerville is $59,394, with the highest median household income of $71,204 found in the 25 to 44 years age bracket for the primary householder. A total of 164 households (30.4%) fall into this category.
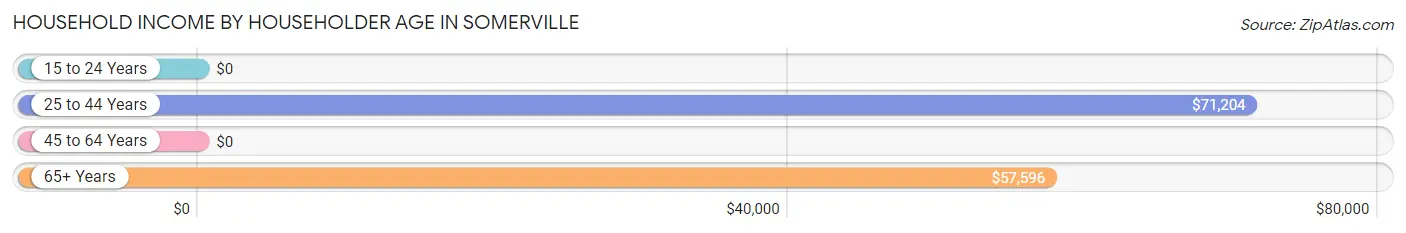
| Income Bracket | # Households | Median Income |
| 15 to 24 Years | 0 (0.0%) | $0 |
| 25 to 44 Years | 164 (30.4%) | $71,204 |
| 45 to 64 Years | 121 (22.4%) | $0 |
| 65+ Years | 255 (47.2%) | $57,596 |
| Total | 540 (100.0%) | $59,394 |
Poverty in Somerville
Income Below Poverty by Sex and Age in Somerville
With 14.5% poverty level for males and 29.8% for females among the residents of Somerville, 25 to 34 year old males and 45 to 54 year old females are the most vulnerable to poverty, with 26 males (72.2%) and 24 females (100.0%) in their respective age groups living below the poverty level.
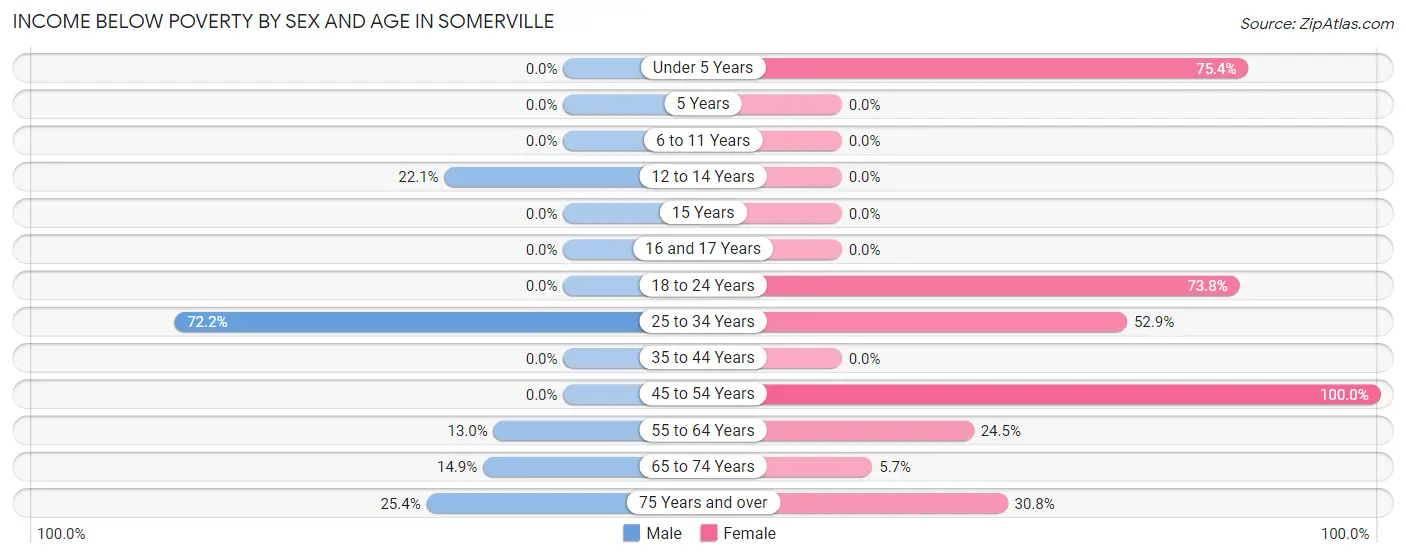
| Age Bracket | Male | Female |
| Under 5 Years | 0 (0.0%) | 43 (75.4%) |
| 5 Years | 0 (0.0%) | 0 (0.0%) |
| 6 to 11 Years | 0 (0.0%) | 0 (0.0%) |
| 12 to 14 Years | 17 (22.1%) | 0 (0.0%) |
| 15 Years | 0 (0.0%) | 0 (0.0%) |
| 16 and 17 Years | 0 (0.0%) | 0 (0.0%) |
| 18 to 24 Years | 0 (0.0%) | 31 (73.8%) |
| 25 to 34 Years | 26 (72.2%) | 45 (52.9%) |
| 35 to 44 Years | 0 (0.0%) | 0 (0.0%) |
| 45 to 54 Years | 0 (0.0%) | 24 (100.0%) |
| 55 to 64 Years | 7 (13.0%) | 24 (24.5%) |
| 65 to 74 Years | 17 (14.9%) | 6 (5.7%) |
| 75 Years and over | 16 (25.4%) | 28 (30.8%) |
| Total | 83 (14.5%) | 201 (29.8%) |
Income Above Poverty by Sex and Age in Somerville
According to the poverty statistics in Somerville, males aged under 5 years and females aged 5 years are the age groups that are most secure financially, with 100.0% of males and 100.0% of females in these age groups living above the poverty line.
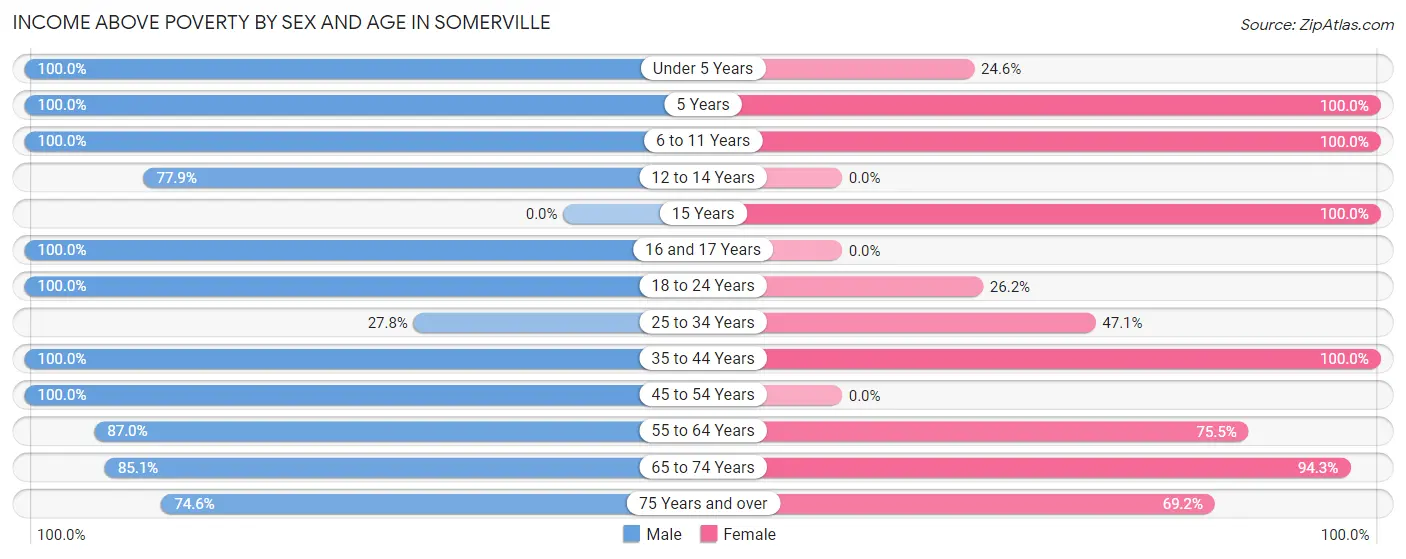
| Age Bracket | Male | Female |
| Under 5 Years | 17 (100.0%) | 14 (24.6%) |
| 5 Years | 4 (100.0%) | 14 (100.0%) |
| 6 to 11 Years | 23 (100.0%) | 65 (100.0%) |
| 12 to 14 Years | 60 (77.9%) | 0 (0.0%) |
| 15 Years | 0 (0.0%) | 13 (100.0%) |
| 16 and 17 Years | 13 (100.0%) | 0 (0.0%) |
| 18 to 24 Years | 27 (100.0%) | 11 (26.2%) |
| 25 to 34 Years | 10 (27.8%) | 40 (47.1%) |
| 35 to 44 Years | 113 (100.0%) | 80 (100.0%) |
| 45 to 54 Years | 30 (100.0%) | 0 (0.0%) |
| 55 to 64 Years | 47 (87.0%) | 74 (75.5%) |
| 65 to 74 Years | 97 (85.1%) | 100 (94.3%) |
| 75 Years and over | 47 (74.6%) | 63 (69.2%) |
| Total | 488 (85.5%) | 474 (70.2%) |
Income Below Poverty Among Married-Couple Families in Somerville
The poverty statistics for married-couple families in Somerville show that 13.3% or 42 of the total 315 families live below the poverty line. Families with 1 or 2 children have the highest poverty rate of 65.0%, comprising of 26 families. On the other hand, families with 3 or 4 children have the lowest poverty rate of 0.0%, which includes 0 families.
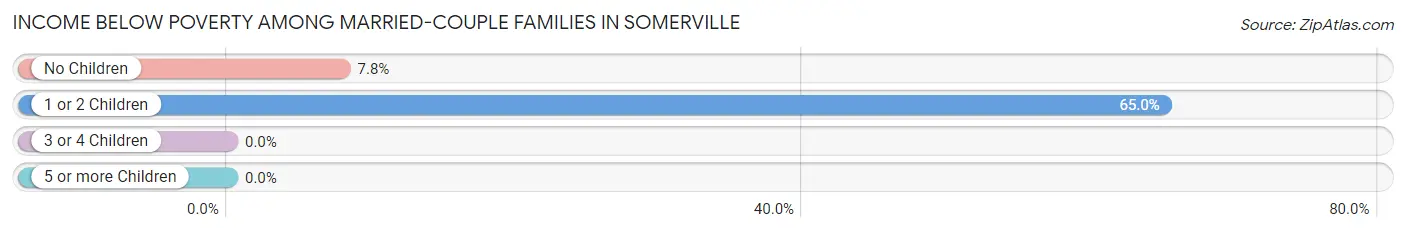
| Children | Above Poverty | Below Poverty |
| No Children | 188 (92.2%) | 16 (7.8%) |
| 1 or 2 Children | 14 (35.0%) | 26 (65.0%) |
| 3 or 4 Children | 54 (100.0%) | 0 (0.0%) |
| 5 or more Children | 17 (100.0%) | 0 (0.0%) |
| Total | 273 (86.7%) | 42 (13.3%) |
Income Below Poverty Among Single-Parent Households in Somerville
According to the poverty data in Somerville, 50.0% or 2 single-father households and 59.0% or 23 single-mother households are living below the poverty line. Among single-father households, those with 1 or 2 children have the highest poverty rate, with 2 households (100.0%) experiencing poverty. Likewise, among single-mother households, those with 1 or 2 children have the highest poverty rate, with 23 households (100.0%) falling below the poverty line.
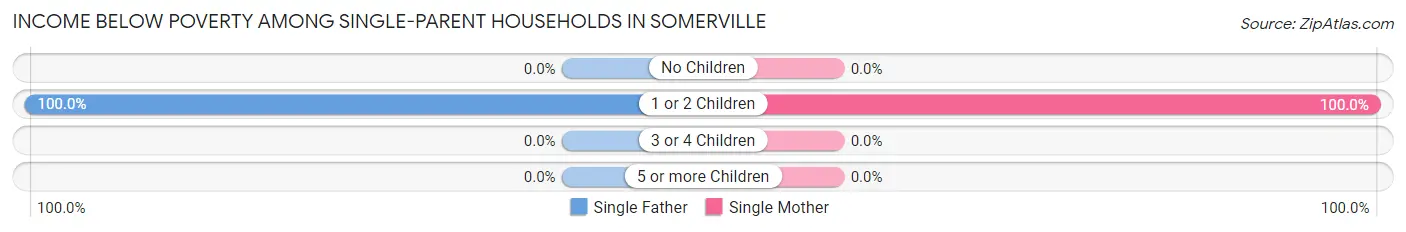
| Children | Single Father | Single Mother |
| No Children | 0 (0.0%) | 0 (0.0%) |
| 1 or 2 Children | 2 (100.0%) | 23 (100.0%) |
| 3 or 4 Children | 0 (0.0%) | 0 (0.0%) |
| 5 or more Children | 0 (0.0%) | 0 (0.0%) |
| Total | 2 (50.0%) | 23 (59.0%) |
Income Below Poverty Among Married-Couple vs Single-Parent Households in Somerville
The poverty data for Somerville shows that 42 of the married-couple family households (13.3%) and 25 of the single-parent households (58.1%) are living below the poverty level. Within the married-couple family households, those with 1 or 2 children have the highest poverty rate, with 26 households (65.0%) falling below the poverty line. Among the single-parent households, those with 1 or 2 children have the highest poverty rate, with 25 household (100.0%) living below poverty.
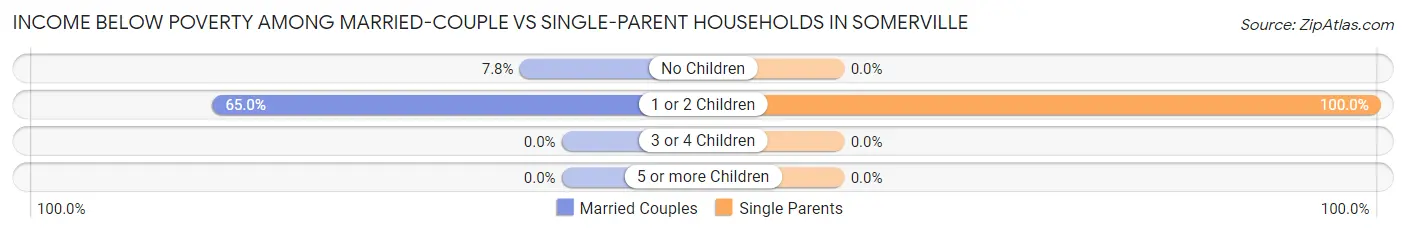
| Children | Married-Couple Families | Single-Parent Households |
| No Children | 16 (7.8%) | 0 (0.0%) |
| 1 or 2 Children | 26 (65.0%) | 25 (100.0%) |
| 3 or 4 Children | 0 (0.0%) | 0 (0.0%) |
| 5 or more Children | 0 (0.0%) | 0 (0.0%) |
| Total | 42 (13.3%) | 25 (58.1%) |
Race in Somerville
The most populous races in Somerville are White / Caucasian (725 | 58.2%), Hispanic or Latino (406 | 32.6%), and Black / African American (284 | 22.8%).
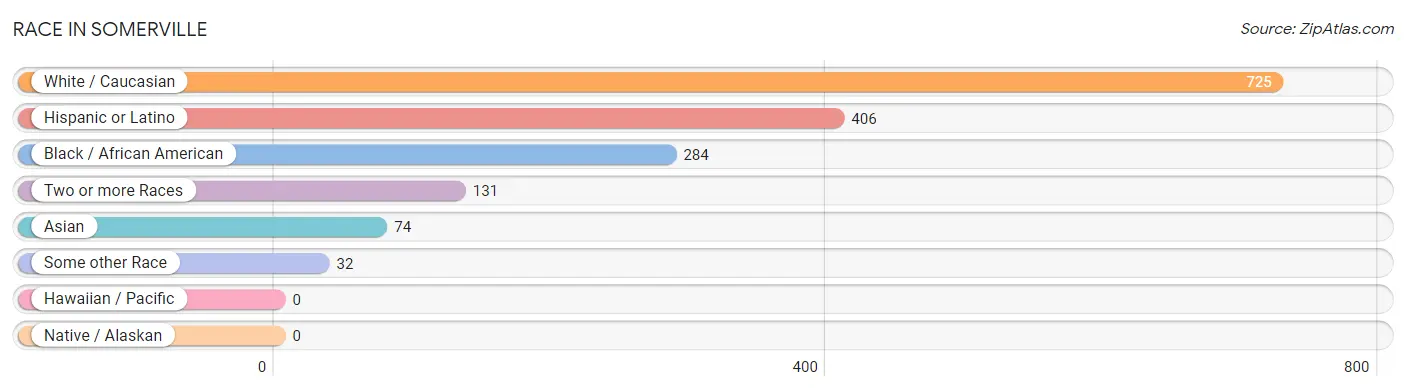
| Race | # Population | % Population |
| Asian | 74 | 5.9% |
| Black / African American | 284 | 22.8% |
| Hawaiian / Pacific | 0 | 0.0% |
| Hispanic or Latino | 406 | 32.6% |
| Native / Alaskan | 0 | 0.0% |
| White / Caucasian | 725 | 58.2% |
| Two or more Races | 131 | 10.5% |
| Some other Race | 32 | 2.6% |
| Total | 1,246 | 100.0% |
Ancestry in Somerville
The most populous ancestries reported in Somerville are Mexican (406 | 32.6%), German (203 | 16.3%), Korean (110 | 8.8%), Irish (54 | 4.3%), and American (42 | 3.4%), together accounting for 65.4% of all Somerville residents.
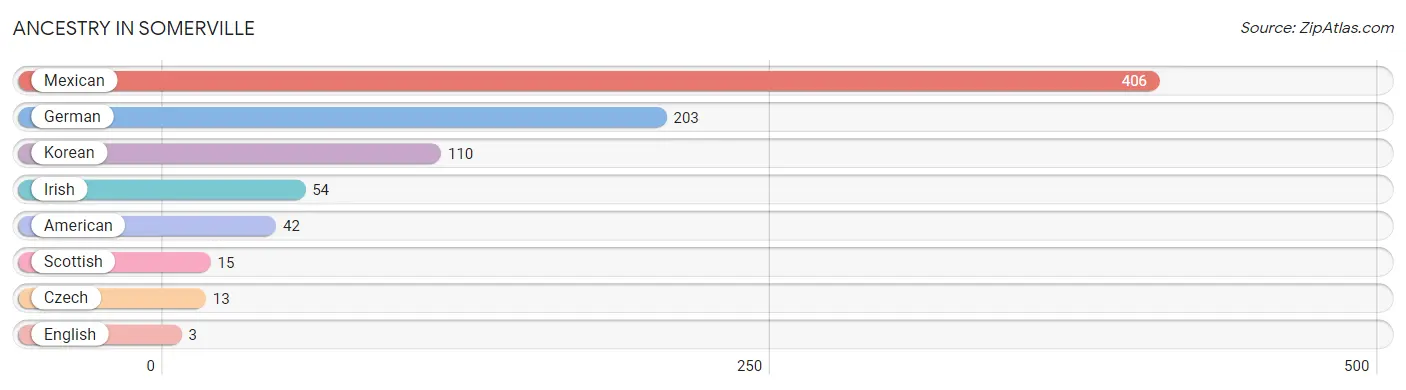
| Ancestry | # Population | % Population |
| American | 42 | 3.4% |
| Czech | 13 | 1.0% |
| English | 3 | 0.2% |
| German | 203 | 16.3% |
| Irish | 54 | 4.3% |
| Korean | 110 | 8.8% |
| Mexican | 406 | 32.6% |
| Scottish | 15 | 1.2% | View All 8 Rows |
Immigrants in Somerville
The most numerous immigrant groups reported in Somerville came from Central America (127 | 10.2%), Latin America (127 | 10.2%), and Mexico (127 | 10.2%), together accounting for 30.6% of all Somerville residents.
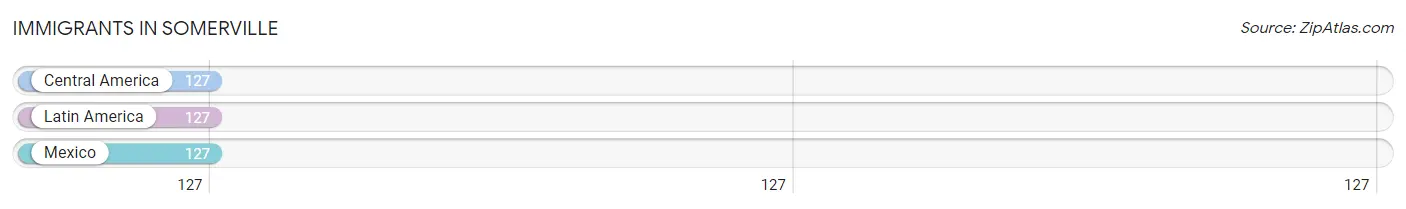
| Immigration Origin | # Population | % Population |
| Central America | 127 | 10.2% |
| Latin America | 127 | 10.2% |
| Mexico | 127 | 10.2% | View All 3 Rows |
Sex and Age in Somerville
Sex and Age in Somerville
The most populous age groups in Somerville are 10 to 14 Years (96 | 16.8%) for men and 30 to 34 Years (62 | 9.2%) for women.
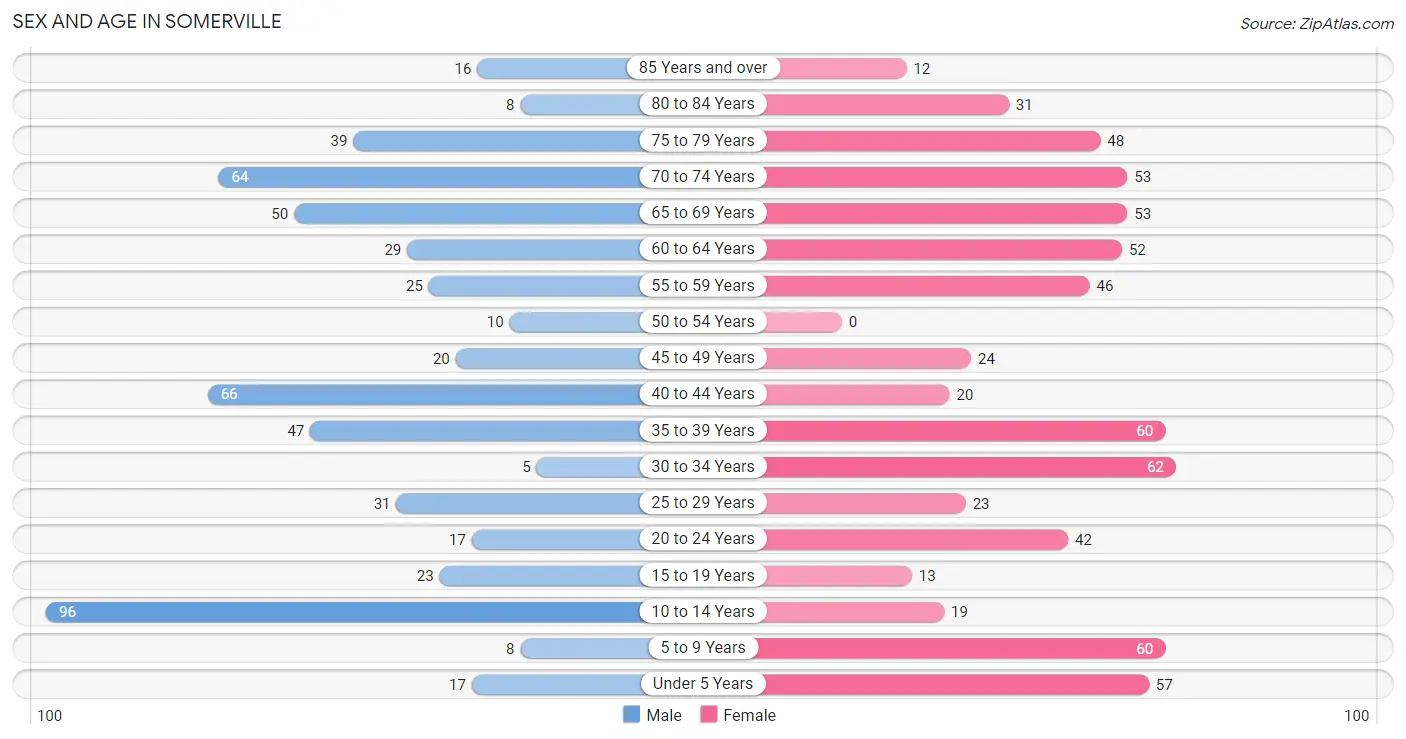
| Age Bracket | Male | Female |
| Under 5 Years | 17 (3.0%) | 57 (8.4%) |
| 5 to 9 Years | 8 (1.4%) | 60 (8.9%) |
| 10 to 14 Years | 96 (16.8%) | 19 (2.8%) |
| 15 to 19 Years | 23 (4.0%) | 13 (1.9%) |
| 20 to 24 Years | 17 (3.0%) | 42 (6.2%) |
| 25 to 29 Years | 31 (5.4%) | 23 (3.4%) |
| 30 to 34 Years | 5 (0.9%) | 62 (9.2%) |
| 35 to 39 Years | 47 (8.2%) | 60 (8.9%) |
| 40 to 44 Years | 66 (11.6%) | 20 (3.0%) |
| 45 to 49 Years | 20 (3.5%) | 24 (3.6%) |
| 50 to 54 Years | 10 (1.8%) | 0 (0.0%) |
| 55 to 59 Years | 25 (4.4%) | 46 (6.8%) |
| 60 to 64 Years | 29 (5.1%) | 52 (7.7%) |
| 65 to 69 Years | 50 (8.8%) | 53 (7.9%) |
| 70 to 74 Years | 64 (11.2%) | 53 (7.9%) |
| 75 to 79 Years | 39 (6.8%) | 48 (7.1%) |
| 80 to 84 Years | 8 (1.4%) | 31 (4.6%) |
| 85 Years and over | 16 (2.8%) | 12 (1.8%) |
| Total | 571 (100.0%) | 675 (100.0%) |
Families and Households in Somerville
Median Family Size in Somerville
The median family size in Somerville is 2.83 persons per family, with single male/father families (4 | 1.1%) accounting for the largest median family size of 6.75 persons per family. On the other hand, single female/mother families (39 | 10.9%) represent the smallest median family size with 2.41 persons per family.
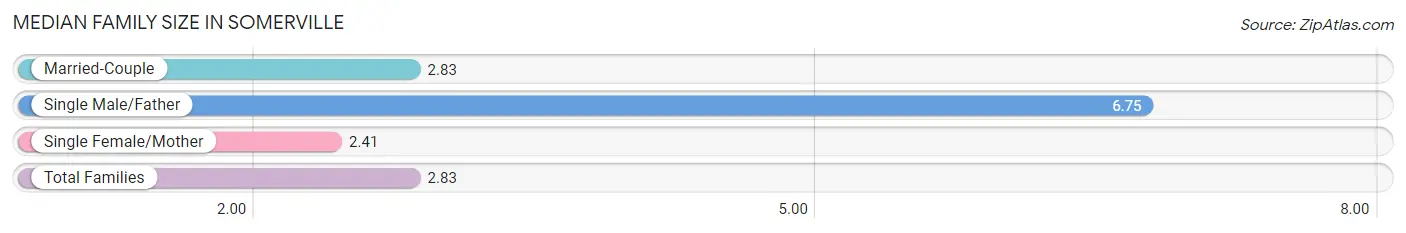
| Family Type | # Families | Family Size |
| Married-Couple | 315 (88.0%) | 2.83 |
| Single Male/Father | 4 (1.1%) | 6.75 |
| Single Female/Mother | 39 (10.9%) | 2.41 |
| Total Families | 358 (100.0%) | 2.83 |
Median Household Size in Somerville
The median household size in Somerville is 2.31 persons per household, with single male/father households (4 | 0.7%) accounting for the largest median household size of 8.25 persons per household. non-family households (182 | 33.7%) represent the smallest median household size with 1.07 persons per household.
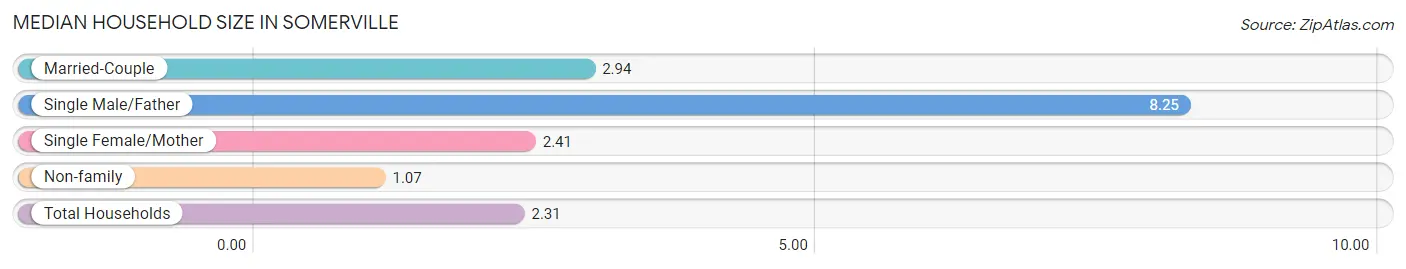
| Household Type | # Households | Household Size |
| Married-Couple | 315 (58.3%) | 2.94 |
| Single Male/Father | 4 (0.7%) | 8.25 |
| Single Female/Mother | 39 (7.2%) | 2.41 |
| Non-family | 182 (33.7%) | 1.07 |
| Total Households | 540 (100.0%) | 2.31 |
Household Size by Marriage Status in Somerville
Out of a total of 540 households in Somerville, 358 (66.3%) are family households, while 182 (33.7%) are nonfamily households. The most numerous type of family households are 2-person households, comprising 191, and the most common type of nonfamily households are 1-person households, comprising 160.
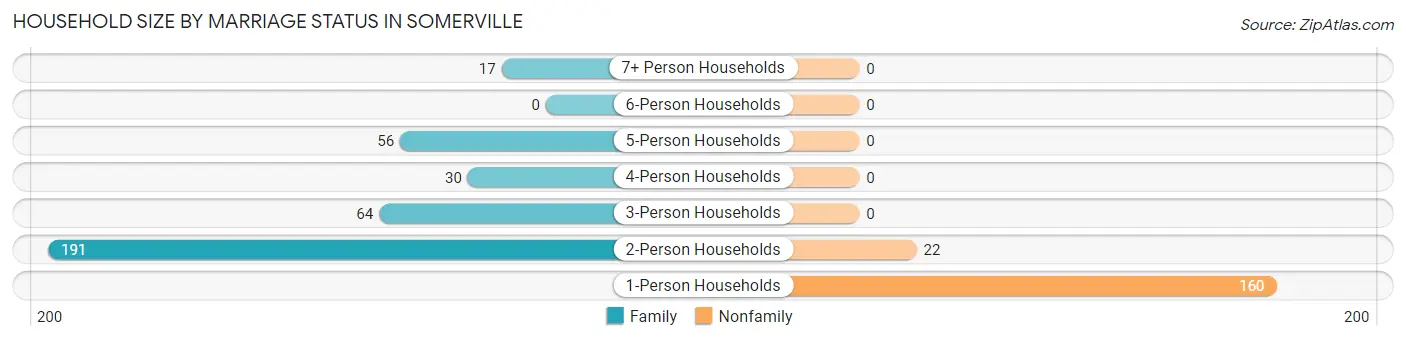
| Household Size | Family Households | Nonfamily Households |
| 1-Person Households | - | 160 (29.6%) |
| 2-Person Households | 191 (35.4%) | 22 (4.1%) |
| 3-Person Households | 64 (11.8%) | 0 (0.0%) |
| 4-Person Households | 30 (5.6%) | 0 (0.0%) |
| 5-Person Households | 56 (10.4%) | 0 (0.0%) |
| 6-Person Households | 0 (0.0%) | 0 (0.0%) |
| 7+ Person Households | 17 (3.2%) | 0 (0.0%) |
| Total | 358 (66.3%) | 182 (33.7%) |
Female Fertility in Somerville
Fertility by Age in Somerville
Average fertility rate in Somerville is 20.0 births per 1,000 women. Women in the age bracket of 20 to 34 years have the highest fertility rate with 39.0 births per 1,000 women. Women in the age bracket of 20 to 34 years acount for 100.0% of all women with births.
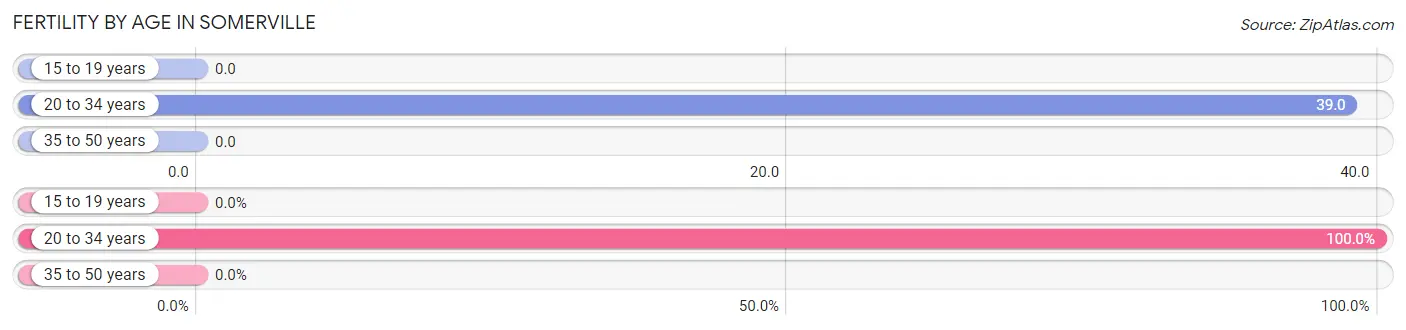
| Age Bracket | Women with Births | Births / 1,000 Women |
| 15 to 19 years | 0 (0.0%) | 0.0 |
| 20 to 34 years | 5 (100.0%) | 39.0 |
| 35 to 50 years | 0 (0.0%) | 0.0 |
| Total | 5 (100.0%) | 20.0 |
Fertility by Age by Marriage Status in Somerville
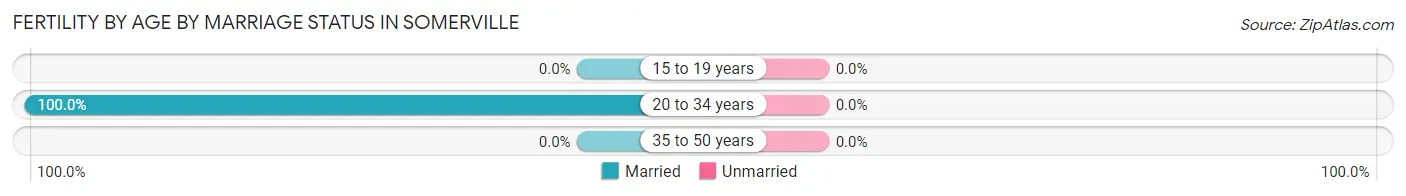
| Age Bracket | Married | Unmarried |
| 15 to 19 years | 0 (0.0%) | 0 (0.0%) |
| 20 to 34 years | 5 (100.0%) | 0 (0.0%) |
| 35 to 50 years | 0 (0.0%) | 0 (0.0%) |
| Total | 5 (100.0%) | 0 (0.0%) |
Fertility by Education in Somerville
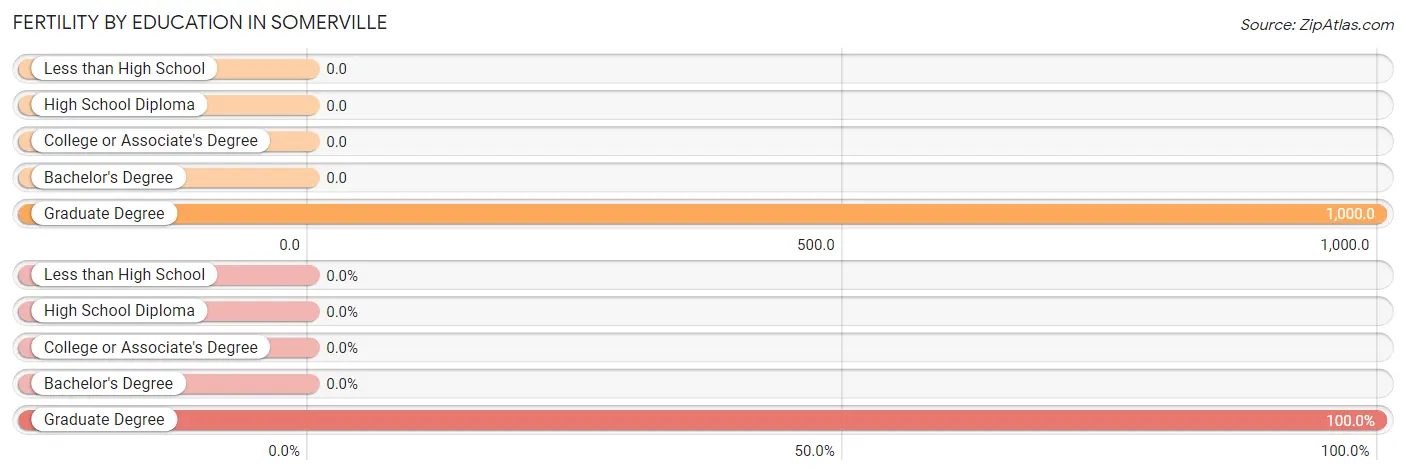
| Educational Attainment | Women with Births | Births / 1,000 Women |
| Less than High School | 0 (0.0%) | 0.0 |
| High School Diploma | 0 (0.0%) | 0.0 |
| College or Associate's Degree | 0 (0.0%) | 0.0 |
| Bachelor's Degree | 0 (0.0%) | 0.0 |
| Graduate Degree | 5 (100.0%) | 1,000.0 |
| Total | 5 (100.0%) | 20.0 |
Fertility by Education by Marriage Status in Somerville
| Educational Attainment | Married | Unmarried |
| Less than High School | 0 (0.0%) | 0 (0.0%) |
| High School Diploma | 0 (0.0%) | 0 (0.0%) |
| College or Associate's Degree | 0 (0.0%) | 0 (0.0%) |
| Bachelor's Degree | 0 (0.0%) | 0 (0.0%) |
| Graduate Degree | 5 (100.0%) | 0 (0.0%) |
| Total | 5 (100.0%) | 0 (0.0%) |
Employment Characteristics in Somerville
Employment by Class of Employer in Somerville
Among the 450 employed individuals in Somerville, private company employees (305 | 67.8%), not-for-profit organizations (57 | 12.7%), and state government employees (47 | 10.4%) make up the most common classes of employment.
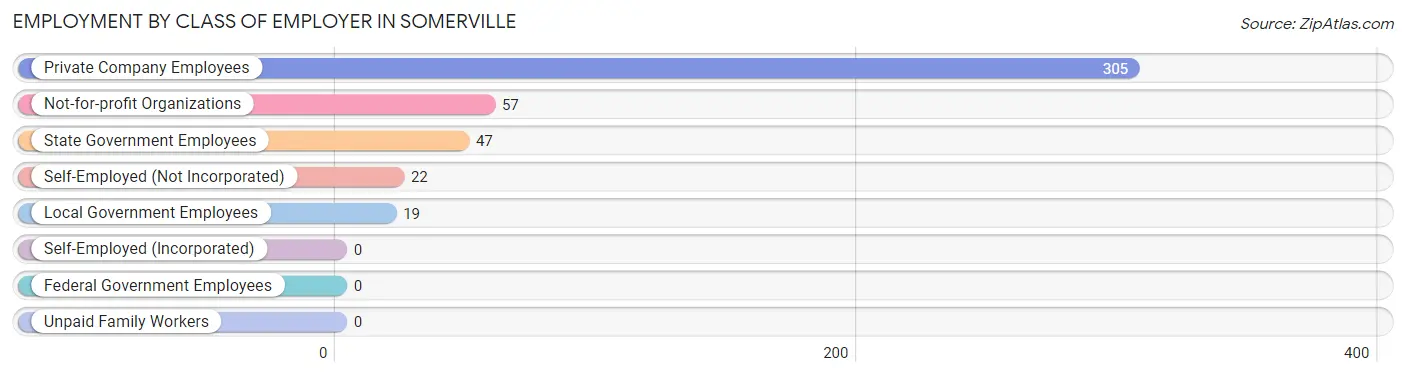
| Employer Class | # Employees | % Employees |
| Private Company Employees | 305 | 67.8% |
| Self-Employed (Incorporated) | 0 | 0.0% |
| Self-Employed (Not Incorporated) | 22 | 4.9% |
| Not-for-profit Organizations | 57 | 12.7% |
| Local Government Employees | 19 | 4.2% |
| State Government Employees | 47 | 10.4% |
| Federal Government Employees | 0 | 0.0% |
| Unpaid Family Workers | 0 | 0.0% |
| Total | 450 | 100.0% |
Employment Status by Age in Somerville
According to the labor force statistics for Somerville, out of the total population over 16 years of age (976), 47.1% or 460 individuals are in the labor force, with 1.1% or 5 of them unemployed. The age group with the highest labor force participation rate is 25 to 29 years, with 100.0% or 54 individuals in the labor force. Within the labor force, the 35 to 44 years age range has the highest percentage of unemployed individuals, with 3.5% or 5 of them being unemployed.
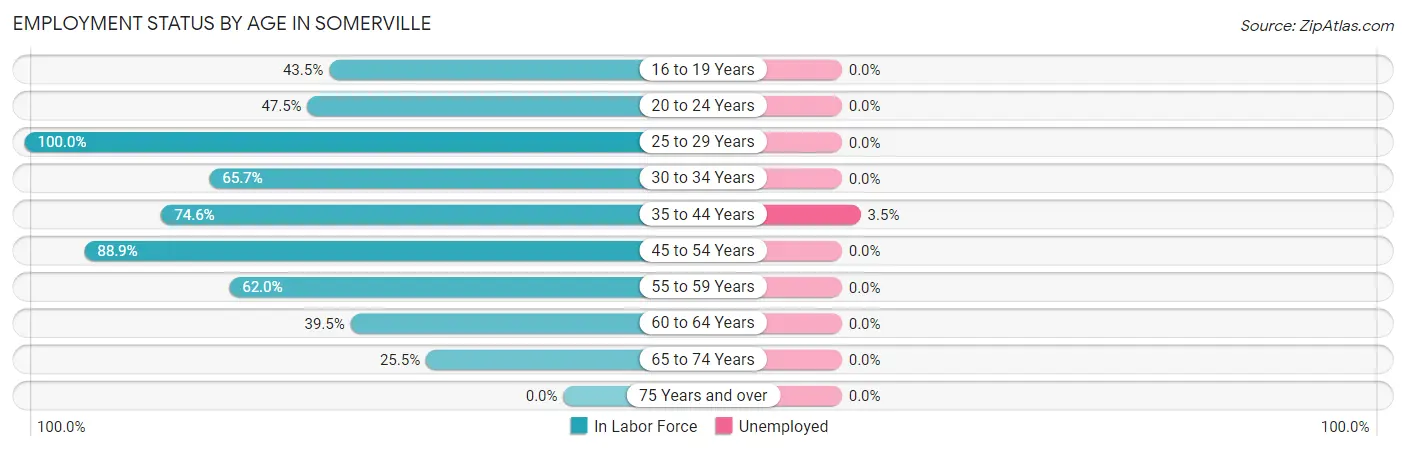
| Age Bracket | In Labor Force | Unemployed |
| 16 to 19 Years | 10 (43.5%) | 0 (0.0%) |
| 20 to 24 Years | 28 (47.5%) | 0 (0.0%) |
| 25 to 29 Years | 54 (100.0%) | 0 (0.0%) |
| 30 to 34 Years | 44 (65.7%) | 0 (0.0%) |
| 35 to 44 Years | 144 (74.6%) | 5 (3.5%) |
| 45 to 54 Years | 48 (88.9%) | 0 (0.0%) |
| 55 to 59 Years | 44 (62.0%) | 0 (0.0%) |
| 60 to 64 Years | 32 (39.5%) | 0 (0.0%) |
| 65 to 74 Years | 56 (25.5%) | 0 (0.0%) |
| 75 Years and over | 0 (0.0%) | 0 (0.0%) |
| Total | 460 (47.1%) | 5 (1.1%) |
Employment Status by Educational Attainment in Somerville
According to labor force statistics for Somerville, 70.4% of individuals (366) out of the total population between 25 and 64 years of age (520) are in the labor force, with 1.4% or 5 of them being unemployed. The group with the highest labor force participation rate are those with the educational attainment of college / associate degree, with 89.4% or 168 individuals in the labor force. Within the labor force, individuals with college / associate degree education have the highest percentage of unemployment, with 3.0% or 5 of them being unemployed.
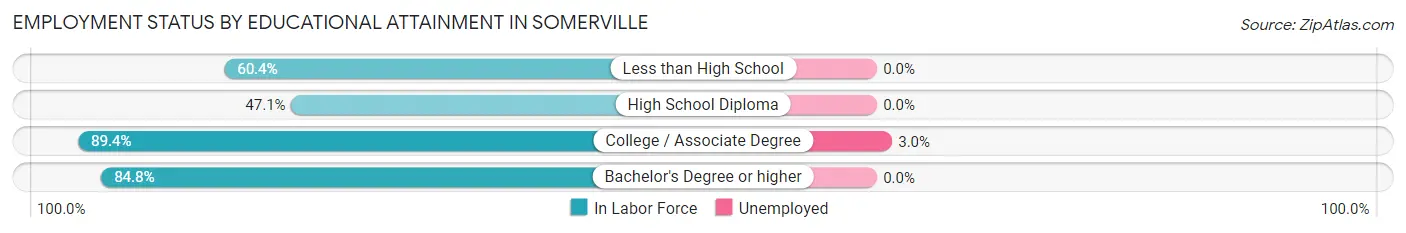
| Educational Attainment | In Labor Force | Unemployed |
| Less than High School | 32 (60.4%) | 0 (0.0%) |
| High School Diploma | 88 (47.1%) | 0 (0.0%) |
| College / Associate Degree | 168 (89.4%) | 6 (3.0%) |
| Bachelor's Degree or higher | 78 (84.8%) | 0 (0.0%) |
| Total | 366 (70.4%) | 7 (1.4%) |
Employment Occupations by Sex in Somerville
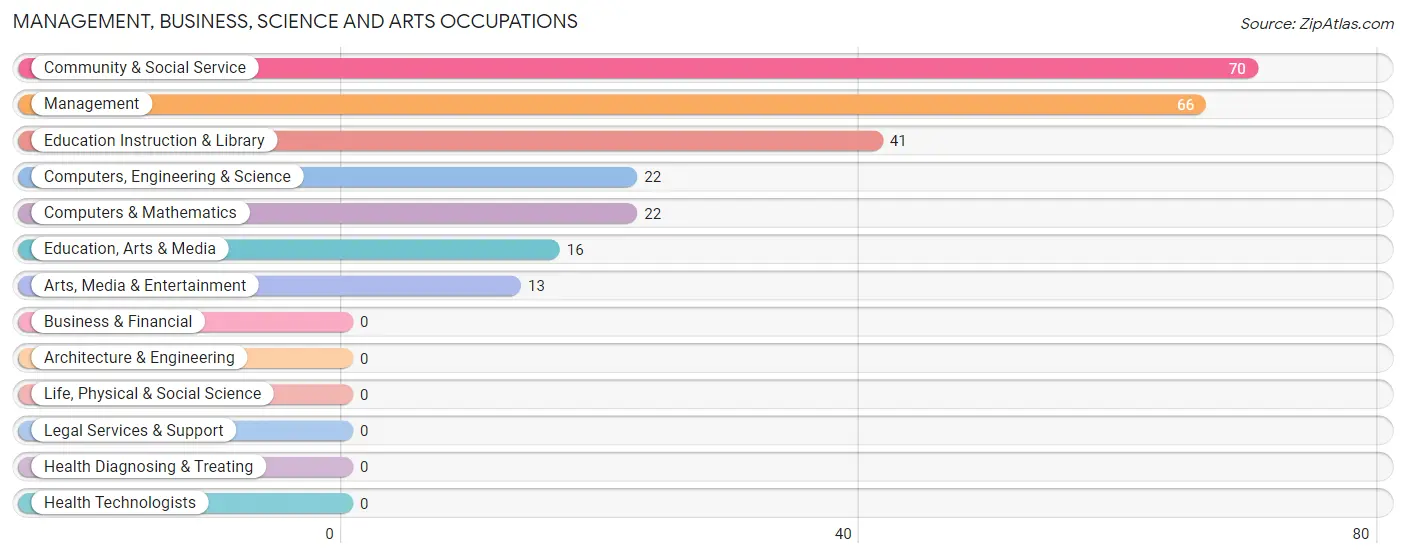
Management, Business, Science and Arts Occupations
The most common Management, Business, Science and Arts occupations in Somerville are Community & Social Service (70 | 15.4%), Management (66 | 14.5%), Education Instruction & Library (41 | 9.0%), Computers, Engineering & Science (22 | 4.8%), and Computers & Mathematics (22 | 4.8%).
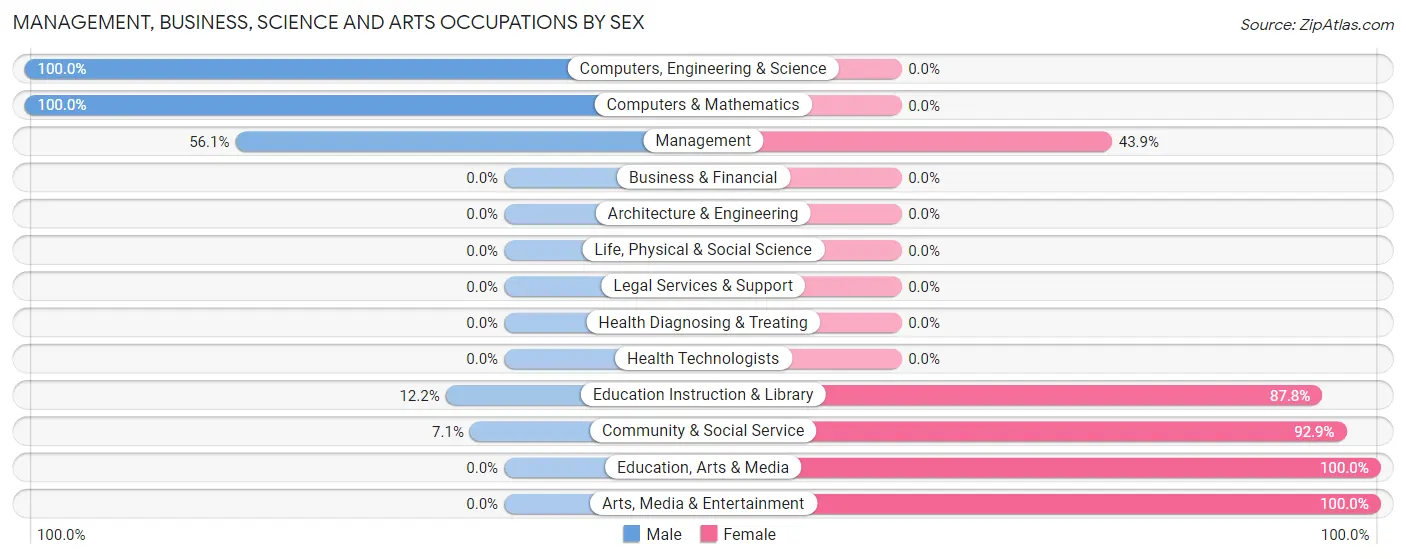
Management, Business, Science and Arts Occupations by Sex
Within the Management, Business, Science and Arts occupations in Somerville, the most male-oriented occupations are Computers, Engineering & Science (100.0%), Computers & Mathematics (100.0%), and Management (56.1%), while the most female-oriented occupations are Education, Arts & Media (100.0%), Arts, Media & Entertainment (100.0%), and Community & Social Service (92.9%).
| Occupation | Male | Female |
| Management | 37 (56.1%) | 29 (43.9%) |
| Business & Financial | 0 (0.0%) | 0 (0.0%) |
| Computers, Engineering & Science | 22 (100.0%) | 0 (0.0%) |
| Computers & Mathematics | 22 (100.0%) | 0 (0.0%) |
| Architecture & Engineering | 0 (0.0%) | 0 (0.0%) |
| Life, Physical & Social Science | 0 (0.0%) | 0 (0.0%) |
| Community & Social Service | 5 (7.1%) | 65 (92.9%) |
| Education, Arts & Media | 0 (0.0%) | 16 (100.0%) |
| Legal Services & Support | 0 (0.0%) | 0 (0.0%) |
| Education Instruction & Library | 5 (12.2%) | 36 (87.8%) |
| Arts, Media & Entertainment | 0 (0.0%) | 13 (100.0%) |
| Health Diagnosing & Treating | 0 (0.0%) | 0 (0.0%) |
| Health Technologists | 0 (0.0%) | 0 (0.0%) |
| Total (Category) | 64 (40.5%) | 94 (59.5%) |
| Total (Overall) | 203 (44.6%) | 252 (55.4%) |
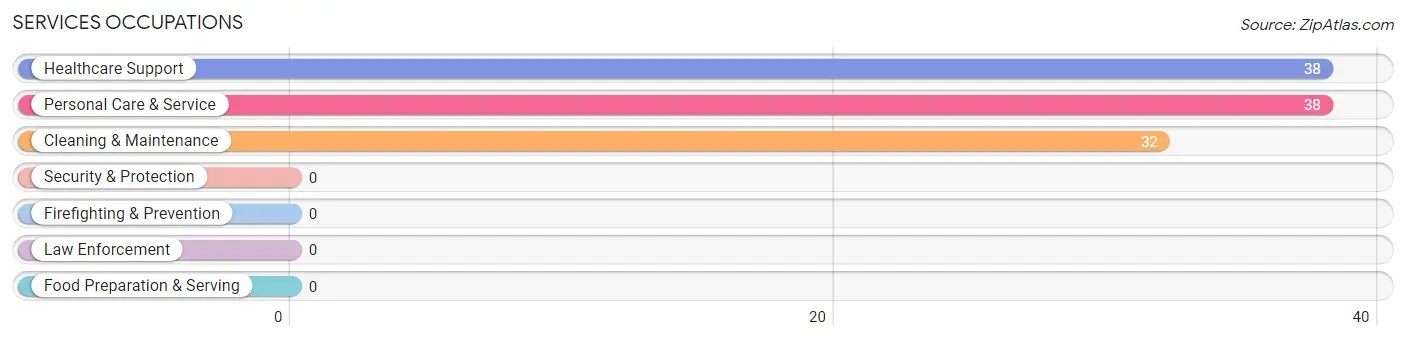
Services Occupations
The most common Services occupations in Somerville are Healthcare Support (38 | 8.4%), Personal Care & Service (38 | 8.4%), and Cleaning & Maintenance (32 | 7.0%).
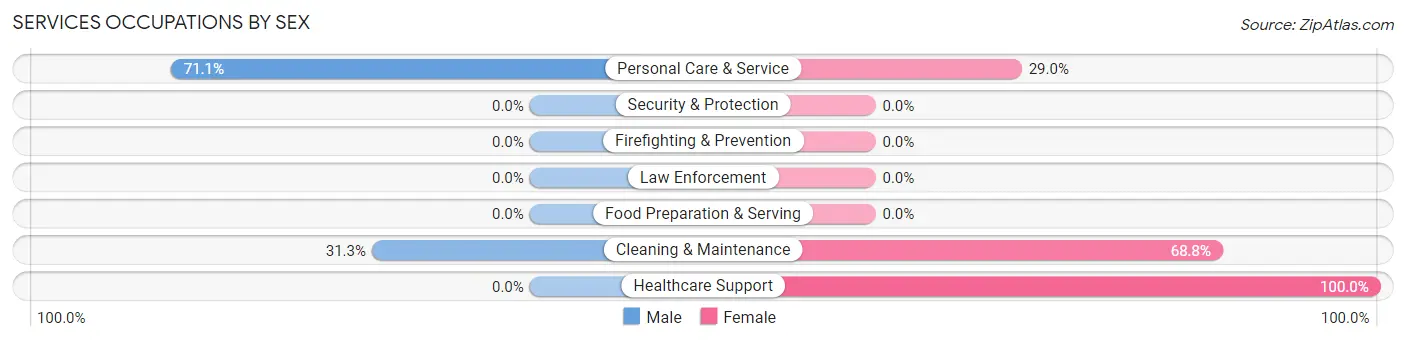
Services Occupations by Sex
Within the Services occupations in Somerville, the most male-oriented occupations are Personal Care & Service (71.1%), and Cleaning & Maintenance (31.2%), while the most female-oriented occupations are Healthcare Support (100.0%), Cleaning & Maintenance (68.8%), and Personal Care & Service (28.9%).
| Occupation | Male | Female |
| Healthcare Support | 0 (0.0%) | 38 (100.0%) |
| Security & Protection | 0 (0.0%) | 0 (0.0%) |
| Firefighting & Prevention | 0 (0.0%) | 0 (0.0%) |
| Law Enforcement | 0 (0.0%) | 0 (0.0%) |
| Food Preparation & Serving | 0 (0.0%) | 0 (0.0%) |
| Cleaning & Maintenance | 10 (31.2%) | 22 (68.8%) |
| Personal Care & Service | 27 (71.1%) | 11 (28.9%) |
| Total (Category) | 37 (34.3%) | 71 (65.7%) |
| Total (Overall) | 203 (44.6%) | 252 (55.4%) |
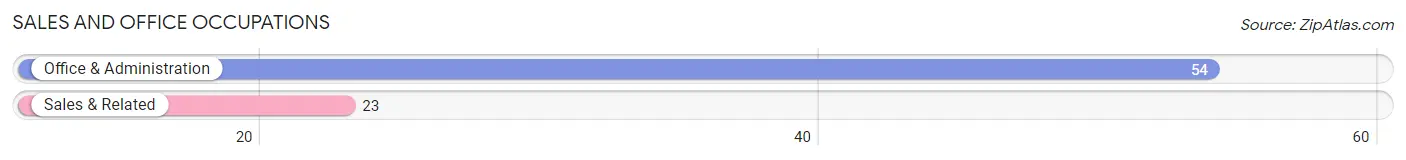
Sales and Office Occupations
The most common Sales and Office occupations in Somerville are Office & Administration (54 | 11.9%), and Sales & Related (23 | 5.1%).
Sales and Office Occupations by Sex
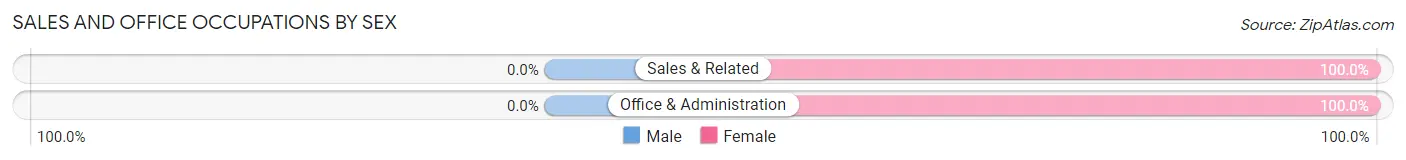
| Occupation | Male | Female |
| Sales & Related | 0 (0.0%) | 23 (100.0%) |
| Office & Administration | 0 (0.0%) | 54 (100.0%) |
| Total (Category) | 0 (0.0%) | 77 (100.0%) |
| Total (Overall) | 203 (44.6%) | 252 (55.4%) |
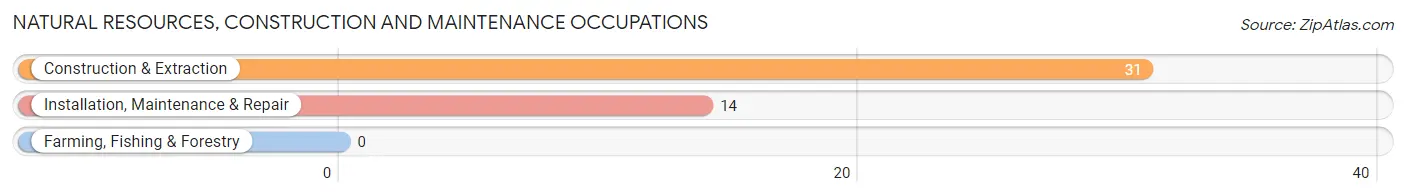
Natural Resources, Construction and Maintenance Occupations
The most common Natural Resources, Construction and Maintenance occupations in Somerville are Construction & Extraction (31 | 6.8%), and Installation, Maintenance & Repair (14 | 3.1%).
Natural Resources, Construction and Maintenance Occupations by Sex
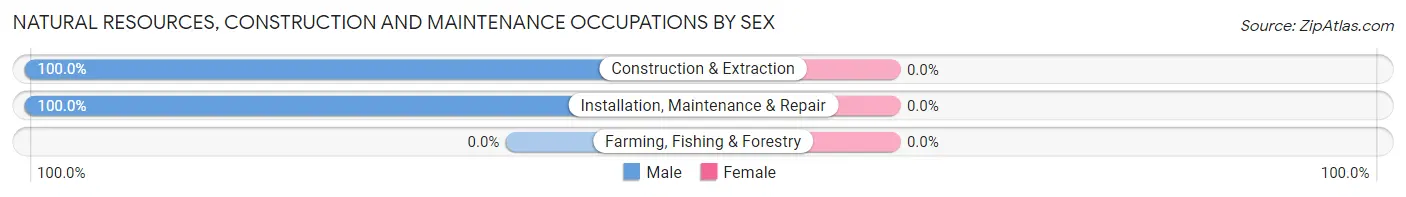
| Occupation | Male | Female |
| Farming, Fishing & Forestry | 0 (0.0%) | 0 (0.0%) |
| Construction & Extraction | 31 (100.0%) | 0 (0.0%) |
| Installation, Maintenance & Repair | 14 (100.0%) | 0 (0.0%) |
| Total (Category) | 45 (100.0%) | 0 (0.0%) |
| Total (Overall) | 203 (44.6%) | 252 (55.4%) |
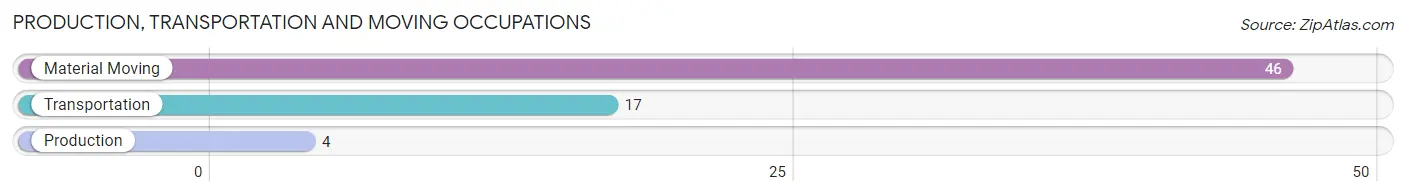
Production, Transportation and Moving Occupations
The most common Production, Transportation and Moving occupations in Somerville are Material Moving (46 | 10.1%), Transportation (17 | 3.7%), and Production (4 | 0.9%).
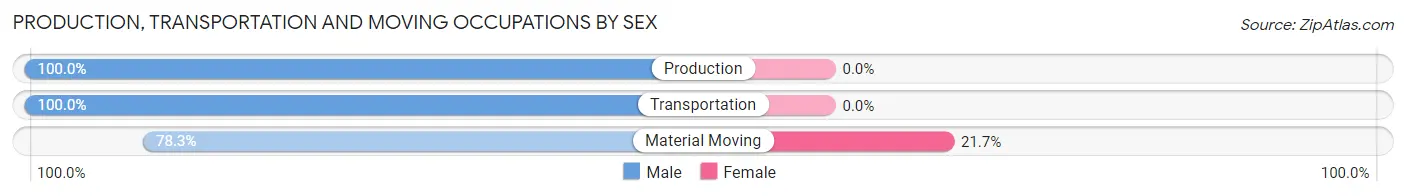
Production, Transportation and Moving Occupations by Sex
| Occupation | Male | Female |
| Production | 4 (100.0%) | 0 (0.0%) |
| Transportation | 17 (100.0%) | 0 (0.0%) |
| Material Moving | 36 (78.3%) | 10 (21.7%) |
| Total (Category) | 57 (85.1%) | 10 (14.9%) |
| Total (Overall) | 203 (44.6%) | 252 (55.4%) |
Employment Industries by Sex in Somerville
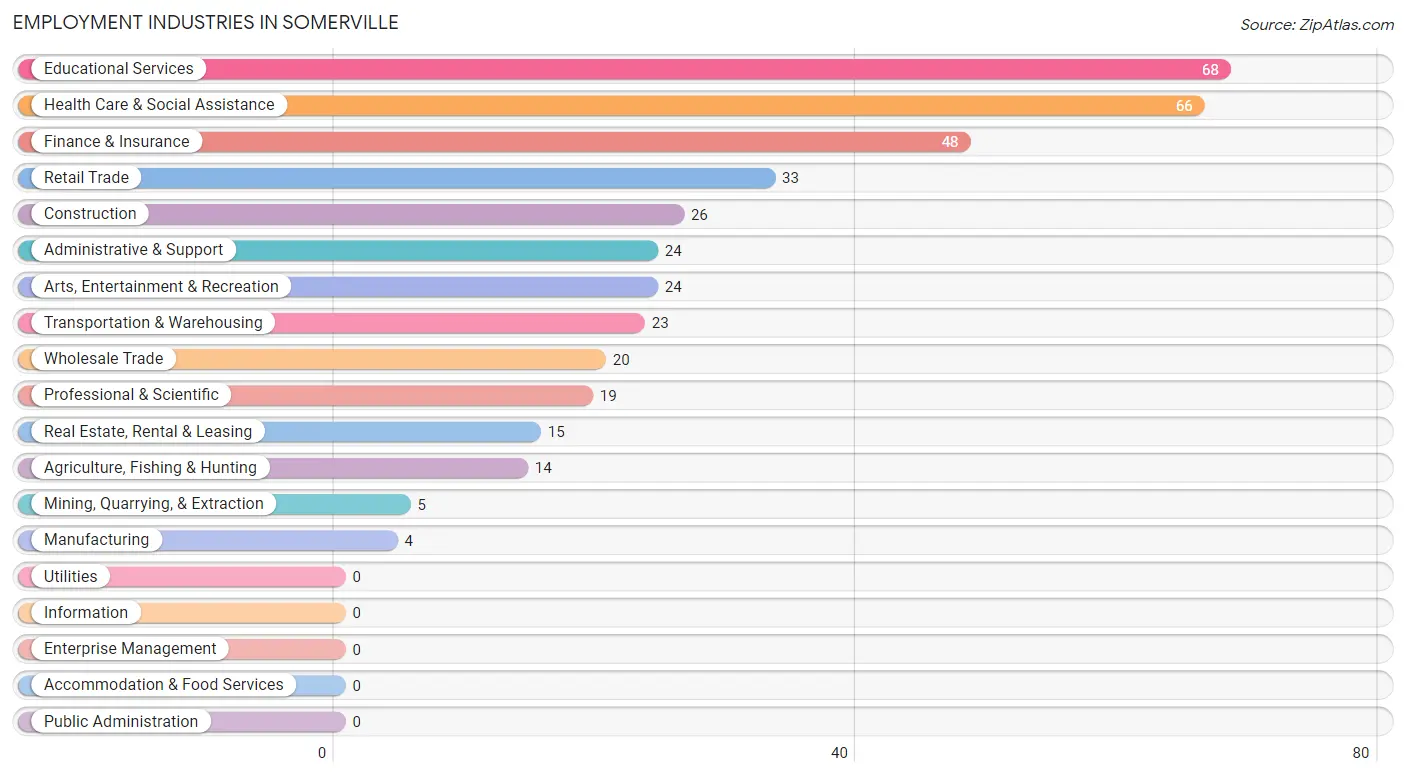
Employment Industries in Somerville
The major employment industries in Somerville include Educational Services (68 | 14.9%), Health Care & Social Assistance (66 | 14.5%), Finance & Insurance (48 | 10.5%), Retail Trade (33 | 7.2%), and Construction (26 | 5.7%).
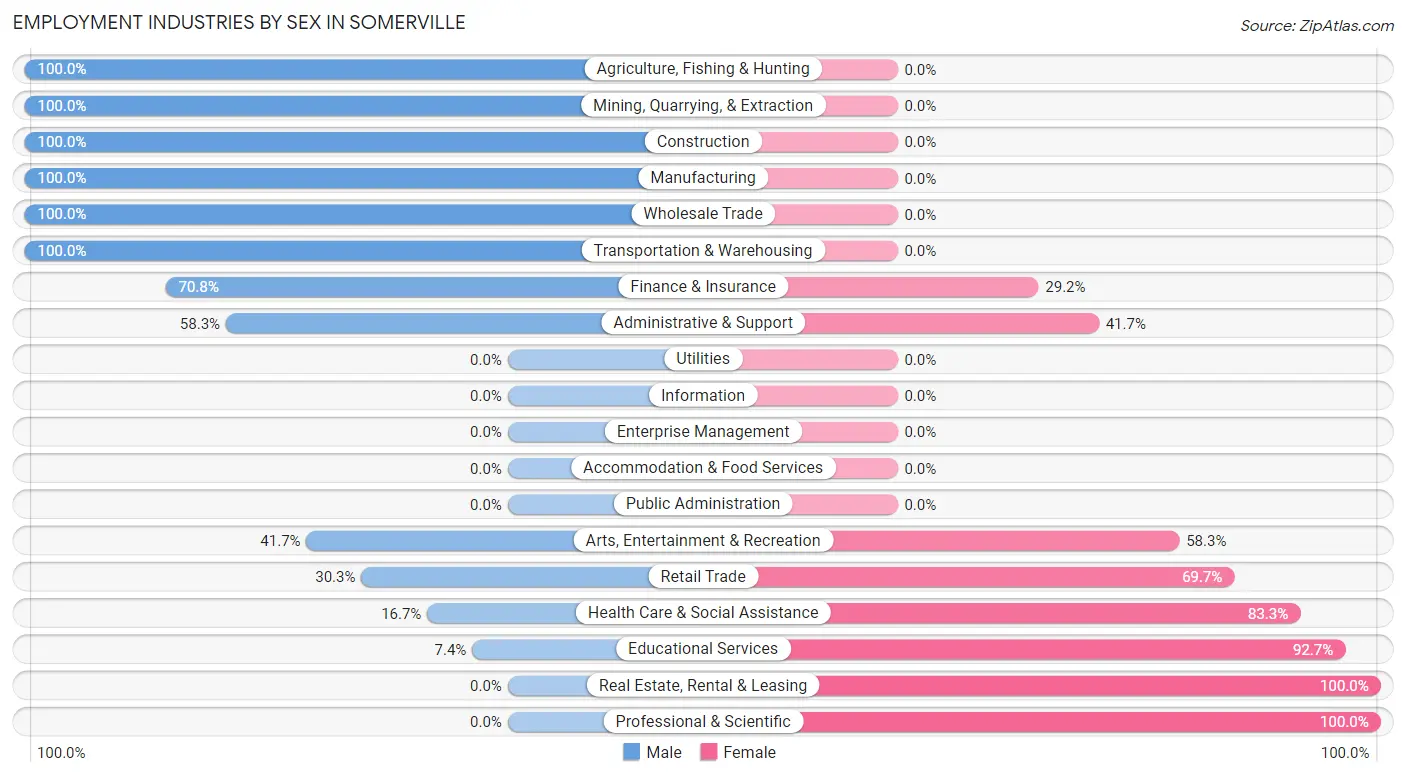
Employment Industries by Sex in Somerville
The Somerville industries that see more men than women are Agriculture, Fishing & Hunting (100.0%), Mining, Quarrying, & Extraction (100.0%), and Construction (100.0%), whereas the industries that tend to have a higher number of women are Real Estate, Rental & Leasing (100.0%), Professional & Scientific (100.0%), and Educational Services (92.6%).
| Industry | Male | Female |
| Agriculture, Fishing & Hunting | 14 (100.0%) | 0 (0.0%) |
| Mining, Quarrying, & Extraction | 5 (100.0%) | 0 (0.0%) |
| Construction | 26 (100.0%) | 0 (0.0%) |
| Manufacturing | 4 (100.0%) | 0 (0.0%) |
| Wholesale Trade | 20 (100.0%) | 0 (0.0%) |
| Retail Trade | 10 (30.3%) | 23 (69.7%) |
| Transportation & Warehousing | 23 (100.0%) | 0 (0.0%) |
| Utilities | 0 (0.0%) | 0 (0.0%) |
| Information | 0 (0.0%) | 0 (0.0%) |
| Finance & Insurance | 34 (70.8%) | 14 (29.2%) |
| Real Estate, Rental & Leasing | 0 (0.0%) | 15 (100.0%) |
| Professional & Scientific | 0 (0.0%) | 19 (100.0%) |
| Enterprise Management | 0 (0.0%) | 0 (0.0%) |
| Administrative & Support | 14 (58.3%) | 10 (41.7%) |
| Educational Services | 5 (7.3%) | 63 (92.6%) |
| Health Care & Social Assistance | 11 (16.7%) | 55 (83.3%) |
| Arts, Entertainment & Recreation | 10 (41.7%) | 14 (58.3%) |
| Accommodation & Food Services | 0 (0.0%) | 0 (0.0%) |
| Public Administration | 0 (0.0%) | 0 (0.0%) |
| Total | 203 (44.6%) | 252 (55.4%) |
Education in Somerville
School Enrollment in Somerville
The most common levels of schooling among the 261 students in Somerville are middle school (115 | 44.1%), elementary school (64 | 24.5%), and college / undergraduate (28 | 10.7%).
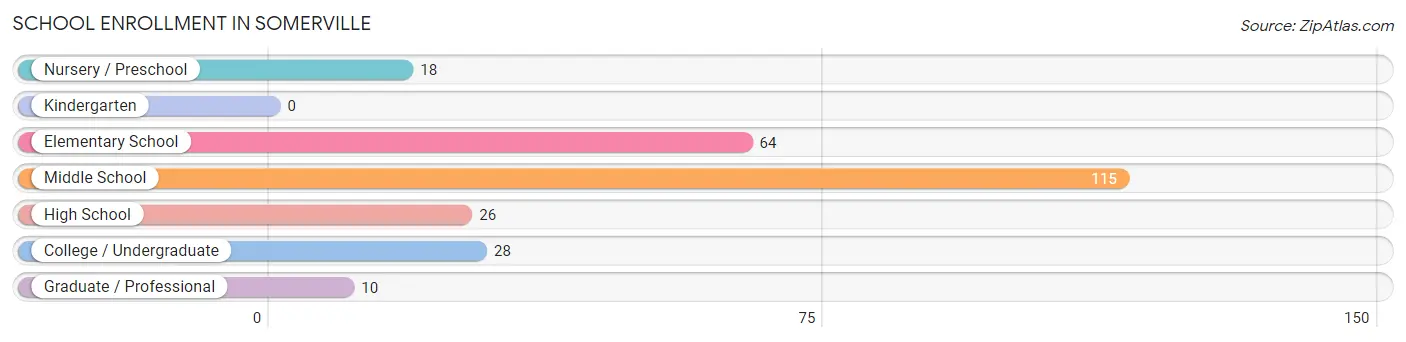
| School Level | # Students | % Students |
| Nursery / Preschool | 18 | 6.9% |
| Kindergarten | 0 | 0.0% |
| Elementary School | 64 | 24.5% |
| Middle School | 115 | 44.1% |
| High School | 26 | 10.0% |
| College / Undergraduate | 28 | 10.7% |
| Graduate / Professional | 10 | 3.8% |
| Total | 261 | 100.0% |
School Enrollment by Age by Funding Source in Somerville
Out of a total of 261 students who are enrolled in schools in Somerville, 33 (12.6%) attend a private institution, while the remaining 228 (87.4%) are enrolled in public schools. The age group of 35 years and over has the highest likelihood of being enrolled in private schools, with 14 (50.0% in the age bracket) enrolled. Conversely, the age group of 3 to 4 year olds has the lowest likelihood of being enrolled in a private school, with 14 (100.0% in the age bracket) attending a public institution.
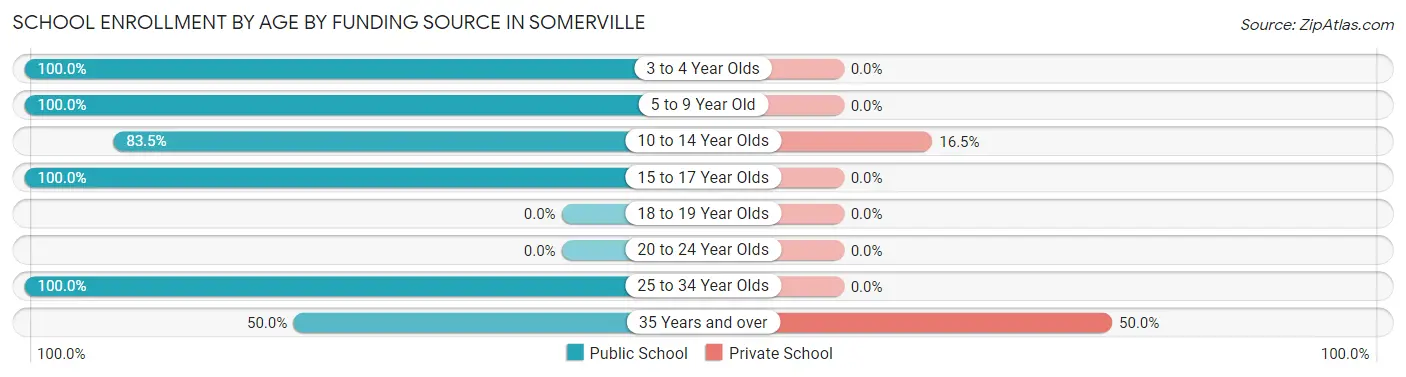
| Age Bracket | Public School | Private School |
| 3 to 4 Year Olds | 14 (100.0%) | 0 (0.0%) |
| 5 to 9 Year Old | 68 (100.0%) | 0 (0.0%) |
| 10 to 14 Year Olds | 96 (83.5%) | 19 (16.5%) |
| 15 to 17 Year Olds | 26 (100.0%) | 0 (0.0%) |
| 18 to 19 Year Olds | 0 (0.0%) | 0 (0.0%) |
| 20 to 24 Year Olds | 0 (0.0%) | 0 (0.0%) |
| 25 to 34 Year Olds | 10 (100.0%) | 0 (0.0%) |
| 35 Years and over | 14 (50.0%) | 14 (50.0%) |
| Total | 228 (87.4%) | 33 (12.6%) |
Educational Attainment by Field of Study in Somerville
Education (46 | 23.1%), literature & languages (42 | 21.1%), arts & humanities (28 | 14.1%), physical & health sciences (20 | 10.1%), and business (19 | 9.6%) are the most common fields of study among 199 individuals in Somerville who have obtained a bachelor's degree or higher.
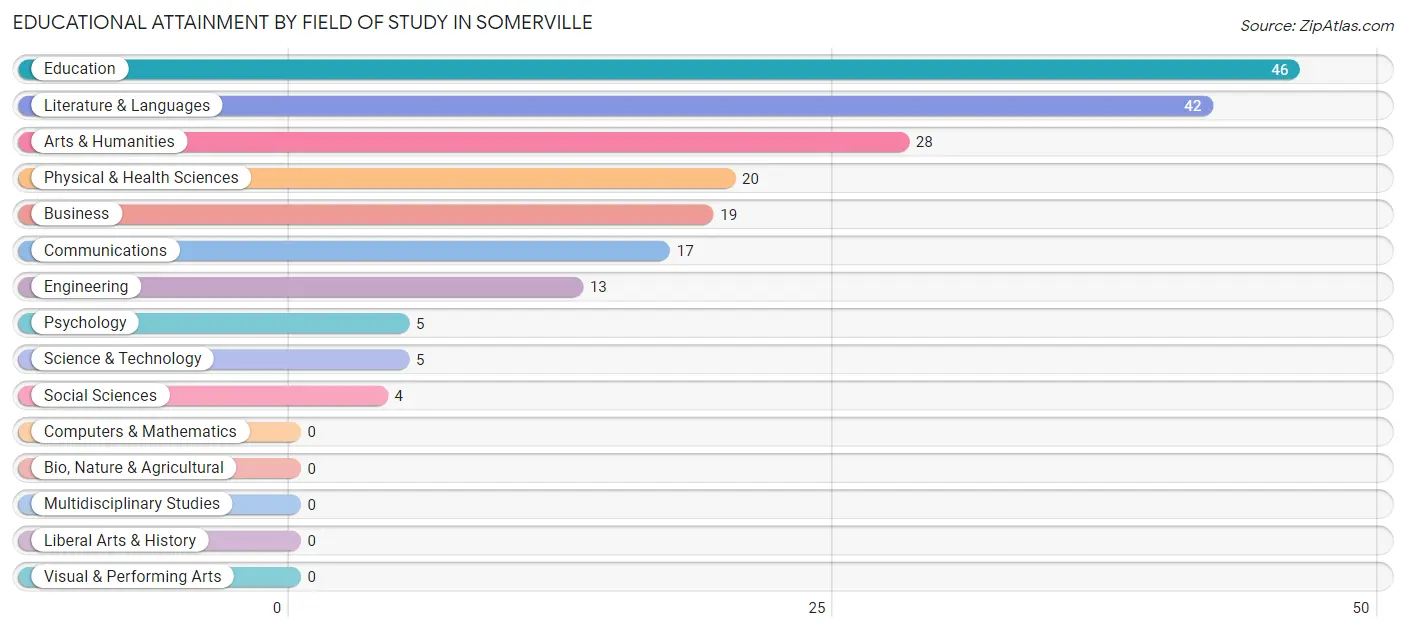
| Field of Study | # Graduates | % Graduates |
| Computers & Mathematics | 0 | 0.0% |
| Bio, Nature & Agricultural | 0 | 0.0% |
| Physical & Health Sciences | 20 | 10.1% |
| Psychology | 5 | 2.5% |
| Social Sciences | 4 | 2.0% |
| Engineering | 13 | 6.5% |
| Multidisciplinary Studies | 0 | 0.0% |
| Science & Technology | 5 | 2.5% |
| Business | 19 | 9.6% |
| Education | 46 | 23.1% |
| Literature & Languages | 42 | 21.1% |
| Liberal Arts & History | 0 | 0.0% |
| Visual & Performing Arts | 0 | 0.0% |
| Communications | 17 | 8.5% |
| Arts & Humanities | 28 | 14.1% |
| Total | 199 | 100.0% |
Transportation & Commute in Somerville
Vehicle Availability by Sex in Somerville
The most prevalent vehicle ownership categories in Somerville are males with 2 vehicles (92, accounting for 45.3%) and females with 2 vehicles (118, making up 37.2%).

| Vehicles Available | Male | Female |
| No Vehicle | 26 (12.8%) | 0 (0.0%) |
| 1 Vehicle | 37 (18.2%) | 85 (34.4%) |
| 2 Vehicles | 92 (45.3%) | 118 (47.8%) |
| 3 Vehicles | 31 (15.3%) | 31 (12.6%) |
| 4 Vehicles | 17 (8.4%) | 13 (5.3%) |
| 5 or more Vehicles | 0 (0.0%) | 0 (0.0%) |
| Total | 203 (100.0%) | 247 (100.0%) |
Commute Time in Somerville
The most frequently occuring commute durations in Somerville are 30 to 34 minutes (76 commuters, 19.0%), 45 to 59 minutes (74 commuters, 18.5%), and 5 to 9 minutes (65 commuters, 16.3%).
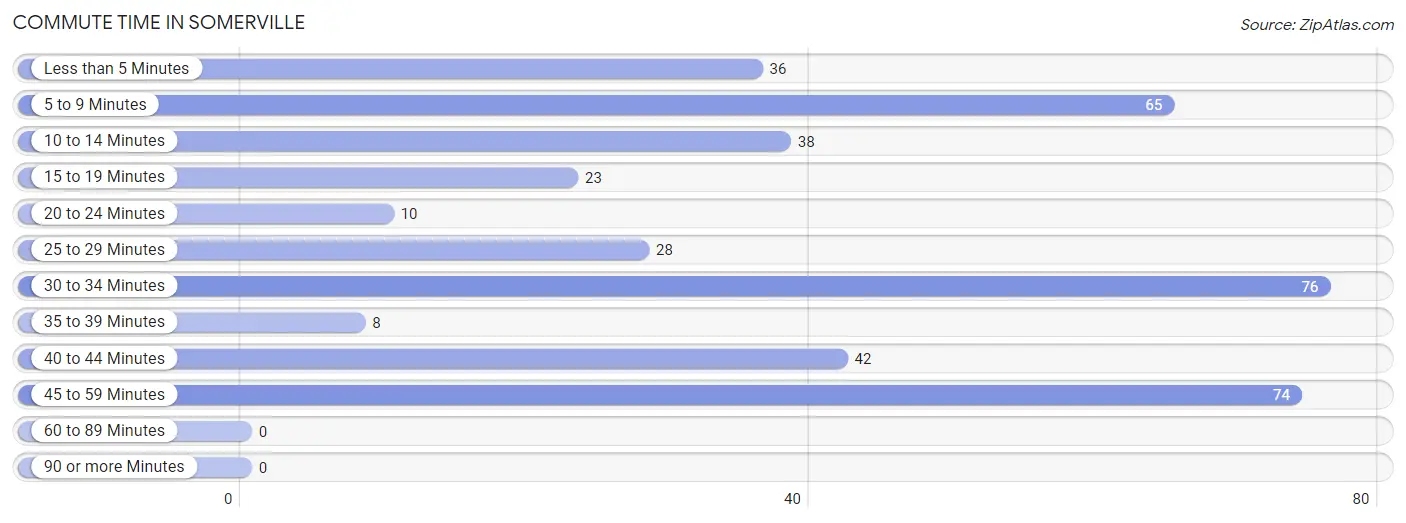
| Commute Time | # Commuters | % Commuters |
| Less than 5 Minutes | 36 | 9.0% |
| 5 to 9 Minutes | 65 | 16.3% |
| 10 to 14 Minutes | 38 | 9.5% |
| 15 to 19 Minutes | 23 | 5.8% |
| 20 to 24 Minutes | 10 | 2.5% |
| 25 to 29 Minutes | 28 | 7.0% |
| 30 to 34 Minutes | 76 | 19.0% |
| 35 to 39 Minutes | 8 | 2.0% |
| 40 to 44 Minutes | 42 | 10.5% |
| 45 to 59 Minutes | 74 | 18.5% |
| 60 to 89 Minutes | 0 | 0.0% |
| 90 or more Minutes | 0 | 0.0% |
Commute Time by Sex in Somerville
The most common commute times in Somerville are 30 to 34 minutes (58 commuters, 31.9%) for males and 5 to 9 minutes (43 commuters, 19.7%) for females.
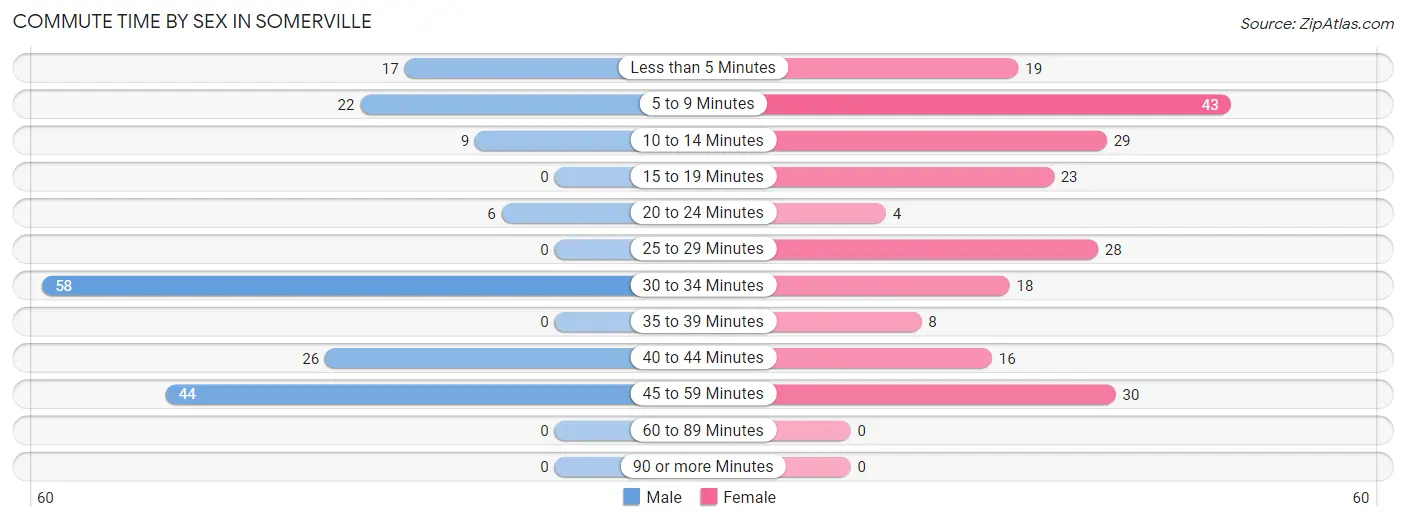
| Commute Time | Male | Female |
| Less than 5 Minutes | 17 (9.3%) | 19 (8.7%) |
| 5 to 9 Minutes | 22 (12.1%) | 43 (19.7%) |
| 10 to 14 Minutes | 9 (5.0%) | 29 (13.3%) |
| 15 to 19 Minutes | 0 (0.0%) | 23 (10.5%) |
| 20 to 24 Minutes | 6 (3.3%) | 4 (1.8%) |
| 25 to 29 Minutes | 0 (0.0%) | 28 (12.8%) |
| 30 to 34 Minutes | 58 (31.9%) | 18 (8.3%) |
| 35 to 39 Minutes | 0 (0.0%) | 8 (3.7%) |
| 40 to 44 Minutes | 26 (14.3%) | 16 (7.3%) |
| 45 to 59 Minutes | 44 (24.2%) | 30 (13.8%) |
| 60 to 89 Minutes | 0 (0.0%) | 0 (0.0%) |
| 90 or more Minutes | 0 (0.0%) | 0 (0.0%) |
Time of Departure to Work by Sex in Somerville
The most frequent times of departure to work in Somerville are 6:00 AM to 6:29 AM (35, 19.2%) for males and 7:00 AM to 7:29 AM (75, 34.4%) for females.
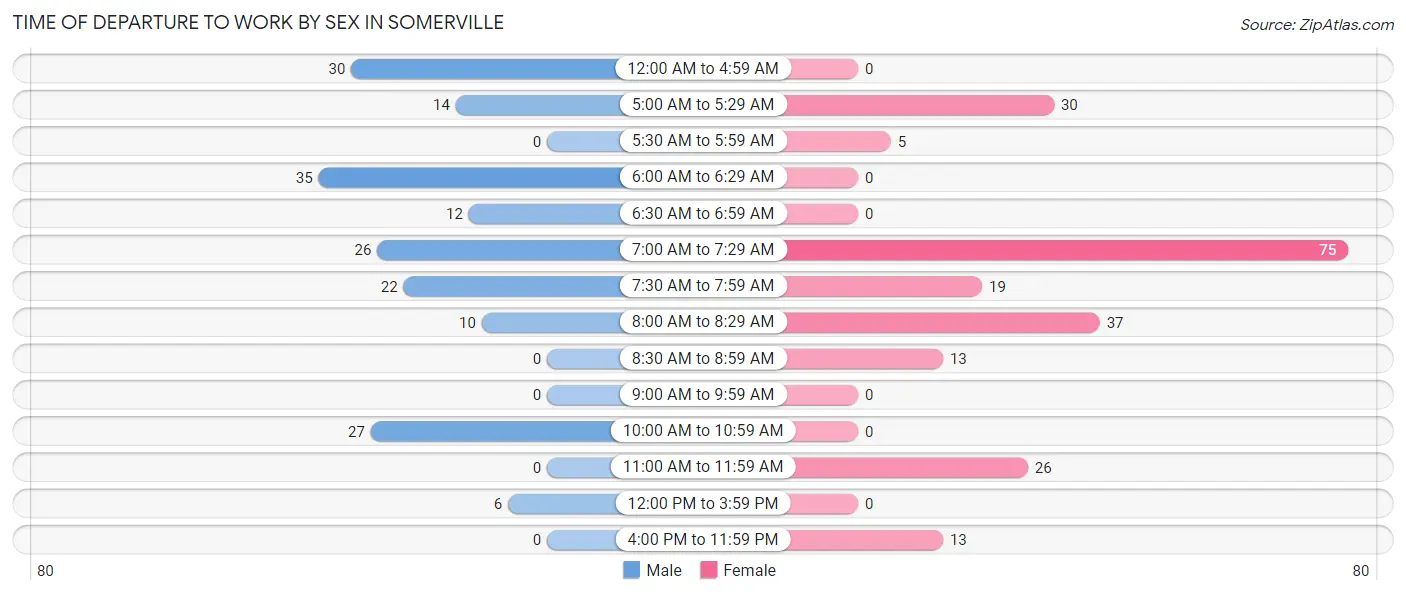
| Time of Departure | Male | Female |
| 12:00 AM to 4:59 AM | 30 (16.5%) | 0 (0.0%) |
| 5:00 AM to 5:29 AM | 14 (7.7%) | 30 (13.8%) |
| 5:30 AM to 5:59 AM | 0 (0.0%) | 5 (2.3%) |
| 6:00 AM to 6:29 AM | 35 (19.2%) | 0 (0.0%) |
| 6:30 AM to 6:59 AM | 12 (6.6%) | 0 (0.0%) |
| 7:00 AM to 7:29 AM | 26 (14.3%) | 75 (34.4%) |
| 7:30 AM to 7:59 AM | 22 (12.1%) | 19 (8.7%) |
| 8:00 AM to 8:29 AM | 10 (5.5%) | 37 (17.0%) |
| 8:30 AM to 8:59 AM | 0 (0.0%) | 13 (6.0%) |
| 9:00 AM to 9:59 AM | 0 (0.0%) | 0 (0.0%) |
| 10:00 AM to 10:59 AM | 27 (14.8%) | 0 (0.0%) |
| 11:00 AM to 11:59 AM | 0 (0.0%) | 26 (11.9%) |
| 12:00 PM to 3:59 PM | 6 (3.3%) | 0 (0.0%) |
| 4:00 PM to 11:59 PM | 0 (0.0%) | 13 (6.0%) |
| Total | 182 (100.0%) | 218 (100.0%) |
Housing Occupancy in Somerville
Occupancy by Ownership in Somerville
Of the total 540 dwellings in Somerville, owner-occupied units account for 420 (77.8%), while renter-occupied units make up 120 (22.2%).
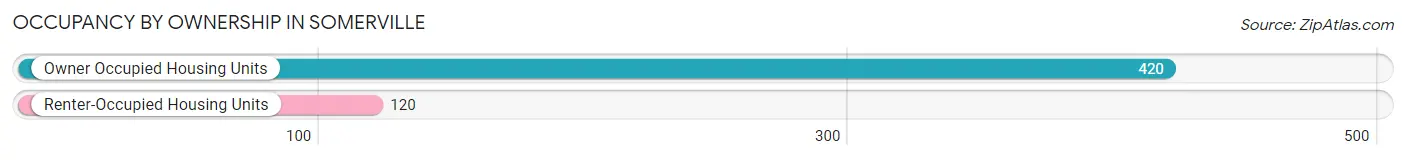
| Occupancy | # Housing Units | % Housing Units |
| Owner Occupied Housing Units | 420 | 77.8% |
| Renter-Occupied Housing Units | 120 | 22.2% |
| Total Occupied Housing Units | 540 | 100.0% |
Occupancy by Household Size in Somerville
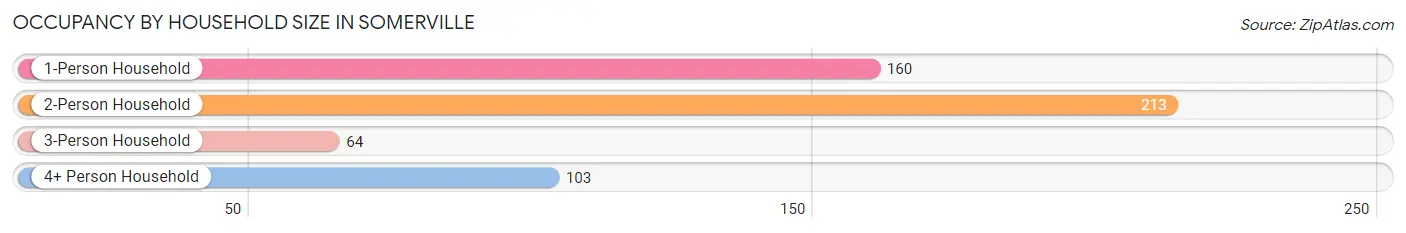
| Household Size | # Housing Units | % Housing Units |
| 1-Person Household | 160 | 29.6% |
| 2-Person Household | 213 | 39.4% |
| 3-Person Household | 64 | 11.8% |
| 4+ Person Household | 103 | 19.1% |
| Total Housing Units | 540 | 100.0% |
Occupancy by Ownership by Household Size in Somerville
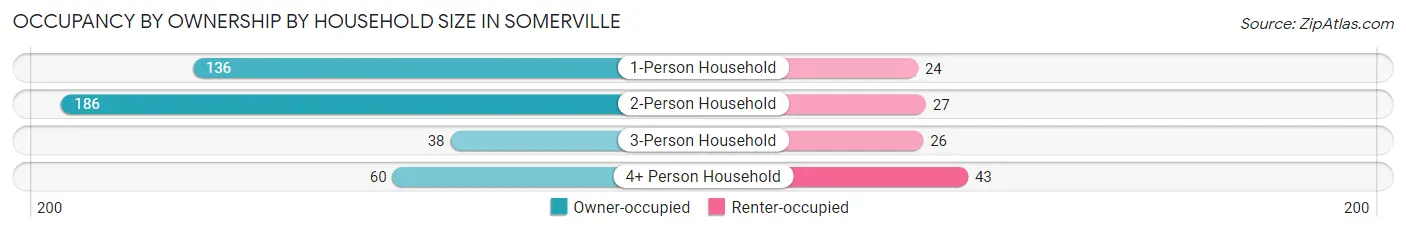
| Household Size | Owner-occupied | Renter-occupied |
| 1-Person Household | 136 (85.0%) | 24 (15.0%) |
| 2-Person Household | 186 (87.3%) | 27 (12.7%) |
| 3-Person Household | 38 (59.4%) | 26 (40.6%) |
| 4+ Person Household | 60 (58.3%) | 43 (41.7%) |
| Total Housing Units | 420 (77.8%) | 120 (22.2%) |
Occupancy by Educational Attainment in Somerville
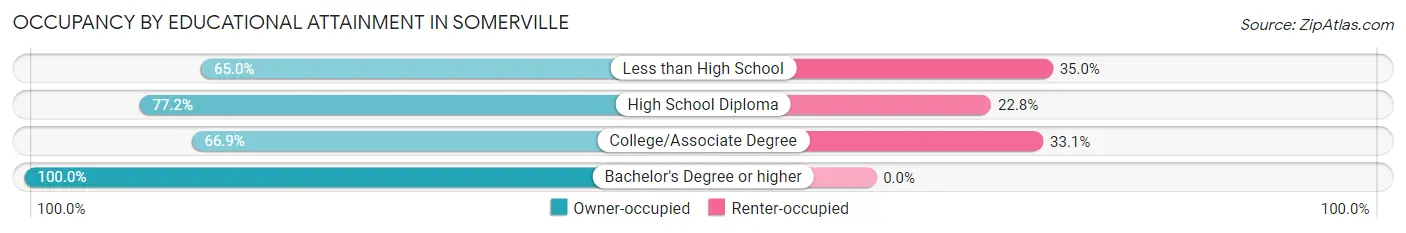
| Household Size | Owner-occupied | Renter-occupied |
| Less than High School | 39 (65.0%) | 21 (35.0%) |
| High School Diploma | 166 (77.2%) | 49 (22.8%) |
| College/Associate Degree | 101 (66.9%) | 50 (33.1%) |
| Bachelor's Degree or higher | 114 (100.0%) | 0 (0.0%) |
Occupancy by Age of Householder in Somerville
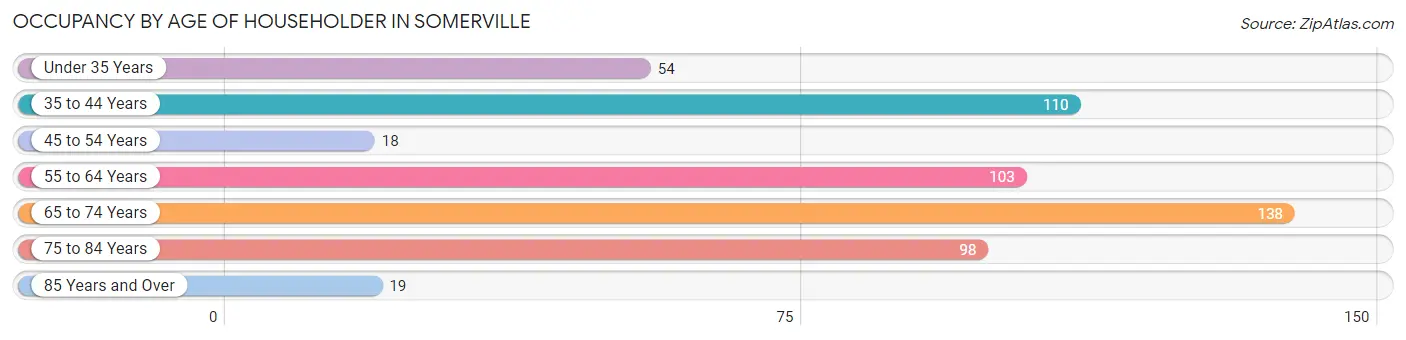
| Age Bracket | # Households | % Households |
| Under 35 Years | 54 | 10.0% |
| 35 to 44 Years | 110 | 20.4% |
| 45 to 54 Years | 18 | 3.3% |
| 55 to 64 Years | 103 | 19.1% |
| 65 to 74 Years | 138 | 25.6% |
| 75 to 84 Years | 98 | 18.1% |
| 85 Years and Over | 19 | 3.5% |
| Total | 540 | 100.0% |
Housing Finances in Somerville
Median Income by Occupancy in Somerville
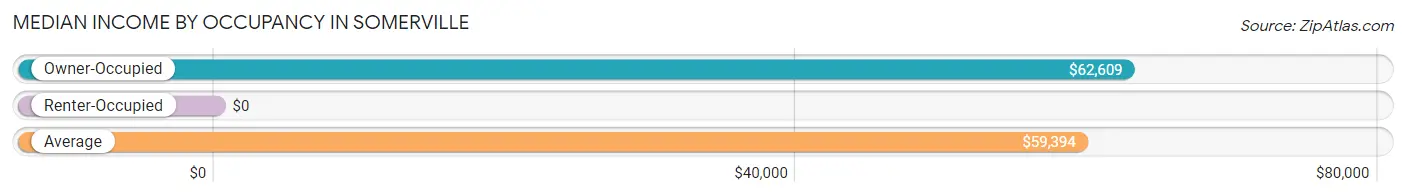
| Occupancy Type | # Households | Median Income |
| Owner-Occupied | 420 (77.8%) | $62,609 |
| Renter-Occupied | 120 (22.2%) | $0 |
| Average | 540 (100.0%) | $59,394 |
Occupancy by Householder Income Bracket in Somerville
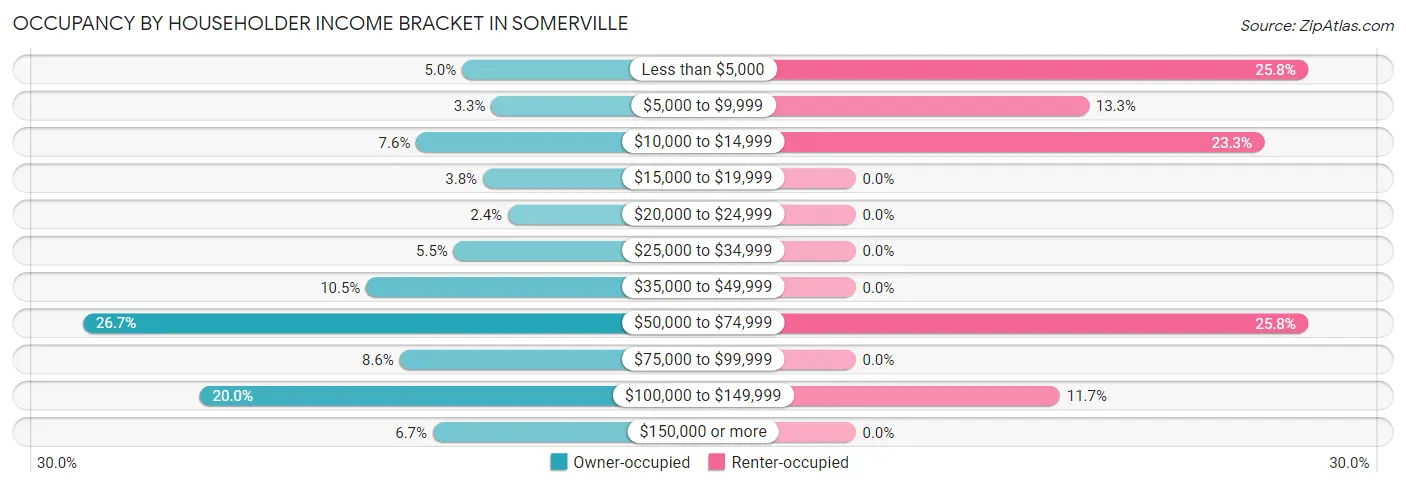
| Income Bracket | Owner-occupied | Renter-occupied |
| Less than $5,000 | 21 (5.0%) | 31 (25.8%) |
| $5,000 to $9,999 | 14 (3.3%) | 16 (13.3%) |
| $10,000 to $14,999 | 32 (7.6%) | 28 (23.3%) |
| $15,000 to $19,999 | 16 (3.8%) | 0 (0.0%) |
| $20,000 to $24,999 | 10 (2.4%) | 0 (0.0%) |
| $25,000 to $34,999 | 23 (5.5%) | 0 (0.0%) |
| $35,000 to $49,999 | 44 (10.5%) | 0 (0.0%) |
| $50,000 to $74,999 | 112 (26.7%) | 31 (25.8%) |
| $75,000 to $99,999 | 36 (8.6%) | 0 (0.0%) |
| $100,000 to $149,999 | 84 (20.0%) | 14 (11.7%) |
| $150,000 or more | 28 (6.7%) | 0 (0.0%) |
| Total | 420 (100.0%) | 120 (100.0%) |
Monthly Housing Cost Tiers in Somerville
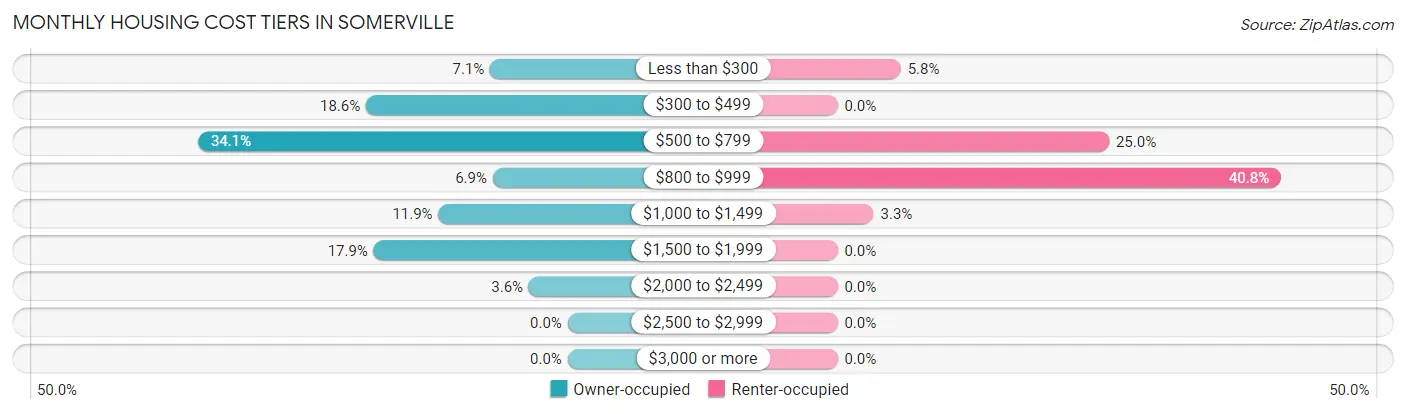
| Monthly Cost | Owner-occupied | Renter-occupied |
| Less than $300 | 30 (7.1%) | 7 (5.8%) |
| $300 to $499 | 78 (18.6%) | 0 (0.0%) |
| $500 to $799 | 143 (34.1%) | 30 (25.0%) |
| $800 to $999 | 29 (6.9%) | 49 (40.8%) |
| $1,000 to $1,499 | 50 (11.9%) | 4 (3.3%) |
| $1,500 to $1,999 | 75 (17.9%) | 0 (0.0%) |
| $2,000 to $2,499 | 15 (3.6%) | 0 (0.0%) |
| $2,500 to $2,999 | 0 (0.0%) | 0 (0.0%) |
| $3,000 or more | 0 (0.0%) | 0 (0.0%) |
| Total | 420 (100.0%) | 120 (100.0%) |
Physical Housing Characteristics in Somerville
Housing Structures in Somerville
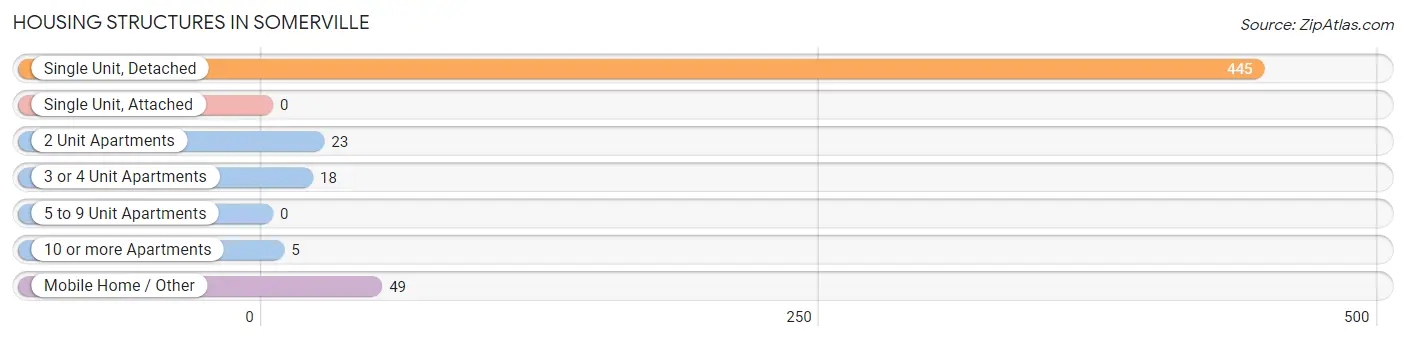
| Structure Type | # Housing Units | % Housing Units |
| Single Unit, Detached | 445 | 82.4% |
| Single Unit, Attached | 0 | 0.0% |
| 2 Unit Apartments | 23 | 4.3% |
| 3 or 4 Unit Apartments | 18 | 3.3% |
| 5 to 9 Unit Apartments | 0 | 0.0% |
| 10 or more Apartments | 5 | 0.9% |
| Mobile Home / Other | 49 | 9.1% |
| Total | 540 | 100.0% |
Housing Structures by Occupancy in Somerville
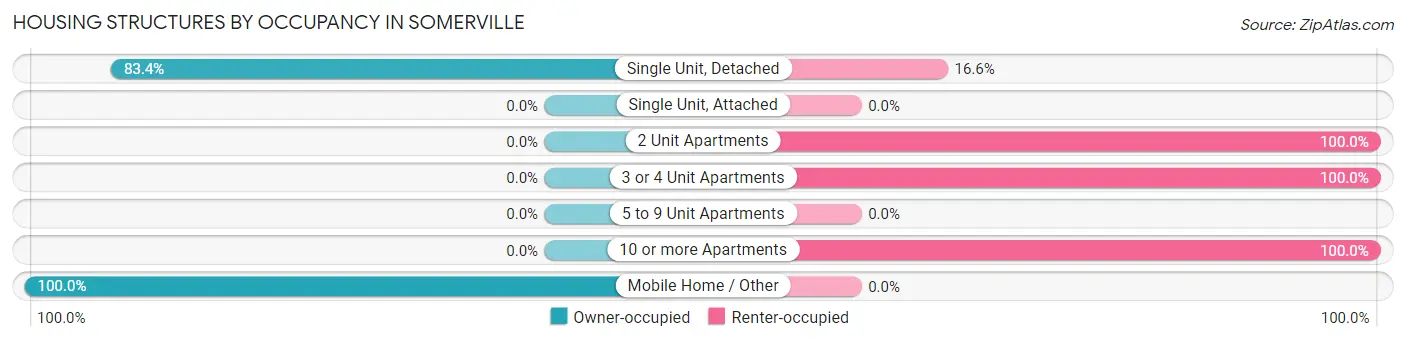
| Structure Type | Owner-occupied | Renter-occupied |
| Single Unit, Detached | 371 (83.4%) | 74 (16.6%) |
| Single Unit, Attached | 0 (0.0%) | 0 (0.0%) |
| 2 Unit Apartments | 0 (0.0%) | 23 (100.0%) |
| 3 or 4 Unit Apartments | 0 (0.0%) | 18 (100.0%) |
| 5 to 9 Unit Apartments | 0 (0.0%) | 0 (0.0%) |
| 10 or more Apartments | 0 (0.0%) | 5 (100.0%) |
| Mobile Home / Other | 49 (100.0%) | 0 (0.0%) |
| Total | 420 (77.8%) | 120 (22.2%) |
Housing Structures by Number of Rooms in Somerville
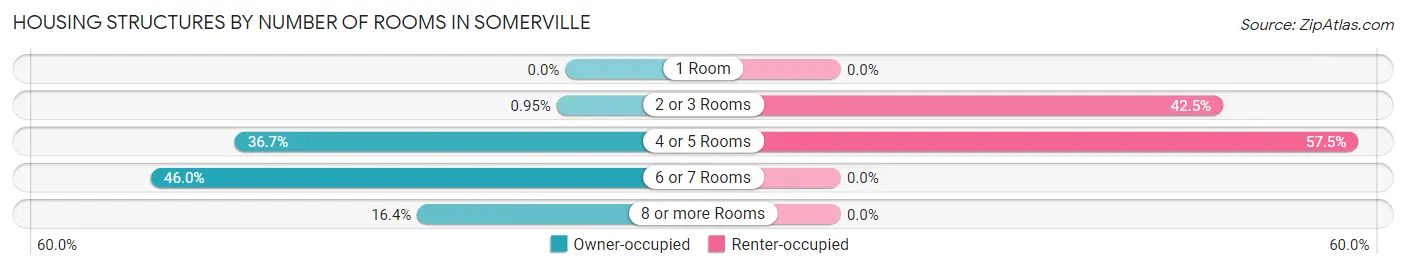
| Number of Rooms | Owner-occupied | Renter-occupied |
| 1 Room | 0 (0.0%) | 0 (0.0%) |
| 2 or 3 Rooms | 4 (0.9%) | 51 (42.5%) |
| 4 or 5 Rooms | 154 (36.7%) | 69 (57.5%) |
| 6 or 7 Rooms | 193 (46.0%) | 0 (0.0%) |
| 8 or more Rooms | 69 (16.4%) | 0 (0.0%) |
| Total | 420 (100.0%) | 120 (100.0%) |
Housing Structure by Heating Type in Somerville
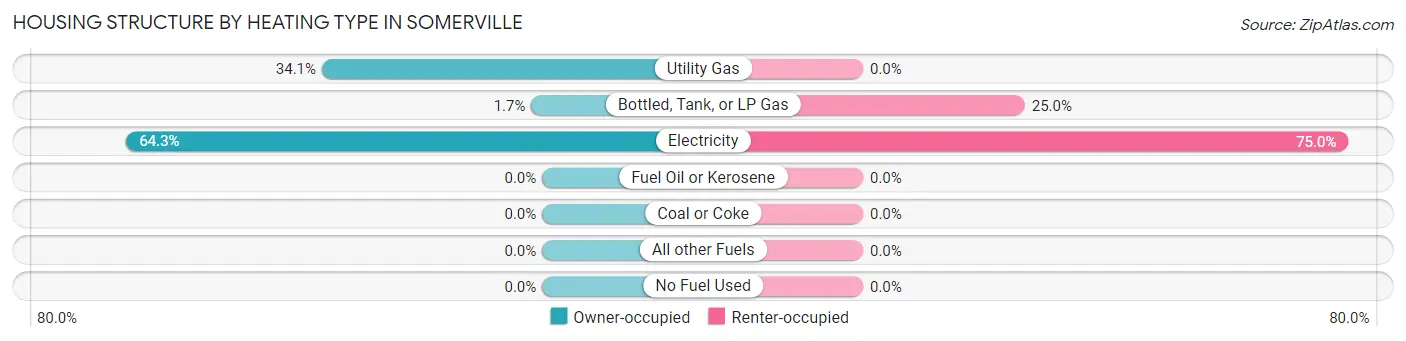
| Heating Type | Owner-occupied | Renter-occupied |
| Utility Gas | 143 (34.1%) | 0 (0.0%) |
| Bottled, Tank, or LP Gas | 7 (1.7%) | 30 (25.0%) |
| Electricity | 270 (64.3%) | 90 (75.0%) |
| Fuel Oil or Kerosene | 0 (0.0%) | 0 (0.0%) |
| Coal or Coke | 0 (0.0%) | 0 (0.0%) |
| All other Fuels | 0 (0.0%) | 0 (0.0%) |
| No Fuel Used | 0 (0.0%) | 0 (0.0%) |
| Total | 420 (100.0%) | 120 (100.0%) |
Household Vehicle Usage in Somerville
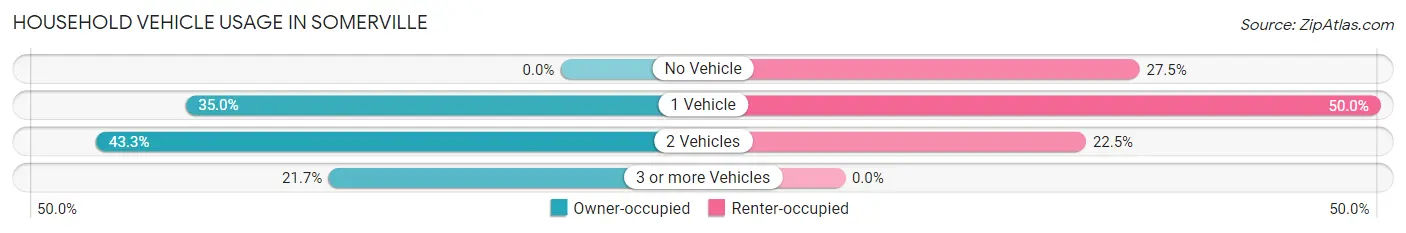
| Vehicles per Household | Owner-occupied | Renter-occupied |
| No Vehicle | 0 (0.0%) | 33 (27.5%) |
| 1 Vehicle | 147 (35.0%) | 60 (50.0%) |
| 2 Vehicles | 182 (43.3%) | 27 (22.5%) |
| 3 or more Vehicles | 91 (21.7%) | 0 (0.0%) |
| Total | 420 (100.0%) | 120 (100.0%) |
Real Estate & Mortgages in Somerville
Real Estate and Mortgage Overview in Somerville
| Characteristic | Without Mortgage | With Mortgage |
| Housing Units | 292 | 128 |
| Median Property Value | $123,900 | $151,500 |
| Median Household Income | $59,569 | $15 |
| Monthly Housing Costs | $579 | $0 |
| Real Estate Taxes | $1,975 | $0 |
Property Value by Mortgage Status in Somerville
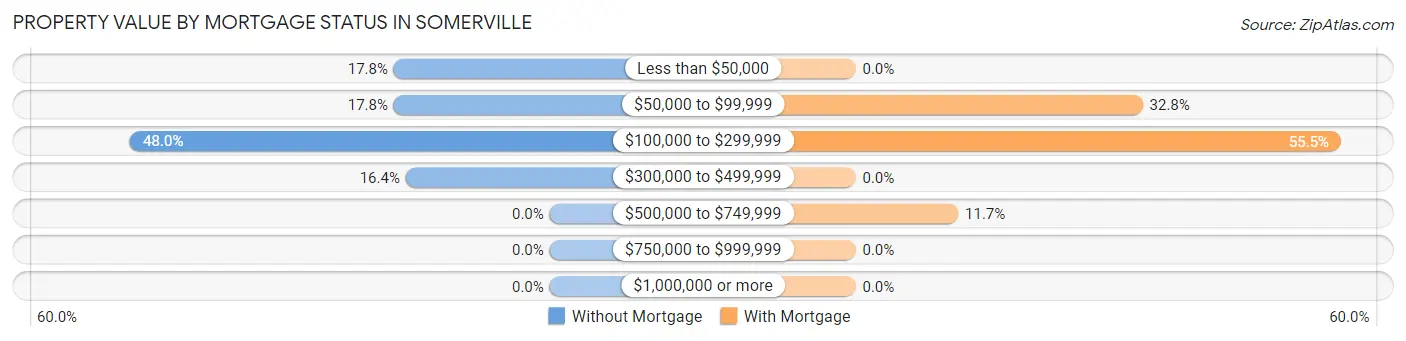
| Property Value | Without Mortgage | With Mortgage |
| Less than $50,000 | 52 (17.8%) | 0 (0.0%) |
| $50,000 to $99,999 | 52 (17.8%) | 42 (32.8%) |
| $100,000 to $299,999 | 140 (47.9%) | 71 (55.5%) |
| $300,000 to $499,999 | 48 (16.4%) | 0 (0.0%) |
| $500,000 to $749,999 | 0 (0.0%) | 15 (11.7%) |
| $750,000 to $999,999 | 0 (0.0%) | 0 (0.0%) |
| $1,000,000 or more | 0 (0.0%) | 0 (0.0%) |
| Total | 292 (100.0%) | 128 (100.0%) |
Household Income by Mortgage Status in Somerville
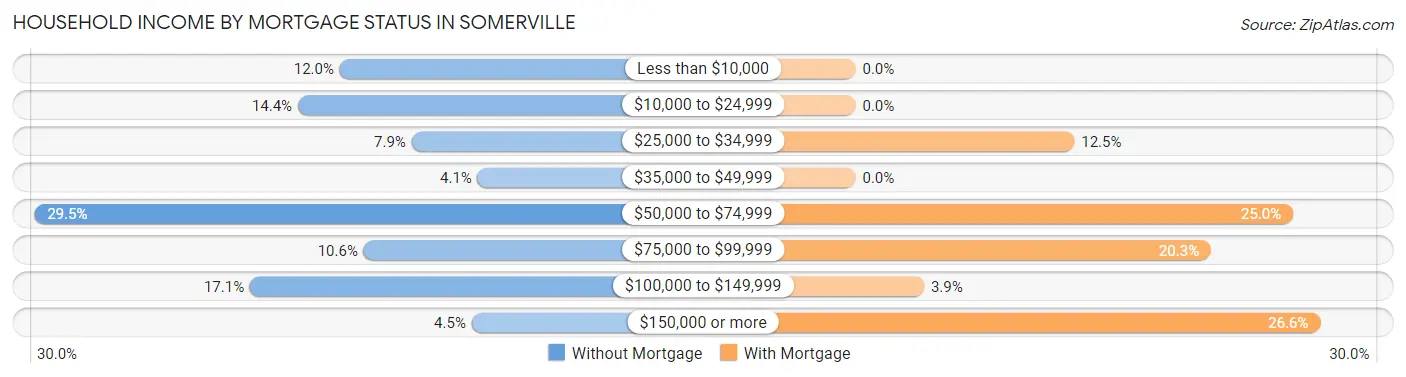
| Household Income | Without Mortgage | With Mortgage |
| Less than $10,000 | 35 (12.0%) | 0 (0.0%) |
| $10,000 to $24,999 | 42 (14.4%) | 0 (0.0%) |
| $25,000 to $34,999 | 23 (7.9%) | 16 (12.5%) |
| $35,000 to $49,999 | 12 (4.1%) | 0 (0.0%) |
| $50,000 to $74,999 | 86 (29.4%) | 32 (25.0%) |
| $75,000 to $99,999 | 31 (10.6%) | 26 (20.3%) |
| $100,000 to $149,999 | 50 (17.1%) | 5 (3.9%) |
| $150,000 or more | 13 (4.4%) | 34 (26.6%) |
| Total | 292 (100.0%) | 128 (100.0%) |
Property Value to Household Income Ratio in Somerville
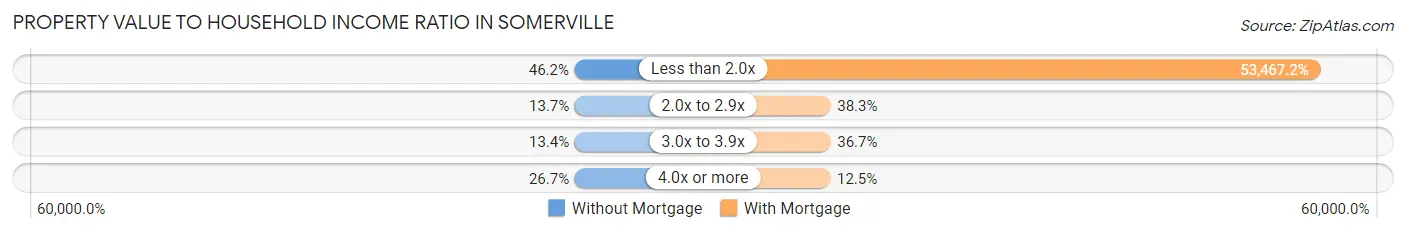
| Value-to-Income Ratio | Without Mortgage | With Mortgage |
| Less than 2.0x | 135 (46.2%) | 68,438 (53,467.2%) |
| 2.0x to 2.9x | 40 (13.7%) | 49 (38.3%) |
| 3.0x to 3.9x | 39 (13.4%) | 47 (36.7%) |
| 4.0x or more | 78 (26.7%) | 16 (12.5%) |
| Total | 292 (100.0%) | 128 (100.0%) |
Real Estate Taxes by Mortgage Status in Somerville
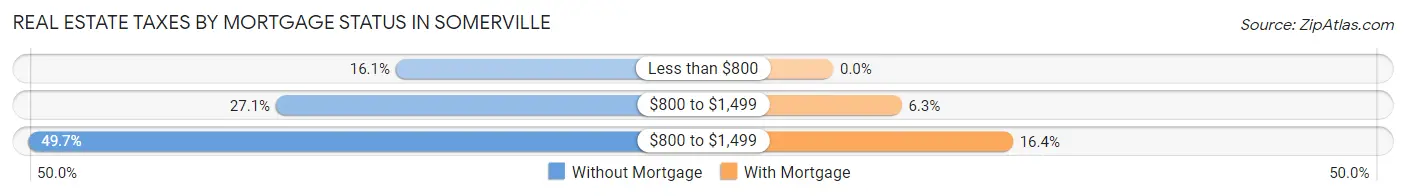
| Property Taxes | Without Mortgage | With Mortgage |
| Less than $800 | 47 (16.1%) | 0 (0.0%) |
| $800 to $1,499 | 79 (27.1%) | 8 (6.2%) |
| $800 to $1,499 | 145 (49.7%) | 21 (16.4%) |
| Total | 292 (100.0%) | 128 (100.0%) |
Health & Disability in Somerville
Health Insurance Coverage by Age in Somerville
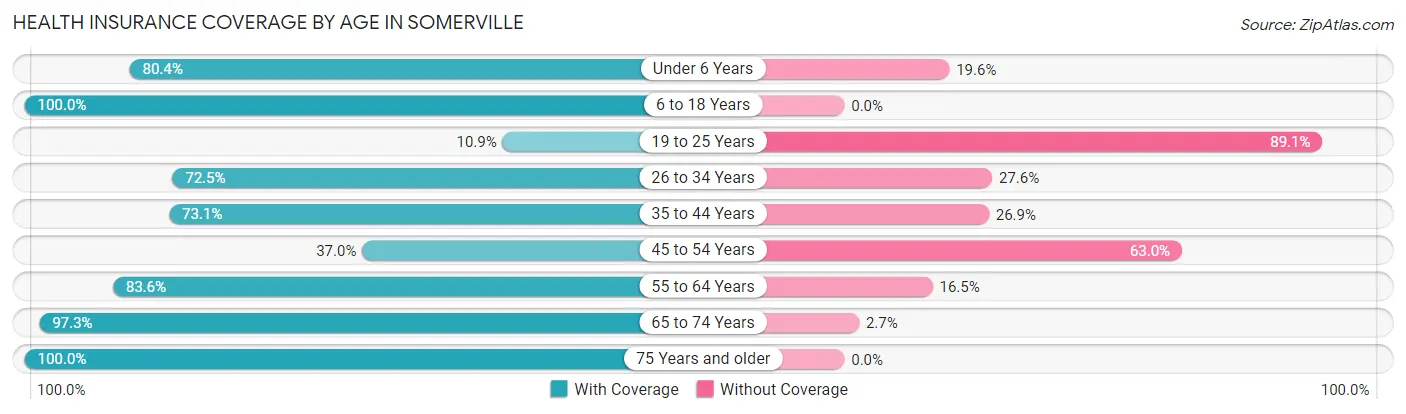
| Age Bracket | With Coverage | Without Coverage |
| Under 6 Years | 74 (80.4%) | 18 (19.6%) |
| 6 to 18 Years | 191 (100.0%) | 0 (0.0%) |
| 19 to 25 Years | 10 (10.9%) | 82 (89.1%) |
| 26 to 34 Years | 71 (72.5%) | 27 (27.6%) |
| 35 to 44 Years | 141 (73.1%) | 52 (26.9%) |
| 45 to 54 Years | 20 (37.0%) | 34 (63.0%) |
| 55 to 64 Years | 127 (83.6%) | 25 (16.5%) |
| 65 to 74 Years | 214 (97.3%) | 6 (2.7%) |
| 75 Years and older | 154 (100.0%) | 0 (0.0%) |
| Total | 1,002 (80.4%) | 244 (19.6%) |
Health Insurance Coverage by Citizenship Status in Somerville
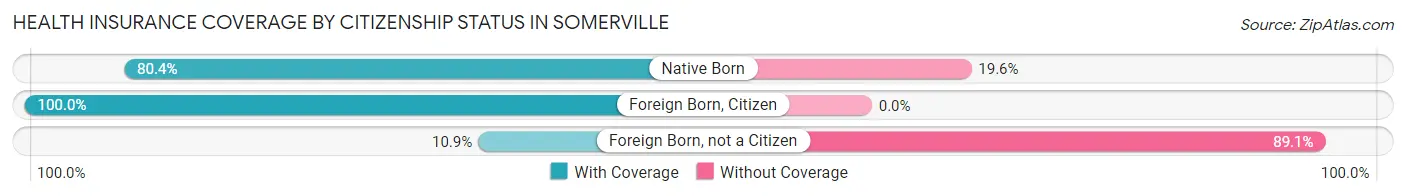
| Citizenship Status | With Coverage | Without Coverage |
| Native Born | 74 (80.4%) | 18 (19.6%) |
| Foreign Born, Citizen | 191 (100.0%) | 0 (0.0%) |
| Foreign Born, not a Citizen | 10 (10.9%) | 82 (89.1%) |
Health Insurance Coverage by Household Income in Somerville
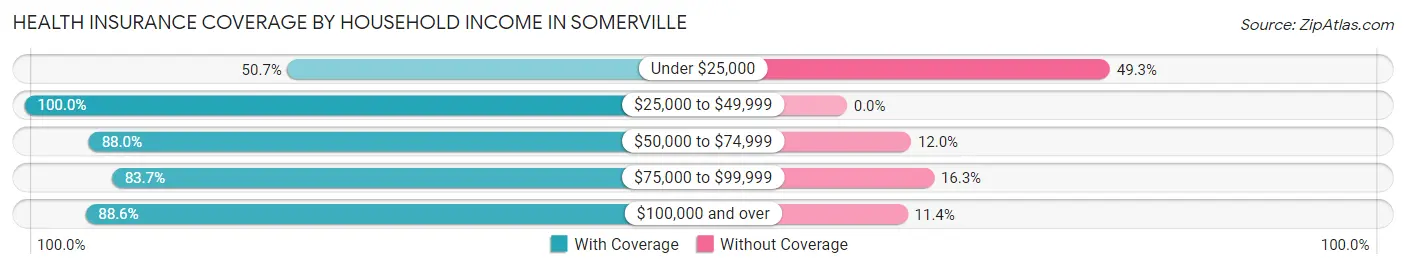
| Household Income | With Coverage | Without Coverage |
| Under $25,000 | 142 (50.7%) | 138 (49.3%) |
| $25,000 to $49,999 | 98 (100.0%) | 0 (0.0%) |
| $50,000 to $74,999 | 322 (88.0%) | 44 (12.0%) |
| $75,000 to $99,999 | 82 (83.7%) | 16 (16.3%) |
| $100,000 and over | 358 (88.6%) | 46 (11.4%) |
Public vs Private Health Insurance Coverage by Age in Somerville
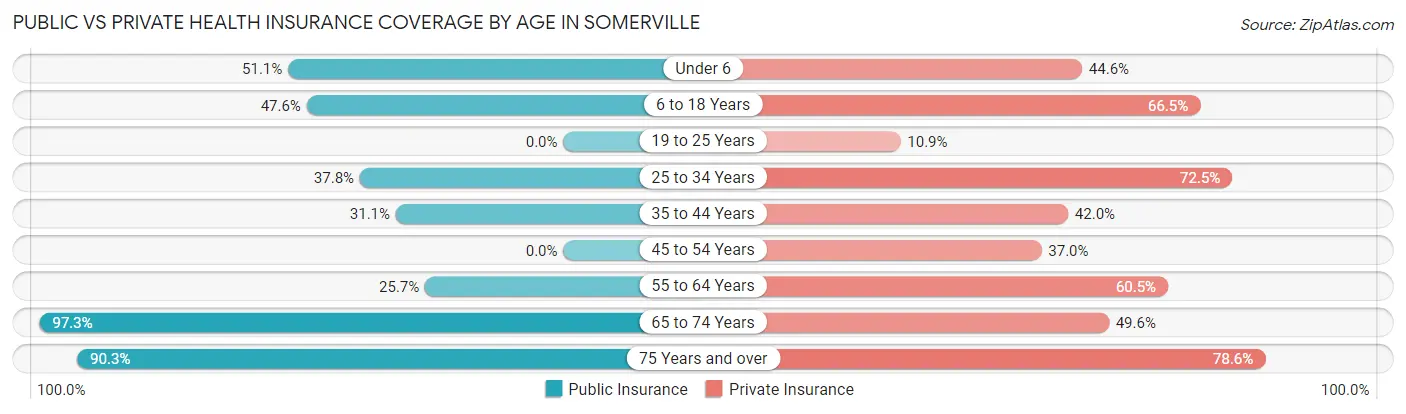
| Age Bracket | Public Insurance | Private Insurance |
| Under 6 | 47 (51.1%) | 41 (44.6%) |
| 6 to 18 Years | 91 (47.6%) | 127 (66.5%) |
| 19 to 25 Years | 0 (0.0%) | 10 (10.9%) |
| 25 to 34 Years | 37 (37.8%) | 71 (72.5%) |
| 35 to 44 Years | 60 (31.1%) | 81 (42.0%) |
| 45 to 54 Years | 0 (0.0%) | 20 (37.0%) |
| 55 to 64 Years | 39 (25.7%) | 92 (60.5%) |
| 65 to 74 Years | 214 (97.3%) | 109 (49.5%) |
| 75 Years and over | 139 (90.3%) | 121 (78.6%) |
| Total | 627 (50.3%) | 672 (53.9%) |
Disability Status by Sex by Age in Somerville
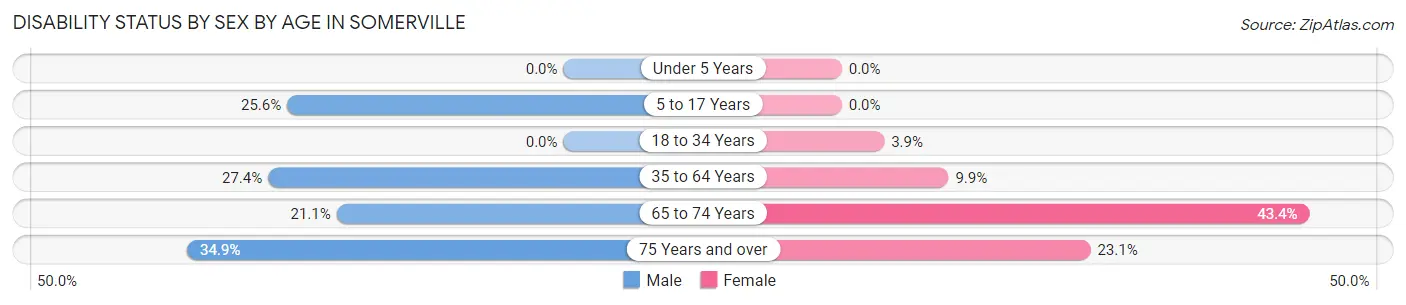
| Age Bracket | Male | Female |
| Under 5 Years | 0 (0.0%) | 0 (0.0%) |
| 5 to 17 Years | 30 (25.6%) | 0 (0.0%) |
| 18 to 34 Years | 0 (0.0%) | 5 (3.9%) |
| 35 to 64 Years | 54 (27.4%) | 20 (9.9%) |
| 65 to 74 Years | 24 (21.0%) | 46 (43.4%) |
| 75 Years and over | 22 (34.9%) | 21 (23.1%) |
Disability Class by Sex by Age in Somerville
Disability Class: Hearing Difficulty
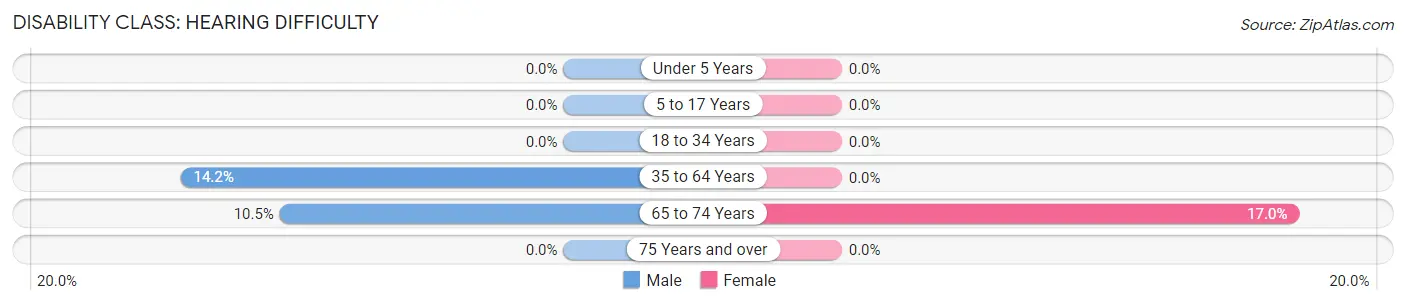
| Age Bracket | Male | Female |
| Under 5 Years | 0 (0.0%) | 0 (0.0%) |
| 5 to 17 Years | 0 (0.0%) | 0 (0.0%) |
| 18 to 34 Years | 0 (0.0%) | 0 (0.0%) |
| 35 to 64 Years | 28 (14.2%) | 0 (0.0%) |
| 65 to 74 Years | 12 (10.5%) | 18 (17.0%) |
| 75 Years and over | 0 (0.0%) | 0 (0.0%) |
Disability Class: Vision Difficulty
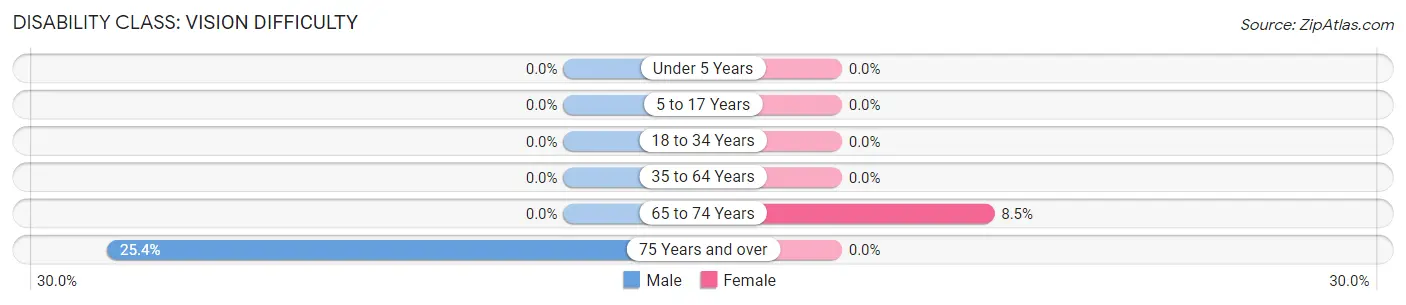
| Age Bracket | Male | Female |
| Under 5 Years | 0 (0.0%) | 0 (0.0%) |
| 5 to 17 Years | 0 (0.0%) | 0 (0.0%) |
| 18 to 34 Years | 0 (0.0%) | 0 (0.0%) |
| 35 to 64 Years | 0 (0.0%) | 0 (0.0%) |
| 65 to 74 Years | 0 (0.0%) | 9 (8.5%) |
| 75 Years and over | 16 (25.4%) | 0 (0.0%) |
Disability Class: Cognitive Difficulty
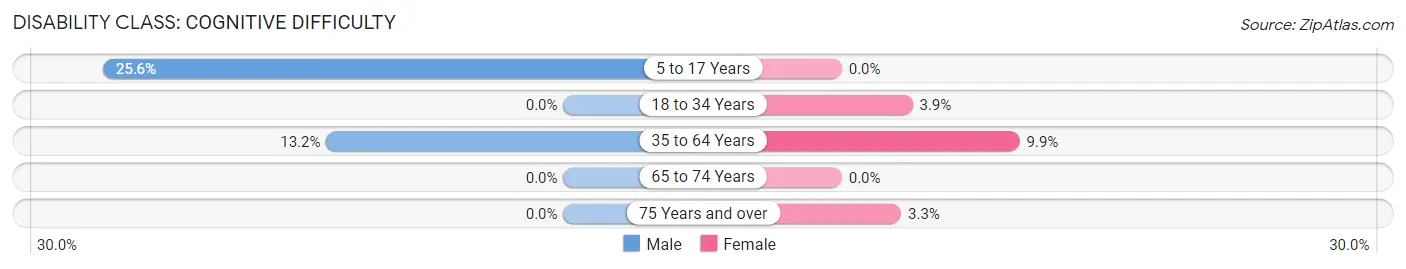
| Age Bracket | Male | Female |
| 5 to 17 Years | 30 (25.6%) | 0 (0.0%) |
| 18 to 34 Years | 0 (0.0%) | 5 (3.9%) |
| 35 to 64 Years | 26 (13.2%) | 20 (9.9%) |
| 65 to 74 Years | 0 (0.0%) | 0 (0.0%) |
| 75 Years and over | 0 (0.0%) | 3 (3.3%) |
Disability Class: Ambulatory Difficulty
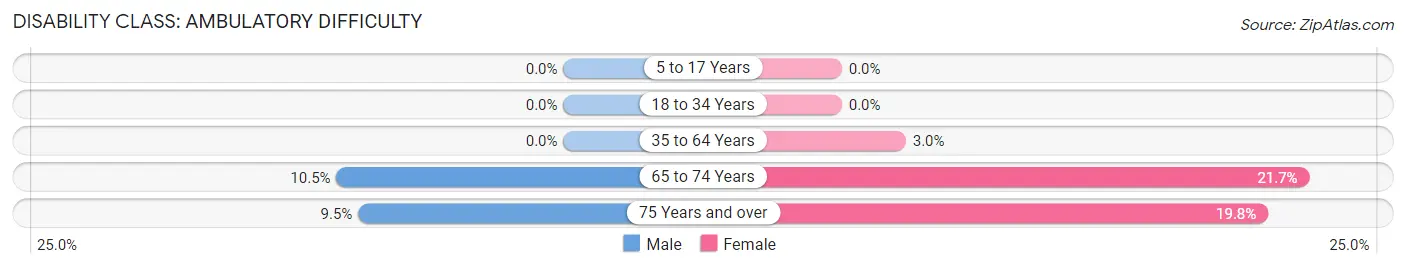
| Age Bracket | Male | Female |
| 5 to 17 Years | 0 (0.0%) | 0 (0.0%) |
| 18 to 34 Years | 0 (0.0%) | 0 (0.0%) |
| 35 to 64 Years | 0 (0.0%) | 6 (3.0%) |
| 65 to 74 Years | 12 (10.5%) | 23 (21.7%) |
| 75 Years and over | 6 (9.5%) | 18 (19.8%) |
Disability Class: Self-Care Difficulty
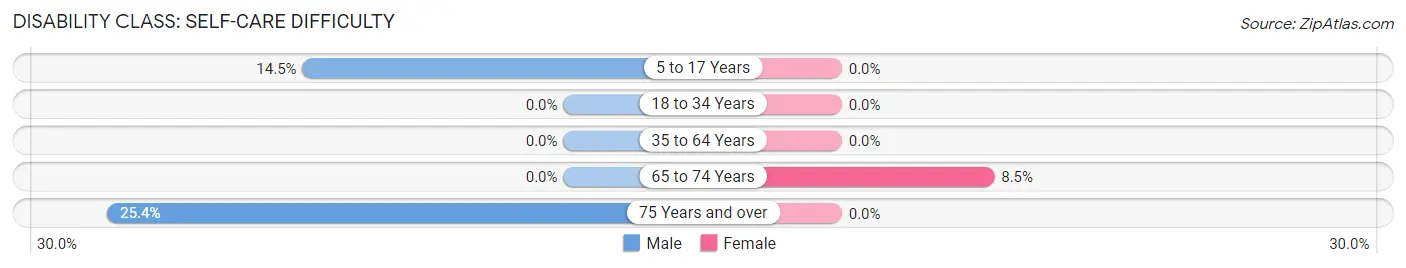
| Age Bracket | Male | Female |
| 5 to 17 Years | 17 (14.5%) | 0 (0.0%) |
| 18 to 34 Years | 0 (0.0%) | 0 (0.0%) |
| 35 to 64 Years | 0 (0.0%) | 0 (0.0%) |
| 65 to 74 Years | 0 (0.0%) | 9 (8.5%) |
| 75 Years and over | 16 (25.4%) | 0 (0.0%) |
Technology Access in Somerville
Computing Device Access in Somerville
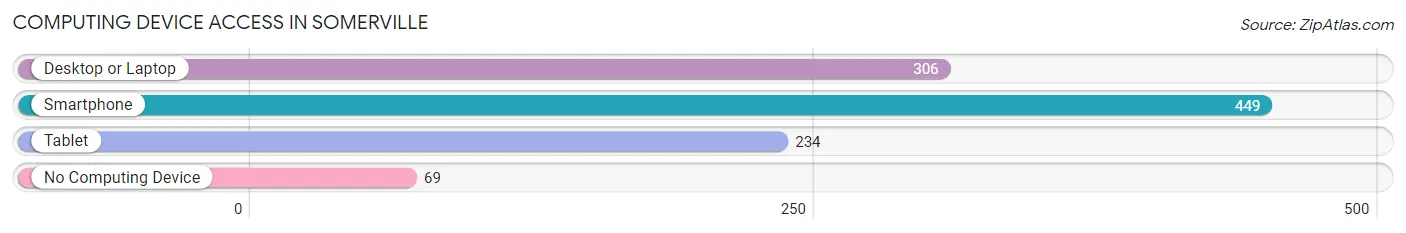
| Device Type | # Households | % Households |
| Desktop or Laptop | 306 | 56.7% |
| Smartphone | 449 | 83.2% |
| Tablet | 234 | 43.3% |
| No Computing Device | 69 | 12.8% |
| Total | 540 | 100.0% |
Internet Access in Somerville
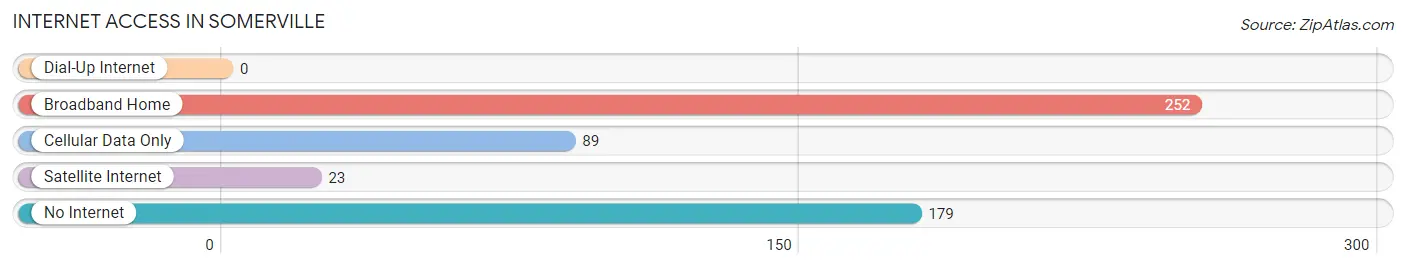
| Internet Type | # Households | % Households |
| Dial-Up Internet | 0 | 0.0% |
| Broadband Home | 252 | 46.7% |
| Cellular Data Only | 89 | 16.5% |
| Satellite Internet | 23 | 4.3% |
| No Internet | 179 | 33.2% |
| Total | 540 | 100.0% |
Somerville Summary
Somerville is a small town located in Burleson County, Texas, United States. It is situated about halfway between Houston and Austin, and is part of the Bryan-College Station metropolitan area. The population was 1,093 at the 2010 census.
History
Somerville was founded in 1846 by a group of settlers from Somerville, Massachusetts. The town was named after the Massachusetts town, and the settlers brought with them the same New England style of architecture. The town was incorporated in 1854, and the first post office was established in 1855.
The town was an important stop on the Houston and Texas Central Railway, which was built in 1871. The railway brought new settlers to the area, and the town grew rapidly. By the early 1900s, Somerville had become a thriving agricultural center, with cotton, corn, and other crops being grown in the area.
Geography
Somerville is located at 30°45'25" North, 96°37'45" West (30.756944, -96.629167). It is situated in the rolling hills of Central Texas, about halfway between Houston and Austin. The town is located on the Brazos River, and is surrounded by the Somerville Lake and the Somerville Wildlife Management Area.
The climate in Somerville is hot and humid in the summer, and mild in the winter. The average annual temperature is around 70°F (21°C). The average annual precipitation is around 40 inches (101 cm).
Economy
The economy of Somerville is largely based on agriculture. Cotton, corn, and other crops are grown in the area, and the town is home to several large farms. The town is also home to several small businesses, including a grocery store, a hardware store, and a few restaurants.
The town is also home to a number of manufacturing companies, including a plastics factory and a metal fabrication plant. The town is also home to a number of oil and gas companies, which are involved in the exploration and production of oil and gas in the area.
Demographics
As of the 2010 census, there were 1,093 people, 431 households, and 294 families residing in the town. The population density was 545.3 people per square mile (210.9/km2). The racial makeup of the town was 81.2% White, 11.2% African American, 0.3% Native American, 0.2% Asian, 0.1% Pacific Islander, 5.2% from other races, and 1.9% from two or more races. Hispanic or Latino of any race were 11.2% of the population.
The median income for a household in the town was $37,500, and the median income for a family was $45,000. The per capita income for the town was $17,845. About 15.2% of families and 18.2% of the population were below the poverty line, including 25.2% of those under age 18 and 11.2% of those age 65 or over.
Common Questions
What is Per Capita Income in Somerville?
Per Capita income in Somerville is $30,565.
What is the Median Family Income in Somerville?
Median Family Income in Somerville is $69,219.
What is the Median Household income in Somerville?
Median Household Income in Somerville is $59,394.
What is Income or Wage Gap in Somerville?
Income or Wage Gap in Somerville is 53.3%.
Women in Somerville earn 46.7 cents for every dollar earned by a man.
What is Inequality or Gini Index in Somerville?
Inequality or Gini Index in Somerville is 0.52.
What is the Total Population of Somerville?
Total Population of Somerville is 1,246.
What is the Total Male Population of Somerville?
Total Male Population of Somerville is 571.
What is the Total Female Population of Somerville?
Total Female Population of Somerville is 675.
What is the Ratio of Males per 100 Females in Somerville?
There are 84.59 Males per 100 Females in Somerville.
What is the Ratio of Females per 100 Males in Somerville?
There are 118.21 Females per 100 Males in Somerville.
What is the Median Population Age in Somerville?
Median Population Age in Somerville is 43.4 Years.
What is the Average Family Size in Somerville
Average Family Size in Somerville is 2.8 People.
What is the Average Household Size in Somerville
Average Household Size in Somerville is 2.3 People.
How Large is the Labor Force in Somerville?
There are 460 People in the Labor Forcein in Somerville.
What is the Percentage of People in the Labor Force in Somerville?
47.1% of People are in the Labor Force in Somerville.
What is the Unemployment Rate in Somerville?
Unemployment Rate in Somerville is 1.1%.