Simonton, TX Map & Demographics
Simonton Map
Simonton Overview
$40,858
PER CAPITA INCOME
$128,333
AVG FAMILY INCOME
$127,857
AVG HOUSEHOLD INCOME
32.2%
WAGE / INCOME GAP [ % ]
67.8¢/ $1
WAGE / INCOME GAP [ $ ]
0.45
INEQUALITY / GINI INDEX
856
TOTAL POPULATION
455
MALE POPULATION
401
FEMALE POPULATION
113.47
MALES / 100 FEMALES
88.13
FEMALES / 100 MALES
37.0
MEDIAN AGE
3.8
AVG FAMILY SIZE
3.5
AVG HOUSEHOLD SIZE
381
LABOR FORCE [ PEOPLE ]
62.8%
PERCENT IN LABOR FORCE
1.6%
UNEMPLOYMENT RATE
Simonton Zip Codes
Income in Simonton
Income Overview in Simonton
Per Capita Income in Simonton is $40,858, while median incomes of families and households are $128,333 and $127,857 respectively.
| Characteristic | Number | Measure |
| Per Capita Income | 856 | $40,858 |
| Median Family Income | 210 | $128,333 |
| Mean Family Income | 210 | $141,698 |
| Median Household Income | 248 | $127,857 |
| Mean Household Income | 248 | $134,447 |
| Income Deficit | 210 | $0 |
| Wage / Income Gap (%) | 856 | 32.23% |
| Wage / Income Gap ($) | 856 | 67.77¢ per $1 |
| Gini / Inequality Index | 856 | 0.45 |
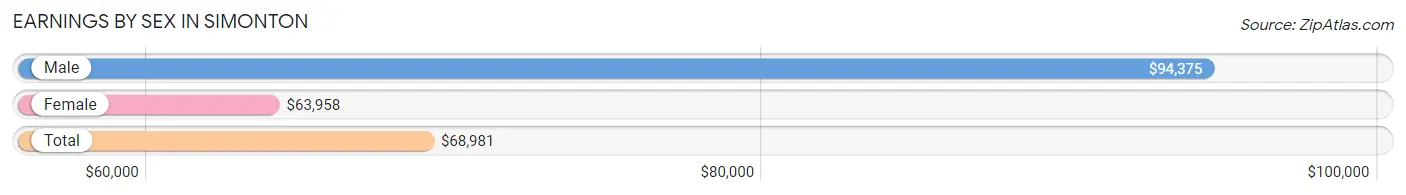
Earnings by Sex in Simonton
Average Earnings in Simonton are $68,981, $94,375 for men and $63,958 for women, a difference of 32.2%.
| Sex | Number | Average Earnings |
| Male | 213 (54.9%) | $94,375 |
| Female | 175 (45.1%) | $63,958 |
| Total | 388 (100.0%) | $68,981 |
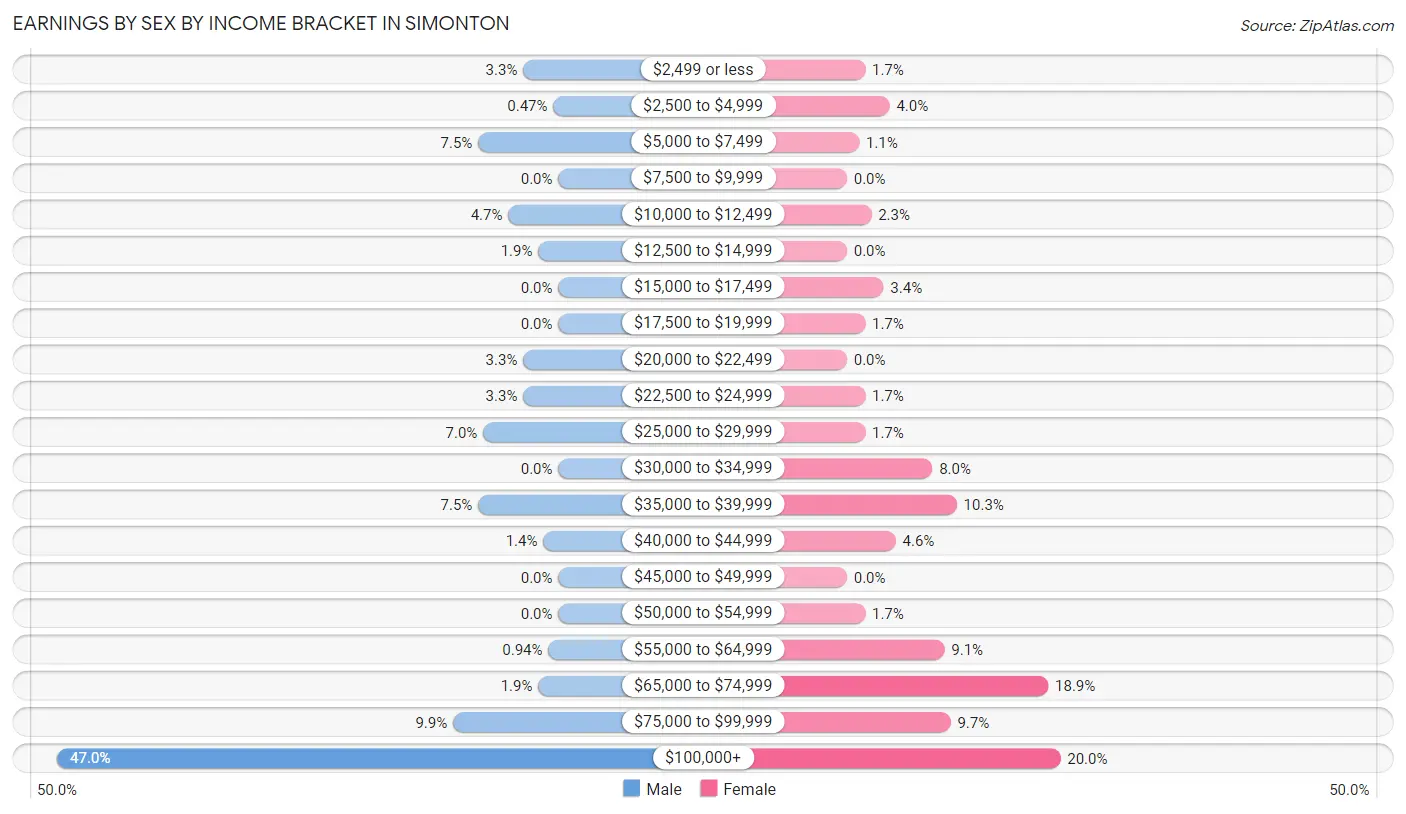
Earnings by Sex by Income Bracket in Simonton
The most common earnings brackets in Simonton are $100,000+ for men (100 | 46.9%) and $100,000+ for women (35 | 20.0%).
| Income | Male | Female |
| $2,499 or less | 7 (3.3%) | 3 (1.7%) |
| $2,500 to $4,999 | 1 (0.5%) | 7 (4.0%) |
| $5,000 to $7,499 | 16 (7.5%) | 2 (1.1%) |
| $7,500 to $9,999 | 0 (0.0%) | 0 (0.0%) |
| $10,000 to $12,499 | 10 (4.7%) | 4 (2.3%) |
| $12,500 to $14,999 | 4 (1.9%) | 0 (0.0%) |
| $15,000 to $17,499 | 0 (0.0%) | 6 (3.4%) |
| $17,500 to $19,999 | 0 (0.0%) | 3 (1.7%) |
| $20,000 to $22,499 | 7 (3.3%) | 0 (0.0%) |
| $22,500 to $24,999 | 7 (3.3%) | 3 (1.7%) |
| $25,000 to $29,999 | 15 (7.0%) | 3 (1.7%) |
| $30,000 to $34,999 | 0 (0.0%) | 14 (8.0%) |
| $35,000 to $39,999 | 16 (7.5%) | 18 (10.3%) |
| $40,000 to $44,999 | 3 (1.4%) | 8 (4.6%) |
| $45,000 to $49,999 | 0 (0.0%) | 0 (0.0%) |
| $50,000 to $54,999 | 0 (0.0%) | 3 (1.7%) |
| $55,000 to $64,999 | 2 (0.9%) | 16 (9.1%) |
| $65,000 to $74,999 | 4 (1.9%) | 33 (18.9%) |
| $75,000 to $99,999 | 21 (9.9%) | 17 (9.7%) |
| $100,000+ | 100 (46.9%) | 35 (20.0%) |
| Total | 213 (100.0%) | 175 (100.0%) |
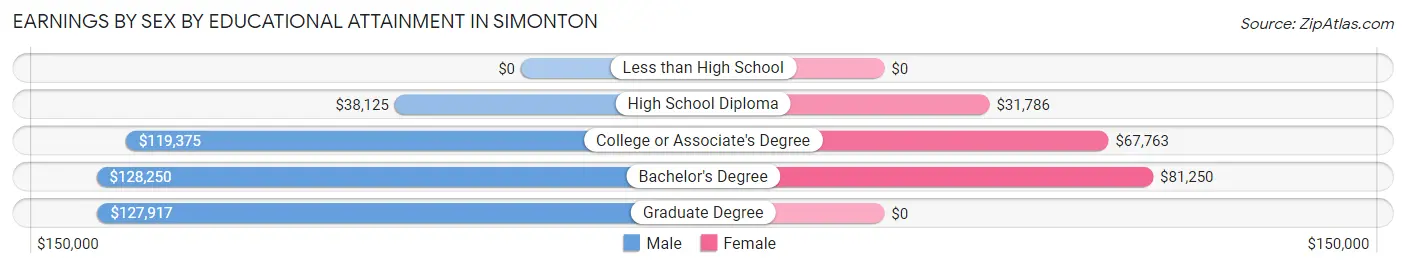
Earnings by Sex by Educational Attainment in Simonton
Average earnings in Simonton are $101,071 for men and $64,792 for women, a difference of 35.9%. Men with an educational attainment of bachelor's degree enjoy the highest average annual earnings of $128,250, while those with high school diploma education earn the least with $38,125. Women with an educational attainment of bachelor's degree earn the most with the average annual earnings of $81,250, while those with high school diploma education have the smallest earnings of $31,786.
| Educational Attainment | Male Income | Female Income |
| Less than High School | - | - |
| High School Diploma | $38,125 | $31,786 |
| College or Associate's Degree | $119,375 | $67,763 |
| Bachelor's Degree | $128,250 | $81,250 |
| Graduate Degree | $127,917 | $0 |
| Total | $101,071 | $64,792 |
Family Income in Simonton
Family Income Brackets in Simonton
According to the Simonton family income data, there are 52 families falling into the $200,000+ income range, which is the most common income bracket and makes up 24.8% of all families.
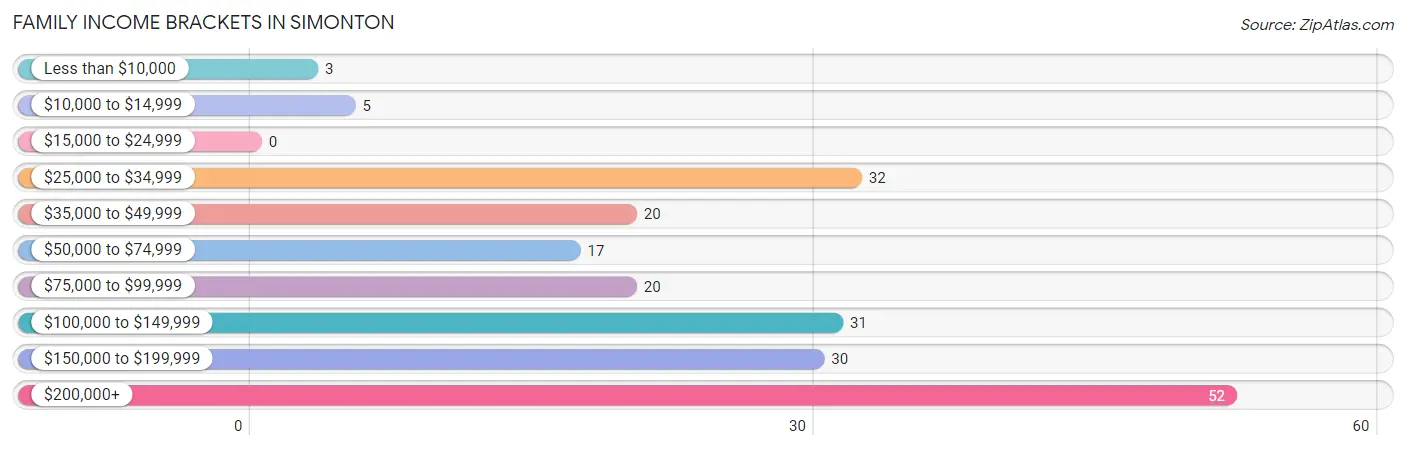
| Income Bracket | # Families | % Families |
| Less than $10,000 | 3 | 1.4% |
| $10,000 to $14,999 | 5 | 2.4% |
| $15,000 to $24,999 | 0 | 0.0% |
| $25,000 to $34,999 | 32 | 15.2% |
| $35,000 to $49,999 | 20 | 9.5% |
| $50,000 to $74,999 | 17 | 8.1% |
| $75,000 to $99,999 | 20 | 9.5% |
| $100,000 to $149,999 | 31 | 14.8% |
| $150,000 to $199,999 | 30 | 14.3% |
| $200,000+ | 52 | 24.8% |
Family Income by Famaliy Size in Simonton
4-person families (59 | 28.1%) account for the highest median family income in Simonton with $208,750 per family, while 4-person families (59 | 28.1%) have the highest median income of $52,188 per family member.
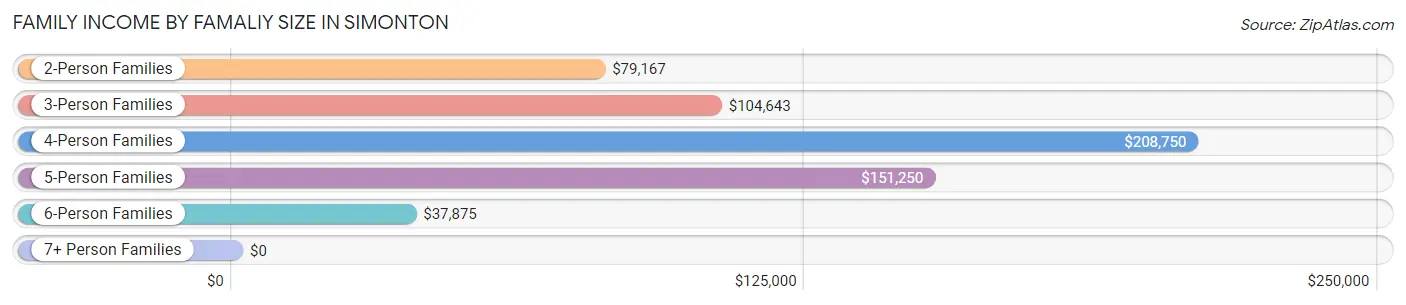
| Income Bracket | # Families | Median Income |
| 2-Person Families | 76 (36.2%) | $79,167 |
| 3-Person Families | 26 (12.4%) | $104,643 |
| 4-Person Families | 59 (28.1%) | $208,750 |
| 5-Person Families | 10 (4.8%) | $151,250 |
| 6-Person Families | 34 (16.2%) | $37,875 |
| 7+ Person Families | 5 (2.4%) | $0 |
| Total | 210 (100.0%) | $128,333 |
Family Income by Number of Earners in Simonton
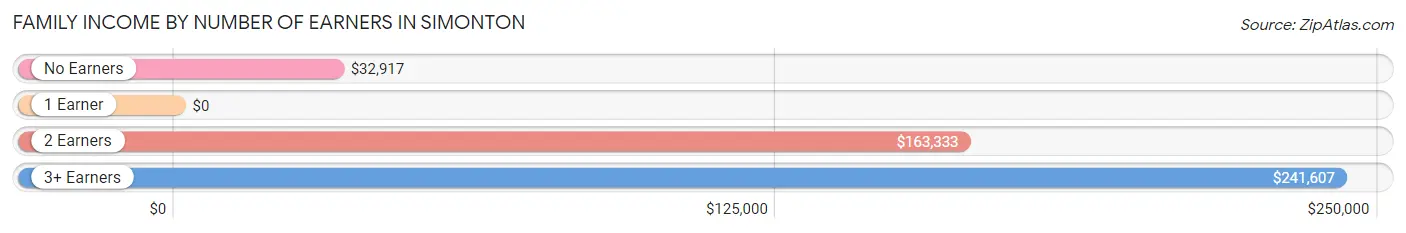
| Number of Earners | # Families | Median Income |
| No Earners | 32 (15.2%) | $32,917 |
| 1 Earner | 61 (29.0%) | $0 |
| 2 Earners | 84 (40.0%) | $163,333 |
| 3+ Earners | 33 (15.7%) | $241,607 |
| Total | 210 (100.0%) | $128,333 |
Household Income in Simonton
Household Income Brackets in Simonton
With 59 households falling in the category, the $200,000+ income range is the most frequent in Simonton, accounting for 23.8% of all households. In contrast, only 3 households (1.2%) fall into the $15,000 to $24,999 income bracket, making it the least populous group.
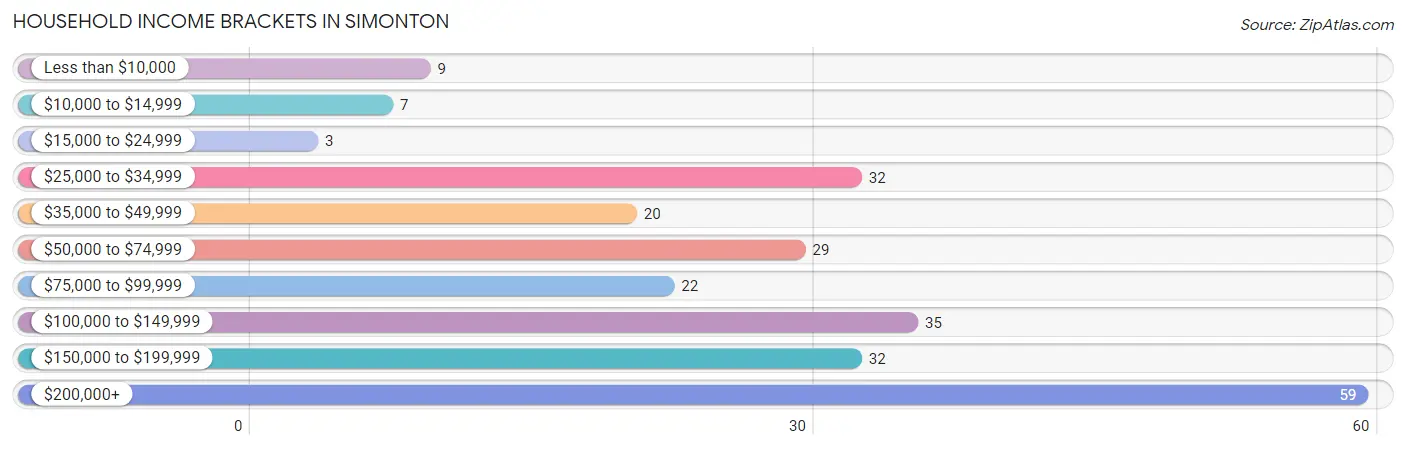
| Income Bracket | # Households | % Households |
| Less than $10,000 | 9 | 3.6% |
| $10,000 to $14,999 | 7 | 2.8% |
| $15,000 to $24,999 | 3 | 1.2% |
| $25,000 to $34,999 | 32 | 12.9% |
| $35,000 to $49,999 | 20 | 8.1% |
| $50,000 to $74,999 | 29 | 11.7% |
| $75,000 to $99,999 | 22 | 8.9% |
| $100,000 to $149,999 | 35 | 14.1% |
| $150,000 to $199,999 | 32 | 12.9% |
| $200,000+ | 59 | 23.8% |
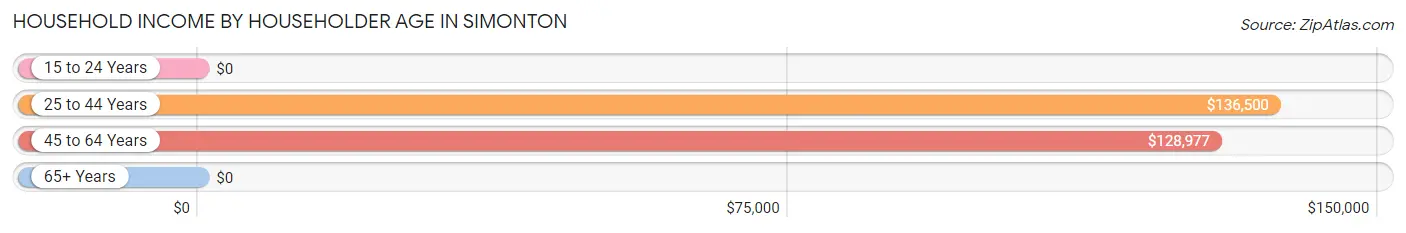
Household Income by Householder Age in Simonton
The median household income in Simonton is $127,857, with the highest median household income of $136,500 found in the 25 to 44 years age bracket for the primary householder. A total of 112 households (45.2%) fall into this category.
| Income Bracket | # Households | Median Income |
| 15 to 24 Years | 0 (0.0%) | $0 |
| 25 to 44 Years | 112 (45.2%) | $136,500 |
| 45 to 64 Years | 91 (36.7%) | $128,977 |
| 65+ Years | 45 (18.1%) | $0 |
| Total | 248 (100.0%) | $127,857 |
Poverty in Simonton
Income Below Poverty by Sex and Age in Simonton
With 18.9% poverty level for males and 11.0% for females among the residents of Simonton, 18 to 24 year old males and 6 to 11 year old females are the most vulnerable to poverty, with 40 males (56.3%) and 19 females (47.5%) in their respective age groups living below the poverty level.
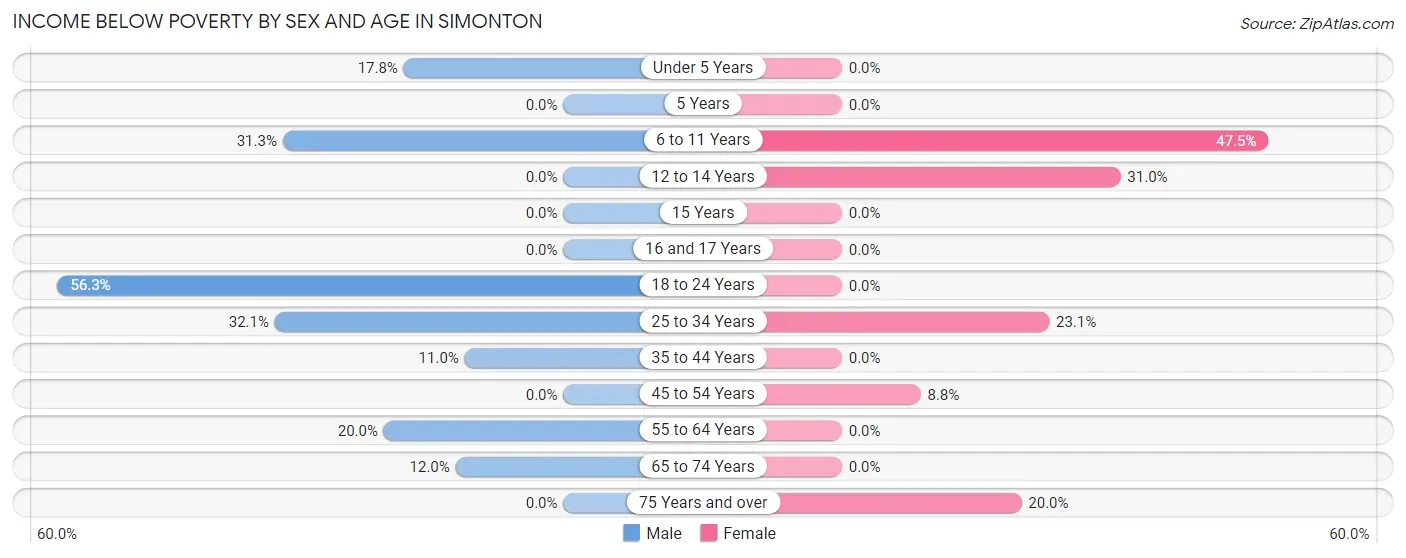
| Age Bracket | Male | Female |
| Under 5 Years | 8 (17.8%) | 0 (0.0%) |
| 5 Years | 0 (0.0%) | 0 (0.0%) |
| 6 to 11 Years | 10 (31.2%) | 19 (47.5%) |
| 12 to 14 Years | 0 (0.0%) | 9 (31.0%) |
| 15 Years | 0 (0.0%) | 0 (0.0%) |
| 16 and 17 Years | 0 (0.0%) | 0 (0.0%) |
| 18 to 24 Years | 40 (56.3%) | 0 (0.0%) |
| 25 to 34 Years | 9 (32.1%) | 9 (23.1%) |
| 35 to 44 Years | 10 (11.0%) | 0 (0.0%) |
| 45 to 54 Years | 0 (0.0%) | 5 (8.8%) |
| 55 to 64 Years | 3 (20.0%) | 0 (0.0%) |
| 65 to 74 Years | 6 (12.0%) | 0 (0.0%) |
| 75 Years and over | 0 (0.0%) | 2 (20.0%) |
| Total | 86 (18.9%) | 44 (11.0%) |
Income Above Poverty by Sex and Age in Simonton
According to the poverty statistics in Simonton, males aged 12 to 14 years and females aged under 5 years are the age groups that are most secure financially, with 100.0% of males and 100.0% of females in these age groups living above the poverty line.
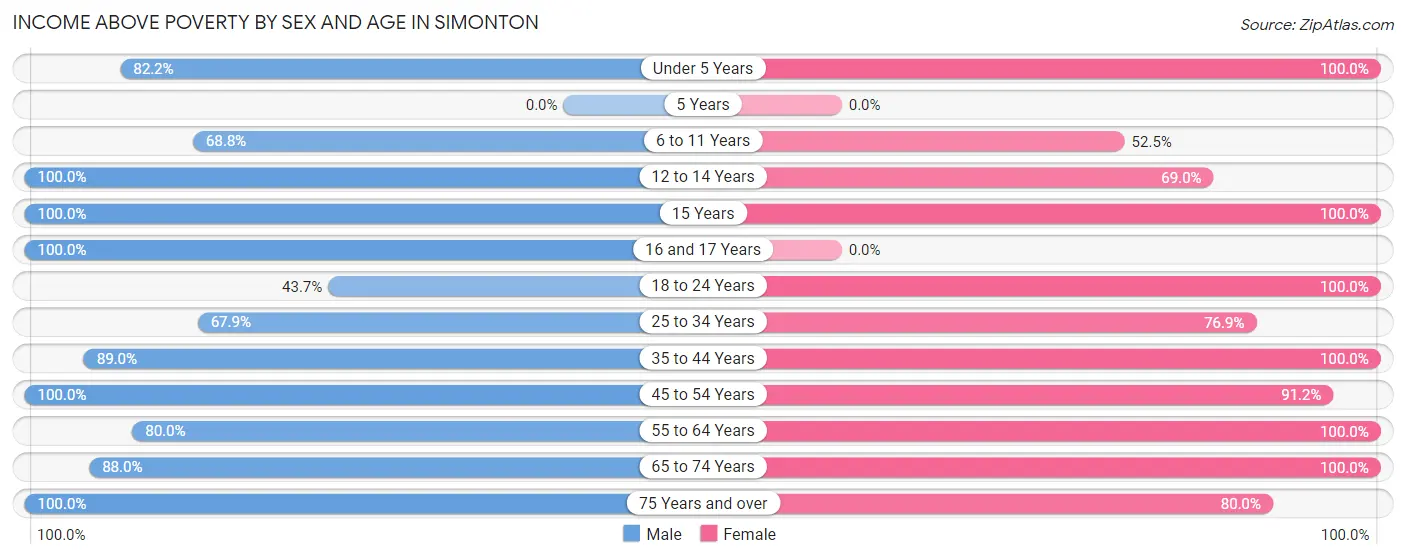
| Age Bracket | Male | Female |
| Under 5 Years | 37 (82.2%) | 43 (100.0%) |
| 5 Years | 0 (0.0%) | 0 (0.0%) |
| 6 to 11 Years | 22 (68.8%) | 21 (52.5%) |
| 12 to 14 Years | 23 (100.0%) | 20 (69.0%) |
| 15 Years | 19 (100.0%) | 18 (100.0%) |
| 16 and 17 Years | 8 (100.0%) | 0 (0.0%) |
| 18 to 24 Years | 31 (43.7%) | 14 (100.0%) |
| 25 to 34 Years | 19 (67.9%) | 30 (76.9%) |
| 35 to 44 Years | 81 (89.0%) | 86 (100.0%) |
| 45 to 54 Years | 69 (100.0%) | 52 (91.2%) |
| 55 to 64 Years | 12 (80.0%) | 42 (100.0%) |
| 65 to 74 Years | 44 (88.0%) | 23 (100.0%) |
| 75 Years and over | 4 (100.0%) | 8 (80.0%) |
| Total | 369 (81.1%) | 357 (89.0%) |
Income Below Poverty Among Married-Couple Families in Simonton
The poverty statistics for married-couple families in Simonton show that 5.0% or 9 of the total 180 families live below the poverty line. Families with 3 or 4 children have the highest poverty rate of 23.7%, comprising of 9 families. On the other hand, families with no children have the lowest poverty rate of 0.0%, which includes 0 families.
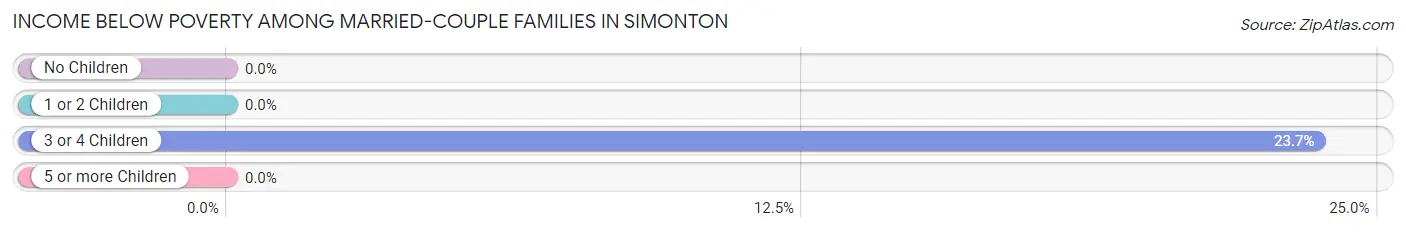
| Children | Above Poverty | Below Poverty |
| No Children | 89 (100.0%) | 0 (0.0%) |
| 1 or 2 Children | 53 (100.0%) | 0 (0.0%) |
| 3 or 4 Children | 29 (76.3%) | 9 (23.7%) |
| 5 or more Children | 0 (0.0%) | 0 (0.0%) |
| Total | 171 (95.0%) | 9 (5.0%) |
Income Below Poverty Among Single-Parent Households in Simonton
According to the poverty data in Simonton, 23.1% or 3 single-father households and 29.4% or 5 single-mother households are living below the poverty line. Among single-father households, those with no children have the highest poverty rate, with 3 households (50.0%) experiencing poverty. Likewise, among single-mother households, those with 1 or 2 children have the highest poverty rate, with 5 households (29.4%) falling below the poverty line.
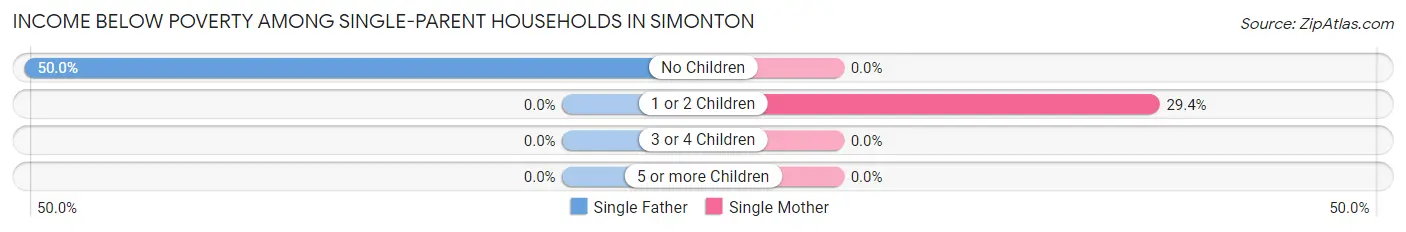
| Children | Single Father | Single Mother |
| No Children | 3 (50.0%) | 0 (0.0%) |
| 1 or 2 Children | 0 (0.0%) | 5 (29.4%) |
| 3 or 4 Children | 0 (0.0%) | 0 (0.0%) |
| 5 or more Children | 0 (0.0%) | 0 (0.0%) |
| Total | 3 (23.1%) | 5 (29.4%) |
Income Below Poverty Among Married-Couple vs Single-Parent Households in Simonton
The poverty data for Simonton shows that 9 of the married-couple family households (5.0%) and 8 of the single-parent households (26.7%) are living below the poverty level. Within the married-couple family households, those with 3 or 4 children have the highest poverty rate, with 9 households (23.7%) falling below the poverty line. Among the single-parent households, those with no children have the highest poverty rate, with 3 household (50.0%) living below poverty.
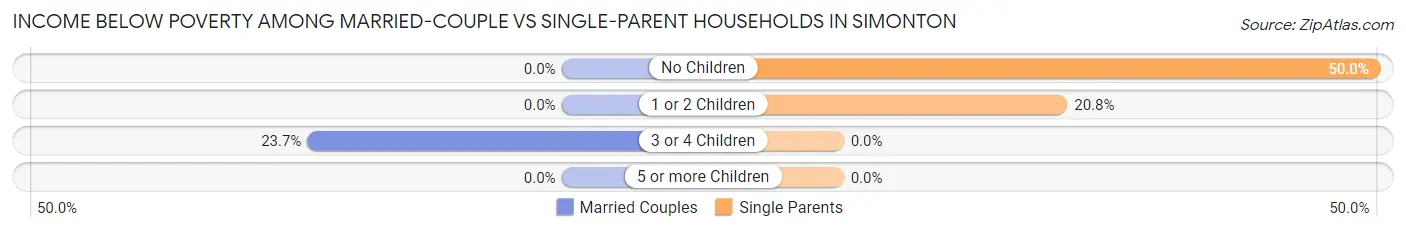
| Children | Married-Couple Families | Single-Parent Households |
| No Children | 0 (0.0%) | 3 (50.0%) |
| 1 or 2 Children | 0 (0.0%) | 5 (20.8%) |
| 3 or 4 Children | 9 (23.7%) | 0 (0.0%) |
| 5 or more Children | 0 (0.0%) | 0 (0.0%) |
| Total | 9 (5.0%) | 8 (26.7%) |
Race in Simonton
The most populous races in Simonton are White / Caucasian (584 | 68.2%), Hispanic or Latino (247 | 28.9%), and Two or more Races (201 | 23.5%).
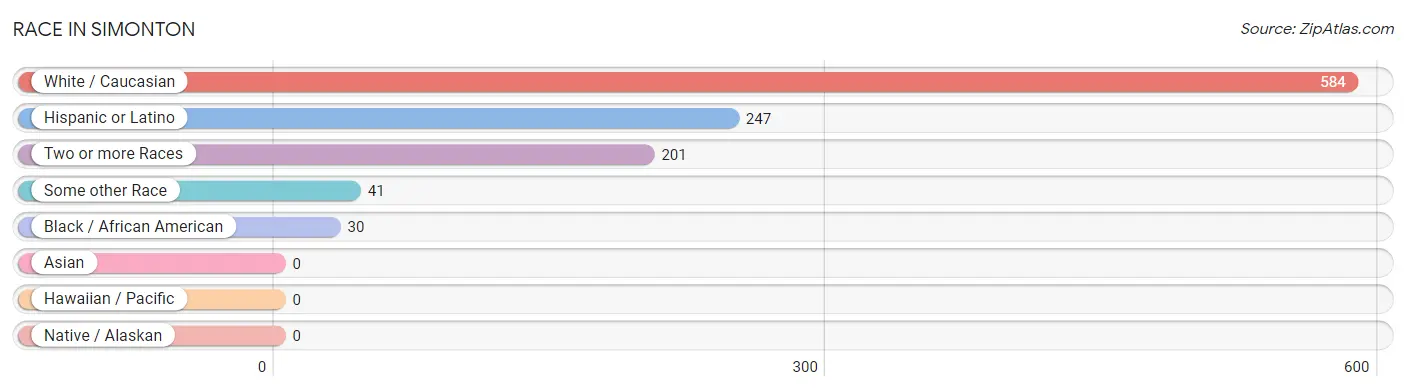
| Race | # Population | % Population |
| Asian | 0 | 0.0% |
| Black / African American | 30 | 3.5% |
| Hawaiian / Pacific | 0 | 0.0% |
| Hispanic or Latino | 247 | 28.9% |
| Native / Alaskan | 0 | 0.0% |
| White / Caucasian | 584 | 68.2% |
| Two or more Races | 201 | 23.5% |
| Some other Race | 41 | 4.8% |
| Total | 856 | 100.0% |
Ancestry in Simonton
The most populous ancestries reported in Simonton are Mexican (229 | 26.8%), German (114 | 13.3%), English (101 | 11.8%), Irish (28 | 3.3%), and American (26 | 3.0%), together accounting for 58.2% of all Simonton residents.
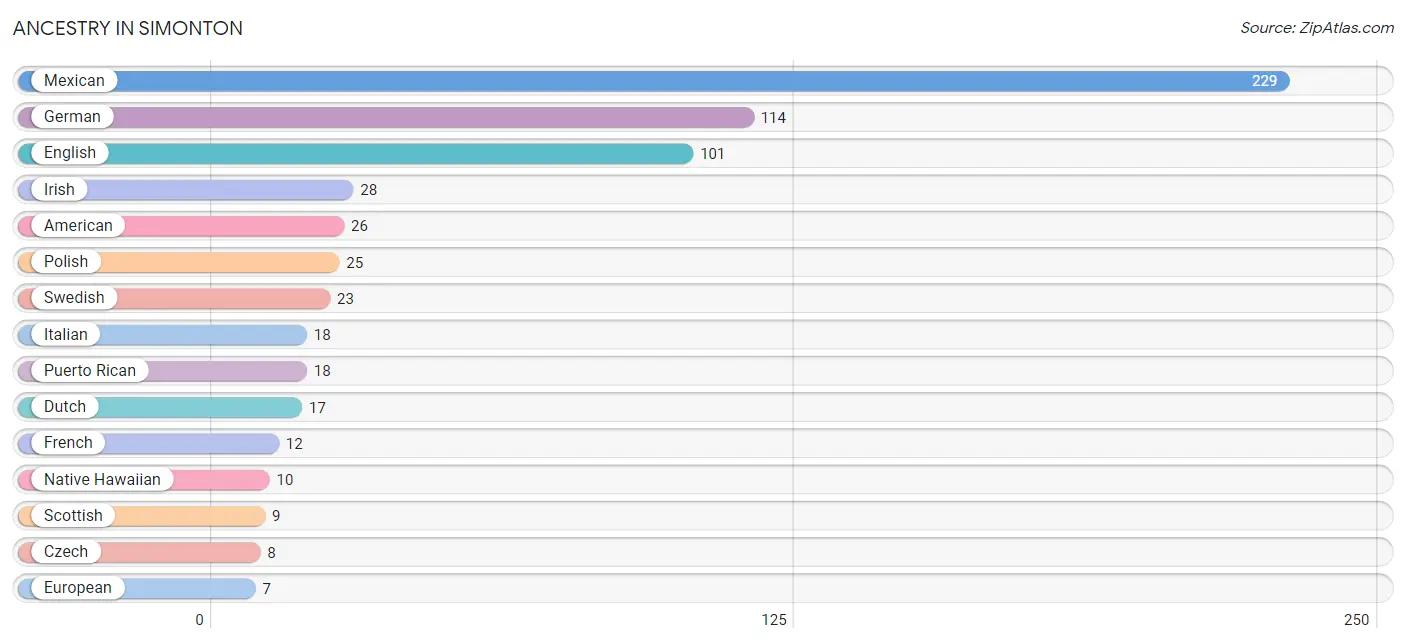
| Ancestry | # Population | % Population |
| American | 26 | 3.0% |
| Czech | 8 | 0.9% |
| Dutch | 17 | 2.0% |
| English | 101 | 11.8% |
| European | 7 | 0.8% |
| Finnish | 6 | 0.7% |
| French | 12 | 1.4% |
| French Canadian | 3 | 0.4% |
| German | 114 | 13.3% |
| Irish | 28 | 3.3% |
| Italian | 18 | 2.1% |
| Mexican | 229 | 26.8% |
| Native Hawaiian | 10 | 1.2% |
| Polish | 25 | 2.9% |
| Puerto Rican | 18 | 2.1% |
| Scotch-Irish | 7 | 0.8% |
| Scottish | 9 | 1.1% |
| Slovene | 3 | 0.4% |
| Swedish | 23 | 2.7% | View All 19 Rows |
Immigrants in Simonton
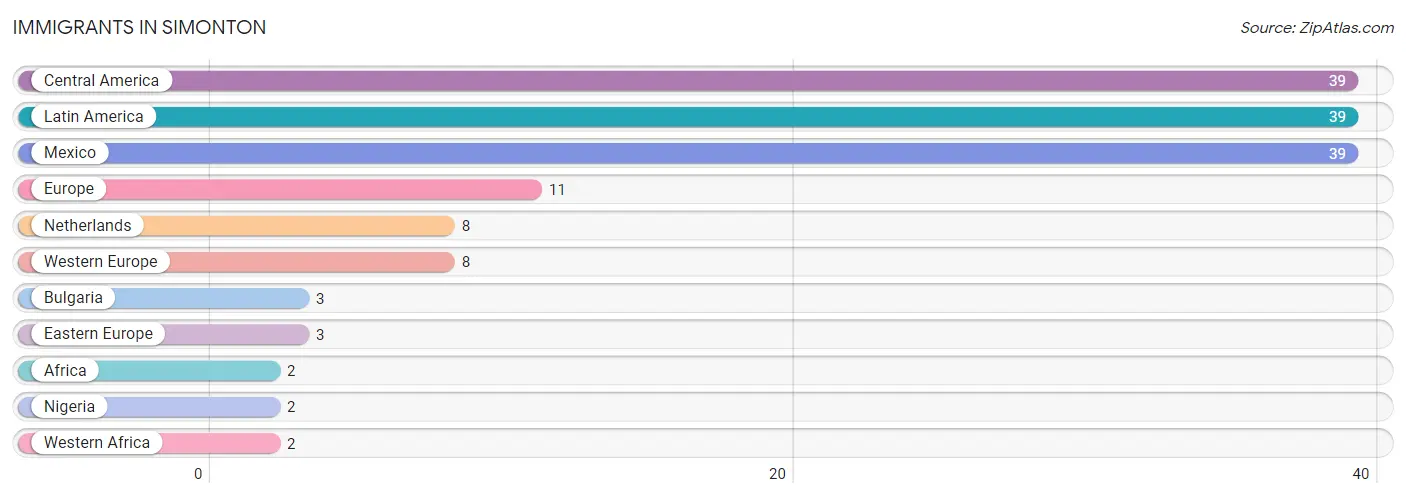
The most numerous immigrant groups reported in Simonton came from Central America (39 | 4.6%), Latin America (39 | 4.6%), Mexico (39 | 4.6%), Europe (11 | 1.3%), and Netherlands (8 | 0.9%), together accounting for 15.9% of all Simonton residents.
| Immigration Origin | # Population | % Population |
| Africa | 2 | 0.2% |
| Bulgaria | 3 | 0.4% |
| Central America | 39 | 4.6% |
| Eastern Europe | 3 | 0.4% |
| Europe | 11 | 1.3% |
| Latin America | 39 | 4.6% |
| Mexico | 39 | 4.6% |
| Netherlands | 8 | 0.9% |
| Nigeria | 2 | 0.2% |
| Western Africa | 2 | 0.2% |
| Western Europe | 8 | 0.9% | View All 11 Rows |
Sex and Age in Simonton
Sex and Age in Simonton
The most populous age groups in Simonton are 15 to 19 Years (58 | 12.8%) for men and 40 to 44 Years (64 | 16.0%) for women.
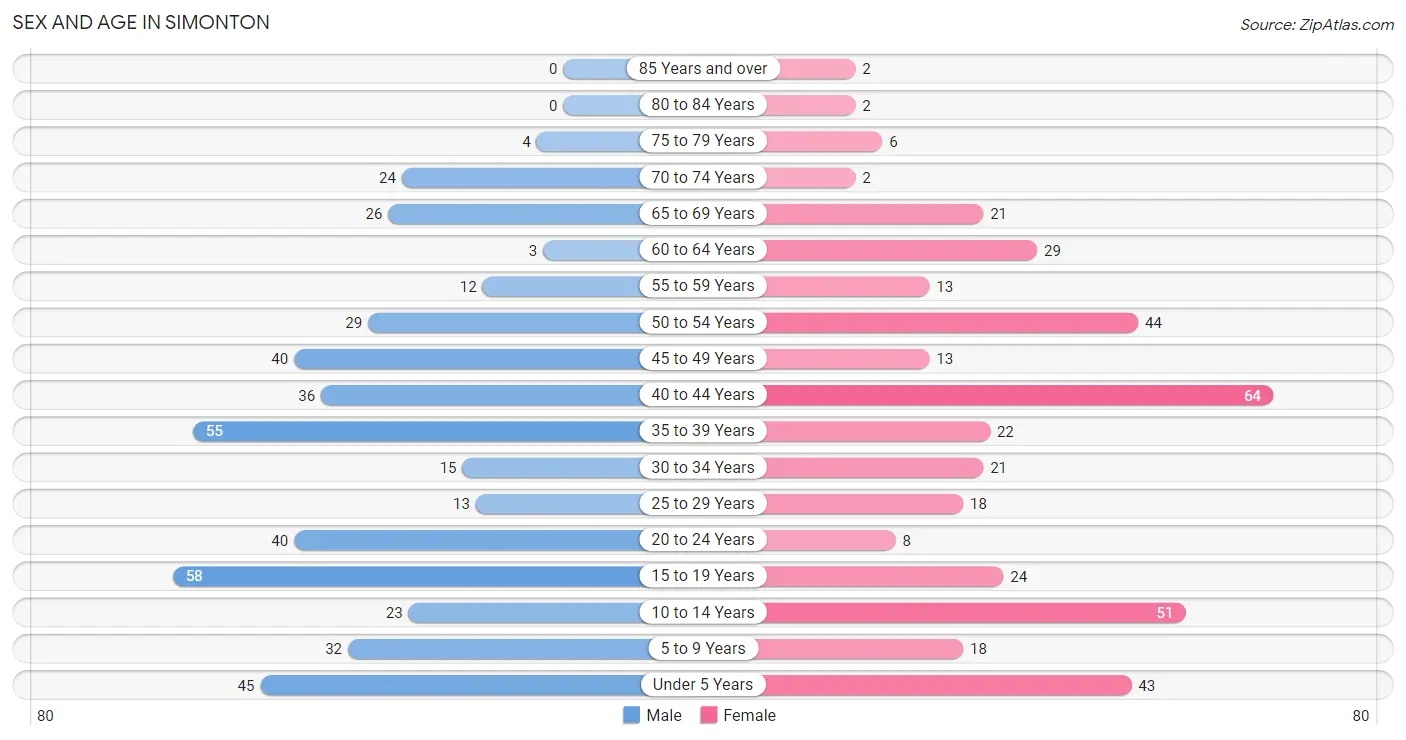
| Age Bracket | Male | Female |
| Under 5 Years | 45 (9.9%) | 43 (10.7%) |
| 5 to 9 Years | 32 (7.0%) | 18 (4.5%) |
| 10 to 14 Years | 23 (5.1%) | 51 (12.7%) |
| 15 to 19 Years | 58 (12.8%) | 24 (6.0%) |
| 20 to 24 Years | 40 (8.8%) | 8 (2.0%) |
| 25 to 29 Years | 13 (2.9%) | 18 (4.5%) |
| 30 to 34 Years | 15 (3.3%) | 21 (5.2%) |
| 35 to 39 Years | 55 (12.1%) | 22 (5.5%) |
| 40 to 44 Years | 36 (7.9%) | 64 (16.0%) |
| 45 to 49 Years | 40 (8.8%) | 13 (3.2%) |
| 50 to 54 Years | 29 (6.4%) | 44 (11.0%) |
| 55 to 59 Years | 12 (2.6%) | 13 (3.2%) |
| 60 to 64 Years | 3 (0.7%) | 29 (7.2%) |
| 65 to 69 Years | 26 (5.7%) | 21 (5.2%) |
| 70 to 74 Years | 24 (5.3%) | 2 (0.5%) |
| 75 to 79 Years | 4 (0.9%) | 6 (1.5%) |
| 80 to 84 Years | 0 (0.0%) | 2 (0.5%) |
| 85 Years and over | 0 (0.0%) | 2 (0.5%) |
| Total | 455 (100.0%) | 401 (100.0%) |
Families and Households in Simonton
Median Family Size in Simonton
The median family size in Simonton is 3.79 persons per family, with single female/mother families (17 | 8.1%) accounting for the largest median family size of 7.18 persons per family. On the other hand, single male/father families (13 | 6.2%) represent the smallest median family size with 2.92 persons per family.
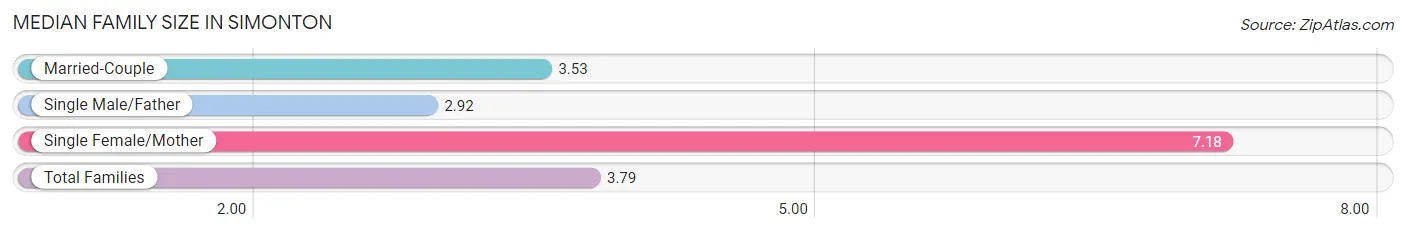
| Family Type | # Families | Family Size |
| Married-Couple | 180 (85.7%) | 3.53 |
| Single Male/Father | 13 (6.2%) | 2.92 |
| Single Female/Mother | 17 (8.1%) | 7.18 |
| Total Families | 210 (100.0%) | 3.79 |
Median Household Size in Simonton
The median household size in Simonton is 3.45 persons per household, with single female/mother households (17 | 6.9%) accounting for the largest median household size of 7.18 persons per household. non-family households (38 | 15.3%) represent the smallest median household size with 1.39 persons per household.
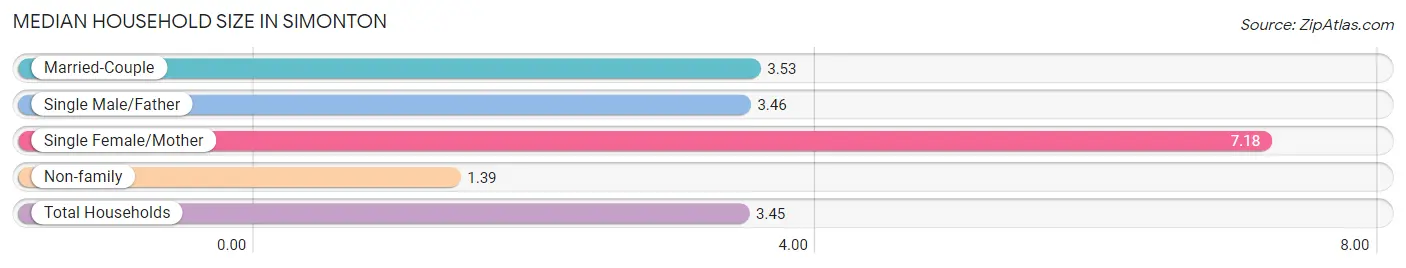
| Household Type | # Households | Household Size |
| Married-Couple | 180 (72.6%) | 3.53 |
| Single Male/Father | 13 (5.2%) | 3.46 |
| Single Female/Mother | 17 (6.9%) | 7.18 |
| Non-family | 38 (15.3%) | 1.39 |
| Total Households | 248 (100.0%) | 3.45 |
Household Size by Marriage Status in Simonton
Out of a total of 248 households in Simonton, 210 (84.7%) are family households, while 38 (15.3%) are nonfamily households. The most numerous type of family households are 2-person households, comprising 76, and the most common type of nonfamily households are 1-person households, comprising 20.
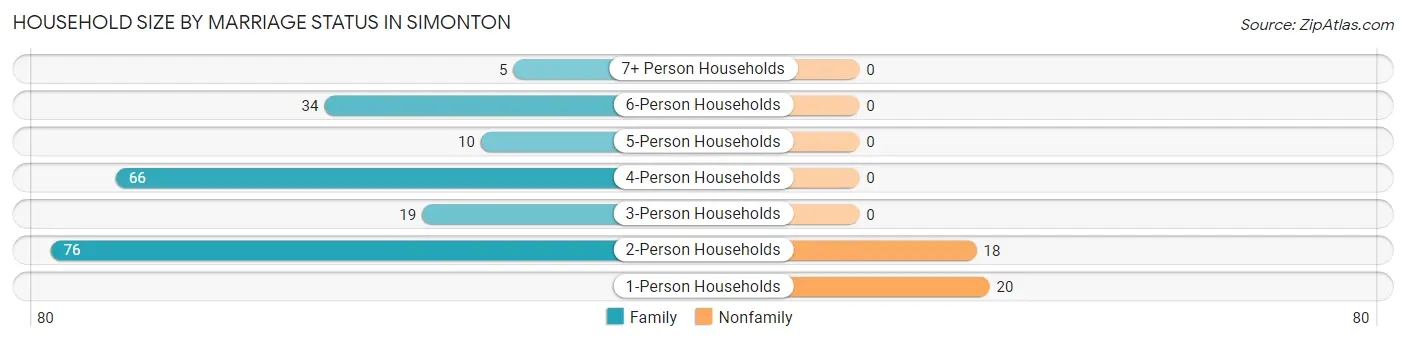
| Household Size | Family Households | Nonfamily Households |
| 1-Person Households | - | 20 (8.1%) |
| 2-Person Households | 76 (30.6%) | 18 (7.3%) |
| 3-Person Households | 19 (7.7%) | 0 (0.0%) |
| 4-Person Households | 66 (26.6%) | 0 (0.0%) |
| 5-Person Households | 10 (4.0%) | 0 (0.0%) |
| 6-Person Households | 34 (13.7%) | 0 (0.0%) |
| 7+ Person Households | 5 (2.0%) | 0 (0.0%) |
| Total | 210 (84.7%) | 38 (15.3%) |
Female Fertility in Simonton
Fertility by Age in Simonton
Average fertility rate in Simonton is 41.0 births per 1,000 women. Women in the age bracket of 35 to 50 years have the highest fertility rate with 69.0 births per 1,000 women. Women in the age bracket of 35 to 50 years acount for 100.0% of all women with births.
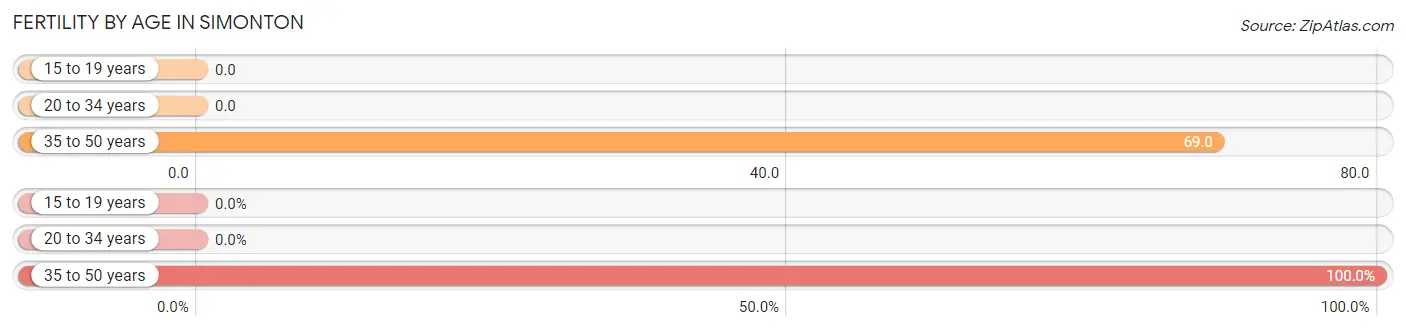
| Age Bracket | Women with Births | Births / 1,000 Women |
| 15 to 19 years | 0 (0.0%) | 0.0 |
| 20 to 34 years | 0 (0.0%) | 0.0 |
| 35 to 50 years | 7 (100.0%) | 69.0 |
| Total | 7 (100.0%) | 41.0 |
Fertility by Age by Marriage Status in Simonton
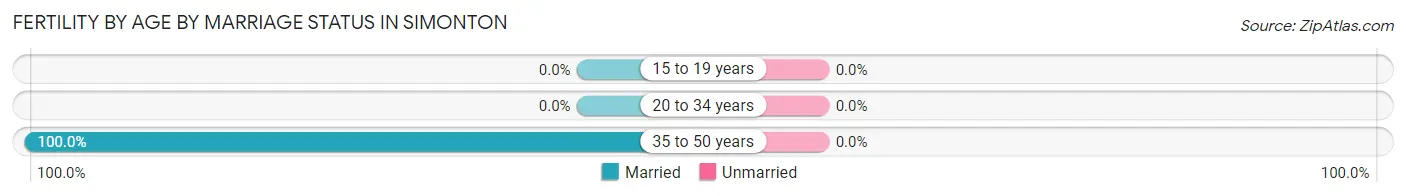
| Age Bracket | Married | Unmarried |
| 15 to 19 years | 0 (0.0%) | 0 (0.0%) |
| 20 to 34 years | 0 (0.0%) | 0 (0.0%) |
| 35 to 50 years | 7 (100.0%) | 0 (0.0%) |
| Total | 7 (100.0%) | 0 (0.0%) |
Fertility by Education in Simonton
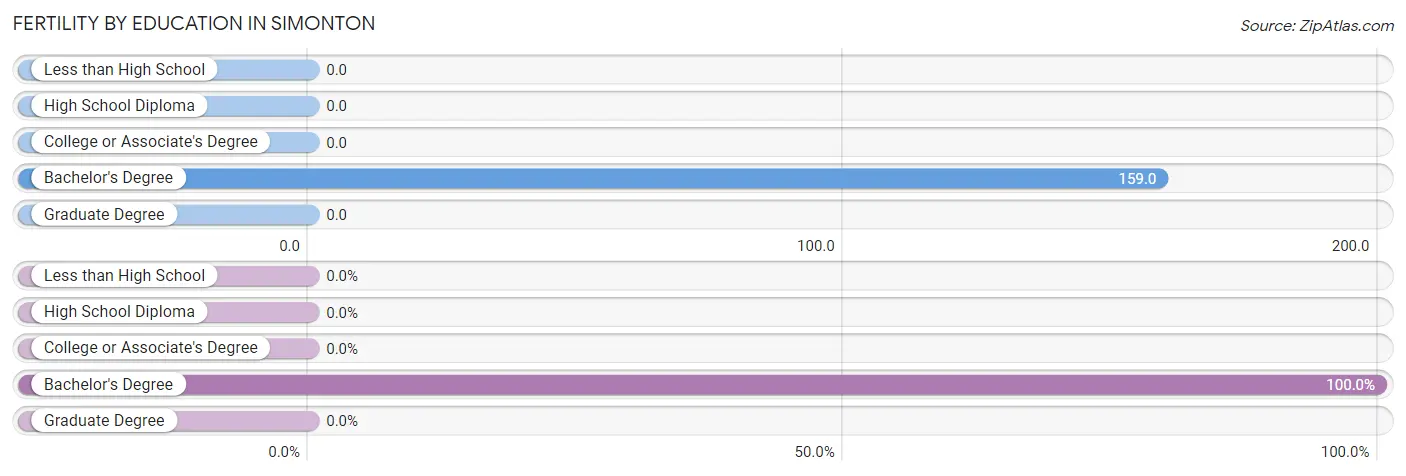
| Educational Attainment | Women with Births | Births / 1,000 Women |
| Less than High School | 0 (0.0%) | 0.0 |
| High School Diploma | 0 (0.0%) | 0.0 |
| College or Associate's Degree | 0 (0.0%) | 0.0 |
| Bachelor's Degree | 7 (100.0%) | 159.0 |
| Graduate Degree | 0 (0.0%) | 0.0 |
| Total | 7 (100.0%) | 41.0 |
Fertility by Education by Marriage Status in Simonton
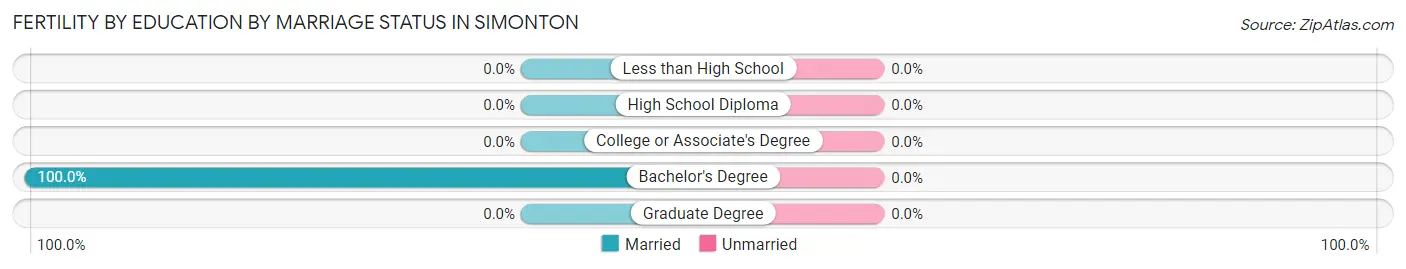
| Educational Attainment | Married | Unmarried |
| Less than High School | 0 (0.0%) | 0 (0.0%) |
| High School Diploma | 0 (0.0%) | 0 (0.0%) |
| College or Associate's Degree | 0 (0.0%) | 0 (0.0%) |
| Bachelor's Degree | 7 (100.0%) | 0 (0.0%) |
| Graduate Degree | 0 (0.0%) | 0 (0.0%) |
| Total | 7 (100.0%) | 0 (0.0%) |
Employment Characteristics in Simonton
Employment by Class of Employer in Simonton
Among the 375 employed individuals in Simonton, private company employees (234 | 62.4%), self-employed (not incorporated) (63 | 16.8%), and not-for-profit organizations (26 | 6.9%) make up the most common classes of employment.
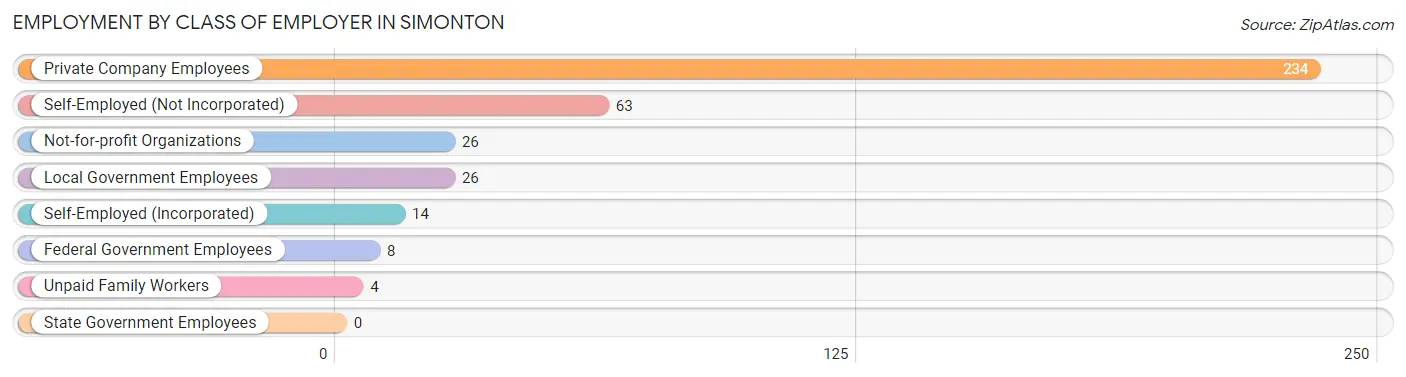
| Employer Class | # Employees | % Employees |
| Private Company Employees | 234 | 62.4% |
| Self-Employed (Incorporated) | 14 | 3.7% |
| Self-Employed (Not Incorporated) | 63 | 16.8% |
| Not-for-profit Organizations | 26 | 6.9% |
| Local Government Employees | 26 | 6.9% |
| State Government Employees | 0 | 0.0% |
| Federal Government Employees | 8 | 2.1% |
| Unpaid Family Workers | 4 | 1.1% |
| Total | 375 | 100.0% |
Employment Status by Age in Simonton
According to the labor force statistics for Simonton, out of the total population over 16 years of age (607), 62.8% or 381 individuals are in the labor force, with 1.6% or 6 of them unemployed. The age group with the highest labor force participation rate is 45 to 54 years, with 90.5% or 114 individuals in the labor force. Within the labor force, the 30 to 34 years age range has the highest percentage of unemployed individuals, with 23.1% or 3 of them being unemployed.
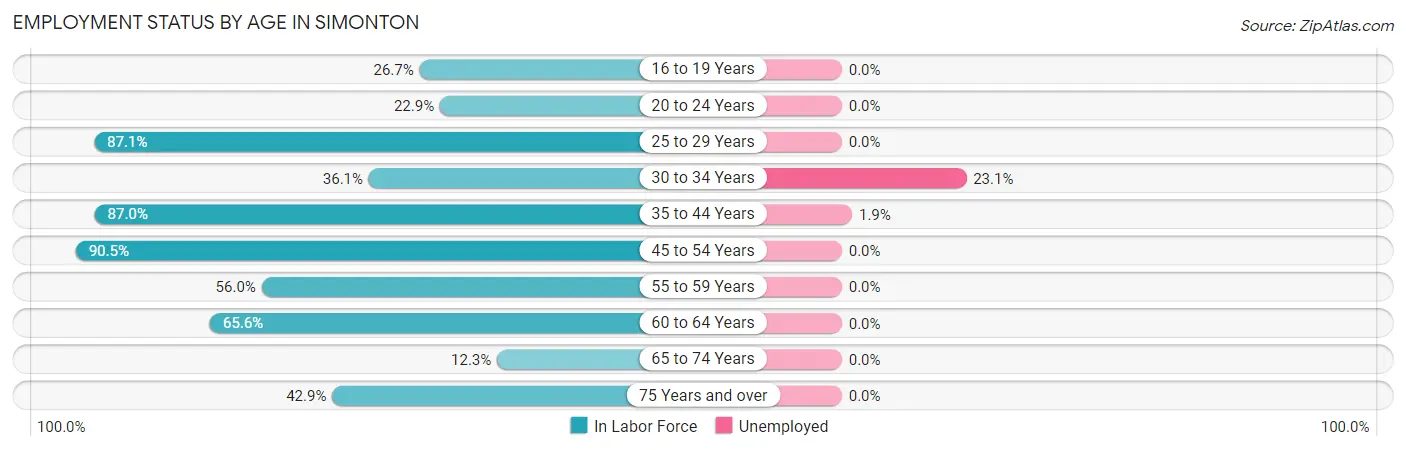
| Age Bracket | In Labor Force | Unemployed |
| 16 to 19 Years | 12 (26.7%) | 0 (0.0%) |
| 20 to 24 Years | 11 (22.9%) | 0 (0.0%) |
| 25 to 29 Years | 27 (87.1%) | 0 (0.0%) |
| 30 to 34 Years | 13 (36.1%) | 3 (23.1%) |
| 35 to 44 Years | 154 (87.0%) | 3 (1.9%) |
| 45 to 54 Years | 114 (90.5%) | 0 (0.0%) |
| 55 to 59 Years | 14 (56.0%) | 0 (0.0%) |
| 60 to 64 Years | 21 (65.6%) | 0 (0.0%) |
| 65 to 74 Years | 9 (12.3%) | 0 (0.0%) |
| 75 Years and over | 6 (42.9%) | 0 (0.0%) |
| Total | 381 (62.8%) | 6 (1.6%) |
Employment Status by Educational Attainment in Simonton
According to labor force statistics for Simonton, 80.3% of individuals (343) out of the total population between 25 and 64 years of age (427) are in the labor force, with 1.7% or 6 of them being unemployed. The group with the highest labor force participation rate are those with the educational attainment of bachelor's degree or higher, with 90.6% or 135 individuals in the labor force. Within the labor force, individuals with college / associate degree education have the highest percentage of unemployment, with 2.6% or 3 of them being unemployed.
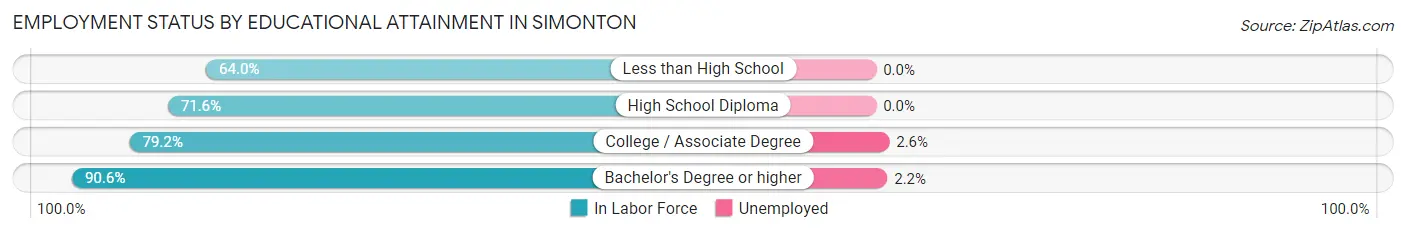
| Educational Attainment | In Labor Force | Unemployed |
| Less than High School | 16 (64.0%) | 0 (0.0%) |
| High School Diploma | 78 (71.6%) | 0 (0.0%) |
| College / Associate Degree | 114 (79.2%) | 4 (2.6%) |
| Bachelor's Degree or higher | 135 (90.6%) | 3 (2.2%) |
| Total | 343 (80.3%) | 7 (1.7%) |
Employment Occupations by Sex in Simonton
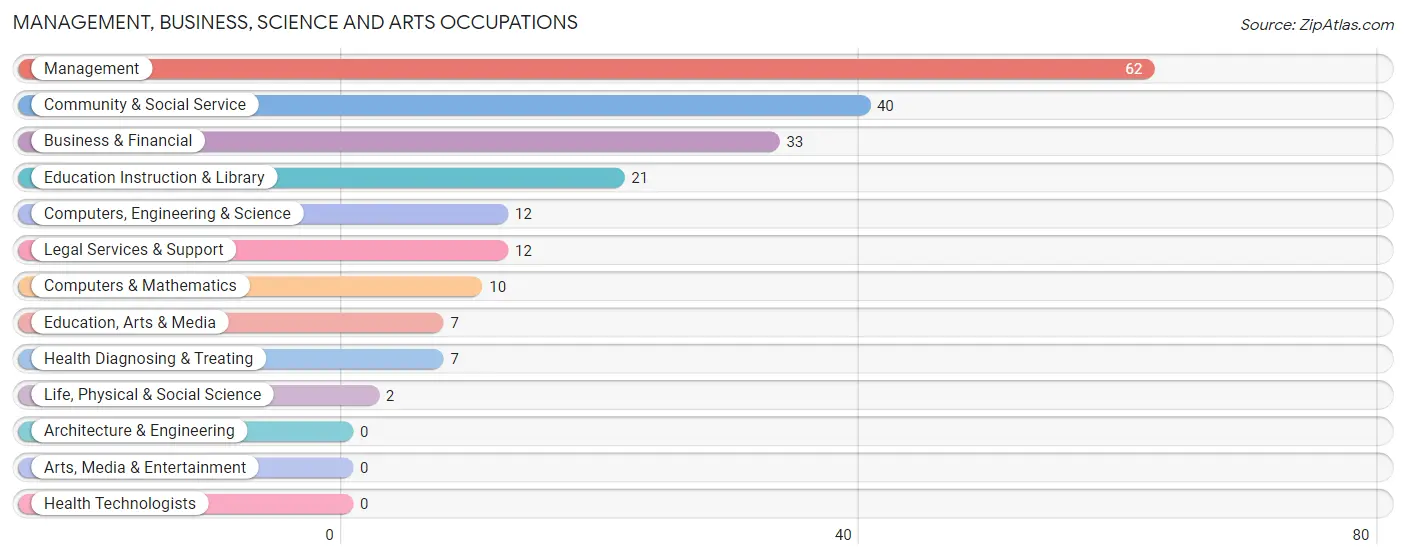
Management, Business, Science and Arts Occupations
The most common Management, Business, Science and Arts occupations in Simonton are Management (62 | 16.5%), Community & Social Service (40 | 10.7%), Business & Financial (33 | 8.8%), Education Instruction & Library (21 | 5.6%), and Computers, Engineering & Science (12 | 3.2%).
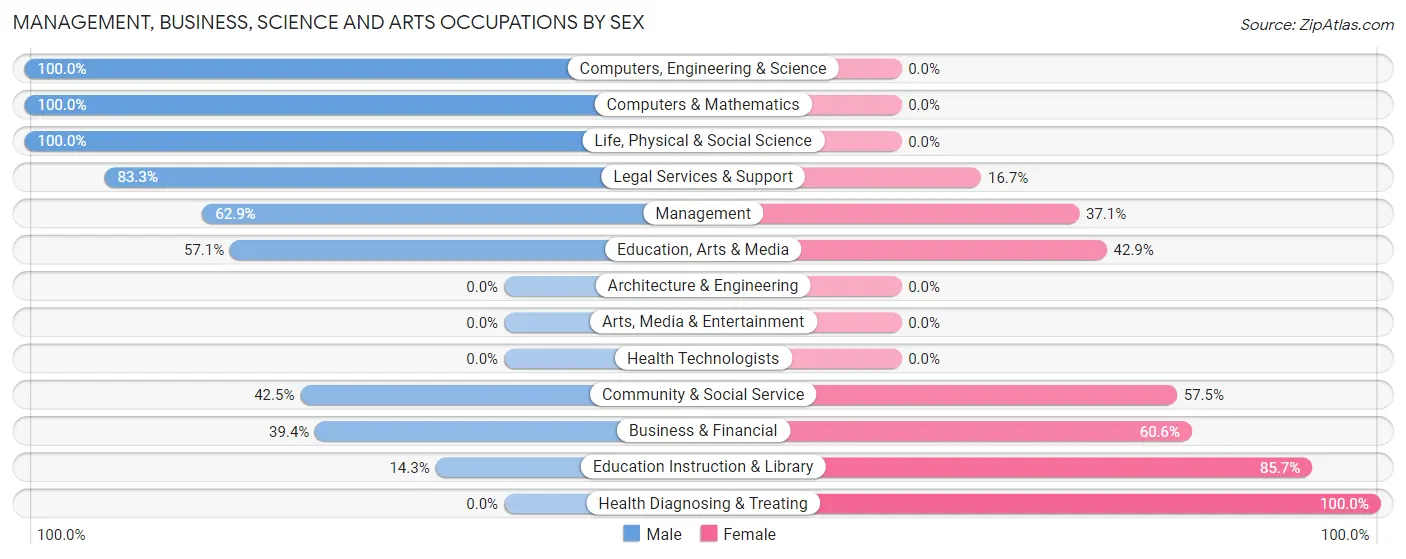
Management, Business, Science and Arts Occupations by Sex
Within the Management, Business, Science and Arts occupations in Simonton, the most male-oriented occupations are Computers, Engineering & Science (100.0%), Computers & Mathematics (100.0%), and Life, Physical & Social Science (100.0%), while the most female-oriented occupations are Health Diagnosing & Treating (100.0%), Education Instruction & Library (85.7%), and Business & Financial (60.6%).
| Occupation | Male | Female |
| Management | 39 (62.9%) | 23 (37.1%) |
| Business & Financial | 13 (39.4%) | 20 (60.6%) |
| Computers, Engineering & Science | 12 (100.0%) | 0 (0.0%) |
| Computers & Mathematics | 10 (100.0%) | 0 (0.0%) |
| Architecture & Engineering | 0 (0.0%) | 0 (0.0%) |
| Life, Physical & Social Science | 2 (100.0%) | 0 (0.0%) |
| Community & Social Service | 17 (42.5%) | 23 (57.5%) |
| Education, Arts & Media | 4 (57.1%) | 3 (42.9%) |
| Legal Services & Support | 10 (83.3%) | 2 (16.7%) |
| Education Instruction & Library | 3 (14.3%) | 18 (85.7%) |
| Arts, Media & Entertainment | 0 (0.0%) | 0 (0.0%) |
| Health Diagnosing & Treating | 0 (0.0%) | 7 (100.0%) |
| Health Technologists | 0 (0.0%) | 0 (0.0%) |
| Total (Category) | 81 (52.6%) | 73 (47.4%) |
| Total (Overall) | 203 (54.1%) | 172 (45.9%) |
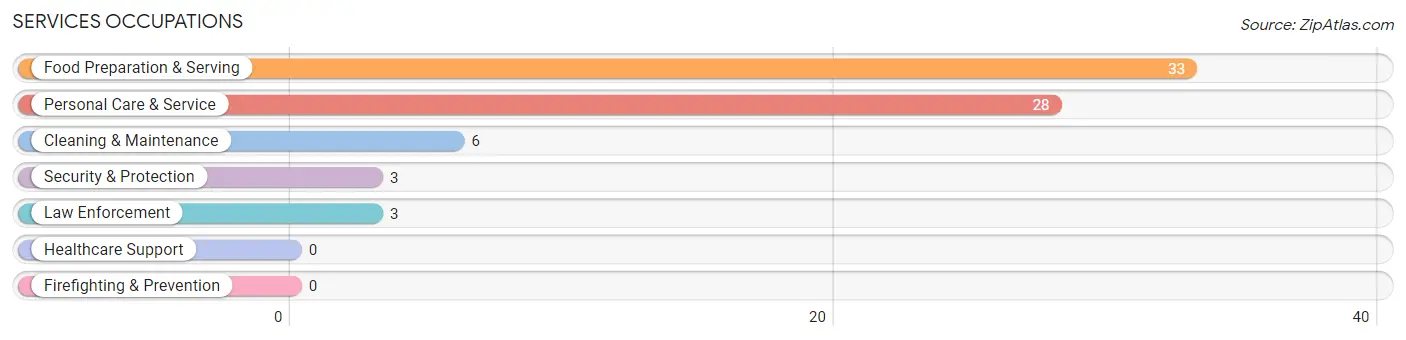
Services Occupations
The most common Services occupations in Simonton are Food Preparation & Serving (33 | 8.8%), Personal Care & Service (28 | 7.5%), Cleaning & Maintenance (6 | 1.6%), Security & Protection (3 | 0.8%), and Law Enforcement (3 | 0.8%).
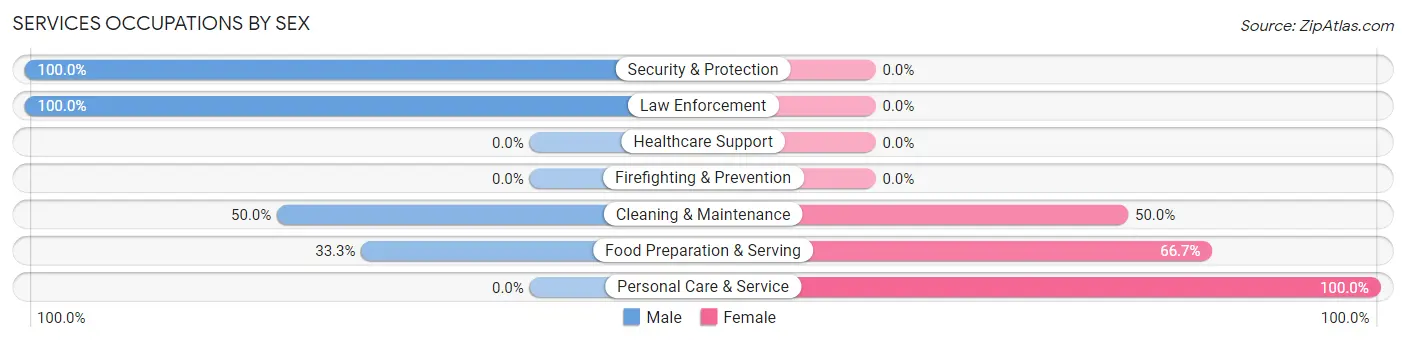
Services Occupations by Sex
Within the Services occupations in Simonton, the most male-oriented occupations are Security & Protection (100.0%), Law Enforcement (100.0%), and Cleaning & Maintenance (50.0%), while the most female-oriented occupations are Personal Care & Service (100.0%), Food Preparation & Serving (66.7%), and Cleaning & Maintenance (50.0%).
| Occupation | Male | Female |
| Healthcare Support | 0 (0.0%) | 0 (0.0%) |
| Security & Protection | 3 (100.0%) | 0 (0.0%) |
| Firefighting & Prevention | 0 (0.0%) | 0 (0.0%) |
| Law Enforcement | 3 (100.0%) | 0 (0.0%) |
| Food Preparation & Serving | 11 (33.3%) | 22 (66.7%) |
| Cleaning & Maintenance | 3 (50.0%) | 3 (50.0%) |
| Personal Care & Service | 0 (0.0%) | 28 (100.0%) |
| Total (Category) | 17 (24.3%) | 53 (75.7%) |
| Total (Overall) | 203 (54.1%) | 172 (45.9%) |
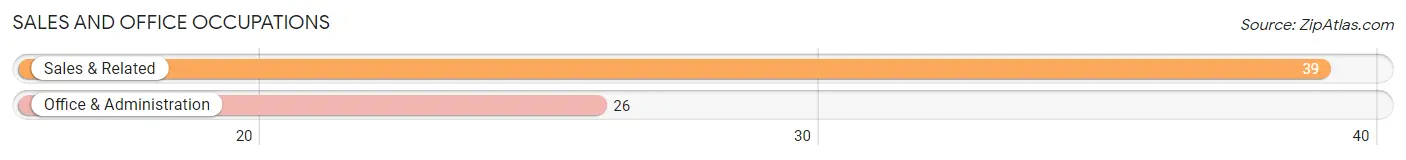
Sales and Office Occupations
The most common Sales and Office occupations in Simonton are Sales & Related (39 | 10.4%), and Office & Administration (26 | 6.9%).
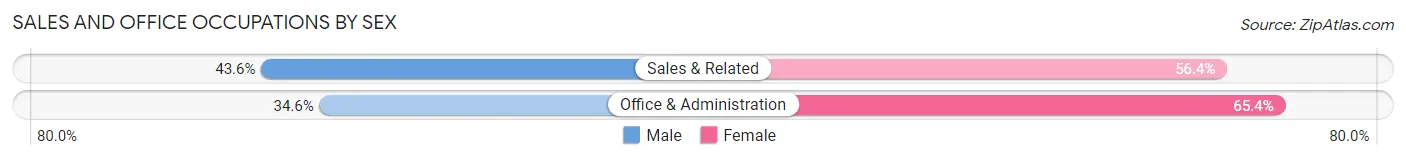
Sales and Office Occupations by Sex
| Occupation | Male | Female |
| Sales & Related | 17 (43.6%) | 22 (56.4%) |
| Office & Administration | 9 (34.6%) | 17 (65.4%) |
| Total (Category) | 26 (40.0%) | 39 (60.0%) |
| Total (Overall) | 203 (54.1%) | 172 (45.9%) |
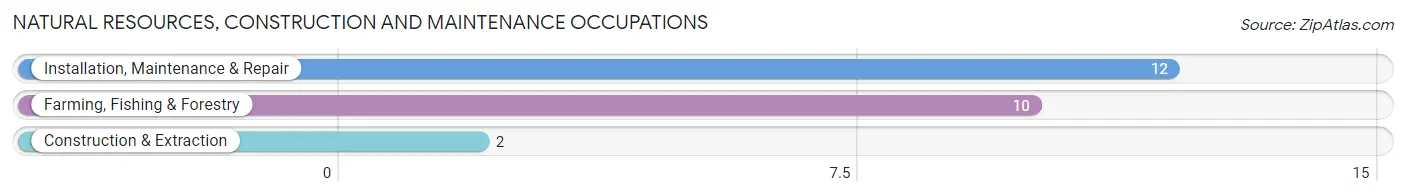
Natural Resources, Construction and Maintenance Occupations
The most common Natural Resources, Construction and Maintenance occupations in Simonton are Installation, Maintenance & Repair (12 | 3.2%), Farming, Fishing & Forestry (10 | 2.7%), and Construction & Extraction (2 | 0.5%).
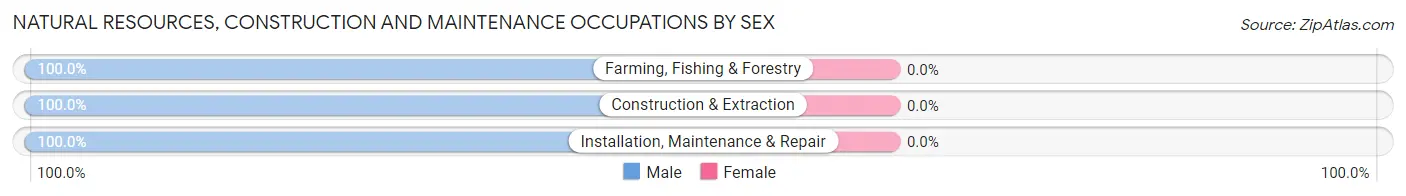
Natural Resources, Construction and Maintenance Occupations by Sex
| Occupation | Male | Female |
| Farming, Fishing & Forestry | 10 (100.0%) | 0 (0.0%) |
| Construction & Extraction | 2 (100.0%) | 0 (0.0%) |
| Installation, Maintenance & Repair | 12 (100.0%) | 0 (0.0%) |
| Total (Category) | 24 (100.0%) | 0 (0.0%) |
| Total (Overall) | 203 (54.1%) | 172 (45.9%) |
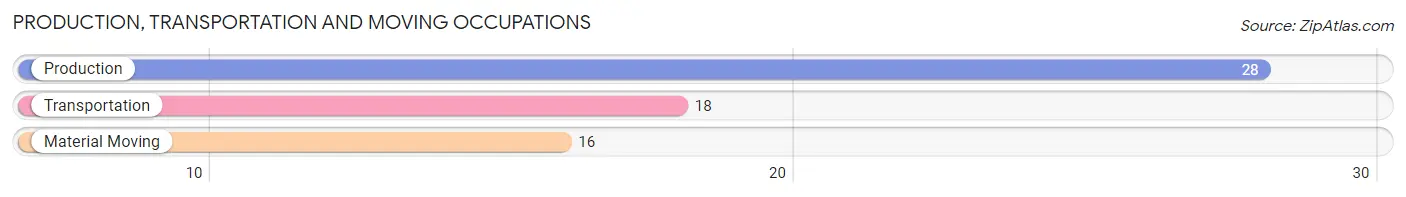
Production, Transportation and Moving Occupations
The most common Production, Transportation and Moving occupations in Simonton are Production (28 | 7.5%), Transportation (18 | 4.8%), and Material Moving (16 | 4.3%).
Production, Transportation and Moving Occupations by Sex
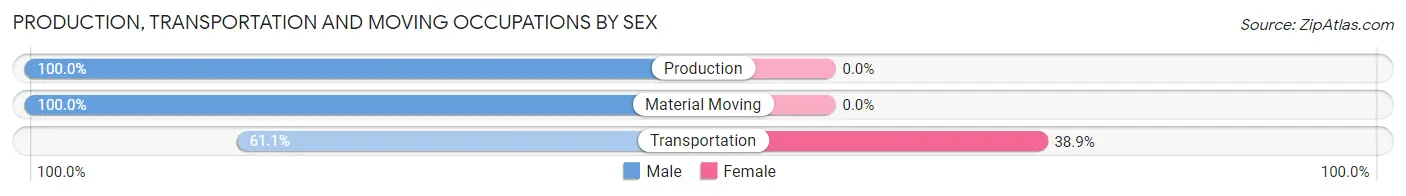
| Occupation | Male | Female |
| Production | 28 (100.0%) | 0 (0.0%) |
| Transportation | 11 (61.1%) | 7 (38.9%) |
| Material Moving | 16 (100.0%) | 0 (0.0%) |
| Total (Category) | 55 (88.7%) | 7 (11.3%) |
| Total (Overall) | 203 (54.1%) | 172 (45.9%) |
Employment Industries by Sex in Simonton
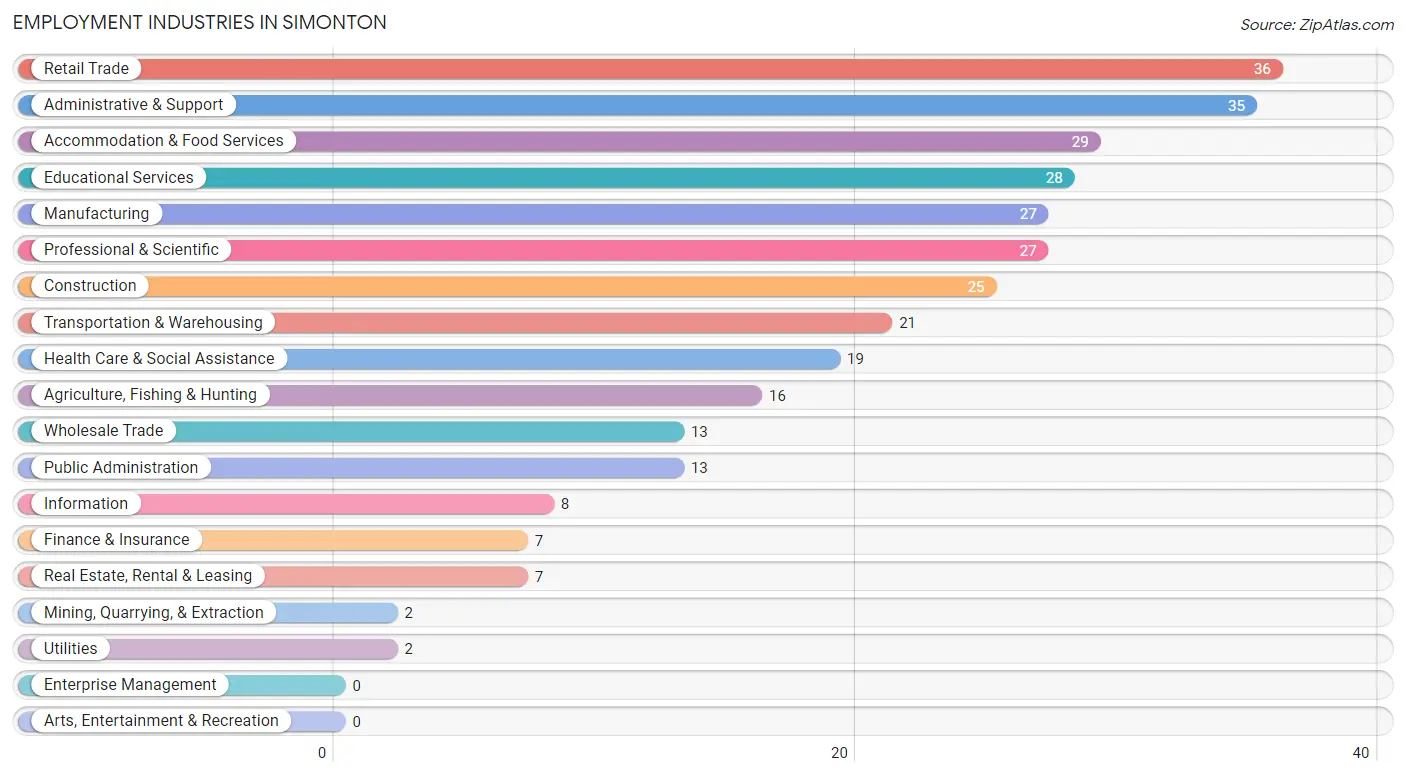
Employment Industries in Simonton
The major employment industries in Simonton include Retail Trade (36 | 9.6%), Administrative & Support (35 | 9.3%), Accommodation & Food Services (29 | 7.7%), Educational Services (28 | 7.5%), and Manufacturing (27 | 7.2%).
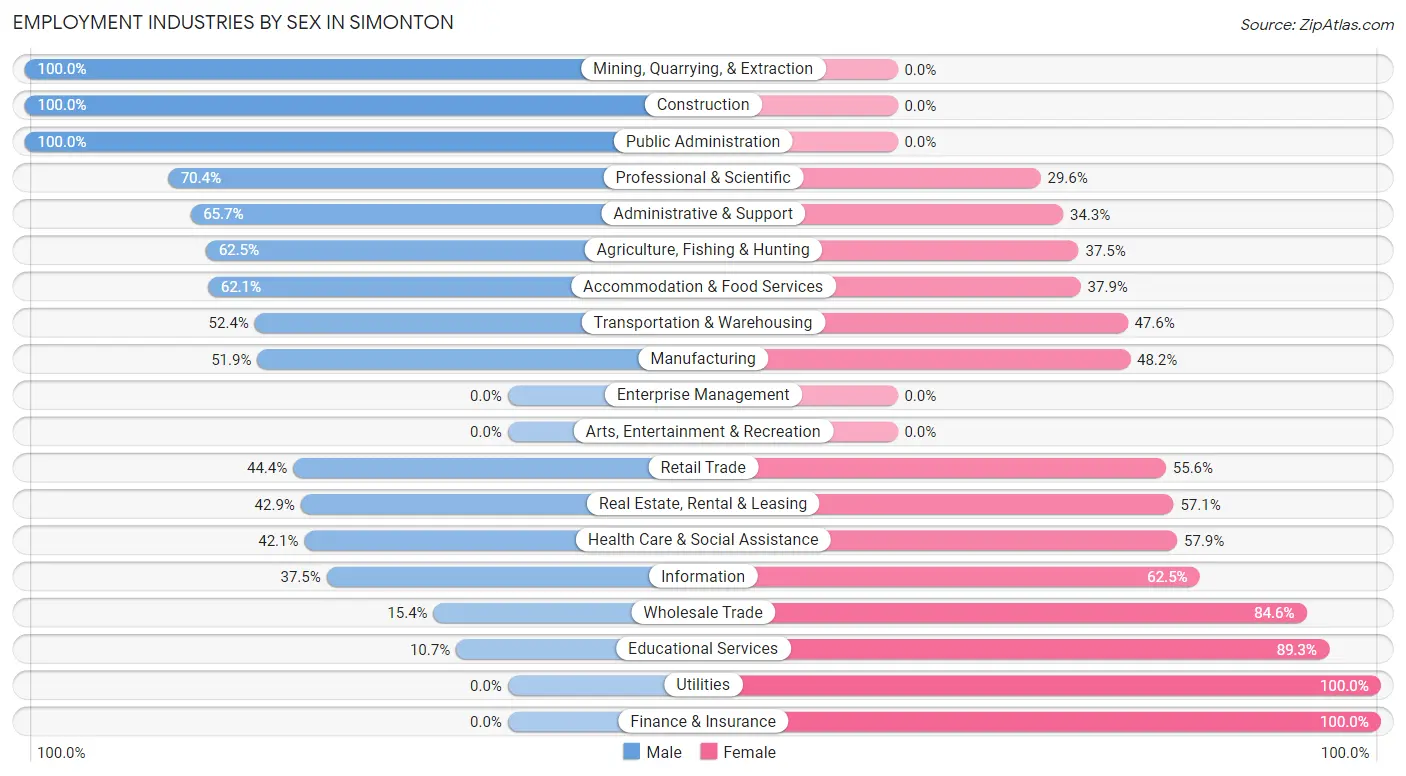
Employment Industries by Sex in Simonton
The Simonton industries that see more men than women are Mining, Quarrying, & Extraction (100.0%), Construction (100.0%), and Public Administration (100.0%), whereas the industries that tend to have a higher number of women are Utilities (100.0%), Finance & Insurance (100.0%), and Educational Services (89.3%).
| Industry | Male | Female |
| Agriculture, Fishing & Hunting | 10 (62.5%) | 6 (37.5%) |
| Mining, Quarrying, & Extraction | 2 (100.0%) | 0 (0.0%) |
| Construction | 25 (100.0%) | 0 (0.0%) |
| Manufacturing | 14 (51.8%) | 13 (48.1%) |
| Wholesale Trade | 2 (15.4%) | 11 (84.6%) |
| Retail Trade | 16 (44.4%) | 20 (55.6%) |
| Transportation & Warehousing | 11 (52.4%) | 10 (47.6%) |
| Utilities | 0 (0.0%) | 2 (100.0%) |
| Information | 3 (37.5%) | 5 (62.5%) |
| Finance & Insurance | 0 (0.0%) | 7 (100.0%) |
| Real Estate, Rental & Leasing | 3 (42.9%) | 4 (57.1%) |
| Professional & Scientific | 19 (70.4%) | 8 (29.6%) |
| Enterprise Management | 0 (0.0%) | 0 (0.0%) |
| Administrative & Support | 23 (65.7%) | 12 (34.3%) |
| Educational Services | 3 (10.7%) | 25 (89.3%) |
| Health Care & Social Assistance | 8 (42.1%) | 11 (57.9%) |
| Arts, Entertainment & Recreation | 0 (0.0%) | 0 (0.0%) |
| Accommodation & Food Services | 18 (62.1%) | 11 (37.9%) |
| Public Administration | 13 (100.0%) | 0 (0.0%) |
| Total | 203 (54.1%) | 172 (45.9%) |
Education in Simonton
School Enrollment in Simonton
The most common levels of schooling among the 269 students in Simonton are high school (77 | 28.6%), middle school (66 | 24.5%), and college / undergraduate (55 | 20.4%).
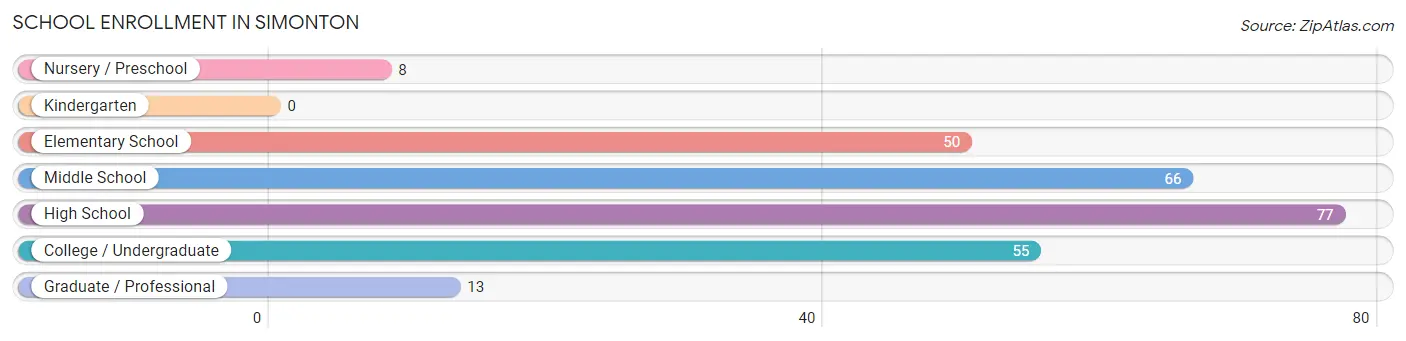
| School Level | # Students | % Students |
| Nursery / Preschool | 8 | 3.0% |
| Kindergarten | 0 | 0.0% |
| Elementary School | 50 | 18.6% |
| Middle School | 66 | 24.5% |
| High School | 77 | 28.6% |
| College / Undergraduate | 55 | 20.4% |
| Graduate / Professional | 13 | 4.8% |
| Total | 269 | 100.0% |
School Enrollment by Age by Funding Source in Simonton
Out of a total of 269 students who are enrolled in schools in Simonton, 18 (6.7%) attend a private institution, while the remaining 251 (93.3%) are enrolled in public schools. The age group of 3 to 4 year olds has the highest likelihood of being enrolled in private schools, with 8 (100.0% in the age bracket) enrolled. Conversely, the age group of 15 to 17 year olds has the lowest likelihood of being enrolled in a private school, with 45 (100.0% in the age bracket) attending a public institution.
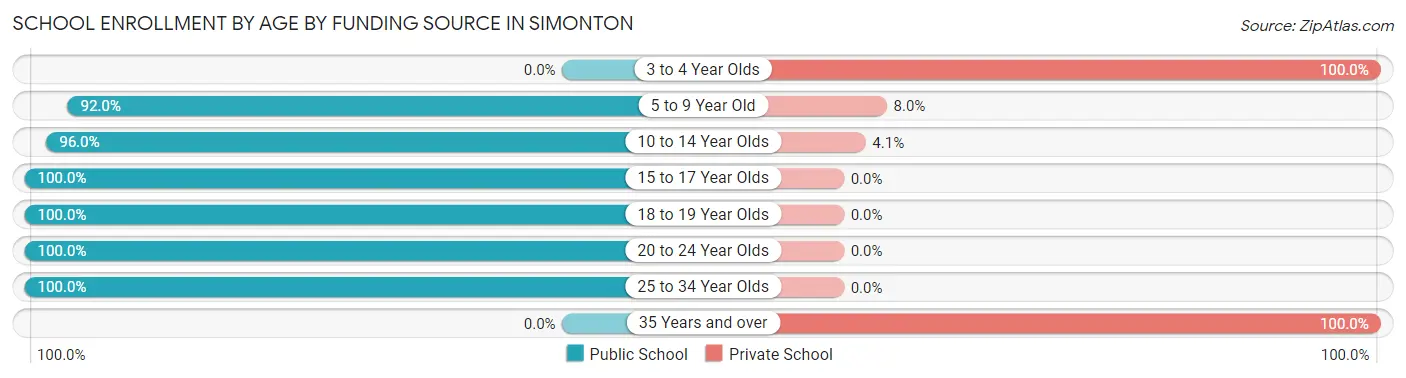
| Age Bracket | Public School | Private School |
| 3 to 4 Year Olds | 0 (0.0%) | 8 (100.0%) |
| 5 to 9 Year Old | 46 (92.0%) | 4 (8.0%) |
| 10 to 14 Year Olds | 71 (96.0%) | 3 (4.1%) |
| 15 to 17 Year Olds | 45 (100.0%) | 0 (0.0%) |
| 18 to 19 Year Olds | 37 (100.0%) | 0 (0.0%) |
| 20 to 24 Year Olds | 44 (100.0%) | 0 (0.0%) |
| 25 to 34 Year Olds | 8 (100.0%) | 0 (0.0%) |
| 35 Years and over | 0 (0.0%) | 3 (100.0%) |
| Total | 251 (93.3%) | 18 (6.7%) |
Educational Attainment by Field of Study in Simonton
Business (34 | 18.6%), education (33 | 18.0%), engineering (26 | 14.2%), physical & health sciences (24 | 13.1%), and communications (19 | 10.4%) are the most common fields of study among 183 individuals in Simonton who have obtained a bachelor's degree or higher.
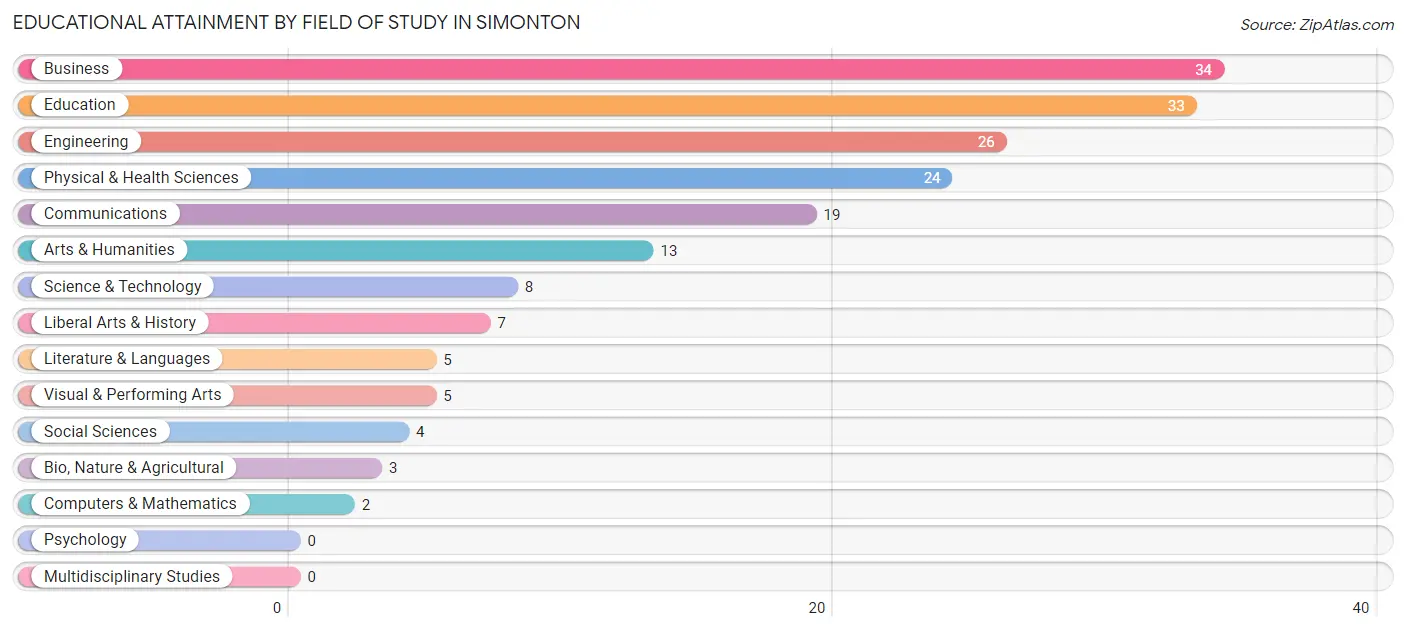
| Field of Study | # Graduates | % Graduates |
| Computers & Mathematics | 2 | 1.1% |
| Bio, Nature & Agricultural | 3 | 1.6% |
| Physical & Health Sciences | 24 | 13.1% |
| Psychology | 0 | 0.0% |
| Social Sciences | 4 | 2.2% |
| Engineering | 26 | 14.2% |
| Multidisciplinary Studies | 0 | 0.0% |
| Science & Technology | 8 | 4.4% |
| Business | 34 | 18.6% |
| Education | 33 | 18.0% |
| Literature & Languages | 5 | 2.7% |
| Liberal Arts & History | 7 | 3.8% |
| Visual & Performing Arts | 5 | 2.7% |
| Communications | 19 | 10.4% |
| Arts & Humanities | 13 | 7.1% |
| Total | 183 | 100.0% |
Transportation & Commute in Simonton
Vehicle Availability by Sex in Simonton
The most prevalent vehicle ownership categories in Simonton are males with 2 vehicles (81, accounting for 39.9%) and females with 2 vehicles (80, making up 47.1%).
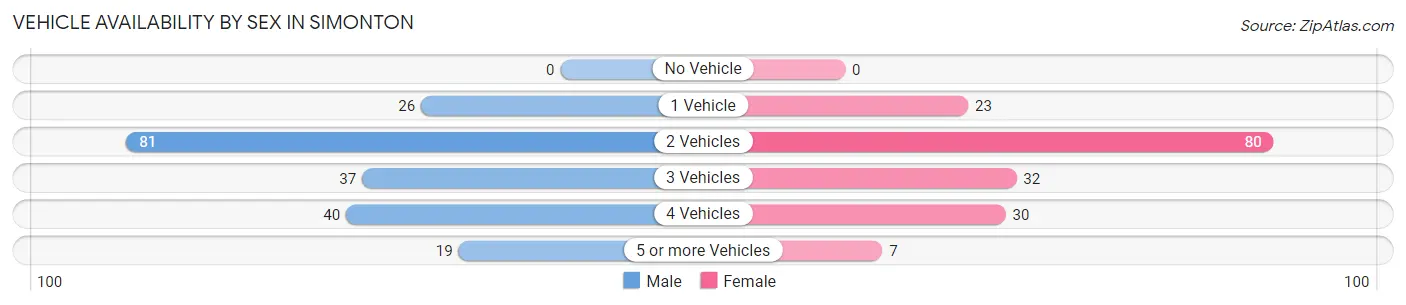
| Vehicles Available | Male | Female |
| No Vehicle | 0 (0.0%) | 0 (0.0%) |
| 1 Vehicle | 26 (12.8%) | 23 (13.4%) |
| 2 Vehicles | 81 (39.9%) | 80 (46.5%) |
| 3 Vehicles | 37 (18.2%) | 32 (18.6%) |
| 4 Vehicles | 40 (19.7%) | 30 (17.4%) |
| 5 or more Vehicles | 19 (9.4%) | 7 (4.1%) |
| Total | 203 (100.0%) | 172 (100.0%) |
Commute Time in Simonton
The most frequently occuring commute durations in Simonton are 60 to 89 minutes (74 commuters, 23.4%), 20 to 24 minutes (55 commuters, 17.4%), and 30 to 34 minutes (53 commuters, 16.8%).
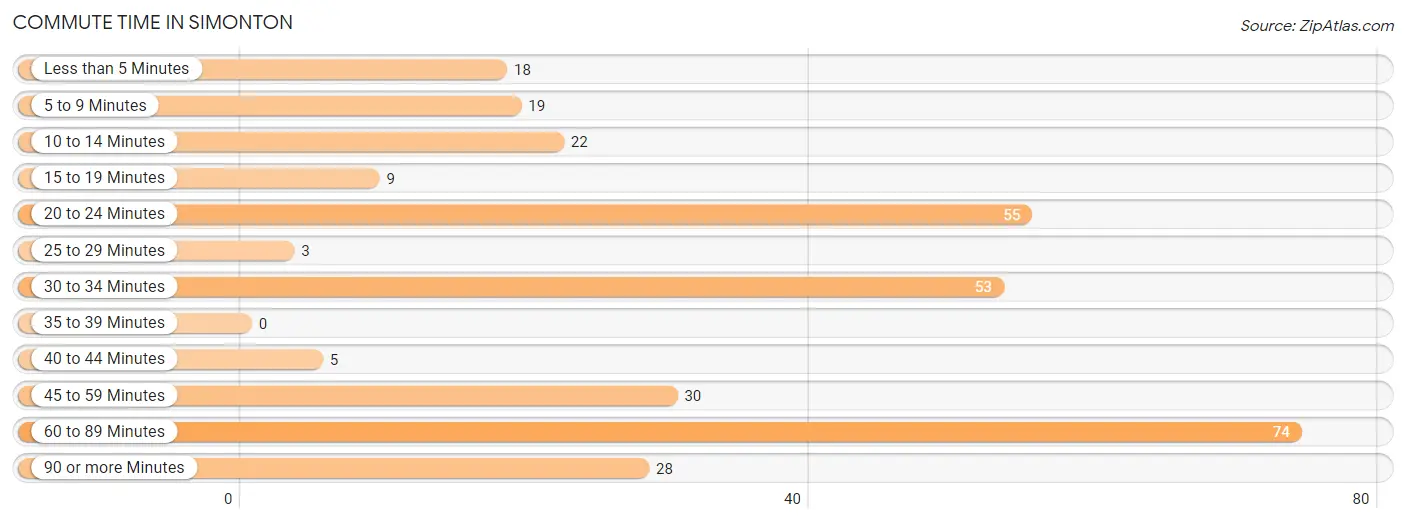
| Commute Time | # Commuters | % Commuters |
| Less than 5 Minutes | 18 | 5.7% |
| 5 to 9 Minutes | 19 | 6.0% |
| 10 to 14 Minutes | 22 | 7.0% |
| 15 to 19 Minutes | 9 | 2.9% |
| 20 to 24 Minutes | 55 | 17.4% |
| 25 to 29 Minutes | 3 | 0.9% |
| 30 to 34 Minutes | 53 | 16.8% |
| 35 to 39 Minutes | 0 | 0.0% |
| 40 to 44 Minutes | 5 | 1.6% |
| 45 to 59 Minutes | 30 | 9.5% |
| 60 to 89 Minutes | 74 | 23.4% |
| 90 or more Minutes | 28 | 8.9% |
Commute Time by Sex in Simonton
The most common commute times in Simonton are 60 to 89 minutes (53 commuters, 28.5%) for males and 30 to 34 minutes (29 commuters, 22.3%) for females.
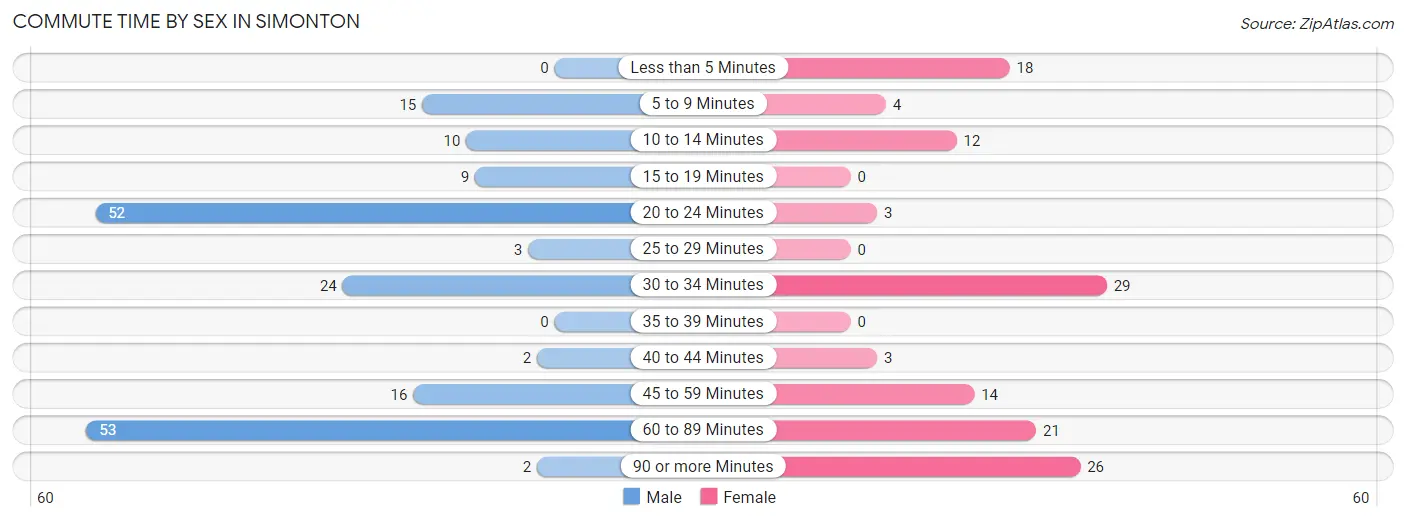
| Commute Time | Male | Female |
| Less than 5 Minutes | 0 (0.0%) | 18 (13.9%) |
| 5 to 9 Minutes | 15 (8.1%) | 4 (3.1%) |
| 10 to 14 Minutes | 10 (5.4%) | 12 (9.2%) |
| 15 to 19 Minutes | 9 (4.8%) | 0 (0.0%) |
| 20 to 24 Minutes | 52 (28.0%) | 3 (2.3%) |
| 25 to 29 Minutes | 3 (1.6%) | 0 (0.0%) |
| 30 to 34 Minutes | 24 (12.9%) | 29 (22.3%) |
| 35 to 39 Minutes | 0 (0.0%) | 0 (0.0%) |
| 40 to 44 Minutes | 2 (1.1%) | 3 (2.3%) |
| 45 to 59 Minutes | 16 (8.6%) | 14 (10.8%) |
| 60 to 89 Minutes | 53 (28.5%) | 21 (16.2%) |
| 90 or more Minutes | 2 (1.1%) | 26 (20.0%) |
Time of Departure to Work by Sex in Simonton
The most frequent times of departure to work in Simonton are 8:00 AM to 8:29 AM (66, 35.5%) for males and 7:00 AM to 7:29 AM (40, 30.8%) for females.
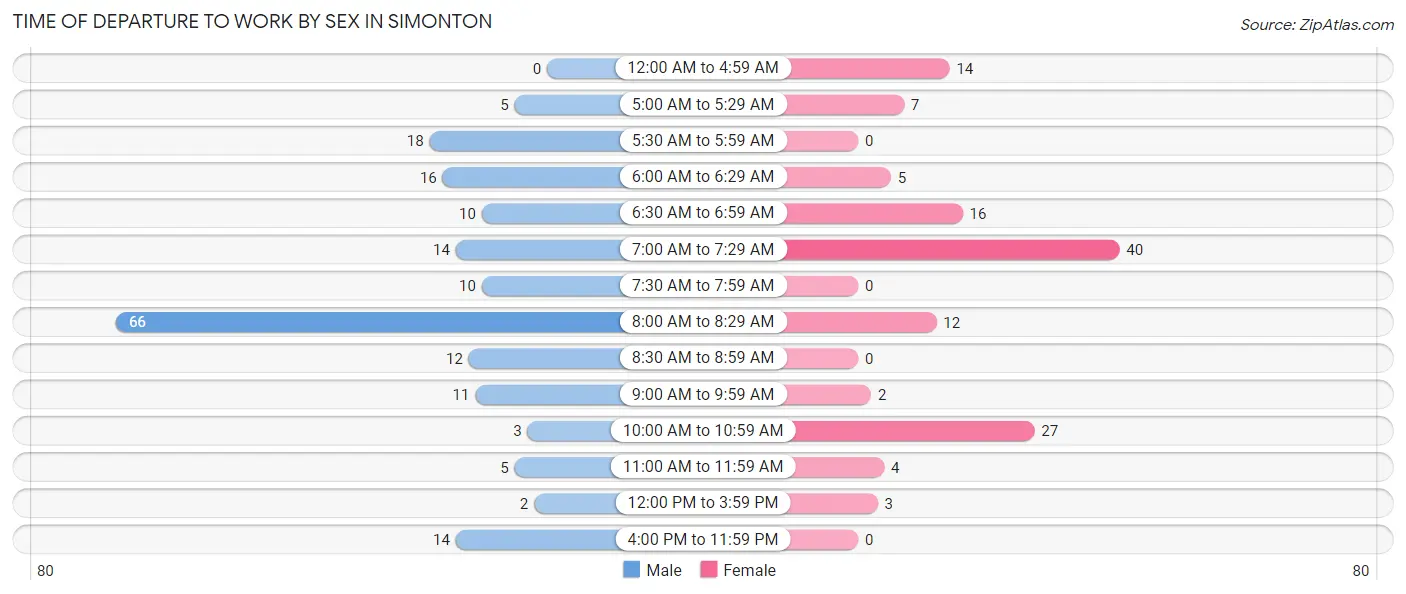
| Time of Departure | Male | Female |
| 12:00 AM to 4:59 AM | 0 (0.0%) | 14 (10.8%) |
| 5:00 AM to 5:29 AM | 5 (2.7%) | 7 (5.4%) |
| 5:30 AM to 5:59 AM | 18 (9.7%) | 0 (0.0%) |
| 6:00 AM to 6:29 AM | 16 (8.6%) | 5 (3.8%) |
| 6:30 AM to 6:59 AM | 10 (5.4%) | 16 (12.3%) |
| 7:00 AM to 7:29 AM | 14 (7.5%) | 40 (30.8%) |
| 7:30 AM to 7:59 AM | 10 (5.4%) | 0 (0.0%) |
| 8:00 AM to 8:29 AM | 66 (35.5%) | 12 (9.2%) |
| 8:30 AM to 8:59 AM | 12 (6.5%) | 0 (0.0%) |
| 9:00 AM to 9:59 AM | 11 (5.9%) | 2 (1.5%) |
| 10:00 AM to 10:59 AM | 3 (1.6%) | 27 (20.8%) |
| 11:00 AM to 11:59 AM | 5 (2.7%) | 4 (3.1%) |
| 12:00 PM to 3:59 PM | 2 (1.1%) | 3 (2.3%) |
| 4:00 PM to 11:59 PM | 14 (7.5%) | 0 (0.0%) |
| Total | 186 (100.0%) | 130 (100.0%) |
Housing Occupancy in Simonton
Occupancy by Ownership in Simonton
Of the total 248 dwellings in Simonton, owner-occupied units account for 216 (87.1%), while renter-occupied units make up 32 (12.9%).
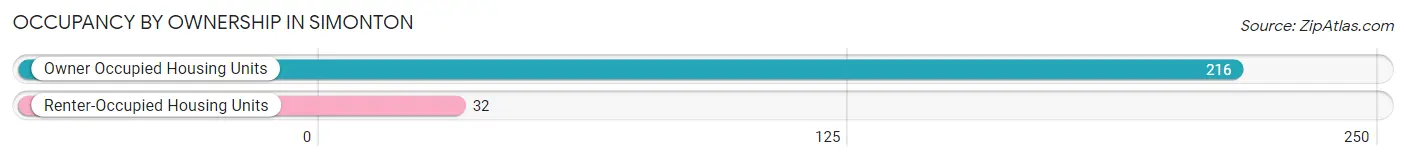
| Occupancy | # Housing Units | % Housing Units |
| Owner Occupied Housing Units | 216 | 87.1% |
| Renter-Occupied Housing Units | 32 | 12.9% |
| Total Occupied Housing Units | 248 | 100.0% |
Occupancy by Household Size in Simonton
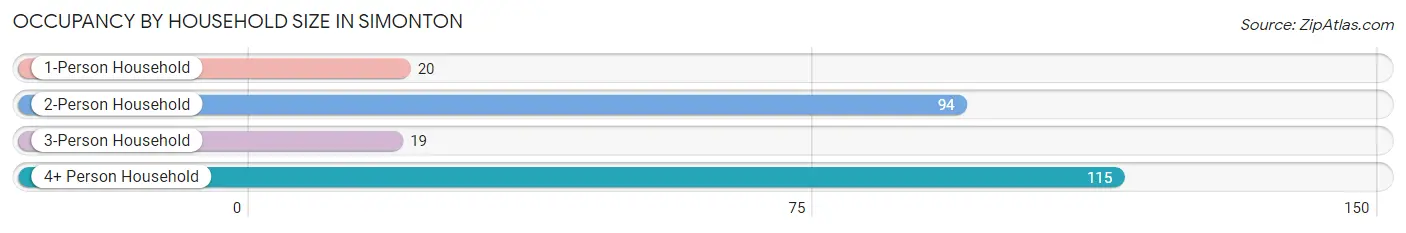
| Household Size | # Housing Units | % Housing Units |
| 1-Person Household | 20 | 8.1% |
| 2-Person Household | 94 | 37.9% |
| 3-Person Household | 19 | 7.7% |
| 4+ Person Household | 115 | 46.4% |
| Total Housing Units | 248 | 100.0% |
Occupancy by Ownership by Household Size in Simonton
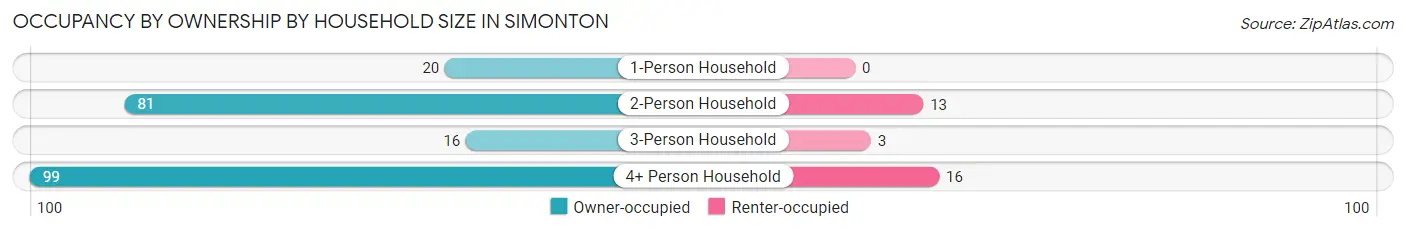
| Household Size | Owner-occupied | Renter-occupied |
| 1-Person Household | 20 (100.0%) | 0 (0.0%) |
| 2-Person Household | 81 (86.2%) | 13 (13.8%) |
| 3-Person Household | 16 (84.2%) | 3 (15.8%) |
| 4+ Person Household | 99 (86.1%) | 16 (13.9%) |
| Total Housing Units | 216 (87.1%) | 32 (12.9%) |
Occupancy by Educational Attainment in Simonton
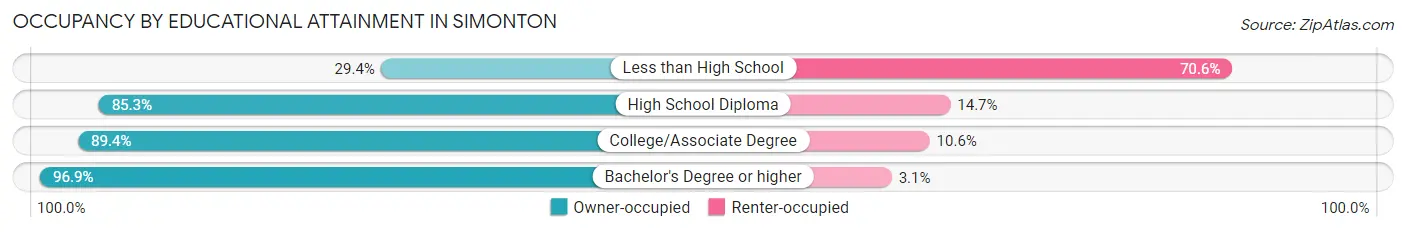
| Household Size | Owner-occupied | Renter-occupied |
| Less than High School | 5 (29.4%) | 12 (70.6%) |
| High School Diploma | 58 (85.3%) | 10 (14.7%) |
| College/Associate Degree | 59 (89.4%) | 7 (10.6%) |
| Bachelor's Degree or higher | 94 (96.9%) | 3 (3.1%) |
Occupancy by Age of Householder in Simonton
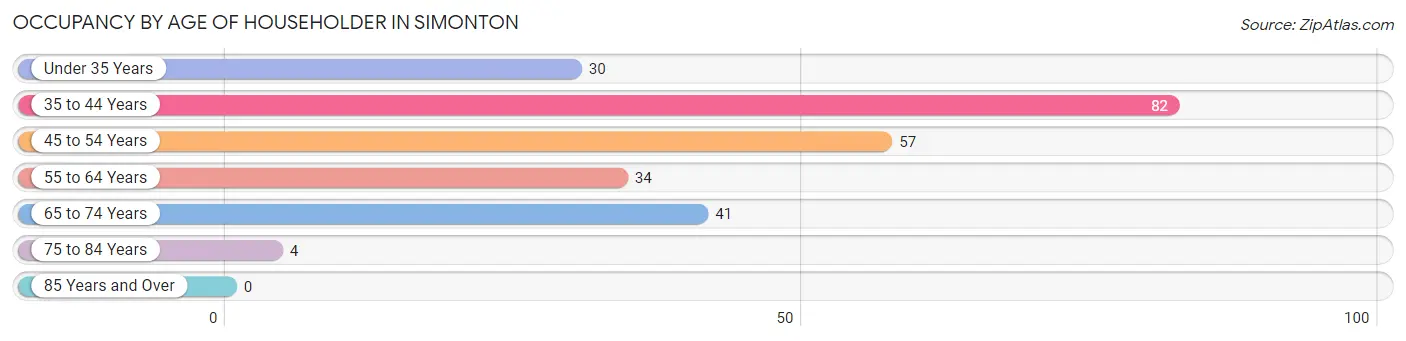
| Age Bracket | # Households | % Households |
| Under 35 Years | 30 | 12.1% |
| 35 to 44 Years | 82 | 33.1% |
| 45 to 54 Years | 57 | 23.0% |
| 55 to 64 Years | 34 | 13.7% |
| 65 to 74 Years | 41 | 16.5% |
| 75 to 84 Years | 4 | 1.6% |
| 85 Years and Over | 0 | 0.0% |
| Total | 248 | 100.0% |
Housing Finances in Simonton
Median Income by Occupancy in Simonton
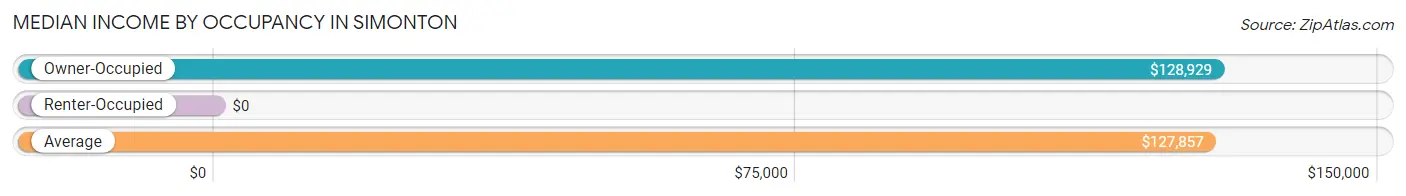
| Occupancy Type | # Households | Median Income |
| Owner-Occupied | 216 (87.1%) | $128,929 |
| Renter-Occupied | 32 (12.9%) | $0 |
| Average | 248 (100.0%) | $127,857 |
Occupancy by Householder Income Bracket in Simonton
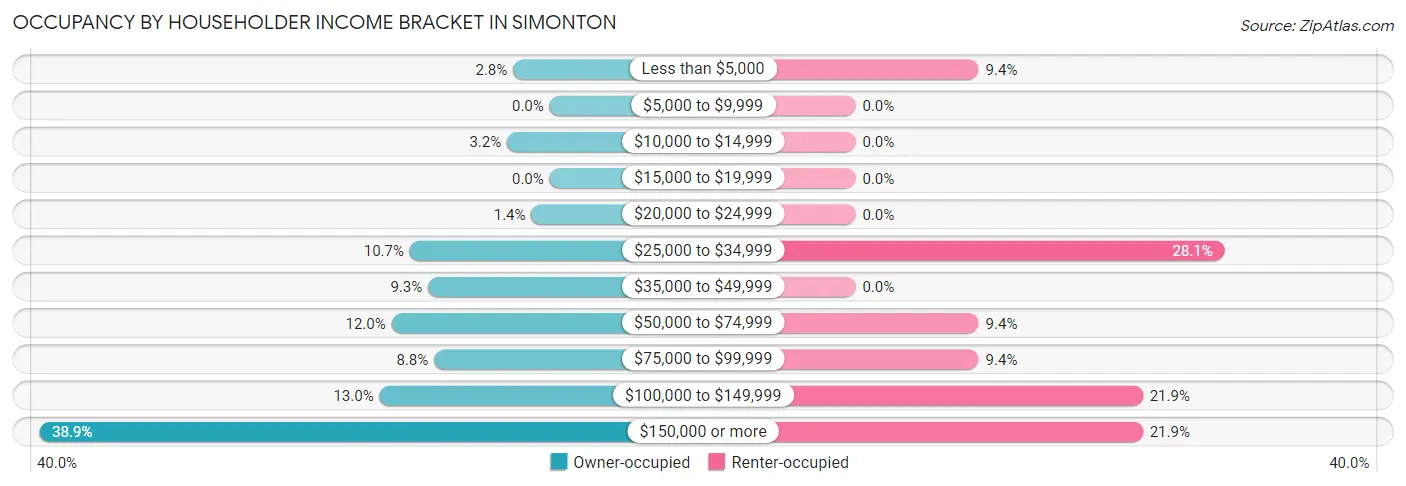
| Income Bracket | Owner-occupied | Renter-occupied |
| Less than $5,000 | 6 (2.8%) | 3 (9.4%) |
| $5,000 to $9,999 | 0 (0.0%) | 0 (0.0%) |
| $10,000 to $14,999 | 7 (3.2%) | 0 (0.0%) |
| $15,000 to $19,999 | 0 (0.0%) | 0 (0.0%) |
| $20,000 to $24,999 | 3 (1.4%) | 0 (0.0%) |
| $25,000 to $34,999 | 23 (10.6%) | 9 (28.1%) |
| $35,000 to $49,999 | 20 (9.3%) | 0 (0.0%) |
| $50,000 to $74,999 | 26 (12.0%) | 3 (9.4%) |
| $75,000 to $99,999 | 19 (8.8%) | 3 (9.4%) |
| $100,000 to $149,999 | 28 (13.0%) | 7 (21.9%) |
| $150,000 or more | 84 (38.9%) | 7 (21.9%) |
| Total | 216 (100.0%) | 32 (100.0%) |
Monthly Housing Cost Tiers in Simonton
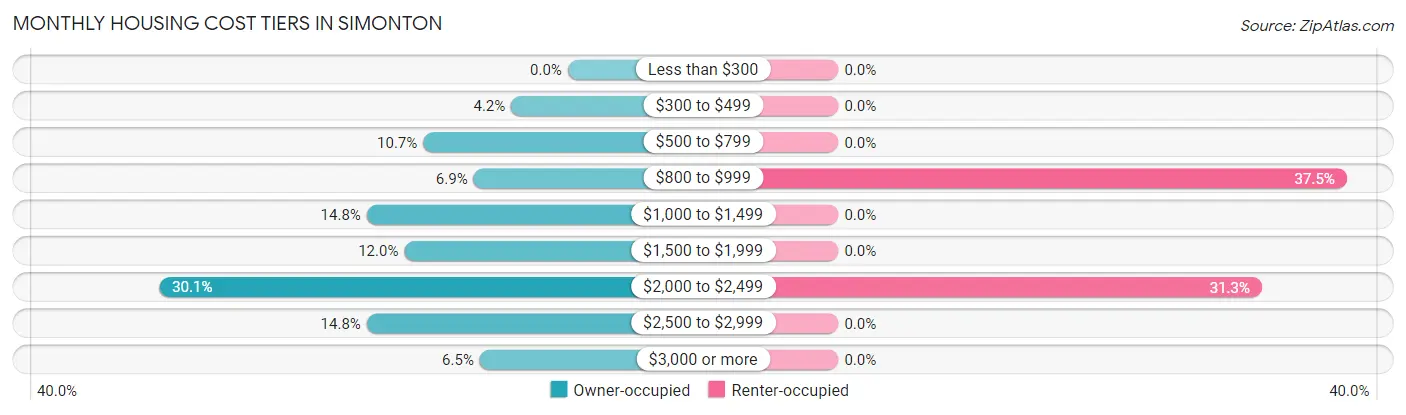
| Monthly Cost | Owner-occupied | Renter-occupied |
| Less than $300 | 0 (0.0%) | 0 (0.0%) |
| $300 to $499 | 9 (4.2%) | 0 (0.0%) |
| $500 to $799 | 23 (10.6%) | 0 (0.0%) |
| $800 to $999 | 15 (6.9%) | 12 (37.5%) |
| $1,000 to $1,499 | 32 (14.8%) | 0 (0.0%) |
| $1,500 to $1,999 | 26 (12.0%) | 0 (0.0%) |
| $2,000 to $2,499 | 65 (30.1%) | 10 (31.2%) |
| $2,500 to $2,999 | 32 (14.8%) | 0 (0.0%) |
| $3,000 or more | 14 (6.5%) | 0 (0.0%) |
| Total | 216 (100.0%) | 32 (100.0%) |
Physical Housing Characteristics in Simonton
Housing Structures in Simonton
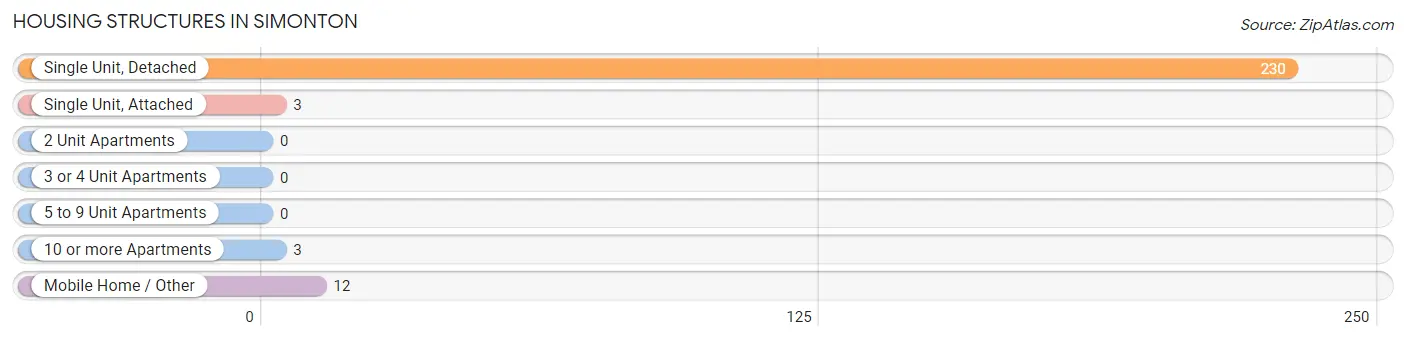
| Structure Type | # Housing Units | % Housing Units |
| Single Unit, Detached | 230 | 92.7% |
| Single Unit, Attached | 3 | 1.2% |
| 2 Unit Apartments | 0 | 0.0% |
| 3 or 4 Unit Apartments | 0 | 0.0% |
| 5 to 9 Unit Apartments | 0 | 0.0% |
| 10 or more Apartments | 3 | 1.2% |
| Mobile Home / Other | 12 | 4.8% |
| Total | 248 | 100.0% |
Housing Structures by Occupancy in Simonton
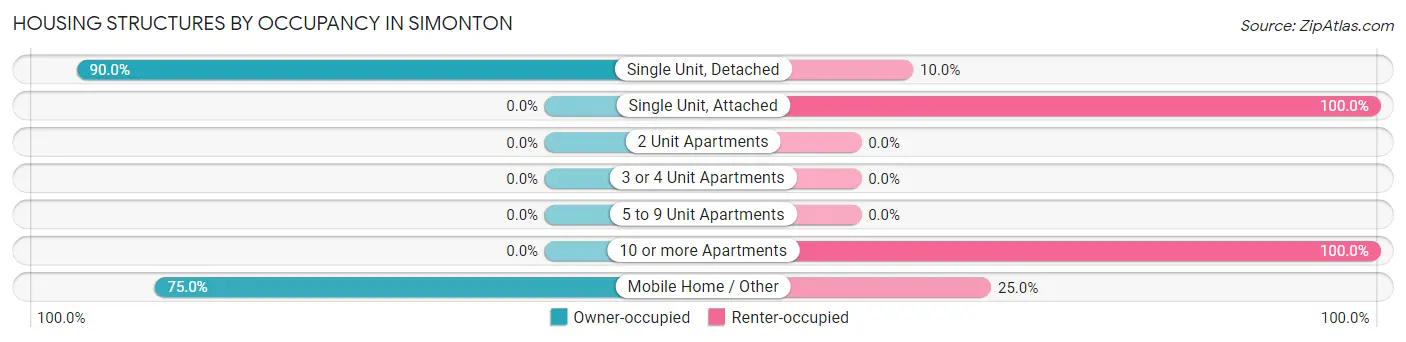
| Structure Type | Owner-occupied | Renter-occupied |
| Single Unit, Detached | 207 (90.0%) | 23 (10.0%) |
| Single Unit, Attached | 0 (0.0%) | 3 (100.0%) |
| 2 Unit Apartments | 0 (0.0%) | 0 (0.0%) |
| 3 or 4 Unit Apartments | 0 (0.0%) | 0 (0.0%) |
| 5 to 9 Unit Apartments | 0 (0.0%) | 0 (0.0%) |
| 10 or more Apartments | 0 (0.0%) | 3 (100.0%) |
| Mobile Home / Other | 9 (75.0%) | 3 (25.0%) |
| Total | 216 (87.1%) | 32 (12.9%) |
Housing Structures by Number of Rooms in Simonton
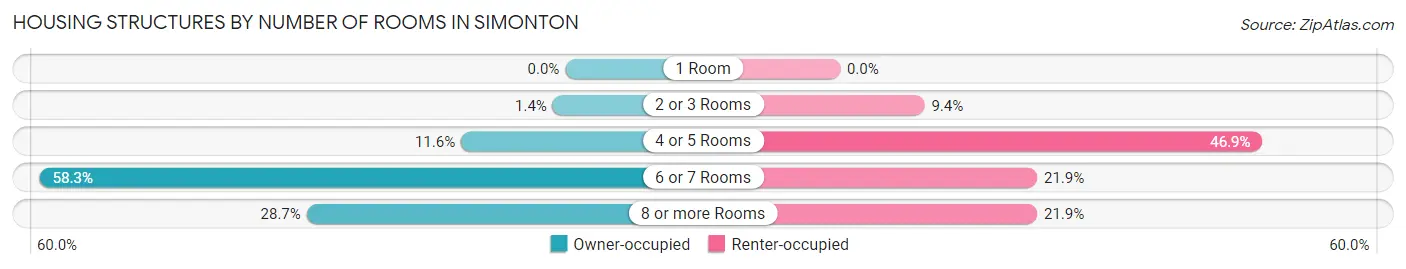
| Number of Rooms | Owner-occupied | Renter-occupied |
| 1 Room | 0 (0.0%) | 0 (0.0%) |
| 2 or 3 Rooms | 3 (1.4%) | 3 (9.4%) |
| 4 or 5 Rooms | 25 (11.6%) | 15 (46.9%) |
| 6 or 7 Rooms | 126 (58.3%) | 7 (21.9%) |
| 8 or more Rooms | 62 (28.7%) | 7 (21.9%) |
| Total | 216 (100.0%) | 32 (100.0%) |
Housing Structure by Heating Type in Simonton
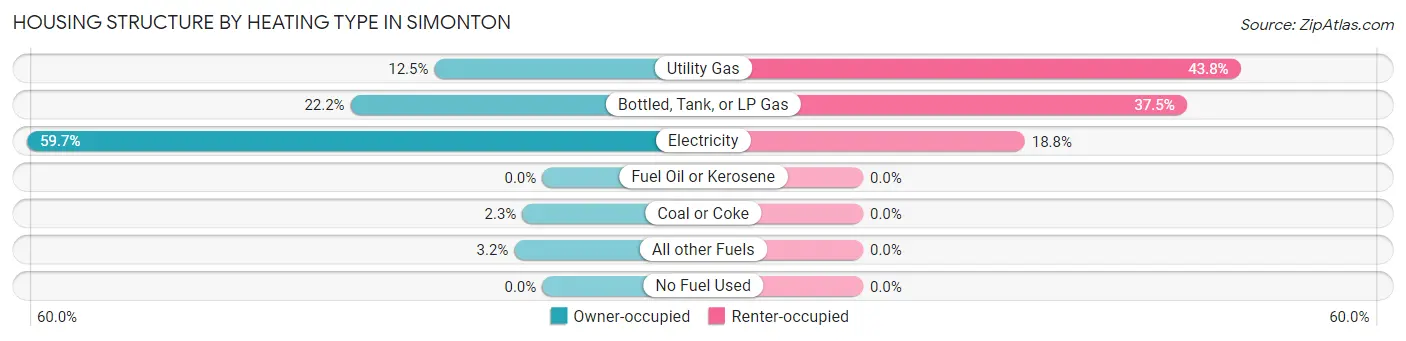
| Heating Type | Owner-occupied | Renter-occupied |
| Utility Gas | 27 (12.5%) | 14 (43.8%) |
| Bottled, Tank, or LP Gas | 48 (22.2%) | 12 (37.5%) |
| Electricity | 129 (59.7%) | 6 (18.8%) |
| Fuel Oil or Kerosene | 0 (0.0%) | 0 (0.0%) |
| Coal or Coke | 5 (2.3%) | 0 (0.0%) |
| All other Fuels | 7 (3.2%) | 0 (0.0%) |
| No Fuel Used | 0 (0.0%) | 0 (0.0%) |
| Total | 216 (100.0%) | 32 (100.0%) |
Household Vehicle Usage in Simonton
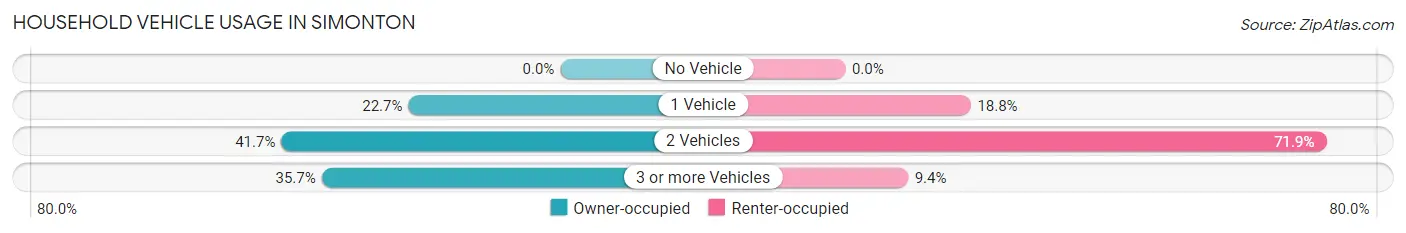
| Vehicles per Household | Owner-occupied | Renter-occupied |
| No Vehicle | 0 (0.0%) | 0 (0.0%) |
| 1 Vehicle | 49 (22.7%) | 6 (18.8%) |
| 2 Vehicles | 90 (41.7%) | 23 (71.9%) |
| 3 or more Vehicles | 77 (35.6%) | 3 (9.4%) |
| Total | 216 (100.0%) | 32 (100.0%) |
Real Estate & Mortgages in Simonton
Real Estate and Mortgage Overview in Simonton
| Characteristic | Without Mortgage | With Mortgage |
| Housing Units | 62 | 154 |
| Median Property Value | $322,600 | $304,500 |
| Median Household Income | $60,833 | $72 |
| Monthly Housing Costs | $791 | $14 |
| Real Estate Taxes | $3,725 | $7 |
Property Value by Mortgage Status in Simonton
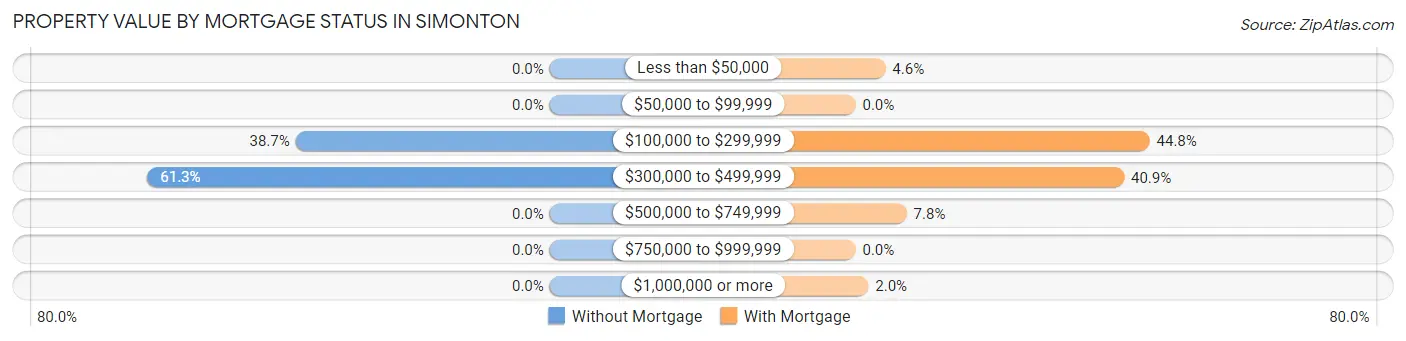
| Property Value | Without Mortgage | With Mortgage |
| Less than $50,000 | 0 (0.0%) | 7 (4.5%) |
| $50,000 to $99,999 | 0 (0.0%) | 0 (0.0%) |
| $100,000 to $299,999 | 24 (38.7%) | 69 (44.8%) |
| $300,000 to $499,999 | 38 (61.3%) | 63 (40.9%) |
| $500,000 to $749,999 | 0 (0.0%) | 12 (7.8%) |
| $750,000 to $999,999 | 0 (0.0%) | 0 (0.0%) |
| $1,000,000 or more | 0 (0.0%) | 3 (1.9%) |
| Total | 62 (100.0%) | 154 (100.0%) |
Household Income by Mortgage Status in Simonton
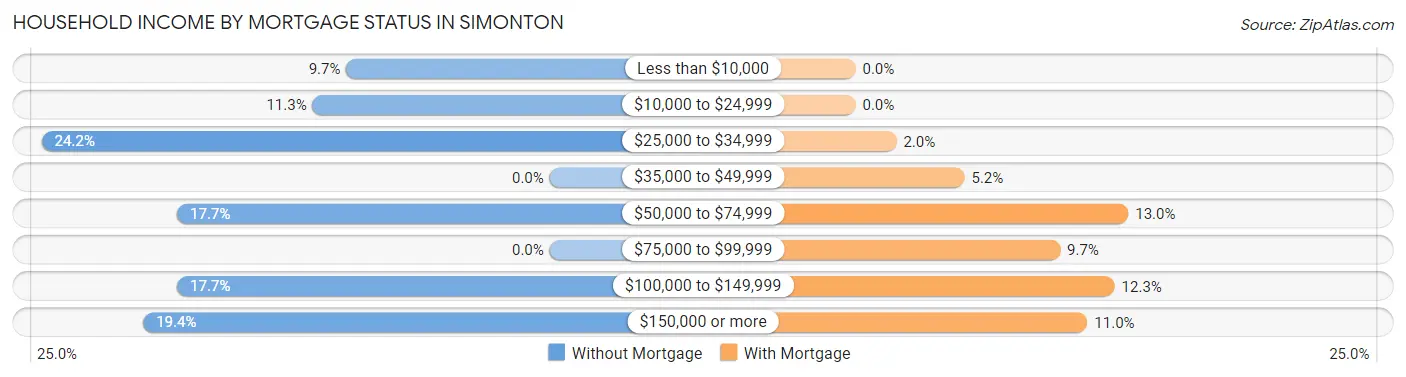
| Household Income | Without Mortgage | With Mortgage |
| Less than $10,000 | 6 (9.7%) | 0 (0.0%) |
| $10,000 to $24,999 | 7 (11.3%) | 0 (0.0%) |
| $25,000 to $34,999 | 15 (24.2%) | 3 (1.9%) |
| $35,000 to $49,999 | 0 (0.0%) | 8 (5.2%) |
| $50,000 to $74,999 | 11 (17.7%) | 20 (13.0%) |
| $75,000 to $99,999 | 0 (0.0%) | 15 (9.7%) |
| $100,000 to $149,999 | 11 (17.7%) | 19 (12.3%) |
| $150,000 or more | 12 (19.4%) | 17 (11.0%) |
| Total | 62 (100.0%) | 154 (100.0%) |
Property Value to Household Income Ratio in Simonton
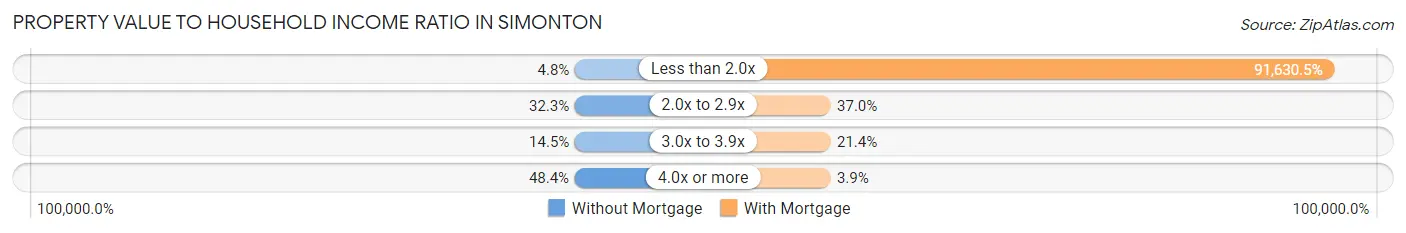
| Value-to-Income Ratio | Without Mortgage | With Mortgage |
| Less than 2.0x | 3 (4.8%) | 141,111 (91,630.5%) |
| 2.0x to 2.9x | 20 (32.3%) | 57 (37.0%) |
| 3.0x to 3.9x | 9 (14.5%) | 33 (21.4%) |
| 4.0x or more | 30 (48.4%) | 6 (3.9%) |
| Total | 62 (100.0%) | 154 (100.0%) |
Real Estate Taxes by Mortgage Status in Simonton
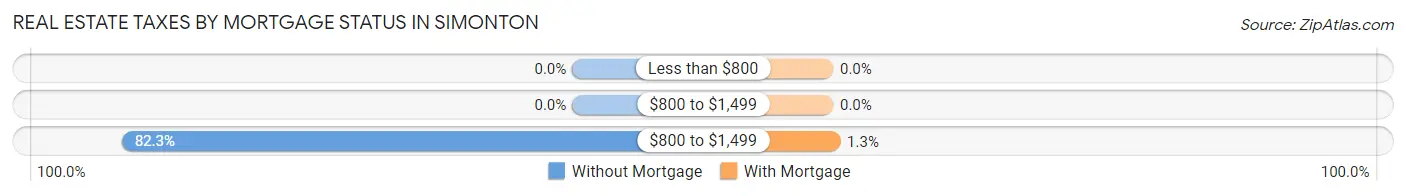
| Property Taxes | Without Mortgage | With Mortgage |
| Less than $800 | 0 (0.0%) | 0 (0.0%) |
| $800 to $1,499 | 0 (0.0%) | 0 (0.0%) |
| $800 to $1,499 | 51 (82.3%) | 2 (1.3%) |
| Total | 62 (100.0%) | 154 (100.0%) |
Health & Disability in Simonton
Health Insurance Coverage by Age in Simonton
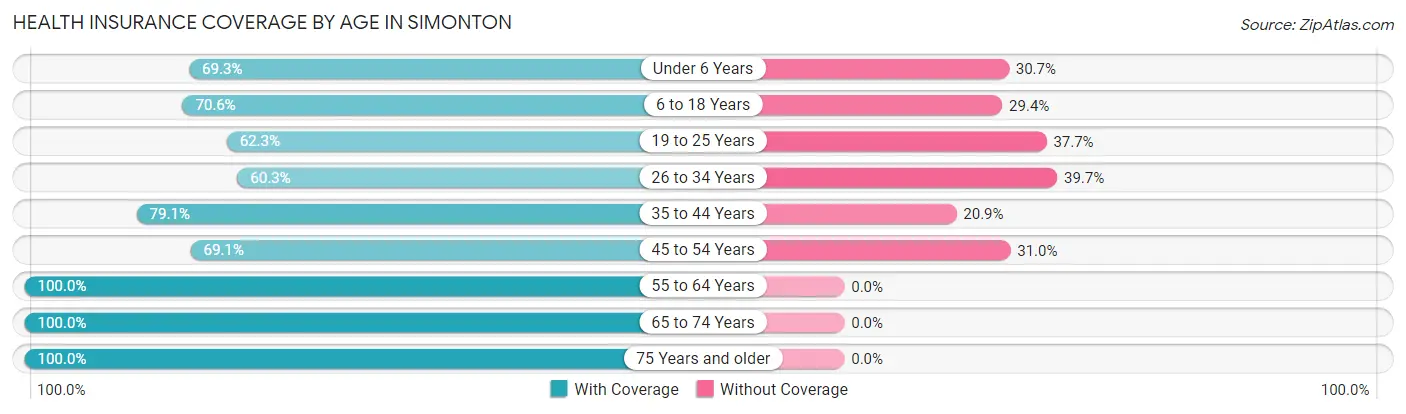
| Age Bracket | With Coverage | Without Coverage |
| Under 6 Years | 61 (69.3%) | 27 (30.7%) |
| 6 to 18 Years | 139 (70.6%) | 58 (29.4%) |
| 19 to 25 Years | 38 (62.3%) | 23 (37.7%) |
| 26 to 34 Years | 38 (60.3%) | 25 (39.7%) |
| 35 to 44 Years | 140 (79.1%) | 37 (20.9%) |
| 45 to 54 Years | 87 (69.1%) | 39 (30.9%) |
| 55 to 64 Years | 57 (100.0%) | 0 (0.0%) |
| 65 to 74 Years | 73 (100.0%) | 0 (0.0%) |
| 75 Years and older | 14 (100.0%) | 0 (0.0%) |
| Total | 647 (75.6%) | 209 (24.4%) |
Health Insurance Coverage by Citizenship Status in Simonton
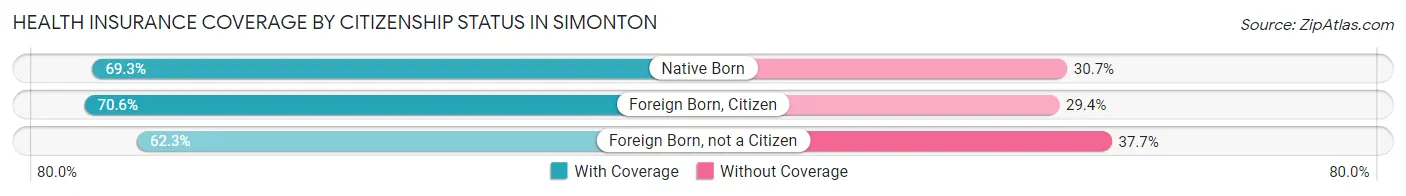
| Citizenship Status | With Coverage | Without Coverage |
| Native Born | 61 (69.3%) | 27 (30.7%) |
| Foreign Born, Citizen | 139 (70.6%) | 58 (29.4%) |
| Foreign Born, not a Citizen | 38 (62.3%) | 23 (37.7%) |
Health Insurance Coverage by Household Income in Simonton
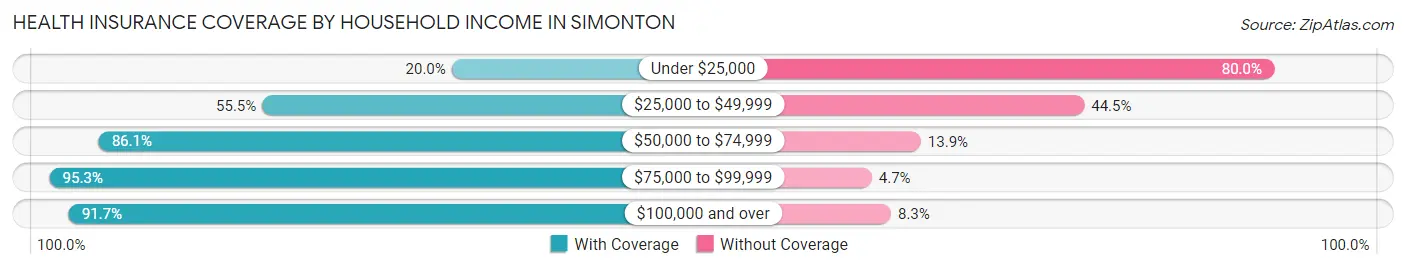
| Household Income | With Coverage | Without Coverage |
| Under $25,000 | 16 (20.0%) | 64 (80.0%) |
| $25,000 to $49,999 | 121 (55.5%) | 97 (44.5%) |
| $50,000 to $74,999 | 62 (86.1%) | 10 (13.9%) |
| $75,000 to $99,999 | 61 (95.3%) | 3 (4.7%) |
| $100,000 and over | 387 (91.7%) | 35 (8.3%) |
Public vs Private Health Insurance Coverage by Age in Simonton
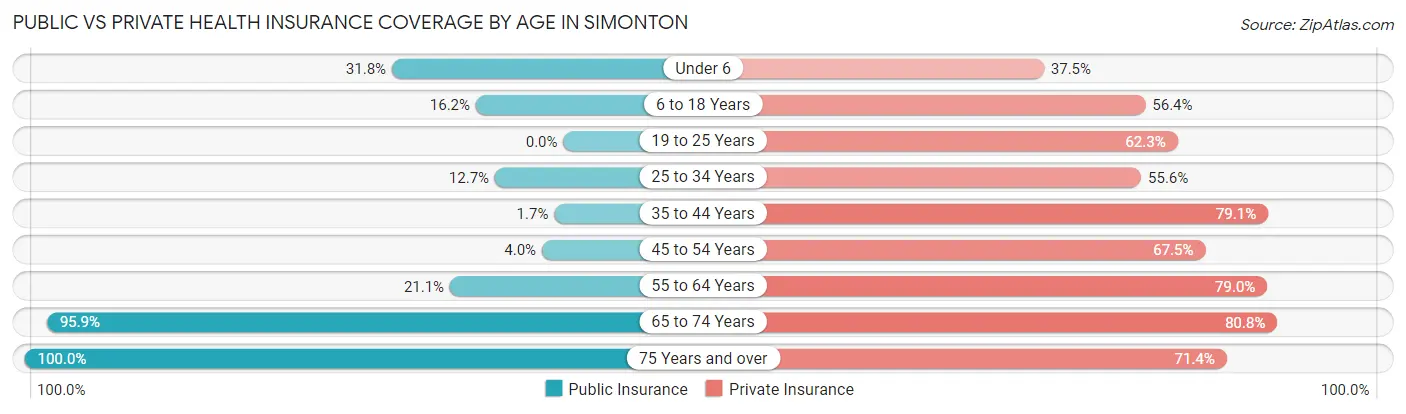
| Age Bracket | Public Insurance | Private Insurance |
| Under 6 | 28 (31.8%) | 33 (37.5%) |
| 6 to 18 Years | 32 (16.2%) | 111 (56.4%) |
| 19 to 25 Years | 0 (0.0%) | 38 (62.3%) |
| 25 to 34 Years | 8 (12.7%) | 35 (55.6%) |
| 35 to 44 Years | 3 (1.7%) | 140 (79.1%) |
| 45 to 54 Years | 5 (4.0%) | 85 (67.5%) |
| 55 to 64 Years | 12 (21.0%) | 45 (78.9%) |
| 65 to 74 Years | 70 (95.9%) | 59 (80.8%) |
| 75 Years and over | 14 (100.0%) | 10 (71.4%) |
| Total | 172 (20.1%) | 556 (64.9%) |
Disability Status by Sex by Age in Simonton
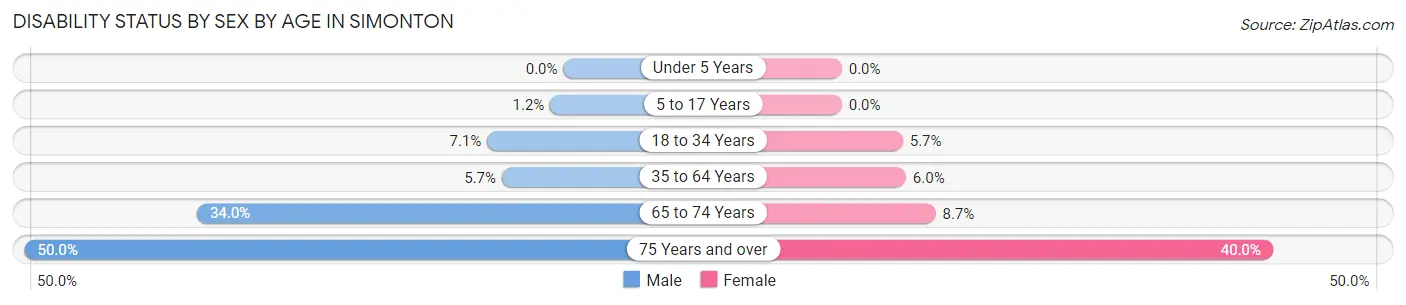
| Age Bracket | Male | Female |
| Under 5 Years | 0 (0.0%) | 0 (0.0%) |
| 5 to 17 Years | 1 (1.2%) | 0 (0.0%) |
| 18 to 34 Years | 7 (7.1%) | 3 (5.7%) |
| 35 to 64 Years | 10 (5.7%) | 11 (5.9%) |
| 65 to 74 Years | 17 (34.0%) | 2 (8.7%) |
| 75 Years and over | 2 (50.0%) | 4 (40.0%) |
Disability Class by Sex by Age in Simonton
Disability Class: Hearing Difficulty
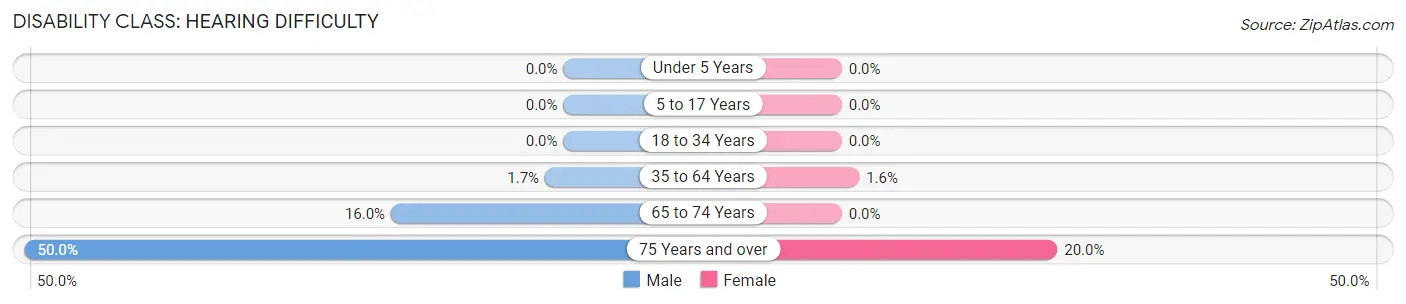
| Age Bracket | Male | Female |
| Under 5 Years | 0 (0.0%) | 0 (0.0%) |
| 5 to 17 Years | 0 (0.0%) | 0 (0.0%) |
| 18 to 34 Years | 0 (0.0%) | 0 (0.0%) |
| 35 to 64 Years | 3 (1.7%) | 3 (1.6%) |
| 65 to 74 Years | 8 (16.0%) | 0 (0.0%) |
| 75 Years and over | 2 (50.0%) | 2 (20.0%) |
Disability Class: Vision Difficulty
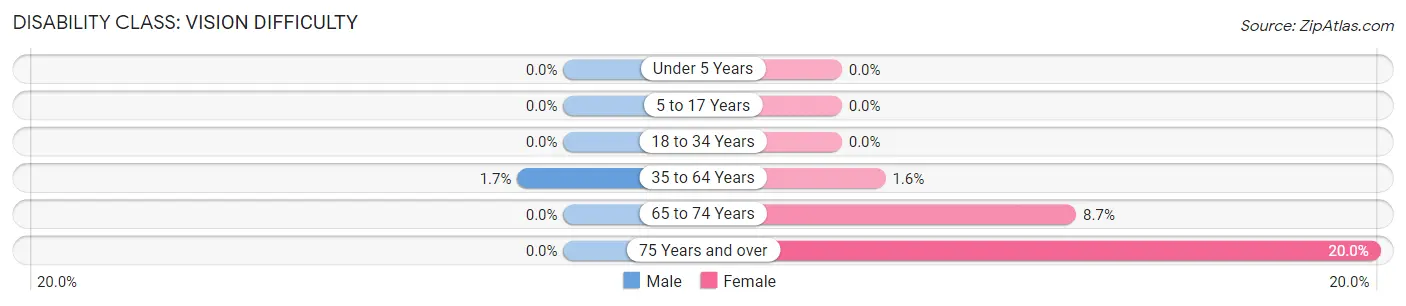
| Age Bracket | Male | Female |
| Under 5 Years | 0 (0.0%) | 0 (0.0%) |
| 5 to 17 Years | 0 (0.0%) | 0 (0.0%) |
| 18 to 34 Years | 0 (0.0%) | 0 (0.0%) |
| 35 to 64 Years | 3 (1.7%) | 3 (1.6%) |
| 65 to 74 Years | 0 (0.0%) | 2 (8.7%) |
| 75 Years and over | 0 (0.0%) | 2 (20.0%) |
Disability Class: Cognitive Difficulty
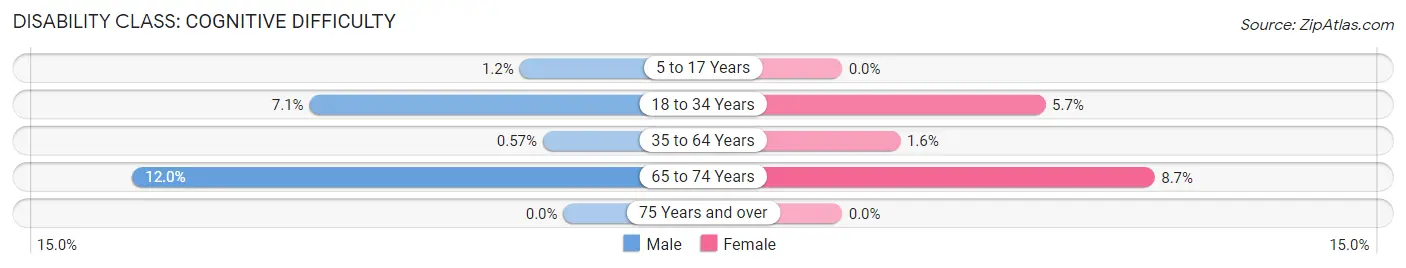
| Age Bracket | Male | Female |
| 5 to 17 Years | 1 (1.2%) | 0 (0.0%) |
| 18 to 34 Years | 7 (7.1%) | 3 (5.7%) |
| 35 to 64 Years | 1 (0.6%) | 3 (1.6%) |
| 65 to 74 Years | 6 (12.0%) | 2 (8.7%) |
| 75 Years and over | 0 (0.0%) | 0 (0.0%) |
Disability Class: Ambulatory Difficulty
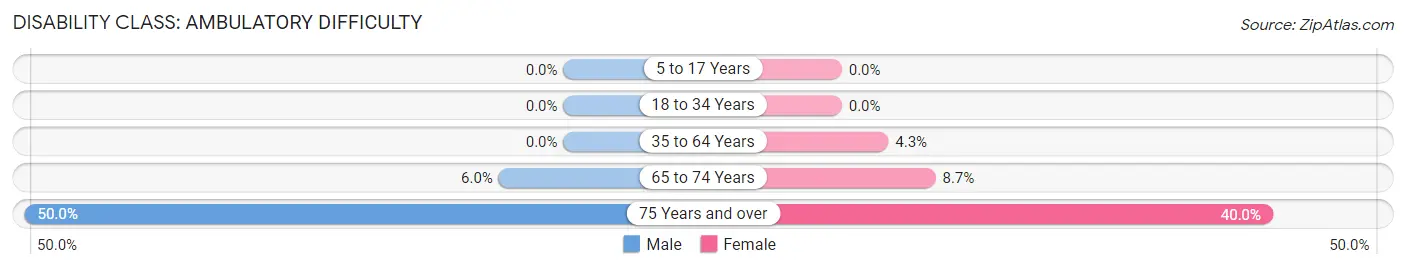
| Age Bracket | Male | Female |
| 5 to 17 Years | 0 (0.0%) | 0 (0.0%) |
| 18 to 34 Years | 0 (0.0%) | 0 (0.0%) |
| 35 to 64 Years | 0 (0.0%) | 8 (4.3%) |
| 65 to 74 Years | 3 (6.0%) | 2 (8.7%) |
| 75 Years and over | 2 (50.0%) | 4 (40.0%) |
Disability Class: Self-Care Difficulty
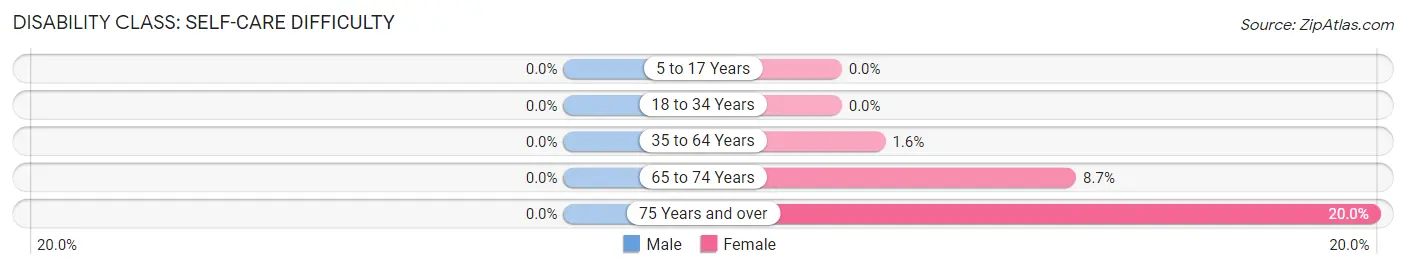
| Age Bracket | Male | Female |
| 5 to 17 Years | 0 (0.0%) | 0 (0.0%) |
| 18 to 34 Years | 0 (0.0%) | 0 (0.0%) |
| 35 to 64 Years | 0 (0.0%) | 3 (1.6%) |
| 65 to 74 Years | 0 (0.0%) | 2 (8.7%) |
| 75 Years and over | 0 (0.0%) | 2 (20.0%) |
Technology Access in Simonton
Computing Device Access in Simonton
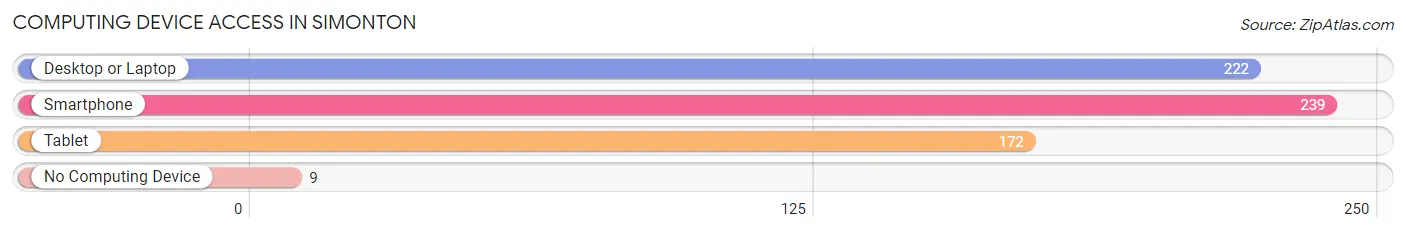
| Device Type | # Households | % Households |
| Desktop or Laptop | 222 | 89.5% |
| Smartphone | 239 | 96.4% |
| Tablet | 172 | 69.4% |
| No Computing Device | 9 | 3.6% |
| Total | 248 | 100.0% |
Internet Access in Simonton
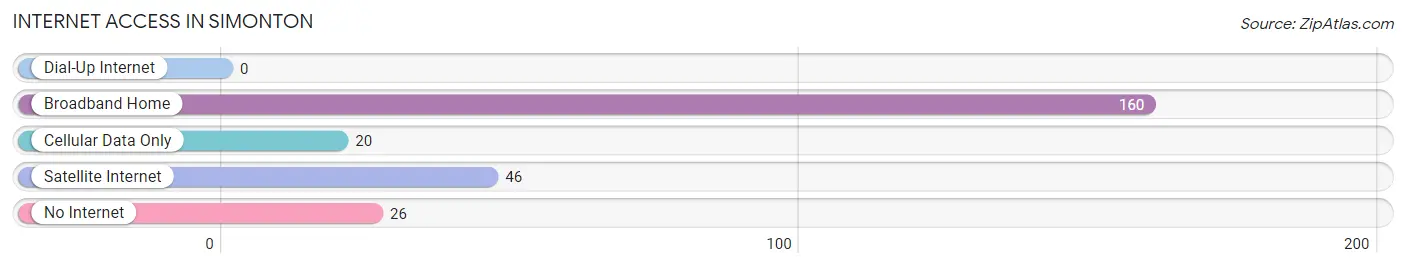
| Internet Type | # Households | % Households |
| Dial-Up Internet | 0 | 0.0% |
| Broadband Home | 160 | 64.5% |
| Cellular Data Only | 20 | 8.1% |
| Satellite Internet | 46 | 18.5% |
| No Internet | 26 | 10.5% |
| Total | 248 | 100.0% |
Simonton Summary
Simonton, Texas is a small town located in Fort Bend County, Texas. It is situated about 25 miles southwest of Houston and is part of the Houston–The Woodlands–Sugar Land metropolitan area. The town was founded in 1883 and was named after the Simonton family, who were among the first settlers in the area. As of the 2010 census, the population of Simonton was 1,611.
History
The area that is now Simonton was first settled in the early 1800s by the Simonton family, who were among the first settlers in the area. The town was officially founded in 1883 and was named after the Simonton family. The town was originally a farming community, but in the early 1900s, the town began to grow as the Houston and Texas Central Railway was built through the area. This allowed for the transportation of goods and people to and from the town.
In the early 1900s, Simonton began to develop into a small town. The first school was built in 1910 and the first post office was established in 1911. The town also had a cotton gin, a blacksmith shop, and a general store. In the 1920s, the town began to grow even more as the oil industry began to boom in the area. This led to the construction of several oil refineries in the area, which provided jobs for many of the town’s residents.
Geography
Simonton is located in Fort Bend County, Texas. It is situated about 25 miles southwest of Houston and is part of the Houston–The Woodlands–Sugar Land metropolitan area. The town is located on the Brazos River and is surrounded by rolling hills and farmland. The climate in Simonton is hot and humid in the summer and mild in the winter.
Economy
The economy of Simonton is largely based on agriculture and oil production. The town is home to several oil refineries, which provide jobs for many of the town’s residents. Agriculture is also an important part of the local economy, with many of the town’s residents working in the farming industry. In addition, the town is home to several small businesses, including restaurants, shops, and other services.
Demographics
As of the 2010 census, the population of Simonton was 1,611. The racial makeup of the town was 79.3% White, 15.2% Hispanic or Latino, 2.2% African American, 0.7% Asian, 0.2% Native American, and 2.6% from other races. The median household income in Simonton was $50,938, and the median family income was $58,938. The per capita income in Simonton was $20,938.
Simonton is a small town with a rich history and a diverse population. The town is home to many oil refineries and farms, which provide jobs for many of the town’s residents. The town also has a variety of small businesses, which provide services to the local community. Simonton is a great place to live and work, and it is a great example of a small town with a big heart.
Common Questions
What is Per Capita Income in Simonton?
Per Capita income in Simonton is $40,858.
What is the Median Family Income in Simonton?
Median Family Income in Simonton is $128,333.
What is the Median Household income in Simonton?
Median Household Income in Simonton is $127,857.
What is Income or Wage Gap in Simonton?
Income or Wage Gap in Simonton is 32.2%.
Women in Simonton earn 67.8 cents for every dollar earned by a man.
What is Inequality or Gini Index in Simonton?
Inequality or Gini Index in Simonton is 0.45.
What is the Total Population of Simonton?
Total Population of Simonton is 856.
What is the Total Male Population of Simonton?
Total Male Population of Simonton is 455.
What is the Total Female Population of Simonton?
Total Female Population of Simonton is 401.
What is the Ratio of Males per 100 Females in Simonton?
There are 113.47 Males per 100 Females in Simonton.
What is the Ratio of Females per 100 Males in Simonton?
There are 88.13 Females per 100 Males in Simonton.
What is the Median Population Age in Simonton?
Median Population Age in Simonton is 37.0 Years.
What is the Average Family Size in Simonton
Average Family Size in Simonton is 3.8 People.
What is the Average Household Size in Simonton
Average Household Size in Simonton is 3.5 People.
How Large is the Labor Force in Simonton?
There are 381 People in the Labor Forcein in Simonton.
What is the Percentage of People in the Labor Force in Simonton?
62.8% of People are in the Labor Force in Simonton.
What is the Unemployment Rate in Simonton?
Unemployment Rate in Simonton is 1.6%.