Seminole, TX Map & Demographics
Seminole Map
Seminole Overview
$31,422
PER CAPITA INCOME
$88,027
AVG FAMILY INCOME
$73,074
AVG HOUSEHOLD INCOME
56.7%
WAGE / INCOME GAP [ % ]
43.3¢/ $1
WAGE / INCOME GAP [ $ ]
0.39
INEQUALITY / GINI INDEX
7,024
TOTAL POPULATION
3,654
MALE POPULATION
3,370
FEMALE POPULATION
108.43
MALES / 100 FEMALES
92.23
FEMALES / 100 MALES
31.2
MEDIAN AGE
3.3
AVG FAMILY SIZE
2.6
AVG HOUSEHOLD SIZE
3,244
LABOR FORCE [ PEOPLE ]
62.8%
PERCENT IN LABOR FORCE
2.5%
UNEMPLOYMENT RATE
Seminole Zip Codes
Seminole Area Codes
Income in Seminole
Income Overview in Seminole
Per Capita Income in Seminole is $31,422, while median incomes of families and households are $88,027 and $73,074 respectively.
| Characteristic | Number | Measure |
| Per Capita Income | 7,024 | $31,422 |
| Median Family Income | 1,755 | $88,027 |
| Mean Family Income | 1,755 | $99,494 |
| Median Household Income | 2,649 | $73,074 |
| Mean Household Income | 2,649 | $80,781 |
| Income Deficit | 1,755 | $0 |
| Wage / Income Gap (%) | 7,024 | 56.75% |
| Wage / Income Gap ($) | 7,024 | 43.25¢ per $1 |
| Gini / Inequality Index | 7,024 | 0.39 |
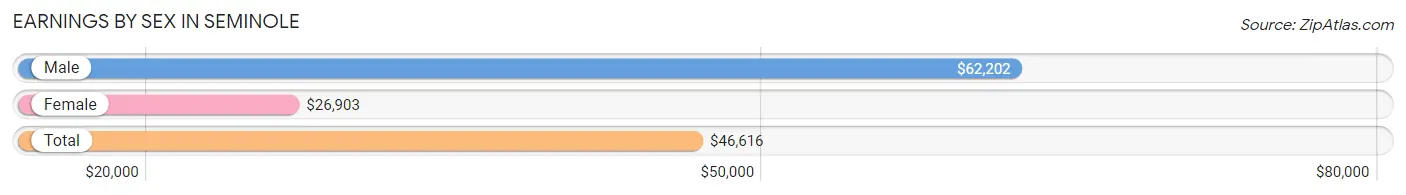
Earnings by Sex in Seminole
Average Earnings in Seminole are $46,616, $62,202 for men and $26,903 for women, a difference of 56.8%.
| Sex | Number | Average Earnings |
| Male | 2,062 (57.9%) | $62,202 |
| Female | 1,497 (42.1%) | $26,903 |
| Total | 3,559 (100.0%) | $46,616 |
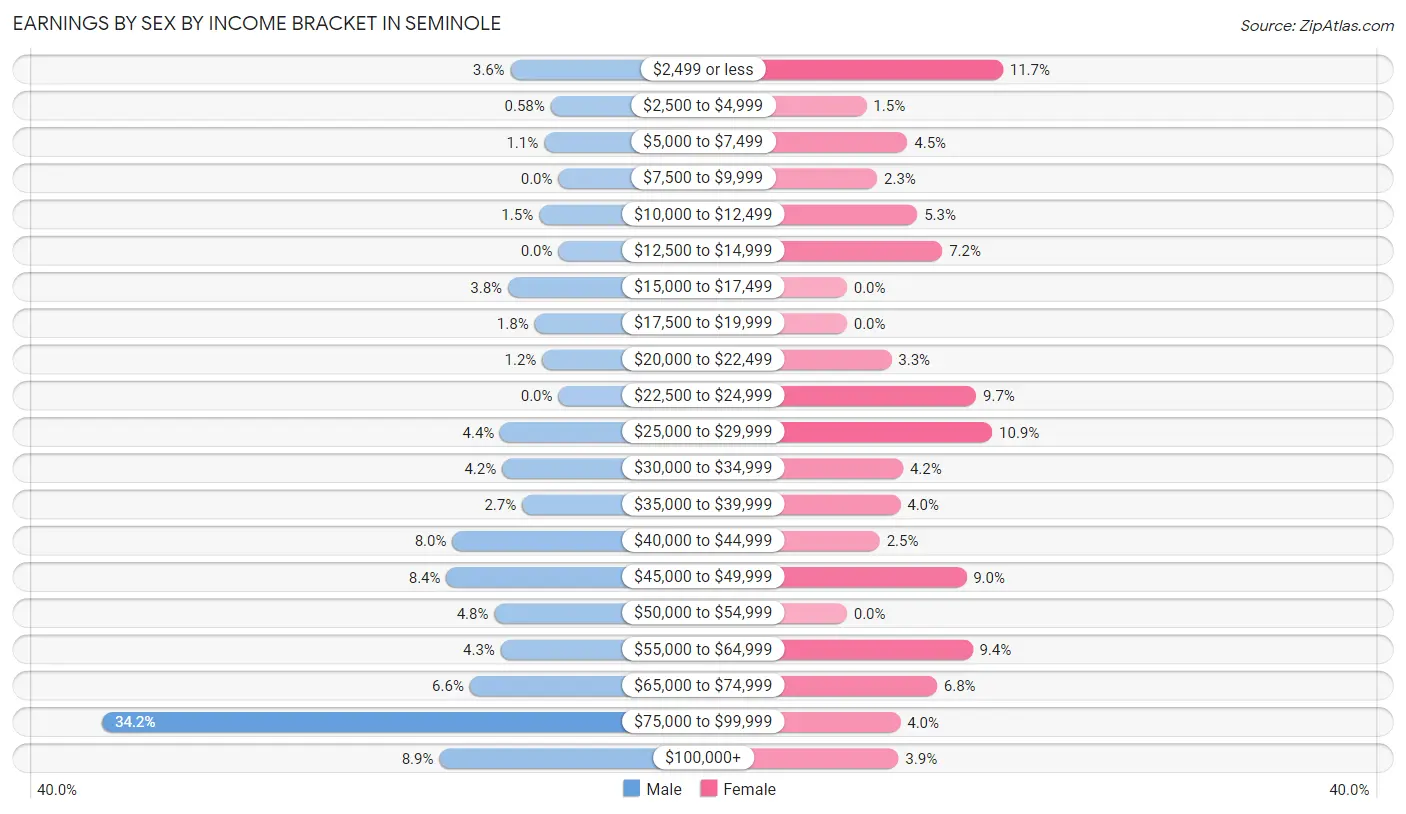
Earnings by Sex by Income Bracket in Seminole
The most common earnings brackets in Seminole are $75,000 to $99,999 for men (705 | 34.2%) and $2,499 or less for women (175 | 11.7%).
| Income | Male | Female |
| $2,499 or less | 74 (3.6%) | 175 (11.7%) |
| $2,500 to $4,999 | 12 (0.6%) | 22 (1.5%) |
| $5,000 to $7,499 | 22 (1.1%) | 68 (4.5%) |
| $7,500 to $9,999 | 0 (0.0%) | 34 (2.3%) |
| $10,000 to $12,499 | 30 (1.5%) | 79 (5.3%) |
| $12,500 to $14,999 | 0 (0.0%) | 107 (7.1%) |
| $15,000 to $17,499 | 78 (3.8%) | 0 (0.0%) |
| $17,500 to $19,999 | 37 (1.8%) | 0 (0.0%) |
| $20,000 to $22,499 | 25 (1.2%) | 50 (3.3%) |
| $22,500 to $24,999 | 0 (0.0%) | 145 (9.7%) |
| $25,000 to $29,999 | 90 (4.4%) | 163 (10.9%) |
| $30,000 to $34,999 | 87 (4.2%) | 63 (4.2%) |
| $35,000 to $39,999 | 56 (2.7%) | 60 (4.0%) |
| $40,000 to $44,999 | 164 (8.0%) | 37 (2.5%) |
| $45,000 to $49,999 | 173 (8.4%) | 134 (8.9%) |
| $50,000 to $54,999 | 99 (4.8%) | 0 (0.0%) |
| $55,000 to $64,999 | 89 (4.3%) | 141 (9.4%) |
| $65,000 to $74,999 | 137 (6.6%) | 101 (6.8%) |
| $75,000 to $99,999 | 705 (34.2%) | 60 (4.0%) |
| $100,000+ | 184 (8.9%) | 58 (3.9%) |
| Total | 2,062 (100.0%) | 1,497 (100.0%) |
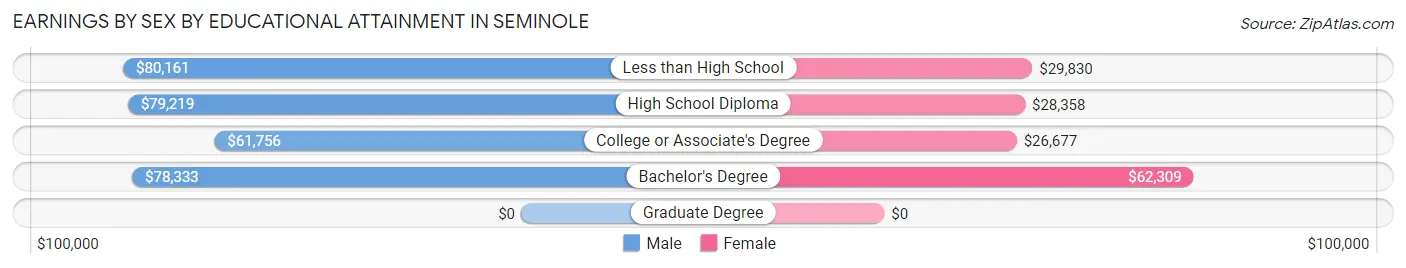
Earnings by Sex by Educational Attainment in Seminole
Average earnings in Seminole are $73,750 for men and $36,054 for women, a difference of 51.1%. Men with an educational attainment of less than high school enjoy the highest average annual earnings of $80,161, while those with college or associate's degree education earn the least with $61,756. Women with an educational attainment of bachelor's degree earn the most with the average annual earnings of $62,309, while those with college or associate's degree education have the smallest earnings of $26,677.
| Educational Attainment | Male Income | Female Income |
| Less than High School | $80,161 | $29,830 |
| High School Diploma | $79,219 | $28,358 |
| College or Associate's Degree | $61,756 | $26,677 |
| Bachelor's Degree | $78,333 | $62,309 |
| Graduate Degree | - | - |
| Total | $73,750 | $36,054 |
Family Income in Seminole
Family Income Brackets in Seminole
According to the Seminole family income data, there are 418 families falling into the $75,000 to $99,999 income range, which is the most common income bracket and makes up 23.8% of all families.
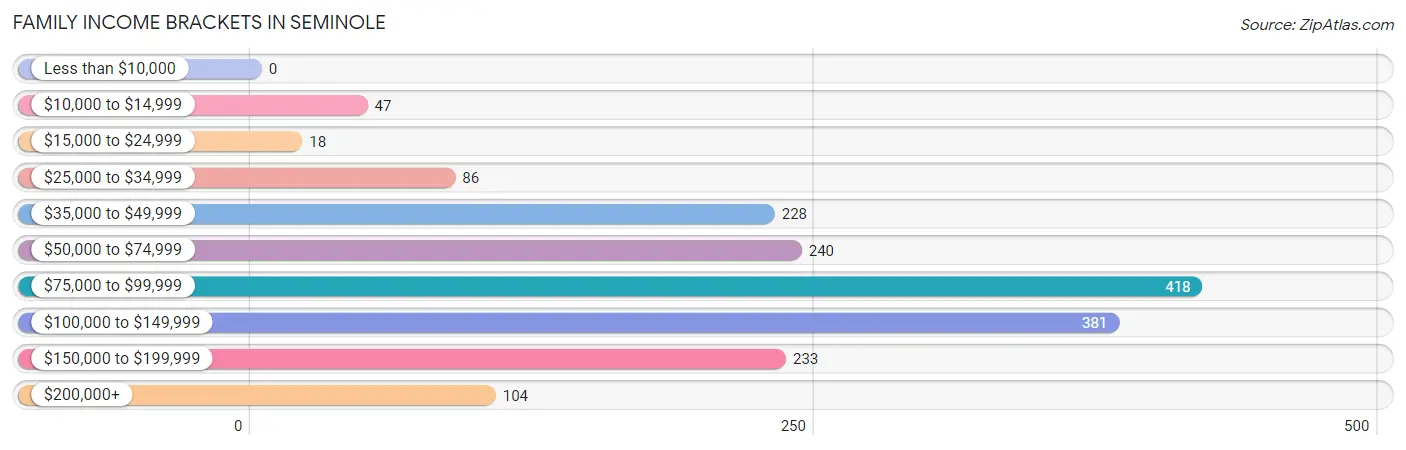
| Income Bracket | # Families | % Families |
| Less than $10,000 | 0 | 0.0% |
| $10,000 to $14,999 | 47 | 2.7% |
| $15,000 to $24,999 | 18 | 1.0% |
| $25,000 to $34,999 | 86 | 4.9% |
| $35,000 to $49,999 | 228 | 13.0% |
| $50,000 to $74,999 | 240 | 13.7% |
| $75,000 to $99,999 | 418 | 23.8% |
| $100,000 to $149,999 | 381 | 21.7% |
| $150,000 to $199,999 | 233 | 13.3% |
| $200,000+ | 104 | 5.9% |
Family Income by Famaliy Size in Seminole
5-person families (253 | 14.4%) account for the highest median family income in Seminole with $99,732 per family, while 2-person families (861 | 49.1%) have the highest median income of $46,808 per family member.
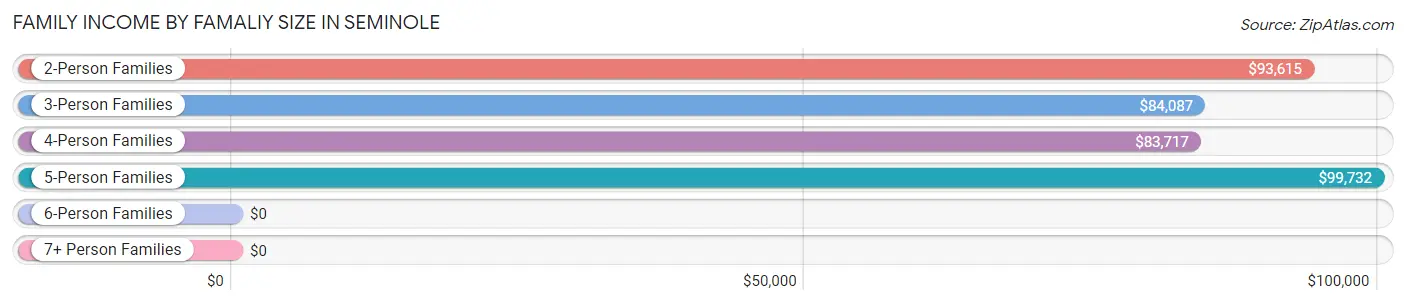
| Income Bracket | # Families | Median Income |
| 2-Person Families | 861 (49.1%) | $93,615 |
| 3-Person Families | 214 (12.2%) | $84,087 |
| 4-Person Families | 314 (17.9%) | $83,717 |
| 5-Person Families | 253 (14.4%) | $99,732 |
| 6-Person Families | 103 (5.9%) | $0 |
| 7+ Person Families | 10 (0.6%) | $0 |
| Total | 1,755 (100.0%) | $88,027 |
Family Income by Number of Earners in Seminole
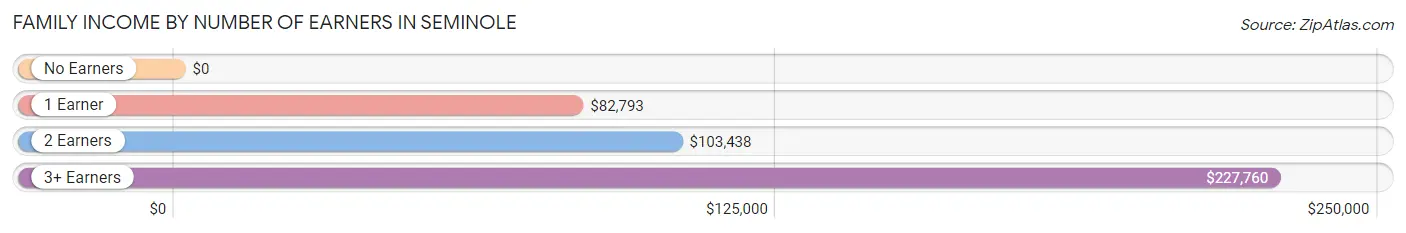
| Number of Earners | # Families | Median Income |
| No Earners | 152 (8.7%) | $0 |
| 1 Earner | 652 (37.1%) | $82,793 |
| 2 Earners | 771 (43.9%) | $103,438 |
| 3+ Earners | 180 (10.3%) | $227,760 |
| Total | 1,755 (100.0%) | $88,027 |
Household Income in Seminole
Household Income Brackets in Seminole
With 498 households falling in the category, the $75,000 to $99,999 income range is the most frequent in Seminole, accounting for 18.8% of all households. In contrast, only 50 households (1.9%) fall into the less than $10,000 income bracket, making it the least populous group.
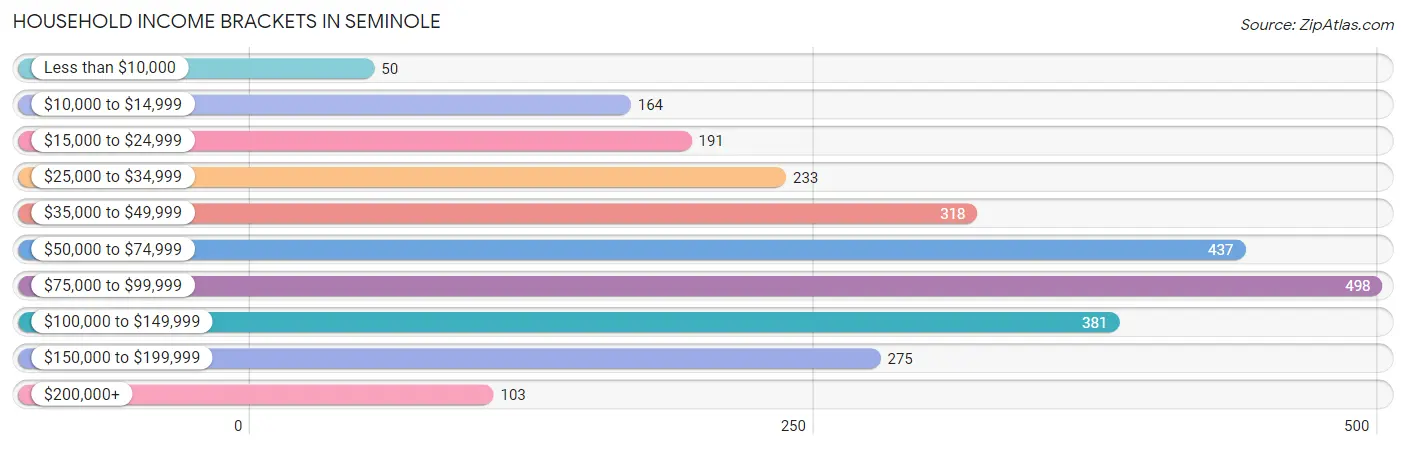
| Income Bracket | # Households | % Households |
| Less than $10,000 | 50 | 1.9% |
| $10,000 to $14,999 | 164 | 6.2% |
| $15,000 to $24,999 | 191 | 7.2% |
| $25,000 to $34,999 | 233 | 8.8% |
| $35,000 to $49,999 | 318 | 12.0% |
| $50,000 to $74,999 | 437 | 16.5% |
| $75,000 to $99,999 | 498 | 18.8% |
| $100,000 to $149,999 | 381 | 14.4% |
| $150,000 to $199,999 | 275 | 10.4% |
| $200,000+ | 103 | 3.9% |
Household Income by Householder Age in Seminole
The median household income in Seminole is $73,074, with the highest median household income of $88,688 found in the 45 to 64 years age bracket for the primary householder. A total of 714 households (27.0%) fall into this category. Meanwhile, the 65+ years age bracket for the primary householder has the lowest median household income of $27,211, with 568 households (21.4%) in this group.
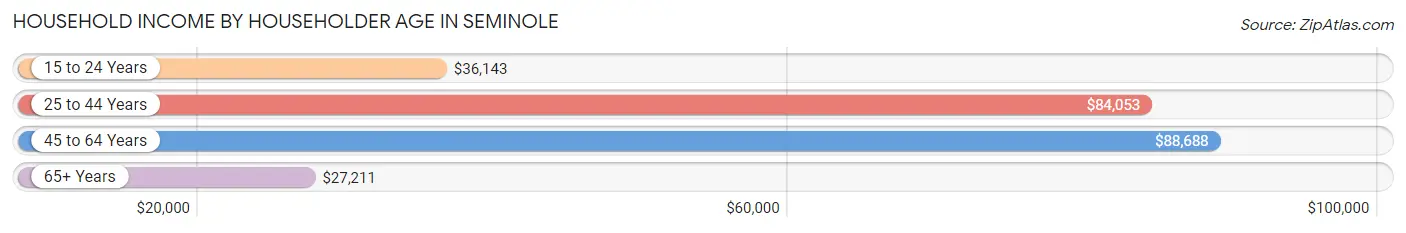
| Income Bracket | # Households | Median Income |
| 15 to 24 Years | 204 (7.7%) | $36,143 |
| 25 to 44 Years | 1,163 (43.9%) | $84,053 |
| 45 to 64 Years | 714 (27.0%) | $88,688 |
| 65+ Years | 568 (21.4%) | $27,211 |
| Total | 2,649 (100.0%) | $73,074 |
Poverty in Seminole
Income Below Poverty by Sex and Age in Seminole
With 7.2% poverty level for males and 9.3% for females among the residents of Seminole, 5 year old males and 75 year old and over females are the most vulnerable to poverty, with 27 males (69.2%) and 42 females (30.7%) in their respective age groups living below the poverty level.
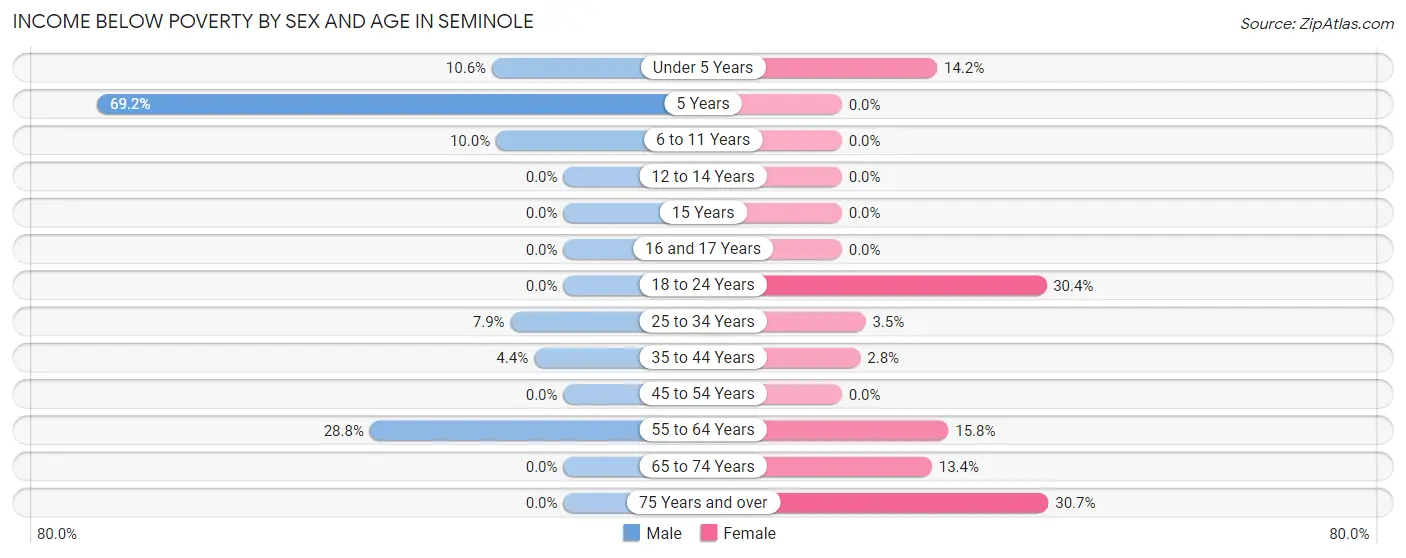
| Age Bracket | Male | Female |
| Under 5 Years | 45 (10.6%) | 45 (14.1%) |
| 5 Years | 27 (69.2%) | 0 (0.0%) |
| 6 to 11 Years | 27 (10.0%) | 0 (0.0%) |
| 12 to 14 Years | 0 (0.0%) | 0 (0.0%) |
| 15 Years | 0 (0.0%) | 0 (0.0%) |
| 16 and 17 Years | 0 (0.0%) | 0 (0.0%) |
| 18 to 24 Years | 0 (0.0%) | 112 (30.3%) |
| 25 to 34 Years | 39 (7.9%) | 17 (3.5%) |
| 35 to 44 Years | 26 (4.4%) | 12 (2.8%) |
| 45 to 54 Years | 0 (0.0%) | 0 (0.0%) |
| 55 to 64 Years | 94 (28.7%) | 47 (15.8%) |
| 65 to 74 Years | 0 (0.0%) | 35 (13.4%) |
| 75 Years and over | 0 (0.0%) | 42 (30.7%) |
| Total | 258 (7.2%) | 310 (9.3%) |
Income Above Poverty by Sex and Age in Seminole
According to the poverty statistics in Seminole, males aged 12 to 14 years and females aged 5 years are the age groups that are most secure financially, with 100.0% of males and 100.0% of females in these age groups living above the poverty line.
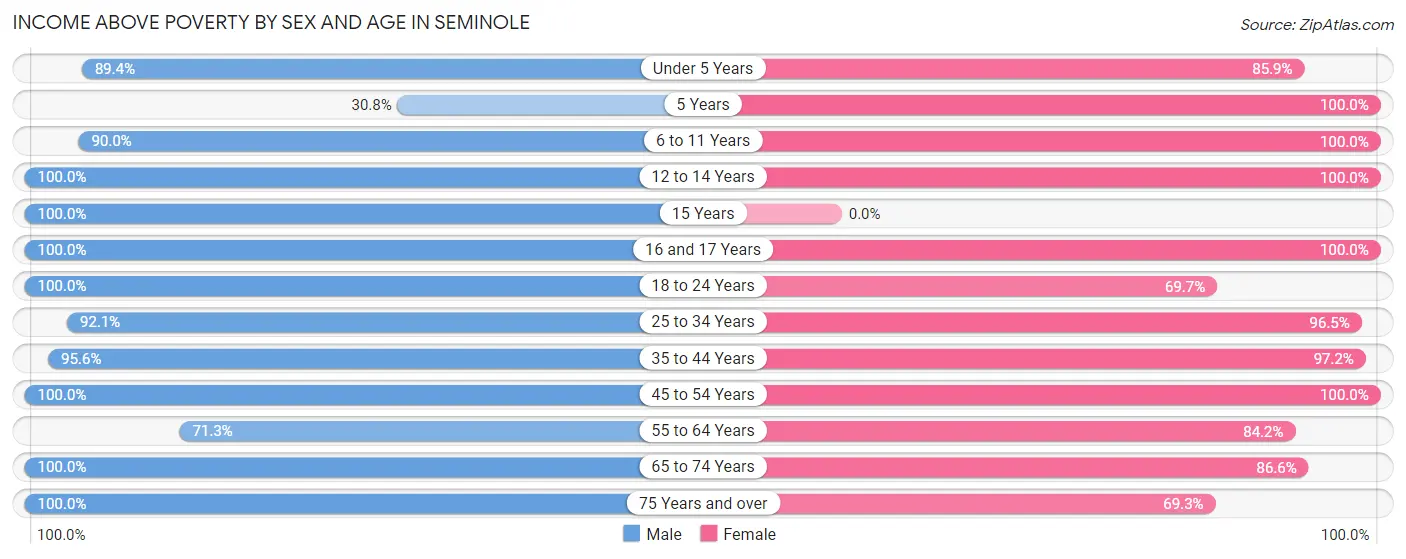
| Age Bracket | Male | Female |
| Under 5 Years | 379 (89.4%) | 273 (85.9%) |
| 5 Years | 12 (30.8%) | 43 (100.0%) |
| 6 to 11 Years | 243 (90.0%) | 277 (100.0%) |
| 12 to 14 Years | 210 (100.0%) | 238 (100.0%) |
| 15 Years | 39 (100.0%) | 0 (0.0%) |
| 16 and 17 Years | 88 (100.0%) | 176 (100.0%) |
| 18 to 24 Years | 316 (100.0%) | 257 (69.7%) |
| 25 to 34 Years | 457 (92.1%) | 466 (96.5%) |
| 35 to 44 Years | 570 (95.6%) | 423 (97.2%) |
| 45 to 54 Years | 368 (100.0%) | 279 (100.0%) |
| 55 to 64 Years | 233 (71.3%) | 250 (84.2%) |
| 65 to 74 Years | 268 (100.0%) | 227 (86.6%) |
| 75 Years and over | 135 (100.0%) | 95 (69.3%) |
| Total | 3,318 (92.8%) | 3,004 (90.6%) |
Income Below Poverty Among Married-Couple Families in Seminole
The poverty statistics for married-couple families in Seminole show that 4.0% or 64 of the total 1,607 families live below the poverty line. Families with 3 or 4 children have the highest poverty rate of 5.9%, comprising of 17 families. On the other hand, families with 1 or 2 children have the lowest poverty rate of 0.0%, which includes 0 families.
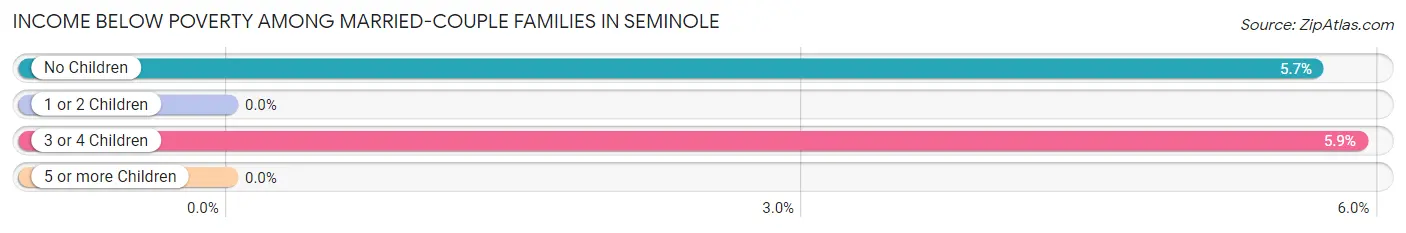
| Children | Above Poverty | Below Poverty |
| No Children | 782 (94.3%) | 47 (5.7%) |
| 1 or 2 Children | 490 (100.0%) | 0 (0.0%) |
| 3 or 4 Children | 271 (94.1%) | 17 (5.9%) |
| 5 or more Children | 0 (0.0%) | 0 (0.0%) |
| Total | 1,543 (96.0%) | 64 (4.0%) |
Income Below Poverty Among Single-Parent Households in Seminole
| Children | Single Father | Single Mother |
| No Children | 0 (0.0%) | 0 (0.0%) |
| 1 or 2 Children | 0 (0.0%) | 0 (0.0%) |
| 3 or 4 Children | 0 (0.0%) | 0 (0.0%) |
| 5 or more Children | 0 (0.0%) | 0 (0.0%) |
| Total | 0 (0.0%) | 0 (0.0%) |
Income Below Poverty Among Married-Couple vs Single-Parent Households in Seminole
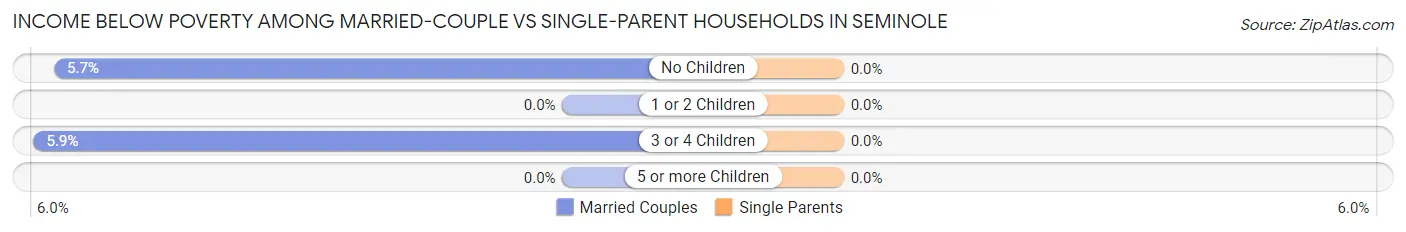
| Children | Married-Couple Families | Single-Parent Households |
| No Children | 47 (5.7%) | 0 (0.0%) |
| 1 or 2 Children | 0 (0.0%) | 0 (0.0%) |
| 3 or 4 Children | 17 (5.9%) | 0 (0.0%) |
| 5 or more Children | 0 (0.0%) | 0 (0.0%) |
| Total | 64 (4.0%) | 0 (0.0%) |
Race in Seminole
The most populous races in Seminole are White / Caucasian (4,950 | 70.5%), Hispanic or Latino (3,991 | 56.8%), and Two or more Races (1,451 | 20.7%).
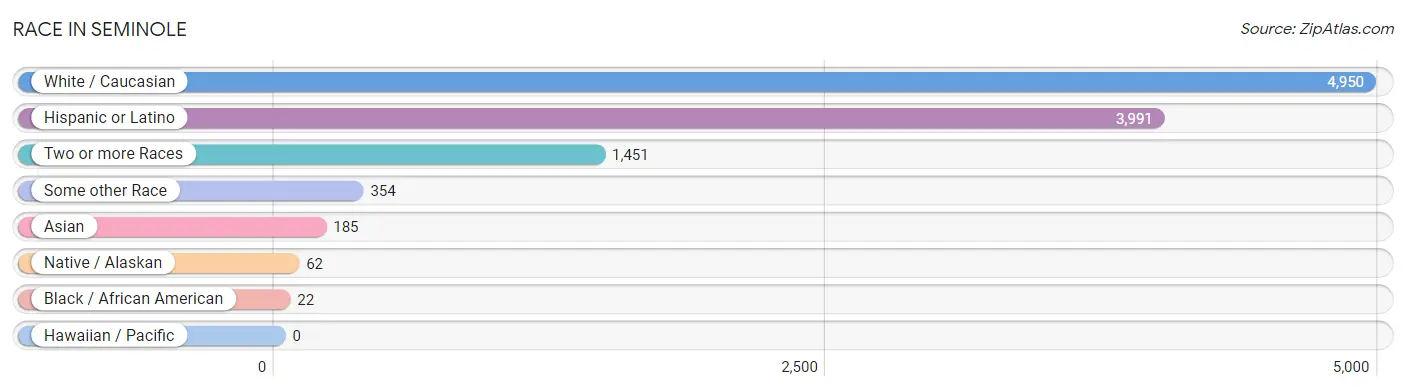
| Race | # Population | % Population |
| Asian | 185 | 2.6% |
| Black / African American | 22 | 0.3% |
| Hawaiian / Pacific | 0 | 0.0% |
| Hispanic or Latino | 3,991 | 56.8% |
| Native / Alaskan | 62 | 0.9% |
| White / Caucasian | 4,950 | 70.5% |
| Two or more Races | 1,451 | 20.7% |
| Some other Race | 354 | 5.0% |
| Total | 7,024 | 100.0% |
Ancestry in Seminole
The most populous ancestries reported in Seminole are Mexican (3,451 | 49.1%), German (552 | 7.9%), American (414 | 5.9%), English (310 | 4.4%), and Irish (221 | 3.2%), together accounting for 70.4% of all Seminole residents.
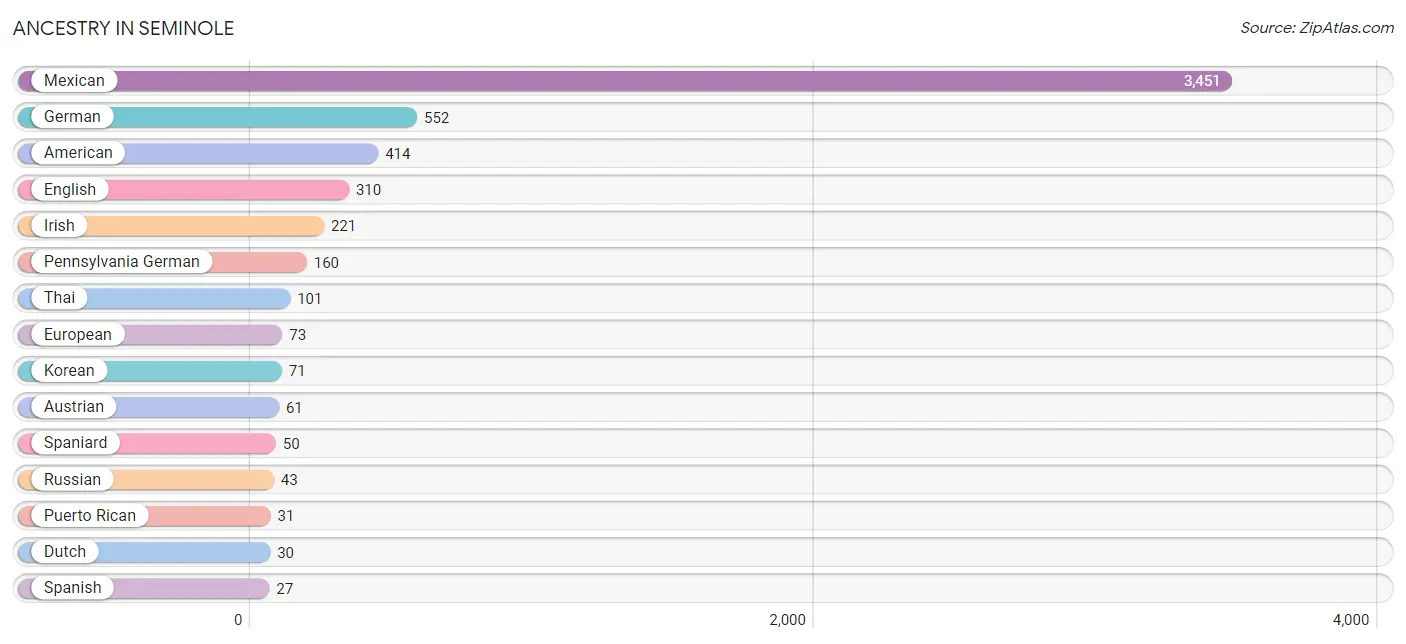
| Ancestry | # Population | % Population |
| American | 414 | 5.9% |
| Arab | 11 | 0.2% |
| Austrian | 61 | 0.9% |
| Blackfeet | 13 | 0.2% |
| British | 24 | 0.3% |
| Canadian | 4 | 0.1% |
| Cherokee | 10 | 0.1% |
| Dutch | 30 | 0.4% |
| English | 310 | 4.4% |
| European | 73 | 1.0% |
| German | 552 | 7.9% |
| Irish | 221 | 3.2% |
| Korean | 71 | 1.0% |
| Mexican | 3,451 | 49.1% |
| Pennsylvania German | 160 | 2.3% |
| Polish | 2 | 0.0% |
| Puerto Rican | 31 | 0.4% |
| Russian | 43 | 0.6% |
| Scotch-Irish | 26 | 0.4% |
| Spaniard | 50 | 0.7% |
| Spanish | 27 | 0.4% |
| Thai | 101 | 1.4% | View All 22 Rows |
Immigrants in Seminole
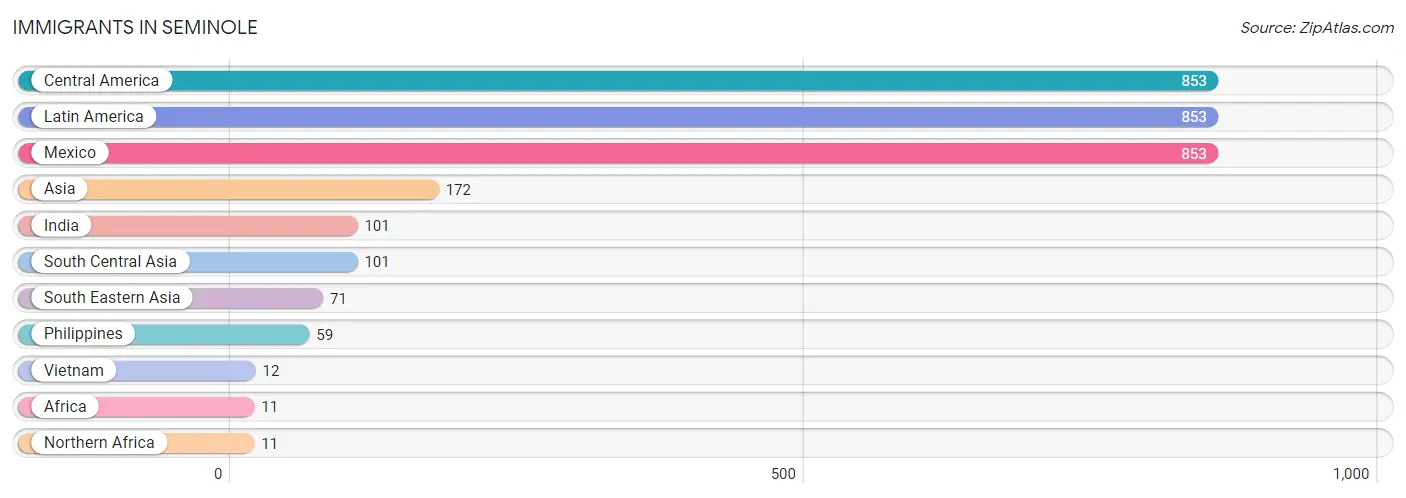
The most numerous immigrant groups reported in Seminole came from Central America (853 | 12.1%), Latin America (853 | 12.1%), Mexico (853 | 12.1%), Asia (172 | 2.5%), and India (101 | 1.4%), together accounting for 40.3% of all Seminole residents.
| Immigration Origin | # Population | % Population |
| Africa | 11 | 0.2% |
| Asia | 172 | 2.5% |
| Central America | 853 | 12.1% |
| India | 101 | 1.4% |
| Latin America | 853 | 12.1% |
| Mexico | 853 | 12.1% |
| Northern Africa | 11 | 0.2% |
| Philippines | 59 | 0.8% |
| South Central Asia | 101 | 1.4% |
| South Eastern Asia | 71 | 1.0% |
| Vietnam | 12 | 0.2% | View All 11 Rows |
Sex and Age in Seminole
Sex and Age in Seminole
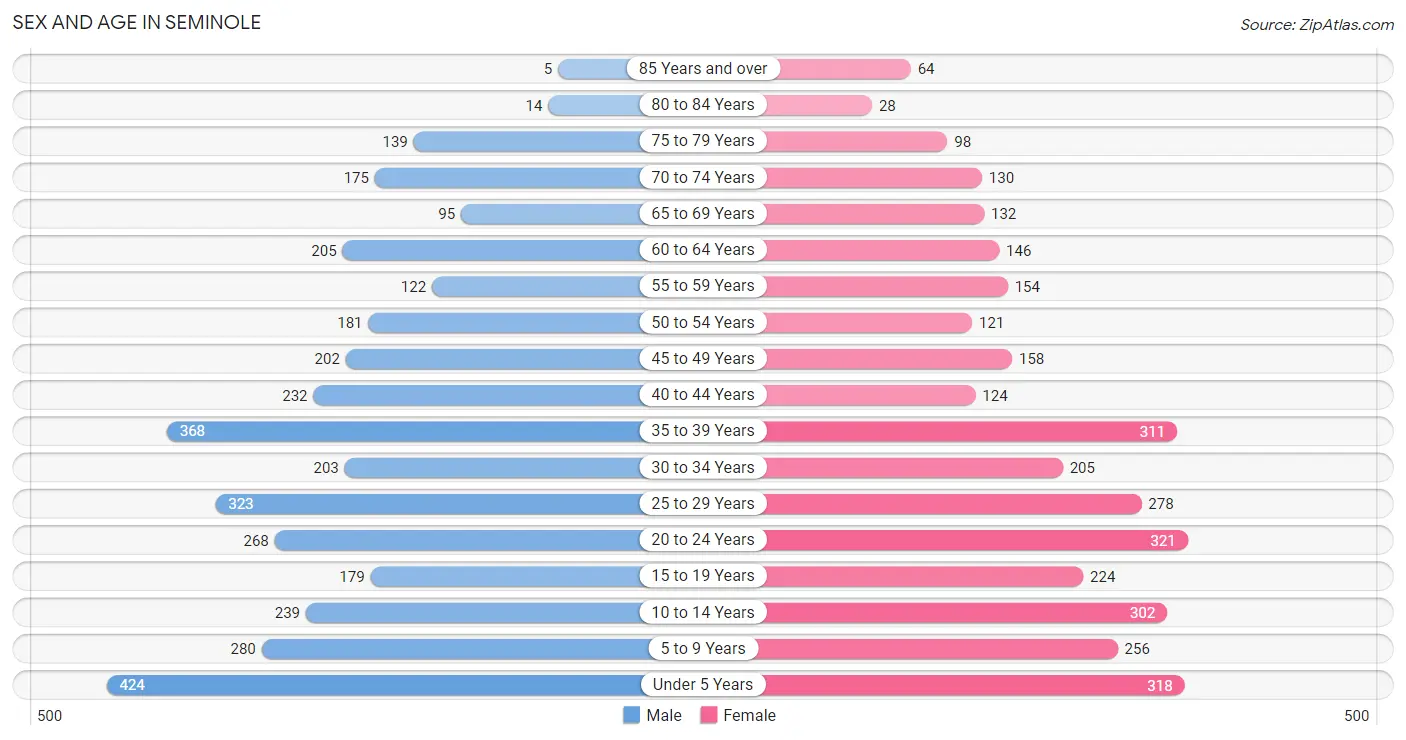
The most populous age groups in Seminole are Under 5 Years (424 | 11.6%) for men and 20 to 24 Years (321 | 9.5%) for women.
| Age Bracket | Male | Female |
| Under 5 Years | 424 (11.6%) | 318 (9.4%) |
| 5 to 9 Years | 280 (7.7%) | 256 (7.6%) |
| 10 to 14 Years | 239 (6.5%) | 302 (9.0%) |
| 15 to 19 Years | 179 (4.9%) | 224 (6.7%) |
| 20 to 24 Years | 268 (7.3%) | 321 (9.5%) |
| 25 to 29 Years | 323 (8.8%) | 278 (8.3%) |
| 30 to 34 Years | 203 (5.6%) | 205 (6.1%) |
| 35 to 39 Years | 368 (10.1%) | 311 (9.2%) |
| 40 to 44 Years | 232 (6.4%) | 124 (3.7%) |
| 45 to 49 Years | 202 (5.5%) | 158 (4.7%) |
| 50 to 54 Years | 181 (5.0%) | 121 (3.6%) |
| 55 to 59 Years | 122 (3.3%) | 154 (4.6%) |
| 60 to 64 Years | 205 (5.6%) | 146 (4.3%) |
| 65 to 69 Years | 95 (2.6%) | 132 (3.9%) |
| 70 to 74 Years | 175 (4.8%) | 130 (3.9%) |
| 75 to 79 Years | 139 (3.8%) | 98 (2.9%) |
| 80 to 84 Years | 14 (0.4%) | 28 (0.8%) |
| 85 Years and over | 5 (0.1%) | 64 (1.9%) |
| Total | 3,654 (100.0%) | 3,370 (100.0%) |
Families and Households in Seminole
Median Family Size in Seminole
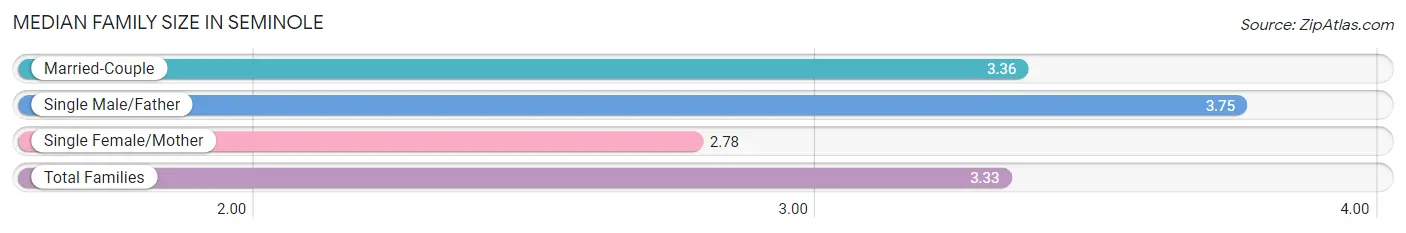
The median family size in Seminole is 3.33 persons per family, with single male/father families (40 | 2.3%) accounting for the largest median family size of 3.75 persons per family. On the other hand, single female/mother families (108 | 6.1%) represent the smallest median family size with 2.78 persons per family.
| Family Type | # Families | Family Size |
| Married-Couple | 1,607 (91.6%) | 3.36 |
| Single Male/Father | 40 (2.3%) | 3.75 |
| Single Female/Mother | 108 (6.1%) | 2.78 |
| Total Families | 1,755 (100.0%) | 3.33 |
Median Household Size in Seminole
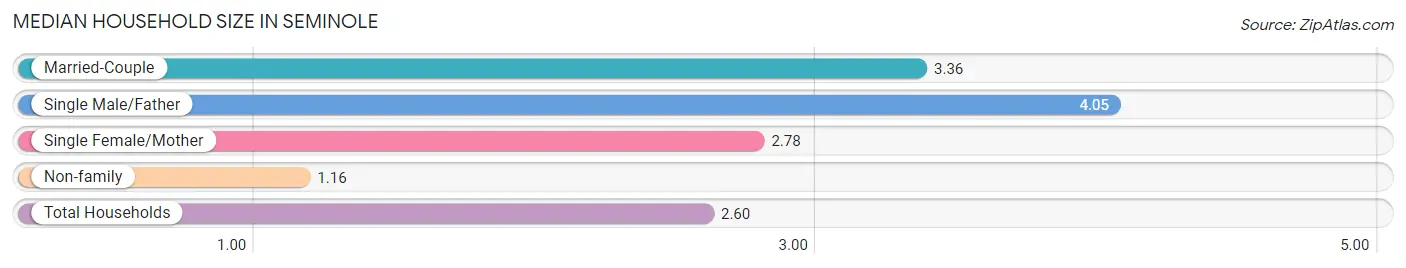
The median household size in Seminole is 2.60 persons per household, with single male/father households (40 | 1.5%) accounting for the largest median household size of 4.05 persons per household. non-family households (894 | 33.8%) represent the smallest median household size with 1.16 persons per household.
| Household Type | # Households | Household Size |
| Married-Couple | 1,607 (60.7%) | 3.36 |
| Single Male/Father | 40 (1.5%) | 4.05 |
| Single Female/Mother | 108 (4.1%) | 2.78 |
| Non-family | 894 (33.8%) | 1.16 |
| Total Households | 2,649 (100.0%) | 2.60 |
Household Size by Marriage Status in Seminole
Out of a total of 2,649 households in Seminole, 1,755 (66.2%) are family households, while 894 (33.8%) are nonfamily households. The most numerous type of family households are 2-person households, comprising 861, and the most common type of nonfamily households are 1-person households, comprising 713.
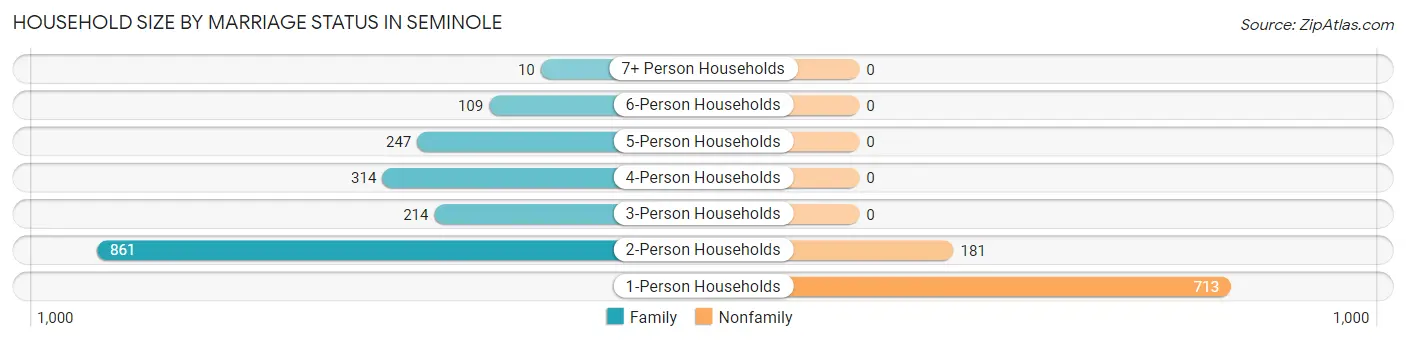
| Household Size | Family Households | Nonfamily Households |
| 1-Person Households | - | 713 (26.9%) |
| 2-Person Households | 861 (32.5%) | 181 (6.8%) |
| 3-Person Households | 214 (8.1%) | 0 (0.0%) |
| 4-Person Households | 314 (11.8%) | 0 (0.0%) |
| 5-Person Households | 247 (9.3%) | 0 (0.0%) |
| 6-Person Households | 109 (4.1%) | 0 (0.0%) |
| 7+ Person Households | 10 (0.4%) | 0 (0.0%) |
| Total | 1,755 (66.2%) | 894 (33.8%) |
Female Fertility in Seminole
Fertility by Age in Seminole
Average fertility rate in Seminole is 63.0 births per 1,000 women. Women in the age bracket of 20 to 34 years have the highest fertility rate with 128.0 births per 1,000 women. Women in the age bracket of 20 to 34 years acount for 100.0% of all women with births.
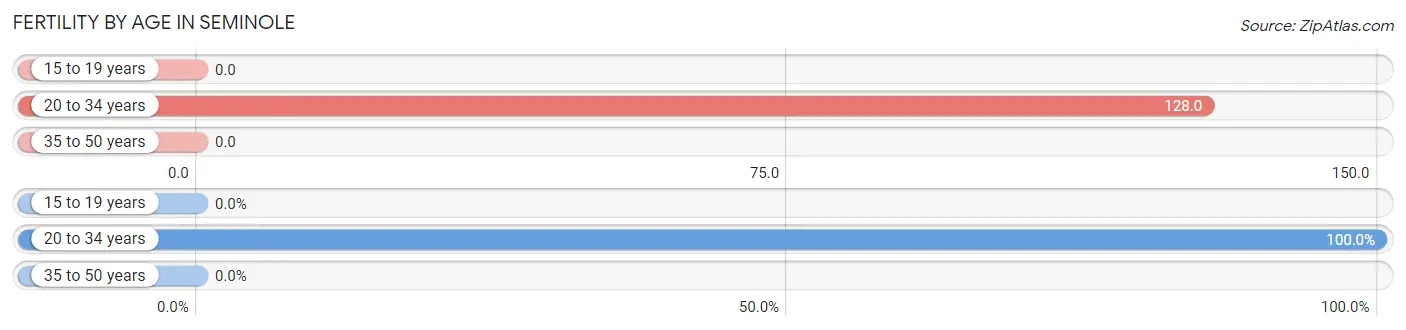
| Age Bracket | Women with Births | Births / 1,000 Women |
| 15 to 19 years | 0 (0.0%) | 0.0 |
| 20 to 34 years | 103 (100.0%) | 128.0 |
| 35 to 50 years | 0 (0.0%) | 0.0 |
| Total | 103 (100.0%) | 63.0 |
Fertility by Age by Marriage Status in Seminole
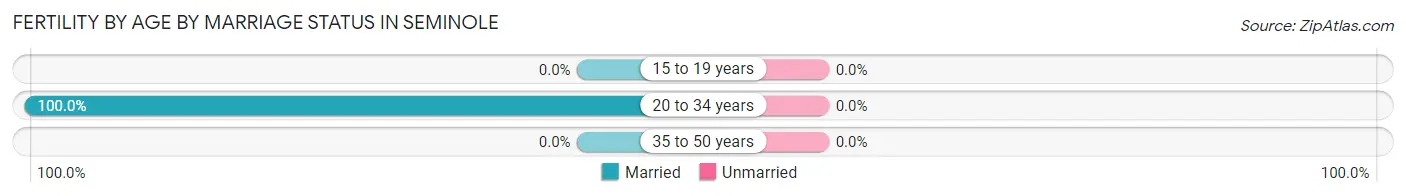
| Age Bracket | Married | Unmarried |
| 15 to 19 years | 0 (0.0%) | 0 (0.0%) |
| 20 to 34 years | 103 (100.0%) | 0 (0.0%) |
| 35 to 50 years | 0 (0.0%) | 0 (0.0%) |
| Total | 103 (100.0%) | 0 (0.0%) |
Fertility by Education in Seminole
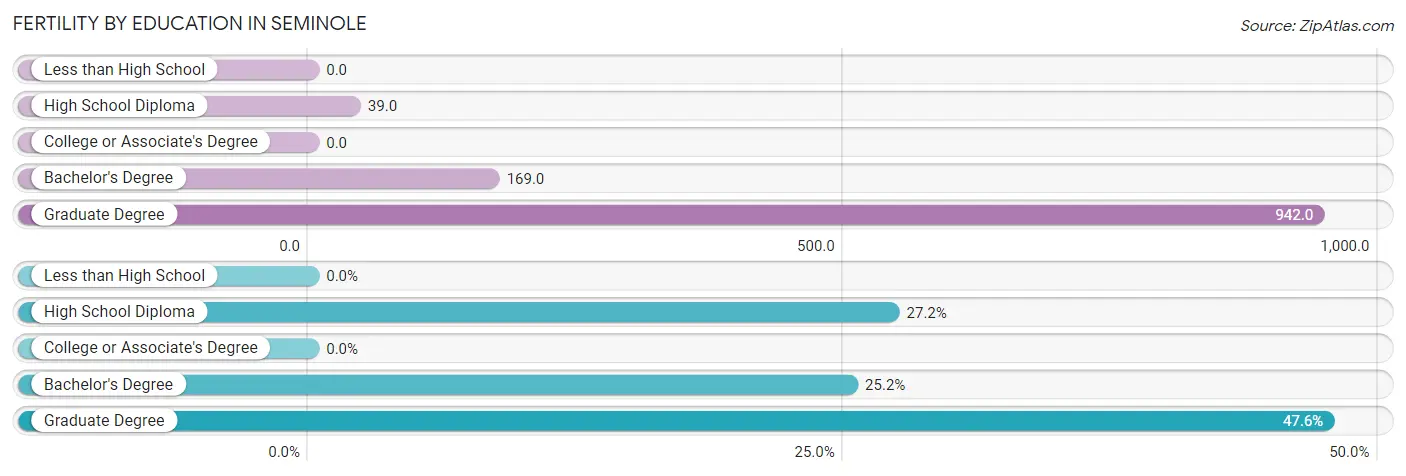
| Educational Attainment | Women with Births | Births / 1,000 Women |
| Less than High School | 0 (0.0%) | 0.0 |
| High School Diploma | 28 (27.2%) | 39.0 |
| College or Associate's Degree | 0 (0.0%) | 0.0 |
| Bachelor's Degree | 26 (25.2%) | 169.0 |
| Graduate Degree | 49 (47.6%) | 942.0 |
| Total | 103 (100.0%) | 63.0 |
Fertility by Education by Marriage Status in Seminole
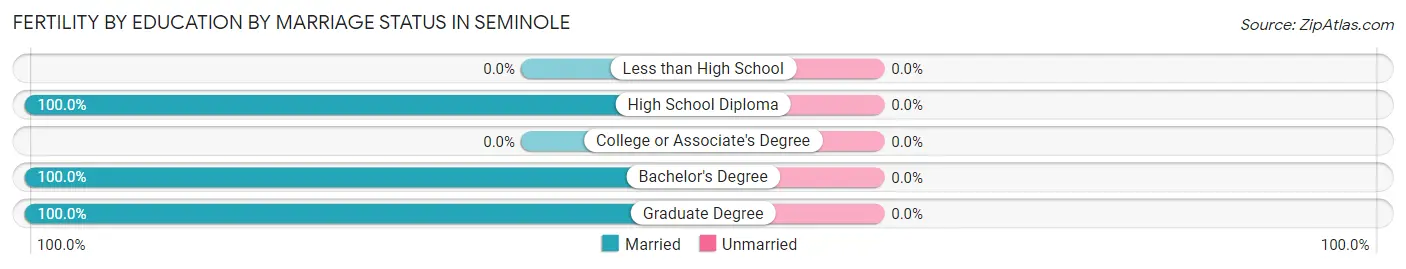
| Educational Attainment | Married | Unmarried |
| Less than High School | 0 (0.0%) | 0 (0.0%) |
| High School Diploma | 28 (100.0%) | 0 (0.0%) |
| College or Associate's Degree | 0 (0.0%) | 0 (0.0%) |
| Bachelor's Degree | 26 (100.0%) | 0 (0.0%) |
| Graduate Degree | 49 (100.0%) | 0 (0.0%) |
| Total | 103 (100.0%) | 0 (0.0%) |
Employment Characteristics in Seminole
Employment by Class of Employer in Seminole
Among the 3,036 employed individuals in Seminole, private company employees (1,633 | 53.8%), local government employees (416 | 13.7%), and self-employed (not incorporated) (362 | 11.9%) make up the most common classes of employment.
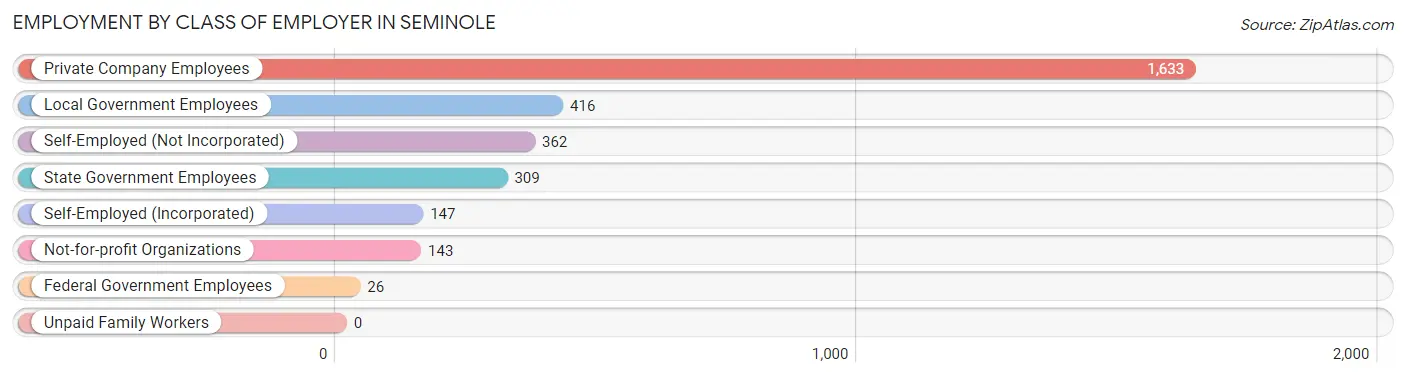
| Employer Class | # Employees | % Employees |
| Private Company Employees | 1,633 | 53.8% |
| Self-Employed (Incorporated) | 147 | 4.8% |
| Self-Employed (Not Incorporated) | 362 | 11.9% |
| Not-for-profit Organizations | 143 | 4.7% |
| Local Government Employees | 416 | 13.7% |
| State Government Employees | 309 | 10.2% |
| Federal Government Employees | 26 | 0.9% |
| Unpaid Family Workers | 0 | 0.0% |
| Total | 3,036 | 100.0% |
Employment Status by Age in Seminole
According to the labor force statistics for Seminole, out of the total population over 16 years of age (5,166), 62.8% or 3,244 individuals are in the labor force, with 2.5% or 81 of them unemployed. The age group with the highest labor force participation rate is 45 to 54 years, with 97.7% or 647 individuals in the labor force. Within the labor force, the 20 to 24 years age range has the highest percentage of unemployed individuals, with 14.8% or 69 of them being unemployed.
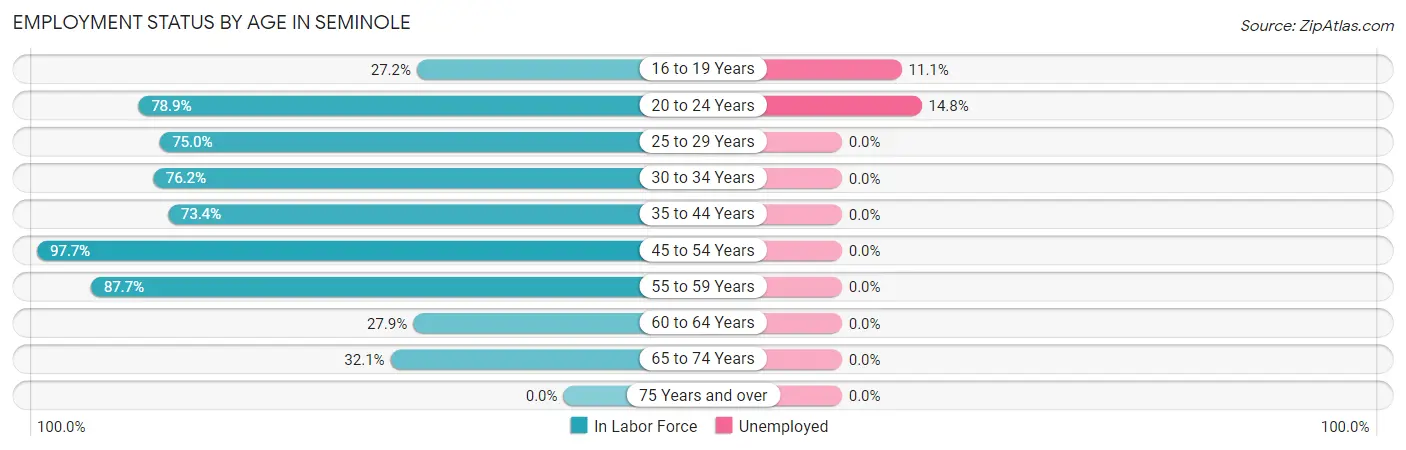
| Age Bracket | In Labor Force | Unemployed |
| 16 to 19 Years | 99 (27.2%) | 11 (11.1%) |
| 20 to 24 Years | 465 (78.9%) | 69 (14.8%) |
| 25 to 29 Years | 451 (75.0%) | 0 (0.0%) |
| 30 to 34 Years | 311 (76.2%) | 0 (0.0%) |
| 35 to 44 Years | 760 (73.4%) | 0 (0.0%) |
| 45 to 54 Years | 647 (97.7%) | 0 (0.0%) |
| 55 to 59 Years | 242 (87.7%) | 0 (0.0%) |
| 60 to 64 Years | 98 (27.9%) | 0 (0.0%) |
| 65 to 74 Years | 171 (32.1%) | 0 (0.0%) |
| 75 Years and over | 0 (0.0%) | 0 (0.0%) |
| Total | 3,244 (62.8%) | 81 (2.5%) |
Employment Status by Educational Attainment in Seminole
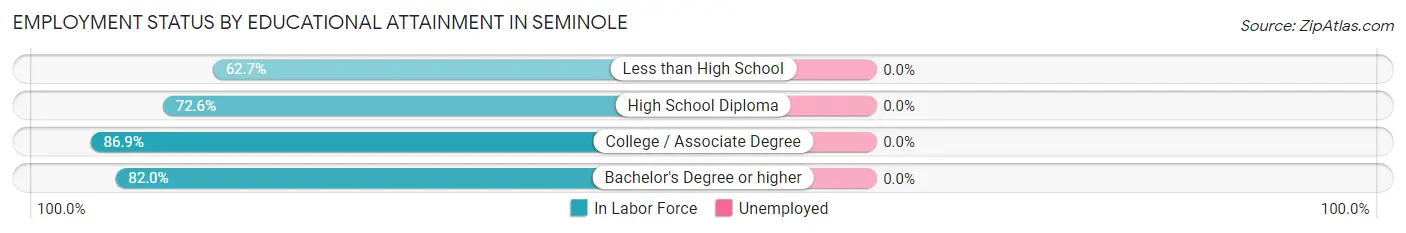
| Educational Attainment | In Labor Force | Unemployed |
| Less than High School | 424 (62.7%) | 0 (0.0%) |
| High School Diploma | 959 (72.6%) | 0 (0.0%) |
| College / Associate Degree | 549 (86.9%) | 0 (0.0%) |
| Bachelor's Degree or higher | 577 (82.0%) | 0 (0.0%) |
| Total | 2,510 (75.3%) | 0 (0.0%) |
Employment Occupations by Sex in Seminole
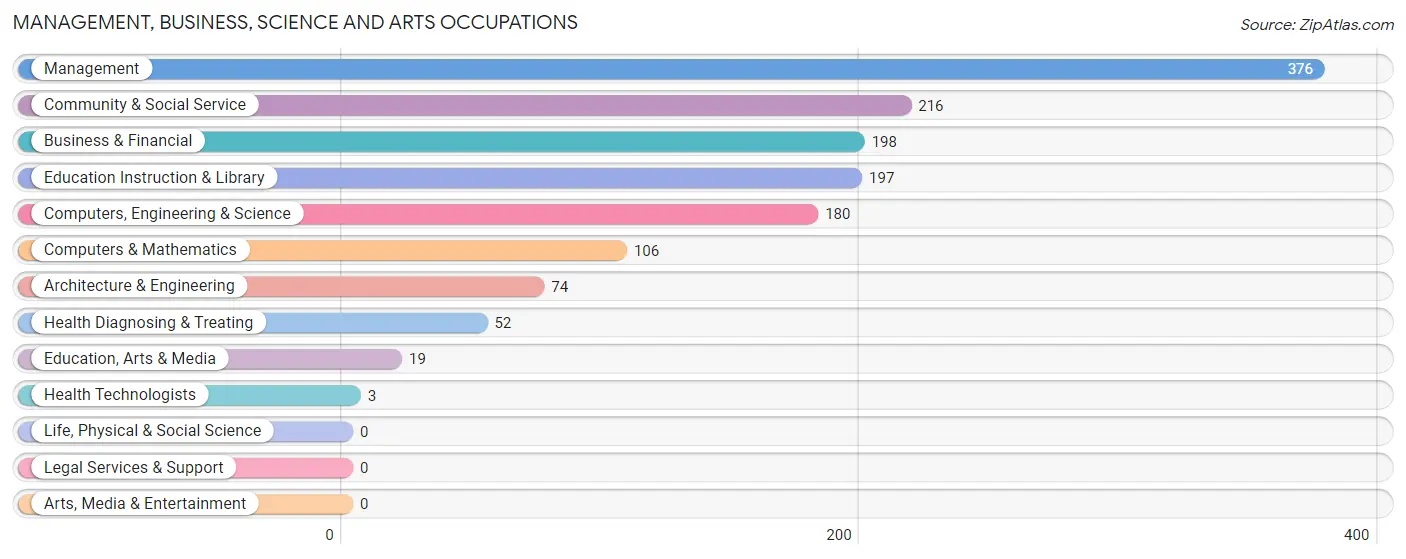
Management, Business, Science and Arts Occupations
The most common Management, Business, Science and Arts occupations in Seminole are Management (376 | 11.9%), Community & Social Service (216 | 6.8%), Business & Financial (198 | 6.3%), Education Instruction & Library (197 | 6.2%), and Computers, Engineering & Science (180 | 5.7%).
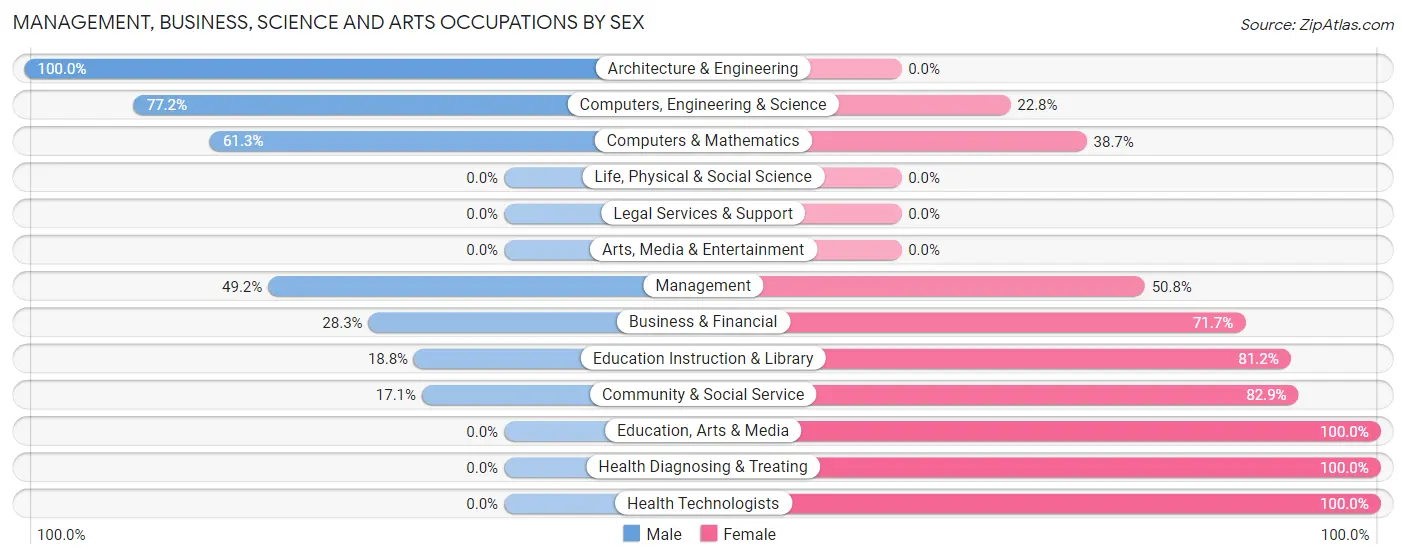
Management, Business, Science and Arts Occupations by Sex
Within the Management, Business, Science and Arts occupations in Seminole, the most male-oriented occupations are Architecture & Engineering (100.0%), Computers, Engineering & Science (77.2%), and Computers & Mathematics (61.3%), while the most female-oriented occupations are Education, Arts & Media (100.0%), Health Diagnosing & Treating (100.0%), and Health Technologists (100.0%).
| Occupation | Male | Female |
| Management | 185 (49.2%) | 191 (50.8%) |
| Business & Financial | 56 (28.3%) | 142 (71.7%) |
| Computers, Engineering & Science | 139 (77.2%) | 41 (22.8%) |
| Computers & Mathematics | 65 (61.3%) | 41 (38.7%) |
| Architecture & Engineering | 74 (100.0%) | 0 (0.0%) |
| Life, Physical & Social Science | 0 (0.0%) | 0 (0.0%) |
| Community & Social Service | 37 (17.1%) | 179 (82.9%) |
| Education, Arts & Media | 0 (0.0%) | 19 (100.0%) |
| Legal Services & Support | 0 (0.0%) | 0 (0.0%) |
| Education Instruction & Library | 37 (18.8%) | 160 (81.2%) |
| Arts, Media & Entertainment | 0 (0.0%) | 0 (0.0%) |
| Health Diagnosing & Treating | 0 (0.0%) | 52 (100.0%) |
| Health Technologists | 0 (0.0%) | 3 (100.0%) |
| Total (Category) | 417 (40.8%) | 605 (59.2%) |
| Total (Overall) | 2,004 (63.3%) | 1,160 (36.7%) |
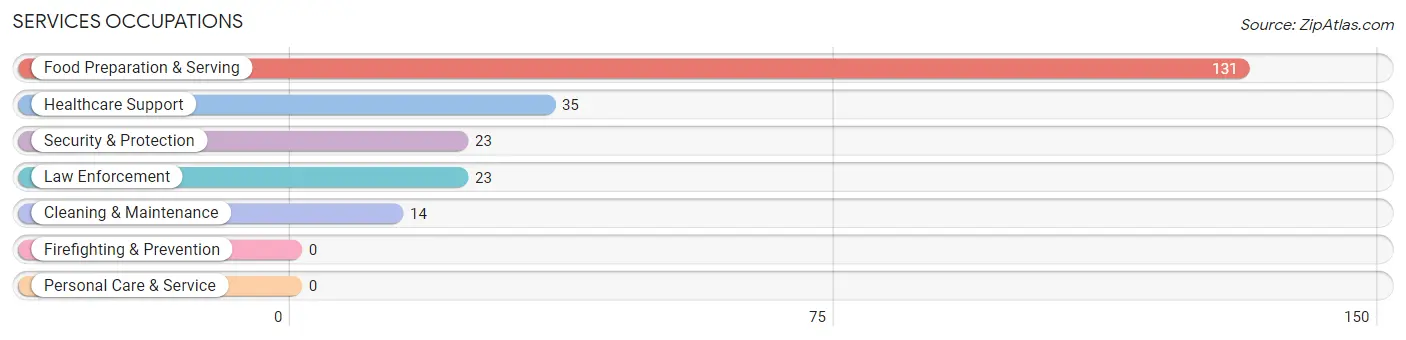
Services Occupations
The most common Services occupations in Seminole are Food Preparation & Serving (131 | 4.1%), Healthcare Support (35 | 1.1%), Security & Protection (23 | 0.7%), Law Enforcement (23 | 0.7%), and Cleaning & Maintenance (14 | 0.4%).
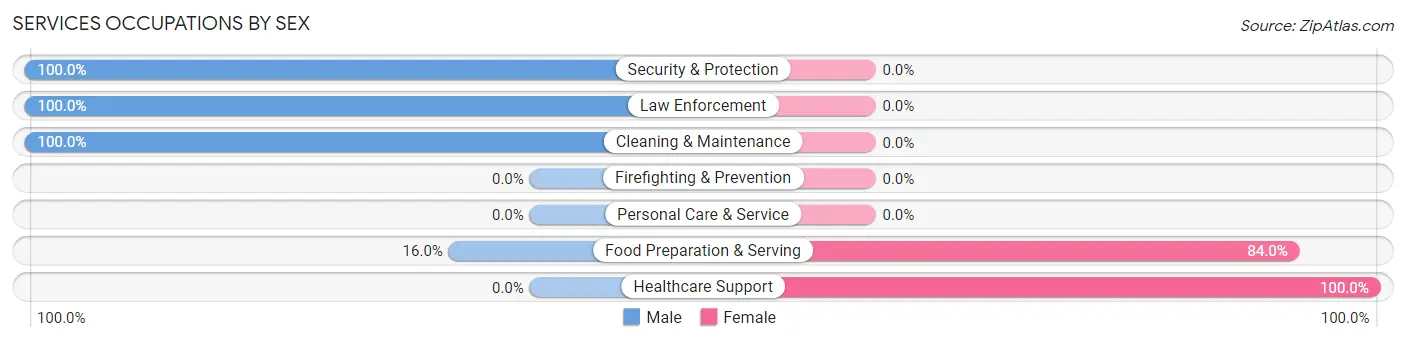
Services Occupations by Sex
Within the Services occupations in Seminole, the most male-oriented occupations are Security & Protection (100.0%), Law Enforcement (100.0%), and Cleaning & Maintenance (100.0%), while the most female-oriented occupations are Healthcare Support (100.0%), and Food Preparation & Serving (84.0%).
| Occupation | Male | Female |
| Healthcare Support | 0 (0.0%) | 35 (100.0%) |
| Security & Protection | 23 (100.0%) | 0 (0.0%) |
| Firefighting & Prevention | 0 (0.0%) | 0 (0.0%) |
| Law Enforcement | 23 (100.0%) | 0 (0.0%) |
| Food Preparation & Serving | 21 (16.0%) | 110 (84.0%) |
| Cleaning & Maintenance | 14 (100.0%) | 0 (0.0%) |
| Personal Care & Service | 0 (0.0%) | 0 (0.0%) |
| Total (Category) | 58 (28.6%) | 145 (71.4%) |
| Total (Overall) | 2,004 (63.3%) | 1,160 (36.7%) |
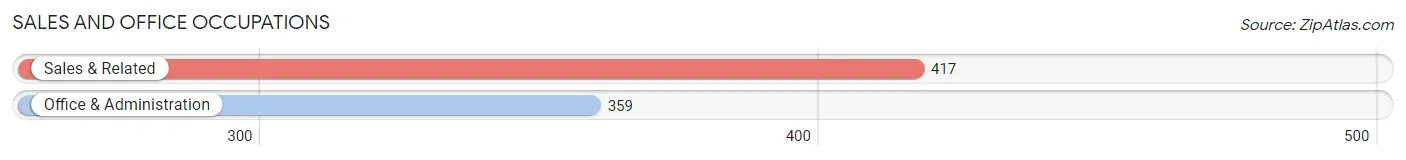
Sales and Office Occupations
The most common Sales and Office occupations in Seminole are Sales & Related (417 | 13.2%), and Office & Administration (359 | 11.4%).
Sales and Office Occupations by Sex
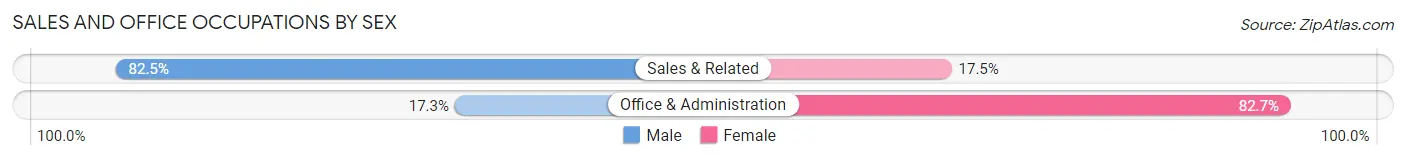
| Occupation | Male | Female |
| Sales & Related | 344 (82.5%) | 73 (17.5%) |
| Office & Administration | 62 (17.3%) | 297 (82.7%) |
| Total (Category) | 406 (52.3%) | 370 (47.7%) |
| Total (Overall) | 2,004 (63.3%) | 1,160 (36.7%) |
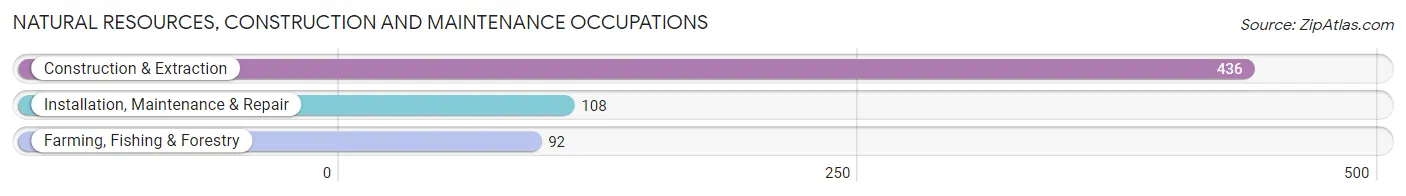
Natural Resources, Construction and Maintenance Occupations
The most common Natural Resources, Construction and Maintenance occupations in Seminole are Construction & Extraction (436 | 13.8%), Installation, Maintenance & Repair (108 | 3.4%), and Farming, Fishing & Forestry (92 | 2.9%).
Natural Resources, Construction and Maintenance Occupations by Sex
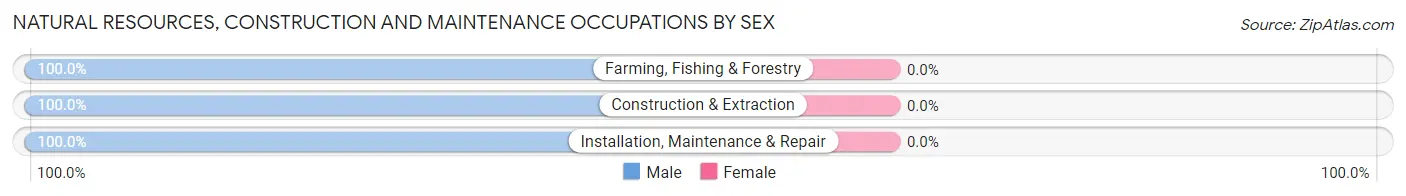
| Occupation | Male | Female |
| Farming, Fishing & Forestry | 92 (100.0%) | 0 (0.0%) |
| Construction & Extraction | 436 (100.0%) | 0 (0.0%) |
| Installation, Maintenance & Repair | 108 (100.0%) | 0 (0.0%) |
| Total (Category) | 636 (100.0%) | 0 (0.0%) |
| Total (Overall) | 2,004 (63.3%) | 1,160 (36.7%) |
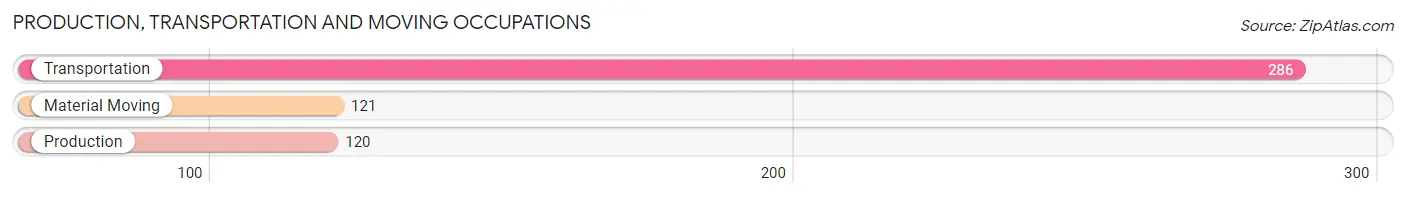
Production, Transportation and Moving Occupations
The most common Production, Transportation and Moving occupations in Seminole are Transportation (286 | 9.0%), Material Moving (121 | 3.8%), and Production (120 | 3.8%).
Production, Transportation and Moving Occupations by Sex
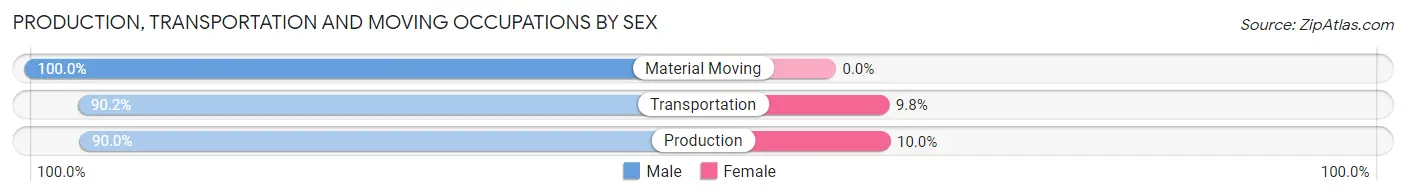
| Occupation | Male | Female |
| Production | 108 (90.0%) | 12 (10.0%) |
| Transportation | 258 (90.2%) | 28 (9.8%) |
| Material Moving | 121 (100.0%) | 0 (0.0%) |
| Total (Category) | 487 (92.4%) | 40 (7.6%) |
| Total (Overall) | 2,004 (63.3%) | 1,160 (36.7%) |
Employment Industries by Sex in Seminole
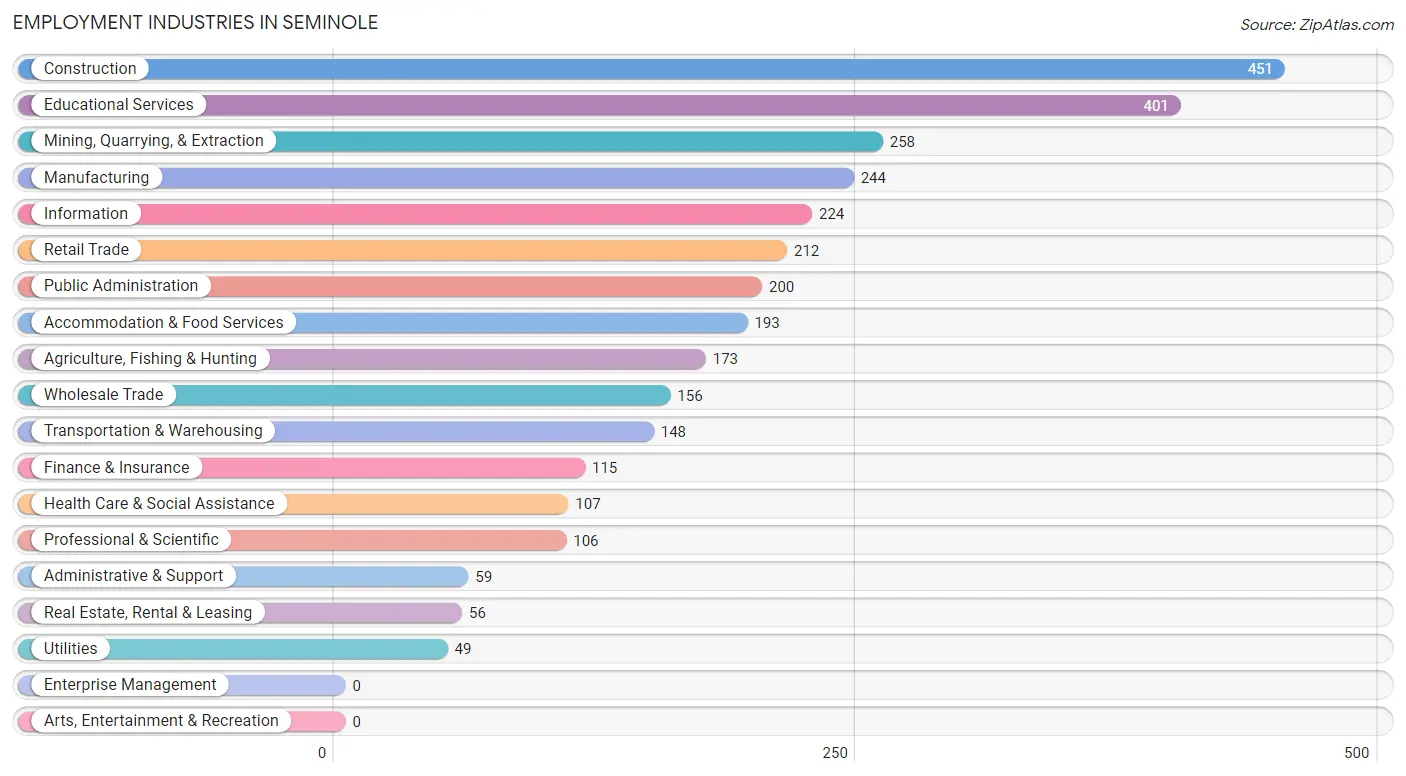
Employment Industries in Seminole
The major employment industries in Seminole include Construction (451 | 14.2%), Educational Services (401 | 12.7%), Mining, Quarrying, & Extraction (258 | 8.2%), Manufacturing (244 | 7.7%), and Information (224 | 7.1%).
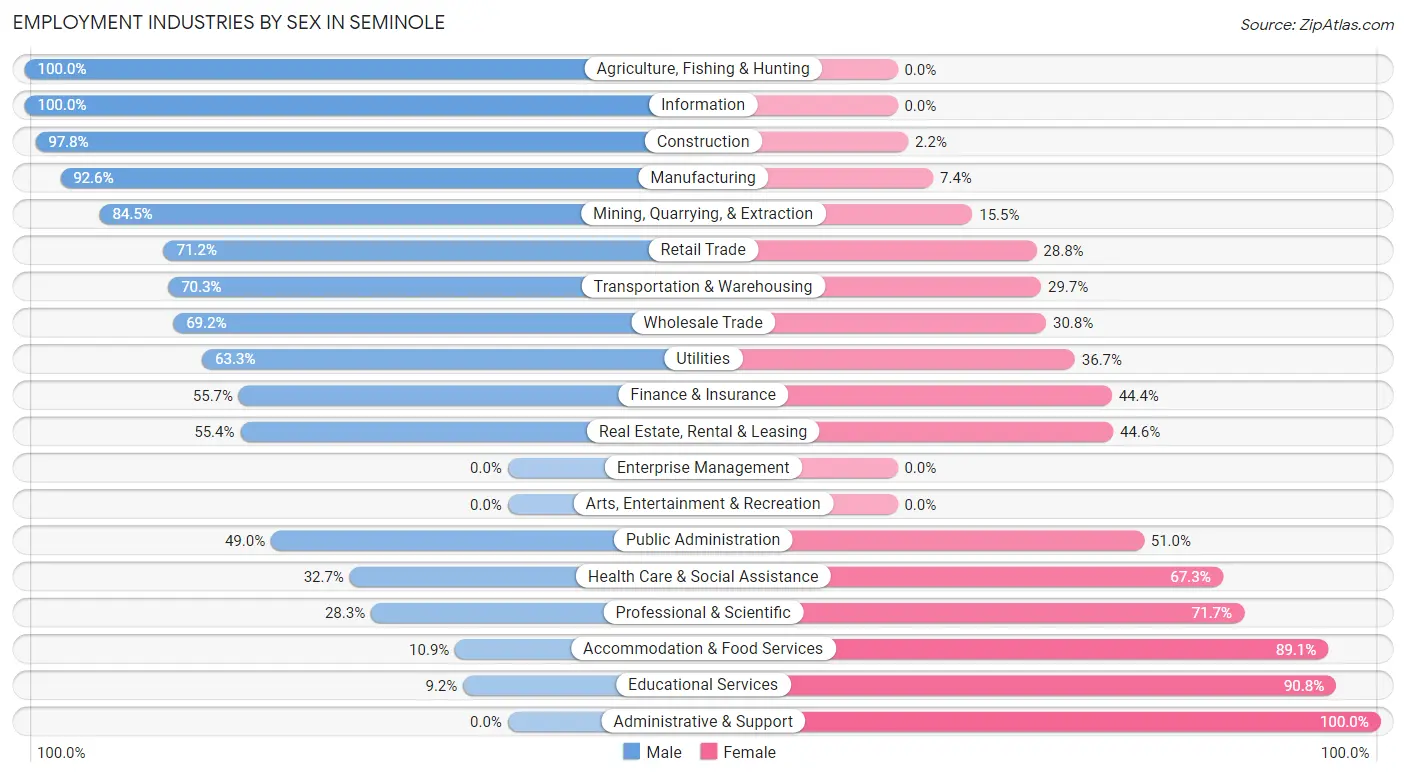
Employment Industries by Sex in Seminole
The Seminole industries that see more men than women are Agriculture, Fishing & Hunting (100.0%), Information (100.0%), and Construction (97.8%), whereas the industries that tend to have a higher number of women are Administrative & Support (100.0%), Educational Services (90.8%), and Accommodation & Food Services (89.1%).
| Industry | Male | Female |
| Agriculture, Fishing & Hunting | 173 (100.0%) | 0 (0.0%) |
| Mining, Quarrying, & Extraction | 218 (84.5%) | 40 (15.5%) |
| Construction | 441 (97.8%) | 10 (2.2%) |
| Manufacturing | 226 (92.6%) | 18 (7.4%) |
| Wholesale Trade | 108 (69.2%) | 48 (30.8%) |
| Retail Trade | 151 (71.2%) | 61 (28.8%) |
| Transportation & Warehousing | 104 (70.3%) | 44 (29.7%) |
| Utilities | 31 (63.3%) | 18 (36.7%) |
| Information | 224 (100.0%) | 0 (0.0%) |
| Finance & Insurance | 64 (55.6%) | 51 (44.4%) |
| Real Estate, Rental & Leasing | 31 (55.4%) | 25 (44.6%) |
| Professional & Scientific | 30 (28.3%) | 76 (71.7%) |
| Enterprise Management | 0 (0.0%) | 0 (0.0%) |
| Administrative & Support | 0 (0.0%) | 59 (100.0%) |
| Educational Services | 37 (9.2%) | 364 (90.8%) |
| Health Care & Social Assistance | 35 (32.7%) | 72 (67.3%) |
| Arts, Entertainment & Recreation | 0 (0.0%) | 0 (0.0%) |
| Accommodation & Food Services | 21 (10.9%) | 172 (89.1%) |
| Public Administration | 98 (49.0%) | 102 (51.0%) |
| Total | 2,004 (63.3%) | 1,160 (36.7%) |
Education in Seminole
School Enrollment in Seminole
The most common levels of schooling among the 1,324 students in Seminole are middle school (453 | 34.2%), elementary school (386 | 29.1%), and high school (379 | 28.6%).
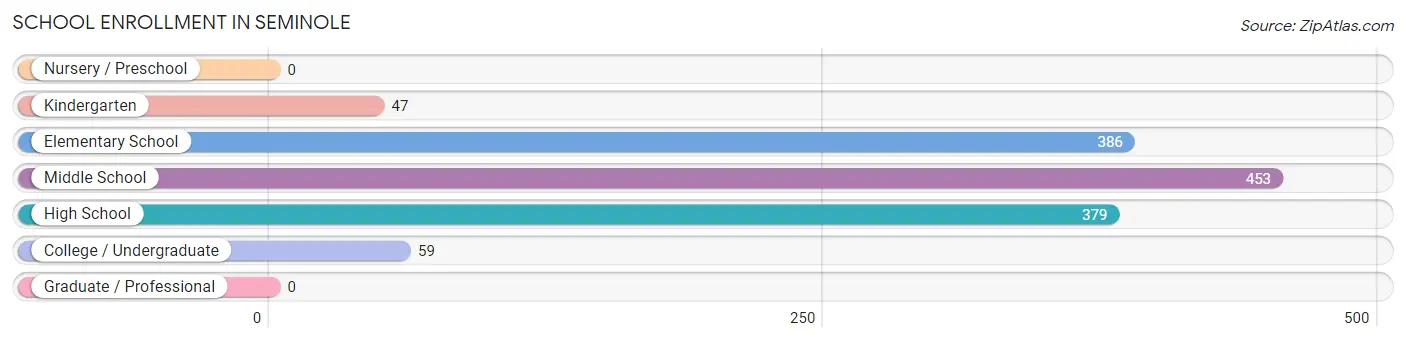
| School Level | # Students | % Students |
| Nursery / Preschool | 0 | 0.0% |
| Kindergarten | 47 | 3.5% |
| Elementary School | 386 | 29.1% |
| Middle School | 453 | 34.2% |
| High School | 379 | 28.6% |
| College / Undergraduate | 59 | 4.5% |
| Graduate / Professional | 0 | 0.0% |
| Total | 1,324 | 100.0% |
School Enrollment by Age by Funding Source in Seminole
Out of a total of 1,324 students who are enrolled in schools in Seminole, 113 (8.5%) attend a private institution, while the remaining 1,211 (91.5%) are enrolled in public schools. The age group of 35 years and over has the highest likelihood of being enrolled in private schools, with 5 (100.0% in the age bracket) enrolled. Conversely, the age group of 15 to 17 year olds has the lowest likelihood of being enrolled in a private school, with 291 (100.0% in the age bracket) attending a public institution.
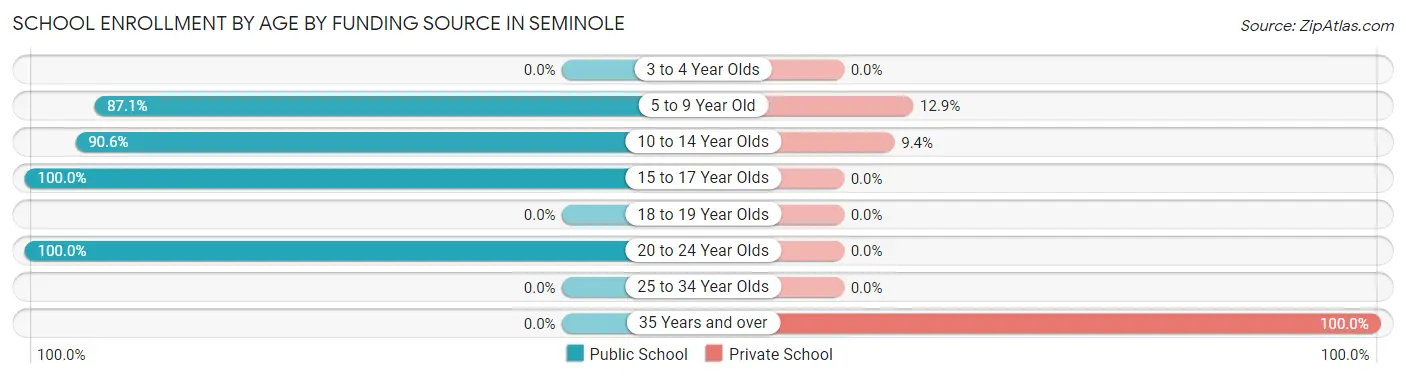
| Age Bracket | Public School | Private School |
| 3 to 4 Year Olds | 0 (0.0%) | 0 (0.0%) |
| 5 to 9 Year Old | 377 (87.1%) | 56 (12.9%) |
| 10 to 14 Year Olds | 490 (90.6%) | 51 (9.4%) |
| 15 to 17 Year Olds | 291 (100.0%) | 0 (0.0%) |
| 18 to 19 Year Olds | 0 (0.0%) | 0 (0.0%) |
| 20 to 24 Year Olds | 54 (100.0%) | 0 (0.0%) |
| 25 to 34 Year Olds | 0 (0.0%) | 0 (0.0%) |
| 35 Years and over | 0 (0.0%) | 5 (100.0%) |
| Total | 1,211 (91.5%) | 113 (8.5%) |
Educational Attainment by Field of Study in Seminole
Education (284 | 31.1%), business (198 | 21.7%), social sciences (124 | 13.6%), arts & humanities (101 | 11.1%), and engineering (52 | 5.7%) are the most common fields of study among 913 individuals in Seminole who have obtained a bachelor's degree or higher.
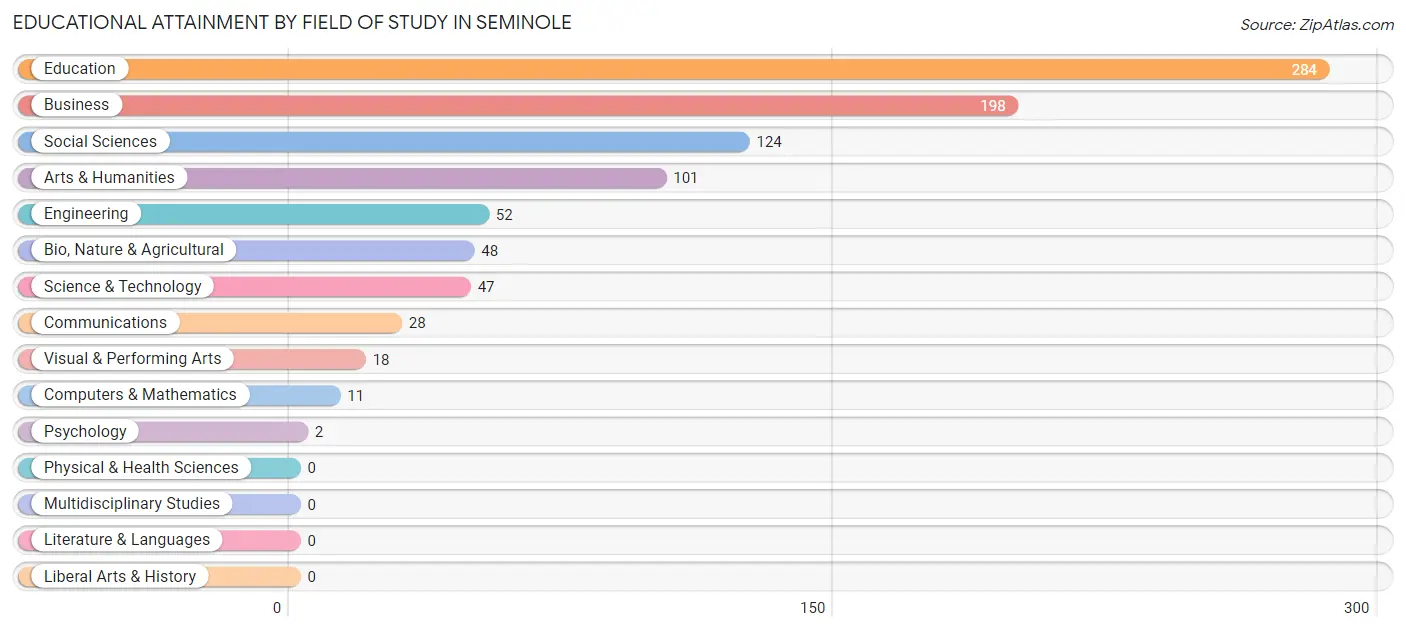
| Field of Study | # Graduates | % Graduates |
| Computers & Mathematics | 11 | 1.2% |
| Bio, Nature & Agricultural | 48 | 5.3% |
| Physical & Health Sciences | 0 | 0.0% |
| Psychology | 2 | 0.2% |
| Social Sciences | 124 | 13.6% |
| Engineering | 52 | 5.7% |
| Multidisciplinary Studies | 0 | 0.0% |
| Science & Technology | 47 | 5.1% |
| Business | 198 | 21.7% |
| Education | 284 | 31.1% |
| Literature & Languages | 0 | 0.0% |
| Liberal Arts & History | 0 | 0.0% |
| Visual & Performing Arts | 18 | 2.0% |
| Communications | 28 | 3.1% |
| Arts & Humanities | 101 | 11.1% |
| Total | 913 | 100.0% |
Transportation & Commute in Seminole
Vehicle Availability by Sex in Seminole
The most prevalent vehicle ownership categories in Seminole are males with 2 vehicles (874, accounting for 46.6%) and females with 2 vehicles (607, making up 75.3%).
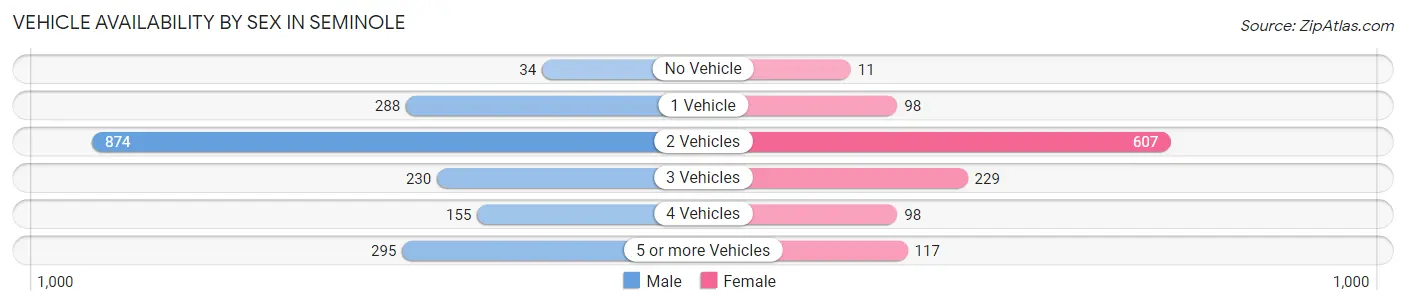
| Vehicles Available | Male | Female |
| No Vehicle | 34 (1.8%) | 11 (0.9%) |
| 1 Vehicle | 288 (15.3%) | 98 (8.5%) |
| 2 Vehicles | 874 (46.6%) | 607 (52.3%) |
| 3 Vehicles | 230 (12.3%) | 229 (19.7%) |
| 4 Vehicles | 155 (8.3%) | 98 (8.5%) |
| 5 or more Vehicles | 295 (15.7%) | 117 (10.1%) |
| Total | 1,876 (100.0%) | 1,160 (100.0%) |
Commute Time in Seminole
The most frequently occuring commute durations in Seminole are 10 to 14 minutes (769 commuters, 25.6%), less than 5 minutes (760 commuters, 25.3%), and 5 to 9 minutes (706 commuters, 23.5%).
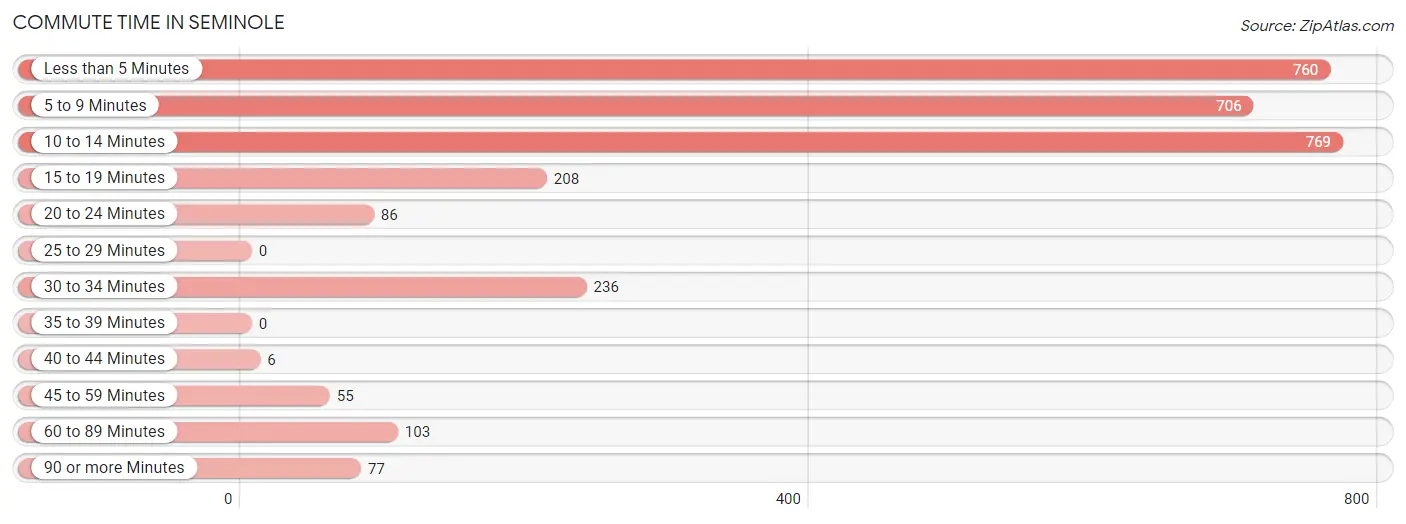
| Commute Time | # Commuters | % Commuters |
| Less than 5 Minutes | 760 | 25.3% |
| 5 to 9 Minutes | 706 | 23.5% |
| 10 to 14 Minutes | 769 | 25.6% |
| 15 to 19 Minutes | 208 | 6.9% |
| 20 to 24 Minutes | 86 | 2.9% |
| 25 to 29 Minutes | 0 | 0.0% |
| 30 to 34 Minutes | 236 | 7.9% |
| 35 to 39 Minutes | 0 | 0.0% |
| 40 to 44 Minutes | 6 | 0.2% |
| 45 to 59 Minutes | 55 | 1.8% |
| 60 to 89 Minutes | 103 | 3.4% |
| 90 or more Minutes | 77 | 2.6% |
Commute Time by Sex in Seminole
The most common commute times in Seminole are 5 to 9 minutes (644 commuters, 34.9%) for males and less than 5 minutes (531 commuters, 45.8%) for females.
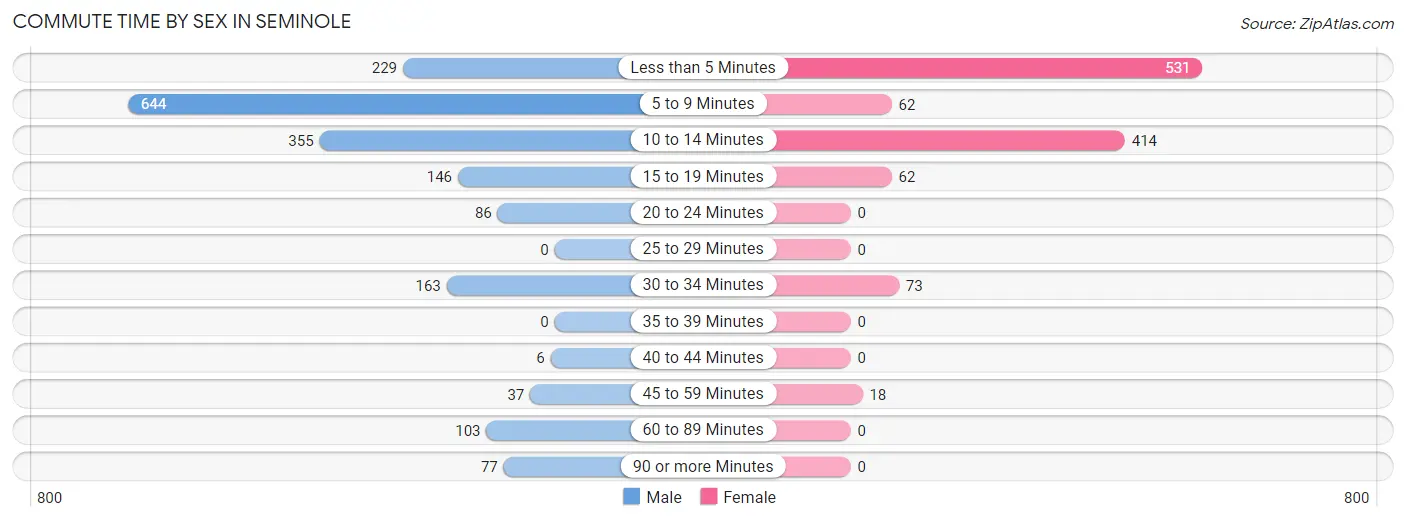
| Commute Time | Male | Female |
| Less than 5 Minutes | 229 (12.4%) | 531 (45.8%) |
| 5 to 9 Minutes | 644 (34.9%) | 62 (5.3%) |
| 10 to 14 Minutes | 355 (19.2%) | 414 (35.7%) |
| 15 to 19 Minutes | 146 (7.9%) | 62 (5.3%) |
| 20 to 24 Minutes | 86 (4.7%) | 0 (0.0%) |
| 25 to 29 Minutes | 0 (0.0%) | 0 (0.0%) |
| 30 to 34 Minutes | 163 (8.8%) | 73 (6.3%) |
| 35 to 39 Minutes | 0 (0.0%) | 0 (0.0%) |
| 40 to 44 Minutes | 6 (0.3%) | 0 (0.0%) |
| 45 to 59 Minutes | 37 (2.0%) | 18 (1.5%) |
| 60 to 89 Minutes | 103 (5.6%) | 0 (0.0%) |
| 90 or more Minutes | 77 (4.2%) | 0 (0.0%) |
Time of Departure to Work by Sex in Seminole
The most frequent times of departure to work in Seminole are 8:00 AM to 8:29 AM (424, 23.0%) for males and 7:30 AM to 7:59 AM (373, 32.2%) for females.
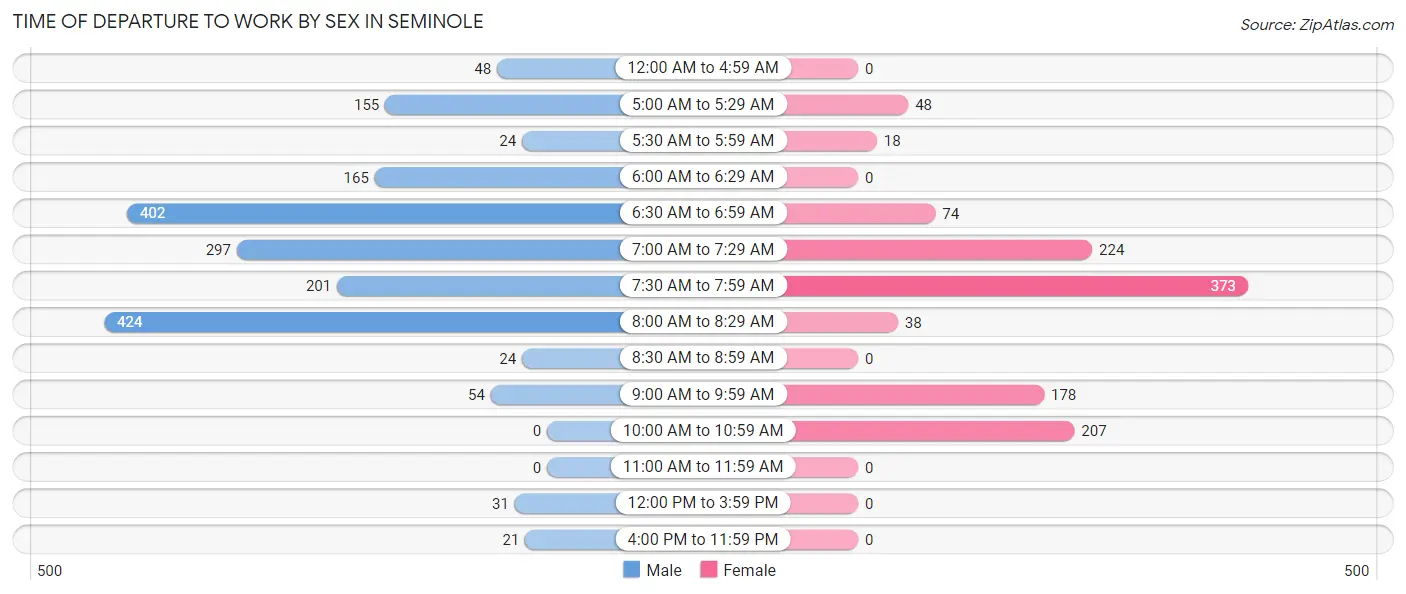
| Time of Departure | Male | Female |
| 12:00 AM to 4:59 AM | 48 (2.6%) | 0 (0.0%) |
| 5:00 AM to 5:29 AM | 155 (8.4%) | 48 (4.1%) |
| 5:30 AM to 5:59 AM | 24 (1.3%) | 18 (1.5%) |
| 6:00 AM to 6:29 AM | 165 (8.9%) | 0 (0.0%) |
| 6:30 AM to 6:59 AM | 402 (21.8%) | 74 (6.4%) |
| 7:00 AM to 7:29 AM | 297 (16.1%) | 224 (19.3%) |
| 7:30 AM to 7:59 AM | 201 (10.9%) | 373 (32.2%) |
| 8:00 AM to 8:29 AM | 424 (23.0%) | 38 (3.3%) |
| 8:30 AM to 8:59 AM | 24 (1.3%) | 0 (0.0%) |
| 9:00 AM to 9:59 AM | 54 (2.9%) | 178 (15.3%) |
| 10:00 AM to 10:59 AM | 0 (0.0%) | 207 (17.8%) |
| 11:00 AM to 11:59 AM | 0 (0.0%) | 0 (0.0%) |
| 12:00 PM to 3:59 PM | 31 (1.7%) | 0 (0.0%) |
| 4:00 PM to 11:59 PM | 21 (1.1%) | 0 (0.0%) |
| Total | 1,846 (100.0%) | 1,160 (100.0%) |
Housing Occupancy in Seminole
Occupancy by Ownership in Seminole
Of the total 2,649 dwellings in Seminole, owner-occupied units account for 1,897 (71.6%), while renter-occupied units make up 752 (28.4%).
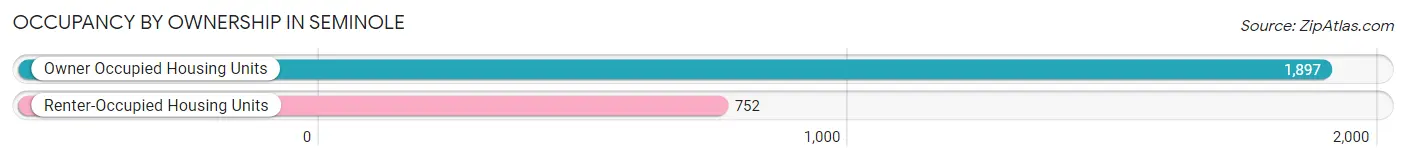
| Occupancy | # Housing Units | % Housing Units |
| Owner Occupied Housing Units | 1,897 | 71.6% |
| Renter-Occupied Housing Units | 752 | 28.4% |
| Total Occupied Housing Units | 2,649 | 100.0% |
Occupancy by Household Size in Seminole
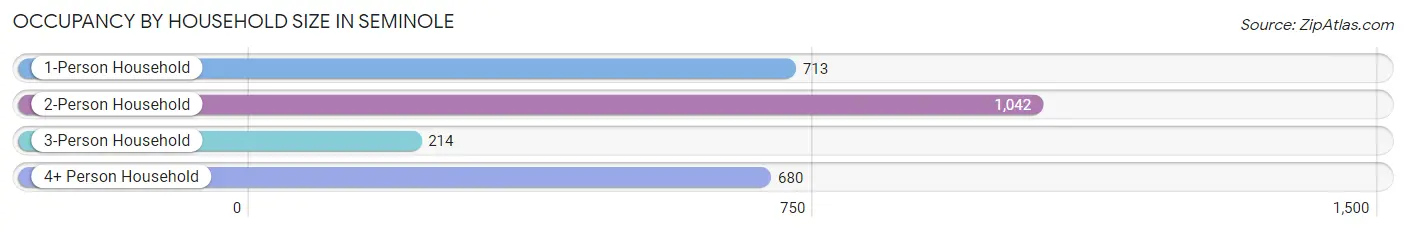
| Household Size | # Housing Units | % Housing Units |
| 1-Person Household | 713 | 26.9% |
| 2-Person Household | 1,042 | 39.3% |
| 3-Person Household | 214 | 8.1% |
| 4+ Person Household | 680 | 25.7% |
| Total Housing Units | 2,649 | 100.0% |
Occupancy by Ownership by Household Size in Seminole
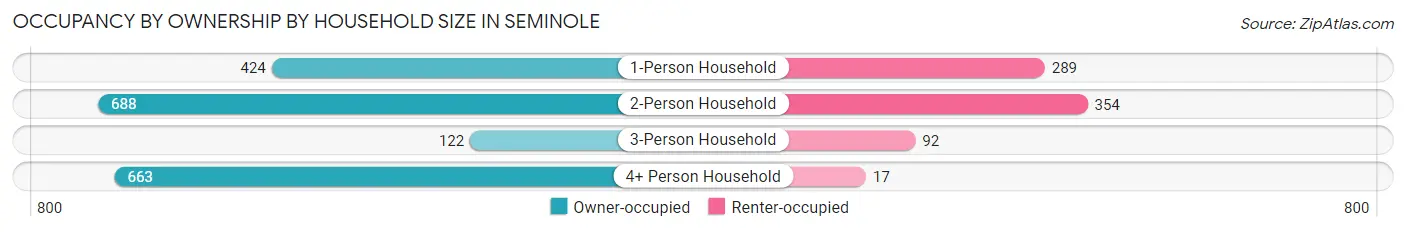
| Household Size | Owner-occupied | Renter-occupied |
| 1-Person Household | 424 (59.5%) | 289 (40.5%) |
| 2-Person Household | 688 (66.0%) | 354 (34.0%) |
| 3-Person Household | 122 (57.0%) | 92 (43.0%) |
| 4+ Person Household | 663 (97.5%) | 17 (2.5%) |
| Total Housing Units | 1,897 (71.6%) | 752 (28.4%) |
Occupancy by Educational Attainment in Seminole
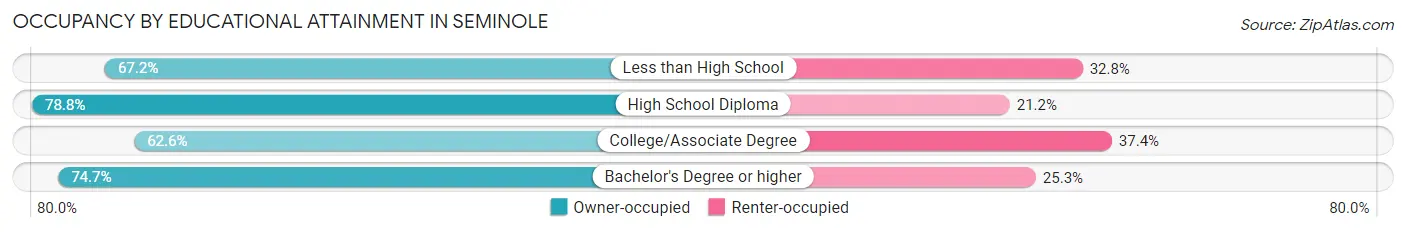
| Household Size | Owner-occupied | Renter-occupied |
| Less than High School | 466 (67.2%) | 227 (32.8%) |
| High School Diploma | 703 (78.8%) | 189 (21.2%) |
| College/Associate Degree | 345 (62.6%) | 206 (37.4%) |
| Bachelor's Degree or higher | 383 (74.7%) | 130 (25.3%) |
Occupancy by Age of Householder in Seminole
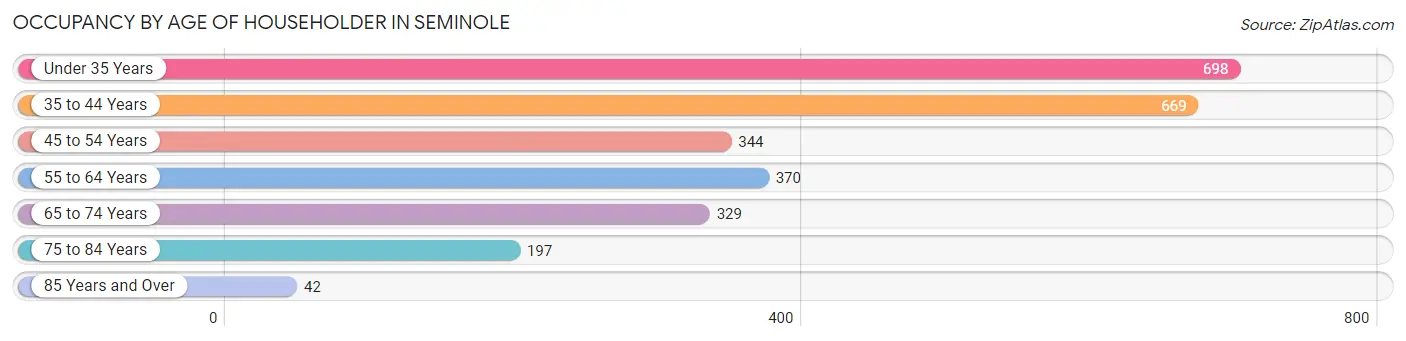
| Age Bracket | # Households | % Households |
| Under 35 Years | 698 | 26.4% |
| 35 to 44 Years | 669 | 25.3% |
| 45 to 54 Years | 344 | 13.0% |
| 55 to 64 Years | 370 | 14.0% |
| 65 to 74 Years | 329 | 12.4% |
| 75 to 84 Years | 197 | 7.4% |
| 85 Years and Over | 42 | 1.6% |
| Total | 2,649 | 100.0% |
Housing Finances in Seminole
Median Income by Occupancy in Seminole
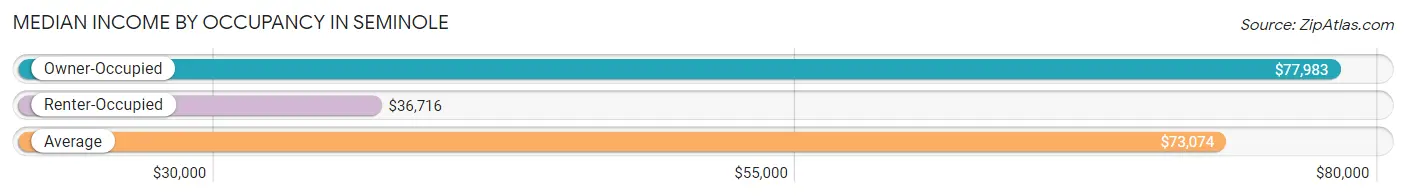
| Occupancy Type | # Households | Median Income |
| Owner-Occupied | 1,897 (71.6%) | $77,983 |
| Renter-Occupied | 752 (28.4%) | $36,716 |
| Average | 2,649 (100.0%) | $73,074 |
Occupancy by Householder Income Bracket in Seminole
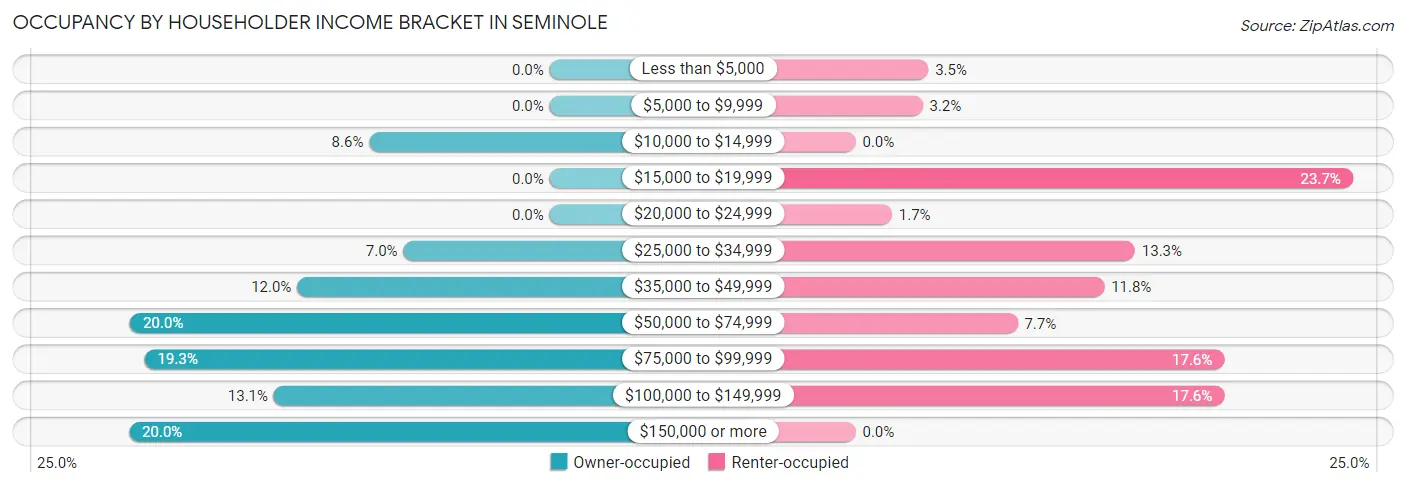
| Income Bracket | Owner-occupied | Renter-occupied |
| Less than $5,000 | 0 (0.0%) | 26 (3.5%) |
| $5,000 to $9,999 | 0 (0.0%) | 24 (3.2%) |
| $10,000 to $14,999 | 163 (8.6%) | 0 (0.0%) |
| $15,000 to $19,999 | 0 (0.0%) | 178 (23.7%) |
| $20,000 to $24,999 | 0 (0.0%) | 13 (1.7%) |
| $25,000 to $34,999 | 132 (7.0%) | 100 (13.3%) |
| $35,000 to $49,999 | 228 (12.0%) | 89 (11.8%) |
| $50,000 to $74,999 | 379 (20.0%) | 58 (7.7%) |
| $75,000 to $99,999 | 366 (19.3%) | 132 (17.5%) |
| $100,000 to $149,999 | 249 (13.1%) | 132 (17.5%) |
| $150,000 or more | 380 (20.0%) | 0 (0.0%) |
| Total | 1,897 (100.0%) | 752 (100.0%) |
Monthly Housing Cost Tiers in Seminole
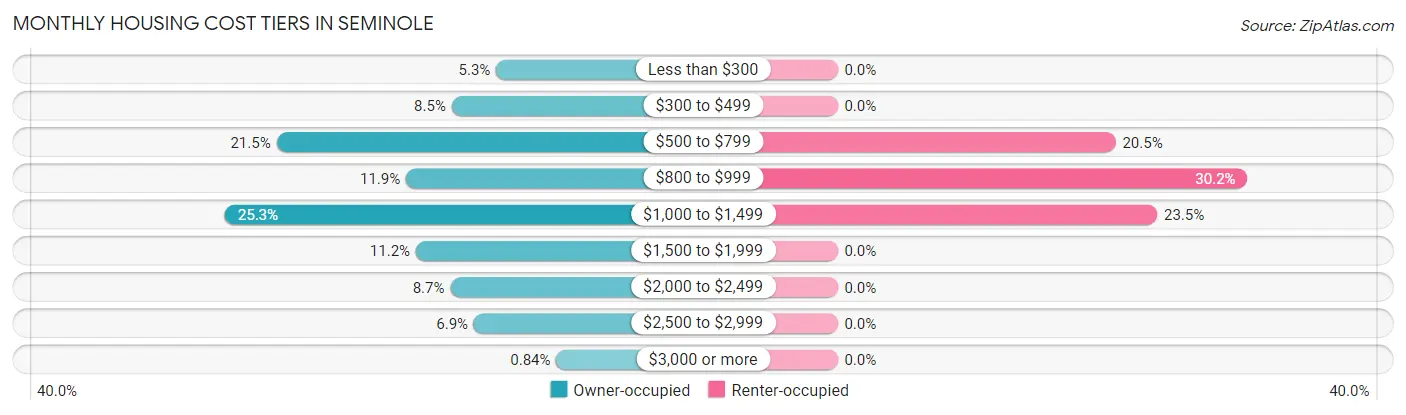
| Monthly Cost | Owner-occupied | Renter-occupied |
| Less than $300 | 100 (5.3%) | 0 (0.0%) |
| $300 to $499 | 162 (8.5%) | 0 (0.0%) |
| $500 to $799 | 407 (21.4%) | 154 (20.5%) |
| $800 to $999 | 226 (11.9%) | 227 (30.2%) |
| $1,000 to $1,499 | 479 (25.3%) | 177 (23.5%) |
| $1,500 to $1,999 | 212 (11.2%) | 0 (0.0%) |
| $2,000 to $2,499 | 164 (8.6%) | 0 (0.0%) |
| $2,500 to $2,999 | 131 (6.9%) | 0 (0.0%) |
| $3,000 or more | 16 (0.8%) | 0 (0.0%) |
| Total | 1,897 (100.0%) | 752 (100.0%) |
Physical Housing Characteristics in Seminole
Housing Structures in Seminole
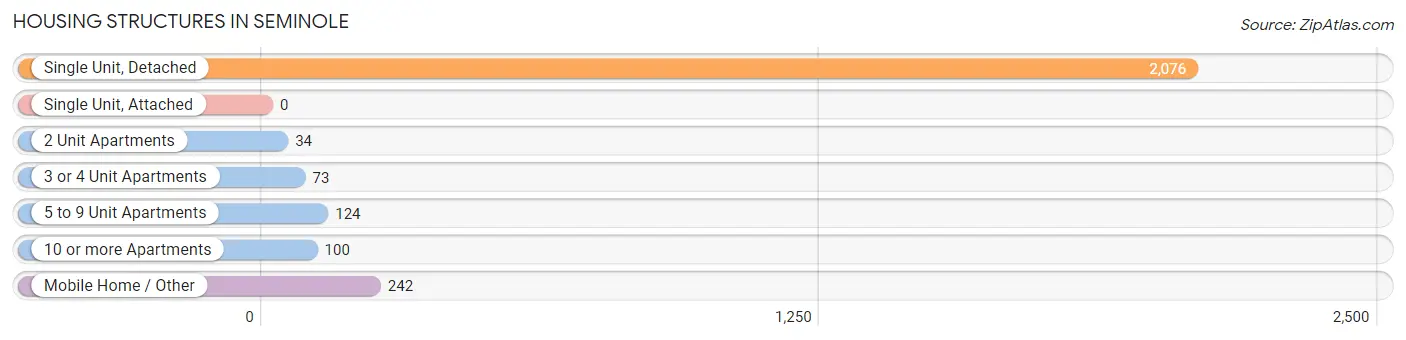
| Structure Type | # Housing Units | % Housing Units |
| Single Unit, Detached | 2,076 | 78.4% |
| Single Unit, Attached | 0 | 0.0% |
| 2 Unit Apartments | 34 | 1.3% |
| 3 or 4 Unit Apartments | 73 | 2.8% |
| 5 to 9 Unit Apartments | 124 | 4.7% |
| 10 or more Apartments | 100 | 3.8% |
| Mobile Home / Other | 242 | 9.1% |
| Total | 2,649 | 100.0% |
Housing Structures by Occupancy in Seminole
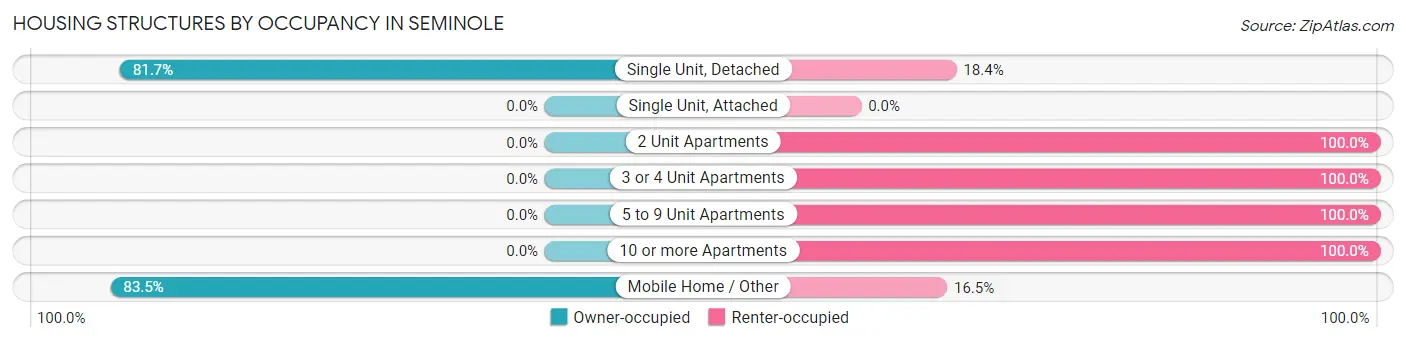
| Structure Type | Owner-occupied | Renter-occupied |
| Single Unit, Detached | 1,695 (81.7%) | 381 (18.3%) |
| Single Unit, Attached | 0 (0.0%) | 0 (0.0%) |
| 2 Unit Apartments | 0 (0.0%) | 34 (100.0%) |
| 3 or 4 Unit Apartments | 0 (0.0%) | 73 (100.0%) |
| 5 to 9 Unit Apartments | 0 (0.0%) | 124 (100.0%) |
| 10 or more Apartments | 0 (0.0%) | 100 (100.0%) |
| Mobile Home / Other | 202 (83.5%) | 40 (16.5%) |
| Total | 1,897 (71.6%) | 752 (28.4%) |
Housing Structures by Number of Rooms in Seminole
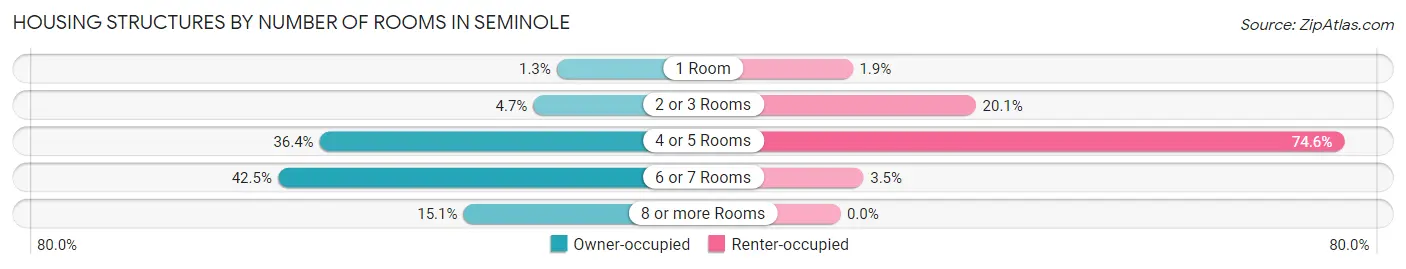
| Number of Rooms | Owner-occupied | Renter-occupied |
| 1 Room | 24 (1.3%) | 14 (1.9%) |
| 2 or 3 Rooms | 90 (4.7%) | 151 (20.1%) |
| 4 or 5 Rooms | 690 (36.4%) | 561 (74.6%) |
| 6 or 7 Rooms | 807 (42.5%) | 26 (3.5%) |
| 8 or more Rooms | 286 (15.1%) | 0 (0.0%) |
| Total | 1,897 (100.0%) | 752 (100.0%) |
Housing Structure by Heating Type in Seminole
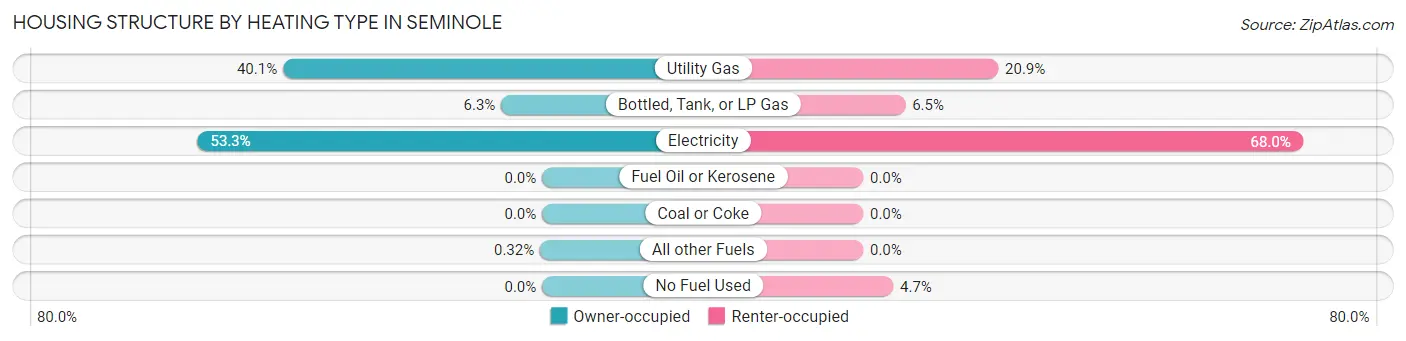
| Heating Type | Owner-occupied | Renter-occupied |
| Utility Gas | 760 (40.1%) | 157 (20.9%) |
| Bottled, Tank, or LP Gas | 120 (6.3%) | 49 (6.5%) |
| Electricity | 1,011 (53.3%) | 511 (67.9%) |
| Fuel Oil or Kerosene | 0 (0.0%) | 0 (0.0%) |
| Coal or Coke | 0 (0.0%) | 0 (0.0%) |
| All other Fuels | 6 (0.3%) | 0 (0.0%) |
| No Fuel Used | 0 (0.0%) | 35 (4.6%) |
| Total | 1,897 (100.0%) | 752 (100.0%) |
Household Vehicle Usage in Seminole
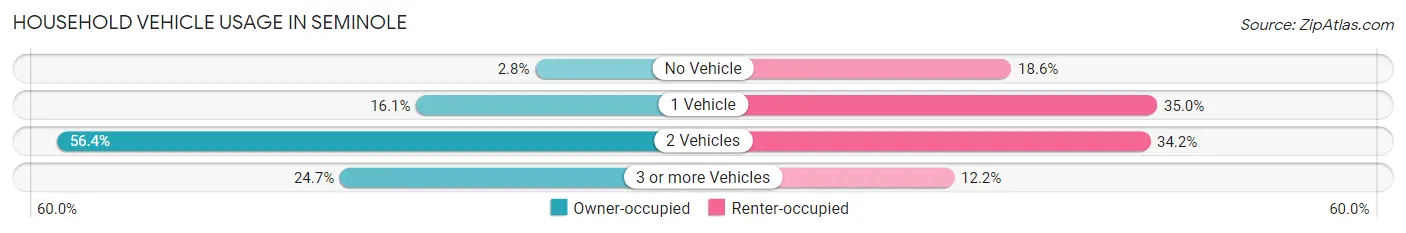
| Vehicles per Household | Owner-occupied | Renter-occupied |
| No Vehicle | 53 (2.8%) | 140 (18.6%) |
| 1 Vehicle | 306 (16.1%) | 263 (35.0%) |
| 2 Vehicles | 1,070 (56.4%) | 257 (34.2%) |
| 3 or more Vehicles | 468 (24.7%) | 92 (12.2%) |
| Total | 1,897 (100.0%) | 752 (100.0%) |
Real Estate & Mortgages in Seminole
Real Estate and Mortgage Overview in Seminole
| Characteristic | Without Mortgage | With Mortgage |
| Housing Units | 862 | 1,035 |
| Median Property Value | $116,600 | $170,500 |
| Median Household Income | $59,116 | $252 |
| Monthly Housing Costs | $694 | $16 |
| Real Estate Taxes | $2,503 | $63 |
Property Value by Mortgage Status in Seminole
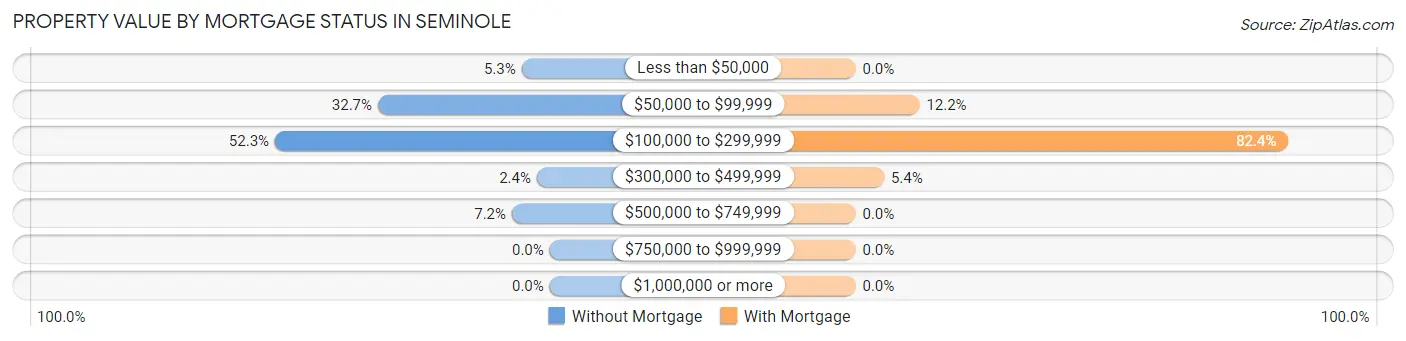
| Property Value | Without Mortgage | With Mortgage |
| Less than $50,000 | 46 (5.3%) | 0 (0.0%) |
| $50,000 to $99,999 | 282 (32.7%) | 126 (12.2%) |
| $100,000 to $299,999 | 451 (52.3%) | 853 (82.4%) |
| $300,000 to $499,999 | 21 (2.4%) | 56 (5.4%) |
| $500,000 to $749,999 | 62 (7.2%) | 0 (0.0%) |
| $750,000 to $999,999 | 0 (0.0%) | 0 (0.0%) |
| $1,000,000 or more | 0 (0.0%) | 0 (0.0%) |
| Total | 862 (100.0%) | 1,035 (100.0%) |
Household Income by Mortgage Status in Seminole
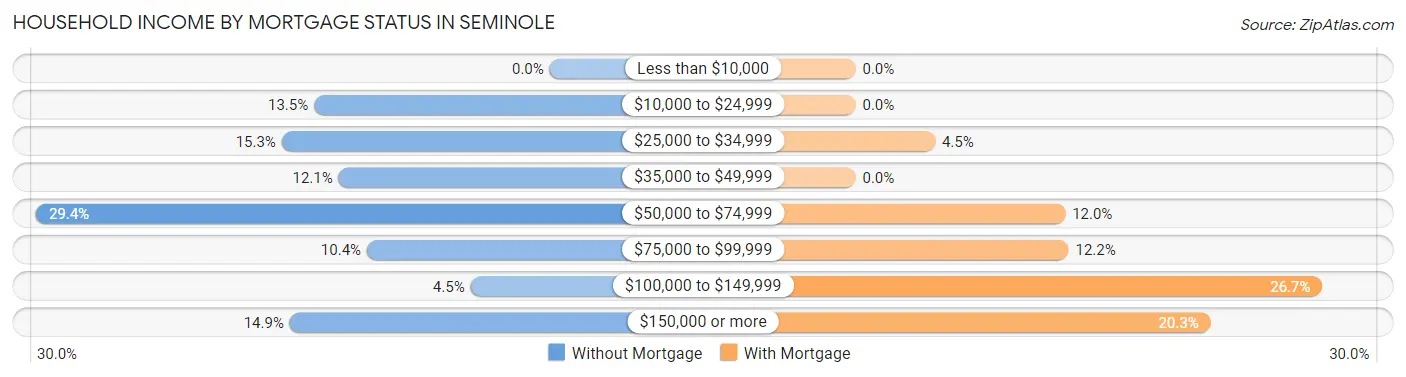
| Household Income | Without Mortgage | With Mortgage |
| Less than $10,000 | 0 (0.0%) | 0 (0.0%) |
| $10,000 to $24,999 | 116 (13.5%) | 0 (0.0%) |
| $25,000 to $34,999 | 132 (15.3%) | 47 (4.5%) |
| $35,000 to $49,999 | 104 (12.1%) | 0 (0.0%) |
| $50,000 to $74,999 | 253 (29.3%) | 124 (12.0%) |
| $75,000 to $99,999 | 90 (10.4%) | 126 (12.2%) |
| $100,000 to $149,999 | 39 (4.5%) | 276 (26.7%) |
| $150,000 or more | 128 (14.8%) | 210 (20.3%) |
| Total | 862 (100.0%) | 1,035 (100.0%) |
Property Value to Household Income Ratio in Seminole
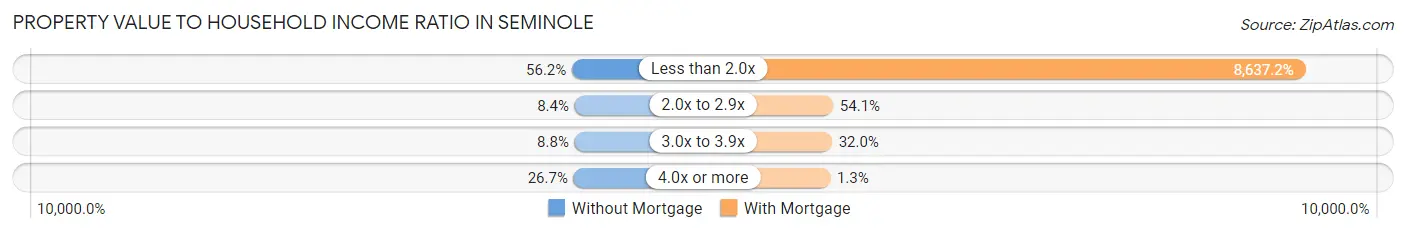
| Value-to-Income Ratio | Without Mortgage | With Mortgage |
| Less than 2.0x | 484 (56.1%) | 89,395 (8,637.2%) |
| 2.0x to 2.9x | 72 (8.4%) | 560 (54.1%) |
| 3.0x to 3.9x | 76 (8.8%) | 331 (32.0%) |
| 4.0x or more | 230 (26.7%) | 13 (1.3%) |
| Total | 862 (100.0%) | 1,035 (100.0%) |
Real Estate Taxes by Mortgage Status in Seminole
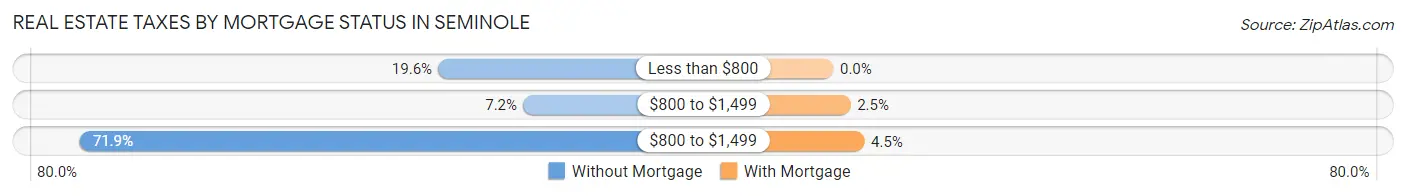
| Property Taxes | Without Mortgage | With Mortgage |
| Less than $800 | 169 (19.6%) | 0 (0.0%) |
| $800 to $1,499 | 62 (7.2%) | 26 (2.5%) |
| $800 to $1,499 | 620 (71.9%) | 47 (4.5%) |
| Total | 862 (100.0%) | 1,035 (100.0%) |
Health & Disability in Seminole
Health Insurance Coverage by Age in Seminole
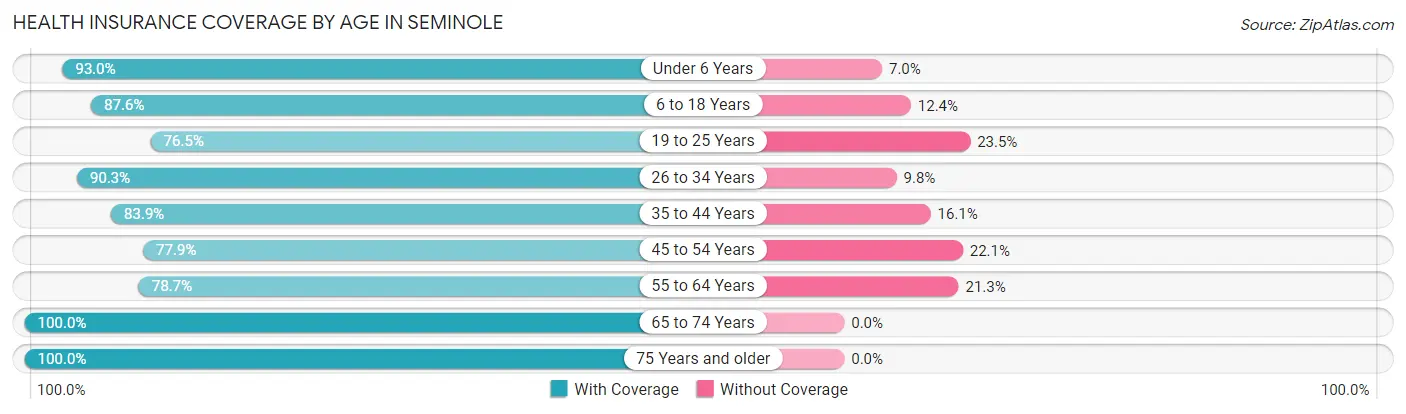
| Age Bracket | With Coverage | Without Coverage |
| Under 6 Years | 766 (93.0%) | 58 (7.0%) |
| 6 to 18 Years | 1,158 (87.6%) | 164 (12.4%) |
| 19 to 25 Years | 580 (76.5%) | 178 (23.5%) |
| 26 to 34 Years | 796 (90.2%) | 86 (9.8%) |
| 35 to 44 Years | 865 (83.9%) | 166 (16.1%) |
| 45 to 54 Years | 504 (77.9%) | 143 (22.1%) |
| 55 to 64 Years | 491 (78.7%) | 133 (21.3%) |
| 65 to 74 Years | 530 (100.0%) | 0 (0.0%) |
| 75 Years and older | 272 (100.0%) | 0 (0.0%) |
| Total | 5,962 (86.5%) | 928 (13.5%) |
Health Insurance Coverage by Citizenship Status in Seminole
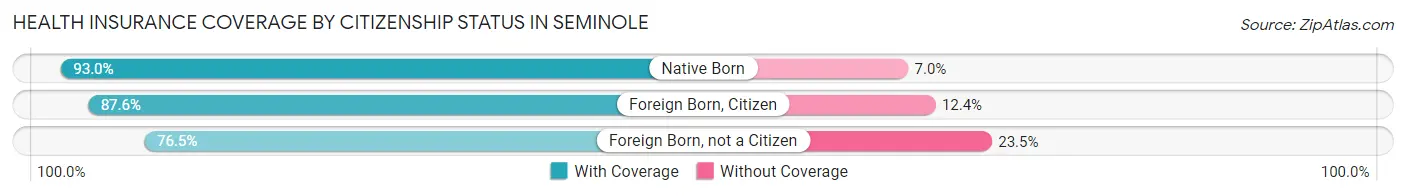
| Citizenship Status | With Coverage | Without Coverage |
| Native Born | 766 (93.0%) | 58 (7.0%) |
| Foreign Born, Citizen | 1,158 (87.6%) | 164 (12.4%) |
| Foreign Born, not a Citizen | 580 (76.5%) | 178 (23.5%) |
Health Insurance Coverage by Household Income in Seminole
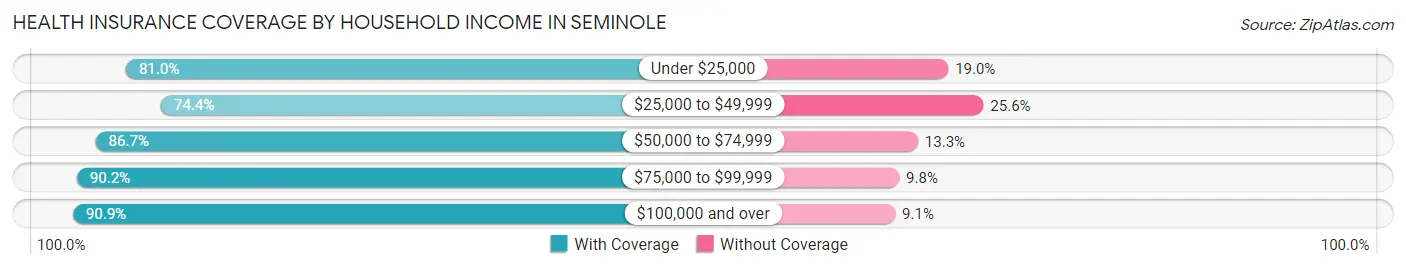
| Household Income | With Coverage | Without Coverage |
| Under $25,000 | 533 (81.0%) | 125 (19.0%) |
| $25,000 to $49,999 | 791 (74.4%) | 272 (25.6%) |
| $50,000 to $74,999 | 1,048 (86.7%) | 161 (13.3%) |
| $75,000 to $99,999 | 1,379 (90.2%) | 150 (9.8%) |
| $100,000 and over | 2,208 (90.9%) | 220 (9.1%) |
Public vs Private Health Insurance Coverage by Age in Seminole
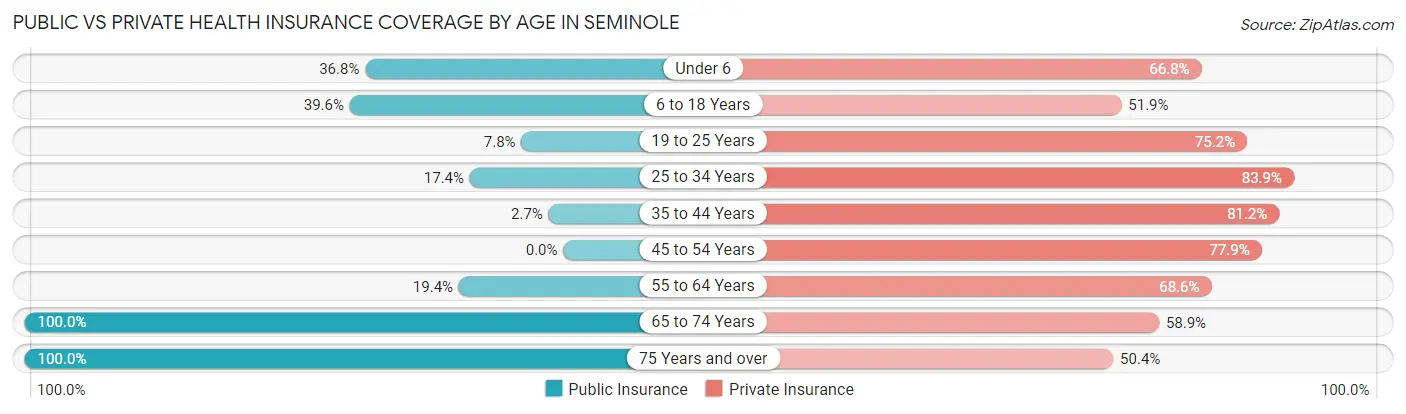
| Age Bracket | Public Insurance | Private Insurance |
| Under 6 | 303 (36.8%) | 550 (66.7%) |
| 6 to 18 Years | 524 (39.6%) | 686 (51.9%) |
| 19 to 25 Years | 59 (7.8%) | 570 (75.2%) |
| 25 to 34 Years | 153 (17.3%) | 740 (83.9%) |
| 35 to 44 Years | 28 (2.7%) | 837 (81.2%) |
| 45 to 54 Years | 0 (0.0%) | 504 (77.9%) |
| 55 to 64 Years | 121 (19.4%) | 428 (68.6%) |
| 65 to 74 Years | 530 (100.0%) | 312 (58.9%) |
| 75 Years and over | 272 (100.0%) | 137 (50.4%) |
| Total | 1,990 (28.9%) | 4,764 (69.1%) |
Disability Status by Sex by Age in Seminole
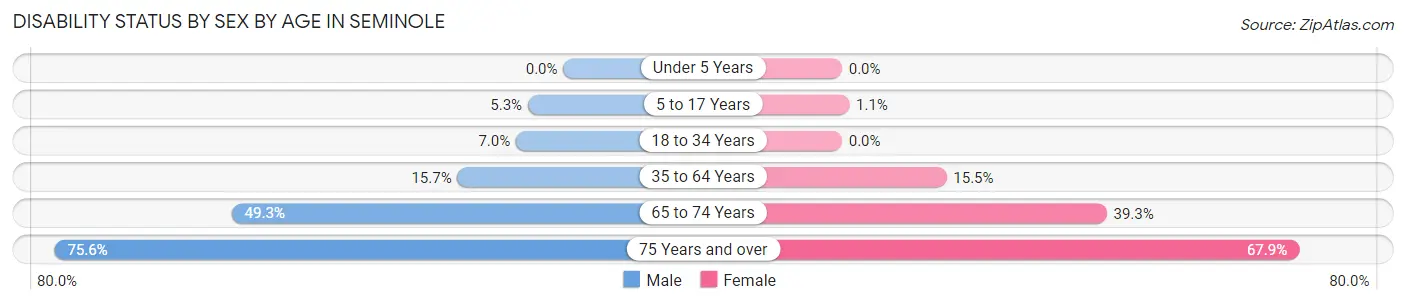
| Age Bracket | Male | Female |
| Under 5 Years | 0 (0.0%) | 0 (0.0%) |
| 5 to 17 Years | 34 (5.3%) | 8 (1.1%) |
| 18 to 34 Years | 57 (7.0%) | 0 (0.0%) |
| 35 to 64 Years | 203 (15.7%) | 157 (15.5%) |
| 65 to 74 Years | 132 (49.2%) | 103 (39.3%) |
| 75 Years and over | 102 (75.6%) | 93 (67.9%) |
Disability Class by Sex by Age in Seminole
Disability Class: Hearing Difficulty
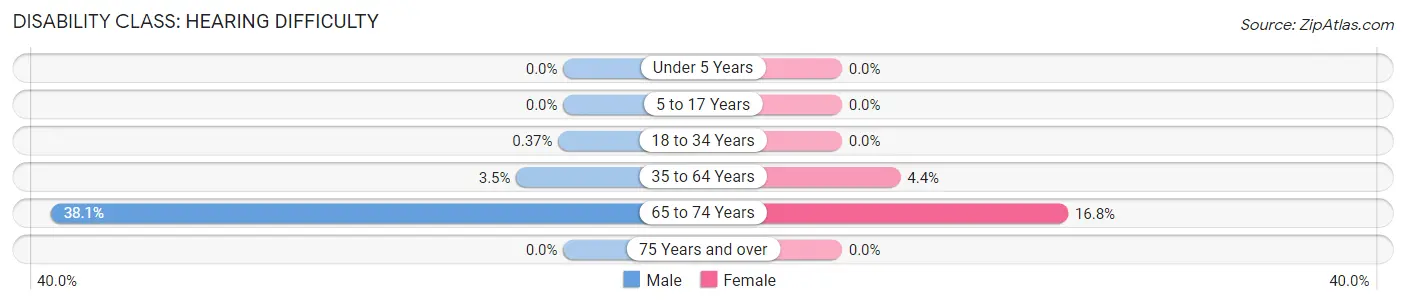
| Age Bracket | Male | Female |
| Under 5 Years | 0 (0.0%) | 0 (0.0%) |
| 5 to 17 Years | 0 (0.0%) | 0 (0.0%) |
| 18 to 34 Years | 3 (0.4%) | 0 (0.0%) |
| 35 to 64 Years | 45 (3.5%) | 44 (4.3%) |
| 65 to 74 Years | 102 (38.1%) | 44 (16.8%) |
| 75 Years and over | 0 (0.0%) | 0 (0.0%) |
Disability Class: Vision Difficulty
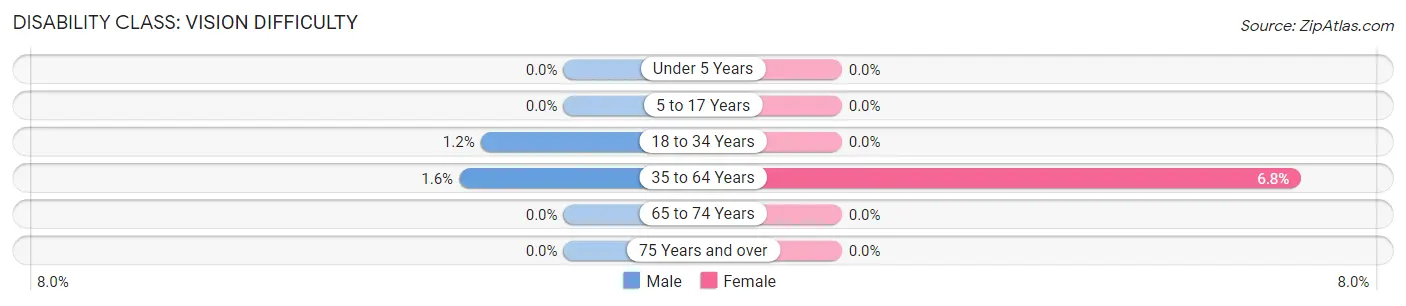
| Age Bracket | Male | Female |
| Under 5 Years | 0 (0.0%) | 0 (0.0%) |
| 5 to 17 Years | 0 (0.0%) | 0 (0.0%) |
| 18 to 34 Years | 10 (1.2%) | 0 (0.0%) |
| 35 to 64 Years | 20 (1.5%) | 69 (6.8%) |
| 65 to 74 Years | 0 (0.0%) | 0 (0.0%) |
| 75 Years and over | 0 (0.0%) | 0 (0.0%) |
Disability Class: Cognitive Difficulty
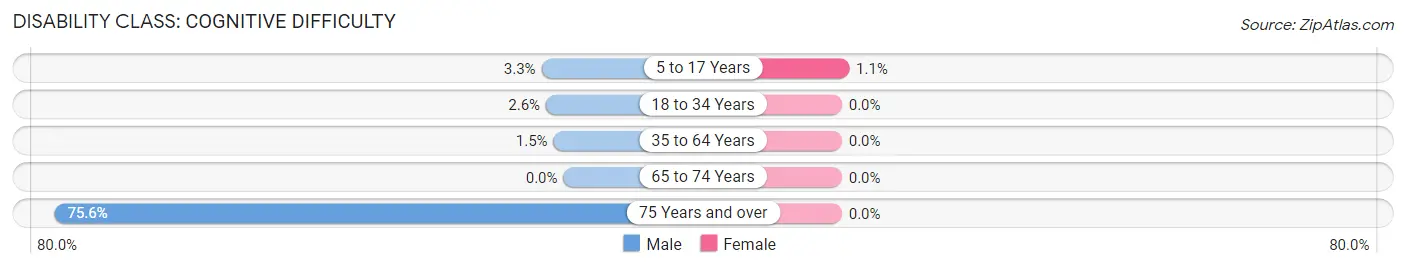
| Age Bracket | Male | Female |
| 5 to 17 Years | 21 (3.3%) | 8 (1.1%) |
| 18 to 34 Years | 21 (2.6%) | 0 (0.0%) |
| 35 to 64 Years | 19 (1.5%) | 0 (0.0%) |
| 65 to 74 Years | 0 (0.0%) | 0 (0.0%) |
| 75 Years and over | 102 (75.6%) | 0 (0.0%) |
Disability Class: Ambulatory Difficulty
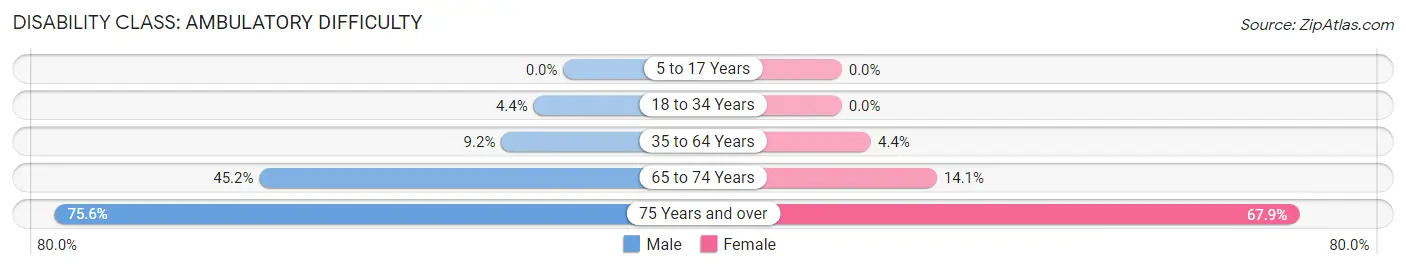
| Age Bracket | Male | Female |
| 5 to 17 Years | 0 (0.0%) | 0 (0.0%) |
| 18 to 34 Years | 36 (4.4%) | 0 (0.0%) |
| 35 to 64 Years | 119 (9.2%) | 44 (4.3%) |
| 65 to 74 Years | 121 (45.2%) | 37 (14.1%) |
| 75 Years and over | 102 (75.6%) | 93 (67.9%) |
Disability Class: Self-Care Difficulty
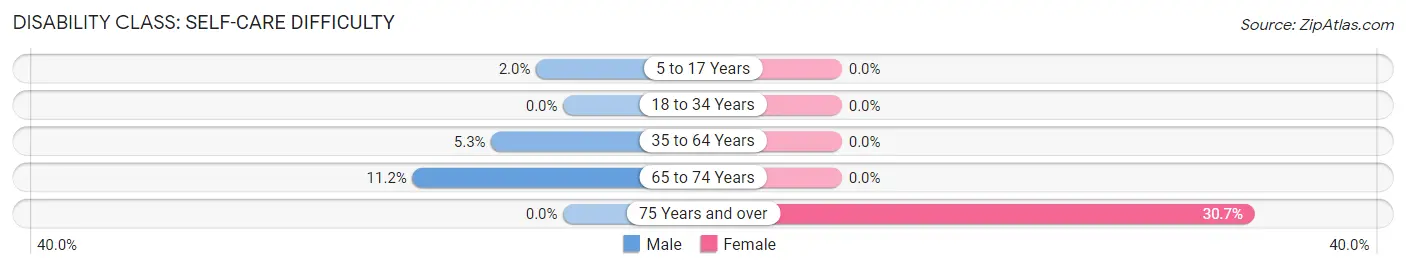
| Age Bracket | Male | Female |
| 5 to 17 Years | 13 (2.0%) | 0 (0.0%) |
| 18 to 34 Years | 0 (0.0%) | 0 (0.0%) |
| 35 to 64 Years | 69 (5.3%) | 0 (0.0%) |
| 65 to 74 Years | 30 (11.2%) | 0 (0.0%) |
| 75 Years and over | 0 (0.0%) | 42 (30.7%) |
Technology Access in Seminole
Computing Device Access in Seminole
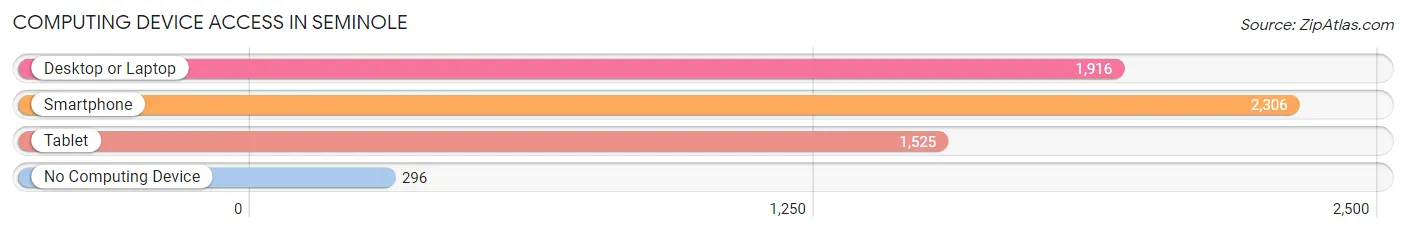
| Device Type | # Households | % Households |
| Desktop or Laptop | 1,916 | 72.3% |
| Smartphone | 2,306 | 87.1% |
| Tablet | 1,525 | 57.6% |
| No Computing Device | 296 | 11.2% |
| Total | 2,649 | 100.0% |
Internet Access in Seminole
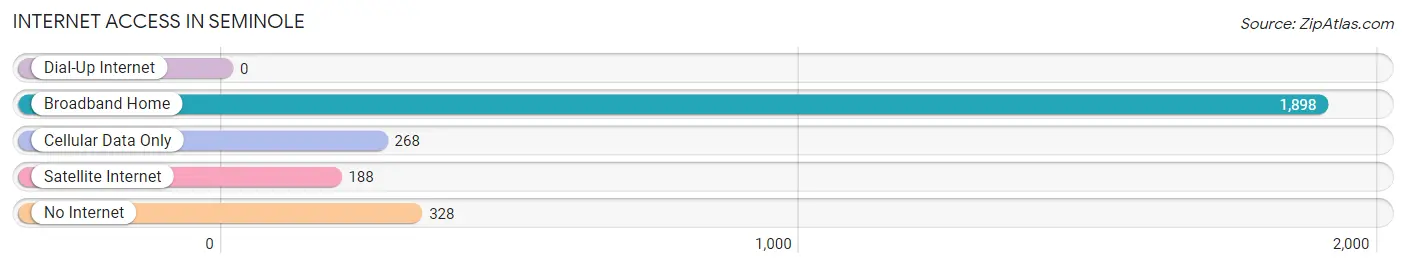
| Internet Type | # Households | % Households |
| Dial-Up Internet | 0 | 0.0% |
| Broadband Home | 1,898 | 71.7% |
| Cellular Data Only | 268 | 10.1% |
| Satellite Internet | 188 | 7.1% |
| No Internet | 328 | 12.4% |
| Total | 2,649 | 100.0% |
Seminole Summary
Seminole, Texas is a small city located in Gaines County in the western part of the state. It is situated on the edge of the Llano Estacado, a large plateau that stretches across the Texas Panhandle. The city is located about 70 miles southeast of Lubbock and about 90 miles northwest of Midland. The population of Seminole was 6,430 in the 2010 census, making it the largest city in Gaines County.
Geography
Seminole is located at the intersection of U.S. Highway 62 and State Highway 214. The city is situated on the edge of the Llano Estacado, a large plateau that stretches across the Texas Panhandle. The terrain is mostly flat, with some rolling hills in the area. The city is located about 70 miles southeast of Lubbock and about 90 miles northwest of Midland.
The climate in Seminole is semi-arid, with hot summers and mild winters. The average annual temperature is around 65 degrees Fahrenheit. The average annual precipitation is around 18 inches.
History
Seminole was founded in 1909 by the Seminole Land and Cattle Company. The company was formed by a group of investors from Oklahoma who wanted to establish a cattle ranch in the area. The town was named after the Seminole Indians, who had once lived in the area.
The town grew quickly, and by 1910 it had a population of over 1,000. The town was incorporated in 1911, and the first mayor was elected in 1912.
The town continued to grow throughout the early 20th century, and by the 1950s it had a population of over 5,000. The economy was largely based on agriculture and oil production.
Economy
The economy of Seminole is largely based on agriculture and oil production. The city is home to several large farms and ranches, and the surrounding area is known for its cotton, wheat, and sorghum production.
The city is also home to several oil and gas companies, including Chevron, ConocoPhillips, and Marathon Oil. These companies are responsible for much of the city’s economic growth.
Demographics
As of the 2010 census, the population of Seminole was 6,430. The racial makeup of the city was 79.3% White, 0.7% African American, 0.7% Native American, 0.3% Asian, 0.1% Pacific Islander, 16.7% from other races, and 2.1% from two or more races. Hispanic or Latino of any race were 33.2% of the population.
The median income for a household in the city was $31,250, and the median income for a family was $37,500. The per capita income for the city was $17,845. About 17.2% of families and 20.7% of the population were below the poverty line, including 28.2% of those under age 18 and 11.2% of those age 65 or over.
Seminole is a small city with a rich history and a diverse population. The city’s economy is largely based on agriculture and oil production, and the city is home to several large farms and ranches. The city is also home to several oil and gas companies, which are responsible for much of the city’s economic growth. The population of Seminole is diverse, with a mix of different racial and ethnic backgrounds.
Common Questions
What is Per Capita Income in Seminole?
Per Capita income in Seminole is $31,422.
What is the Median Family Income in Seminole?
Median Family Income in Seminole is $88,027.
What is the Median Household income in Seminole?
Median Household Income in Seminole is $73,074.
What is Income or Wage Gap in Seminole?
Income or Wage Gap in Seminole is 56.7%.
Women in Seminole earn 43.3 cents for every dollar earned by a man.
What is Inequality or Gini Index in Seminole?
Inequality or Gini Index in Seminole is 0.39.
What is the Total Population of Seminole?
Total Population of Seminole is 7,024.
What is the Total Male Population of Seminole?
Total Male Population of Seminole is 3,654.
What is the Total Female Population of Seminole?
Total Female Population of Seminole is 3,370.
What is the Ratio of Males per 100 Females in Seminole?
There are 108.43 Males per 100 Females in Seminole.
What is the Ratio of Females per 100 Males in Seminole?
There are 92.23 Females per 100 Males in Seminole.
What is the Median Population Age in Seminole?
Median Population Age in Seminole is 31.2 Years.
What is the Average Family Size in Seminole
Average Family Size in Seminole is 3.3 People.
What is the Average Household Size in Seminole
Average Household Size in Seminole is 2.6 People.
How Large is the Labor Force in Seminole?
There are 3,244 People in the Labor Forcein in Seminole.
What is the Percentage of People in the Labor Force in Seminole?
62.8% of People are in the Labor Force in Seminole.
What is the Unemployment Rate in Seminole?
Unemployment Rate in Seminole is 2.5%.