Sealy, TX Map & Demographics
Sealy Map
Sealy Overview
$27,313
PER CAPITA INCOME
$65,471
AVG FAMILY INCOME
$60,313
AVG HOUSEHOLD INCOME
59.4%
WAGE / INCOME GAP [ % ]
40.6¢/ $1
WAGE / INCOME GAP [ $ ]
0.42
INEQUALITY / GINI INDEX
6,837
TOTAL POPULATION
3,045
MALE POPULATION
3,792
FEMALE POPULATION
80.30
MALES / 100 FEMALES
124.53
FEMALES / 100 MALES
38.0
MEDIAN AGE
2.7
AVG FAMILY SIZE
2.5
AVG HOUSEHOLD SIZE
3,413
LABOR FORCE [ PEOPLE ]
62.7%
PERCENT IN LABOR FORCE
5.7%
UNEMPLOYMENT RATE
Sealy Zip Codes
Sealy Area Codes
Income in Sealy
Income Overview in Sealy
Per Capita Income in Sealy is $27,313, while median incomes of families and households are $65,471 and $60,313 respectively.
| Characteristic | Number | Measure |
| Per Capita Income | 6,837 | $27,313 |
| Median Family Income | 2,015 | $65,471 |
| Mean Family Income | 2,015 | $76,355 |
| Median Household Income | 2,748 | $60,313 |
| Mean Household Income | 2,748 | $68,606 |
| Income Deficit | 2,015 | $0 |
| Wage / Income Gap (%) | 6,837 | 59.45% |
| Wage / Income Gap ($) | 6,837 | 40.55¢ per $1 |
| Gini / Inequality Index | 6,837 | 0.42 |
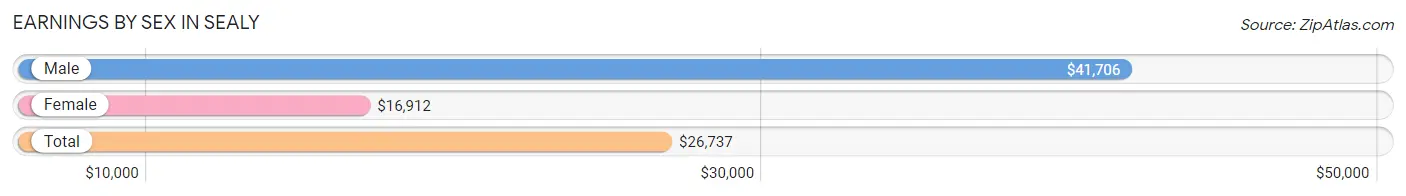
Earnings by Sex in Sealy
Average Earnings in Sealy are $26,737, $41,706 for men and $16,912 for women, a difference of 59.5%.
| Sex | Number | Average Earnings |
| Male | 1,642 (45.9%) | $41,706 |
| Female | 1,936 (54.1%) | $16,912 |
| Total | 3,578 (100.0%) | $26,737 |
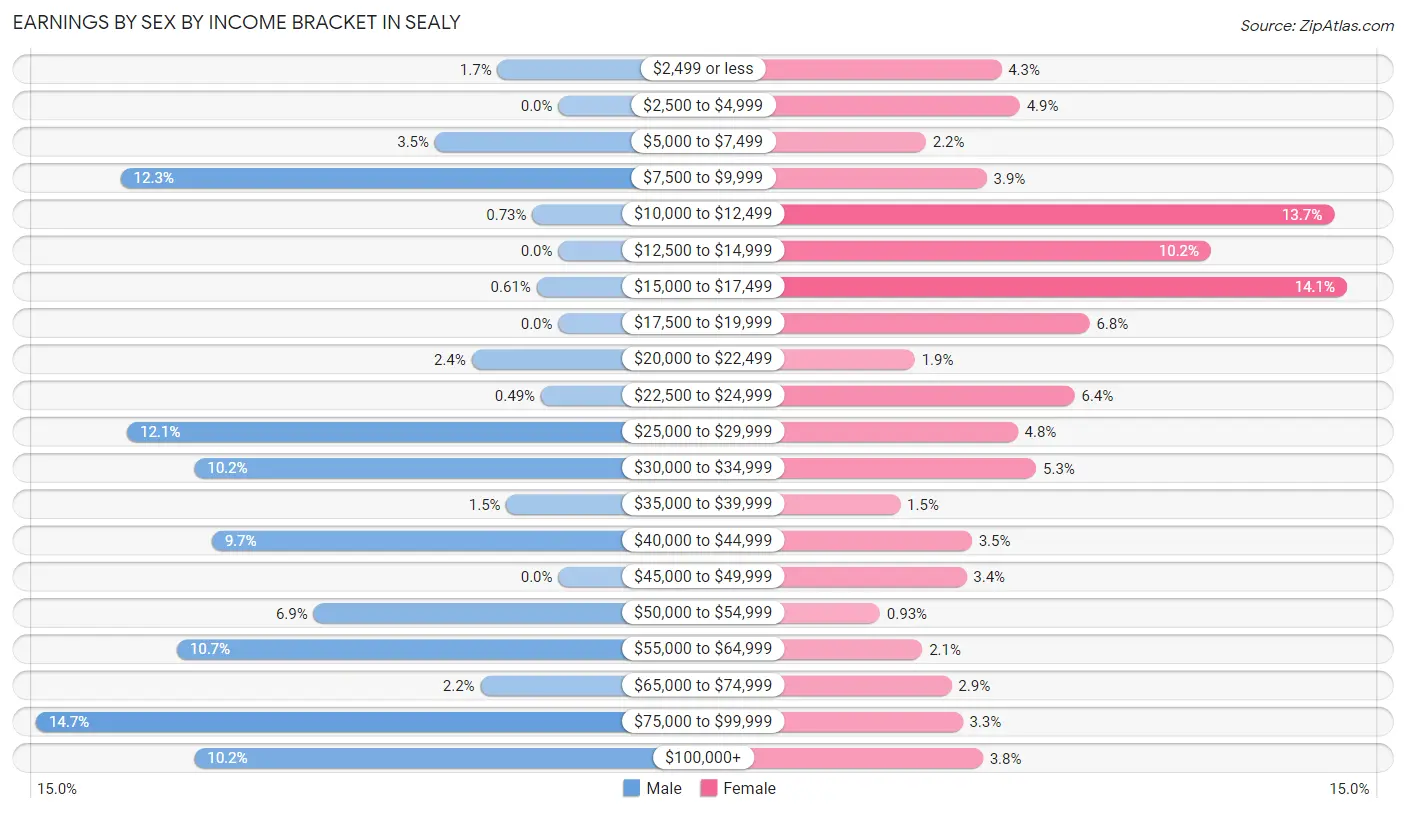
Earnings by Sex by Income Bracket in Sealy
The most common earnings brackets in Sealy are $75,000 to $99,999 for men (241 | 14.7%) and $15,000 to $17,499 for women (272 | 14.1%).
| Income | Male | Female |
| $2,499 or less | 28 (1.7%) | 84 (4.3%) |
| $2,500 to $4,999 | 0 (0.0%) | 94 (4.9%) |
| $5,000 to $7,499 | 57 (3.5%) | 43 (2.2%) |
| $7,500 to $9,999 | 202 (12.3%) | 76 (3.9%) |
| $10,000 to $12,499 | 12 (0.7%) | 265 (13.7%) |
| $12,500 to $14,999 | 0 (0.0%) | 198 (10.2%) |
| $15,000 to $17,499 | 10 (0.6%) | 272 (14.1%) |
| $17,500 to $19,999 | 0 (0.0%) | 132 (6.8%) |
| $20,000 to $22,499 | 40 (2.4%) | 37 (1.9%) |
| $22,500 to $24,999 | 8 (0.5%) | 124 (6.4%) |
| $25,000 to $29,999 | 199 (12.1%) | 93 (4.8%) |
| $30,000 to $34,999 | 168 (10.2%) | 103 (5.3%) |
| $35,000 to $39,999 | 24 (1.5%) | 29 (1.5%) |
| $40,000 to $44,999 | 160 (9.7%) | 68 (3.5%) |
| $45,000 to $49,999 | 0 (0.0%) | 65 (3.4%) |
| $50,000 to $54,999 | 113 (6.9%) | 18 (0.9%) |
| $55,000 to $64,999 | 176 (10.7%) | 41 (2.1%) |
| $65,000 to $74,999 | 36 (2.2%) | 57 (2.9%) |
| $75,000 to $99,999 | 241 (14.7%) | 63 (3.3%) |
| $100,000+ | 168 (10.2%) | 74 (3.8%) |
| Total | 1,642 (100.0%) | 1,936 (100.0%) |
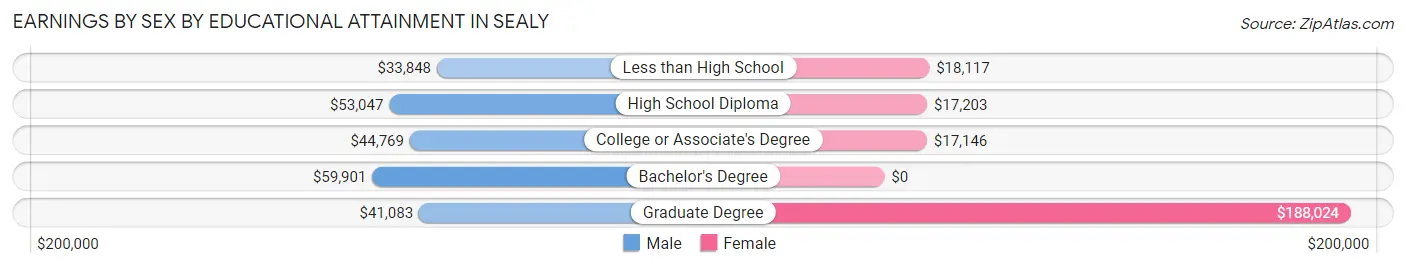
Earnings by Sex by Educational Attainment in Sealy
Average earnings in Sealy are $43,102 for men and $18,892 for women, a difference of 56.2%. Men with an educational attainment of bachelor's degree enjoy the highest average annual earnings of $59,901, while those with less than high school education earn the least with $33,848. Women with an educational attainment of graduate degree earn the most with the average annual earnings of $188,024, while those with college or associate's degree education have the smallest earnings of $17,146.
| Educational Attainment | Male Income | Female Income |
| Less than High School | $33,848 | $18,117 |
| High School Diploma | $53,047 | $17,203 |
| College or Associate's Degree | $44,769 | $17,146 |
| Bachelor's Degree | $59,901 | $0 |
| Graduate Degree | $41,083 | $188,024 |
| Total | $43,102 | $18,892 |
Family Income in Sealy
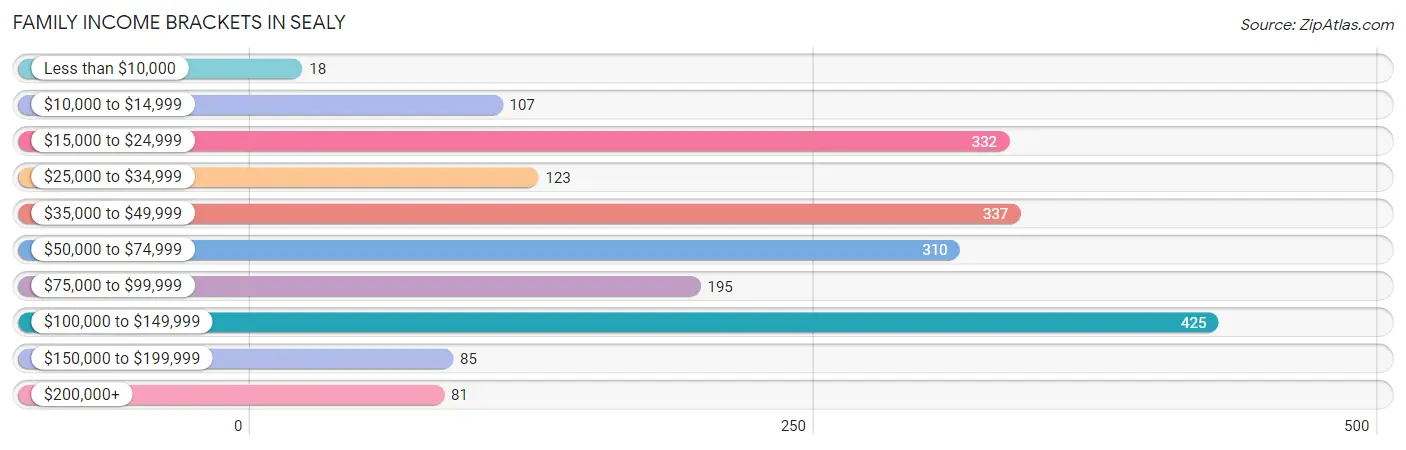
Family Income Brackets in Sealy
According to the Sealy family income data, there are 425 families falling into the $100,000 to $149,999 income range, which is the most common income bracket and makes up 21.1% of all families. Conversely, the less than $10,000 income bracket is the least frequent group with only 18 families (0.9%) belonging to this category.
| Income Bracket | # Families | % Families |
| Less than $10,000 | 18 | 0.9% |
| $10,000 to $14,999 | 107 | 5.3% |
| $15,000 to $24,999 | 332 | 16.5% |
| $25,000 to $34,999 | 123 | 6.1% |
| $35,000 to $49,999 | 337 | 16.7% |
| $50,000 to $74,999 | 310 | 15.4% |
| $75,000 to $99,999 | 195 | 9.7% |
| $100,000 to $149,999 | 425 | 21.1% |
| $150,000 to $199,999 | 85 | 4.2% |
| $200,000+ | 81 | 4.0% |
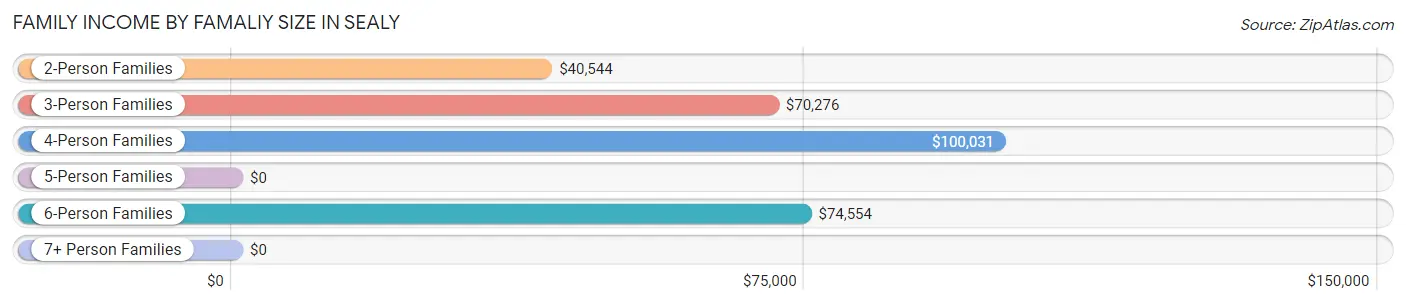
Family Income by Famaliy Size in Sealy
4-person families (485 | 24.1%) account for the highest median family income in Sealy with $100,031 per family, while 4-person families (485 | 24.1%) have the highest median income of $25,008 per family member.
| Income Bracket | # Families | Median Income |
| 2-Person Families | 1,137 (56.4%) | $40,544 |
| 3-Person Families | 271 (13.5%) | $70,276 |
| 4-Person Families | 485 (24.1%) | $100,031 |
| 5-Person Families | 26 (1.3%) | $0 |
| 6-Person Families | 96 (4.8%) | $74,554 |
| 7+ Person Families | 0 (0.0%) | $0 |
| Total | 2,015 (100.0%) | $65,471 |
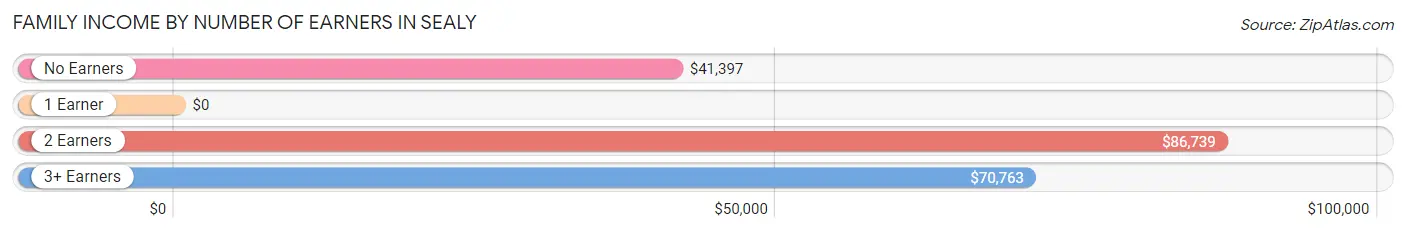
Family Income by Number of Earners in Sealy
| Number of Earners | # Families | Median Income |
| No Earners | 301 (14.9%) | $41,397 |
| 1 Earner | 780 (38.7%) | $0 |
| 2 Earners | 656 (32.6%) | $86,739 |
| 3+ Earners | 278 (13.8%) | $70,763 |
| Total | 2,015 (100.0%) | $65,471 |
Household Income in Sealy
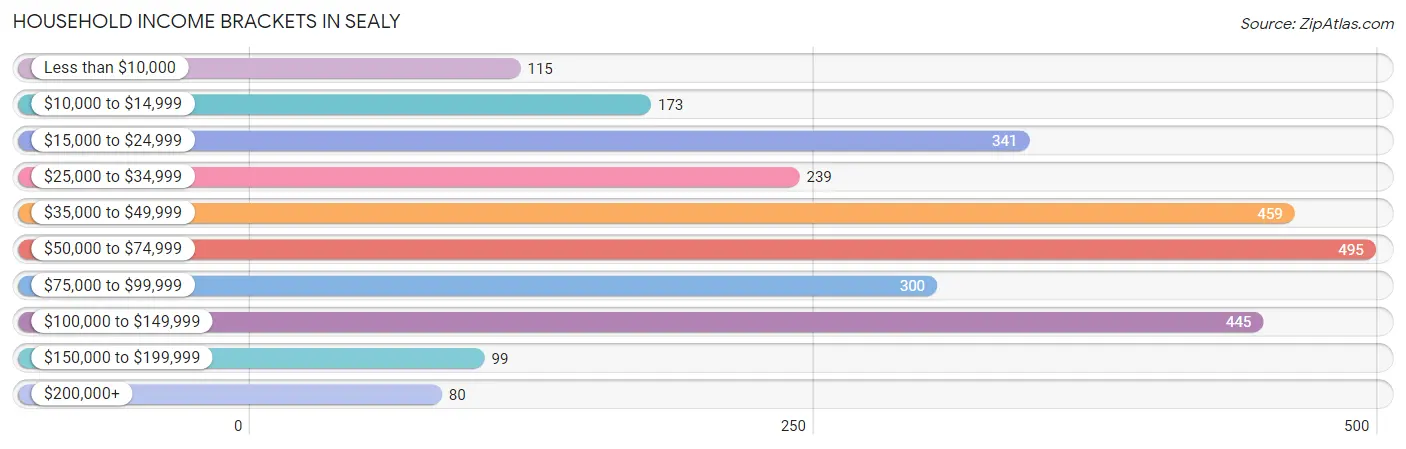
Household Income Brackets in Sealy
With 495 households falling in the category, the $50,000 to $74,999 income range is the most frequent in Sealy, accounting for 18.0% of all households. In contrast, only 80 households (2.9%) fall into the $200,000+ income bracket, making it the least populous group.
| Income Bracket | # Households | % Households |
| Less than $10,000 | 115 | 4.2% |
| $10,000 to $14,999 | 173 | 6.3% |
| $15,000 to $24,999 | 341 | 12.4% |
| $25,000 to $34,999 | 239 | 8.7% |
| $35,000 to $49,999 | 459 | 16.7% |
| $50,000 to $74,999 | 495 | 18.0% |
| $75,000 to $99,999 | 300 | 10.9% |
| $100,000 to $149,999 | 445 | 16.2% |
| $150,000 to $199,999 | 99 | 3.6% |
| $200,000+ | 80 | 2.9% |
Household Income by Householder Age in Sealy
The median household income in Sealy is $60,313, with the highest median household income of $72,487 found in the 25 to 44 years age bracket for the primary householder. A total of 925 households (33.7%) fall into this category. Meanwhile, the 15 to 24 years age bracket for the primary householder has the lowest median household income of $0, with 165 households (6.0%) in this group.
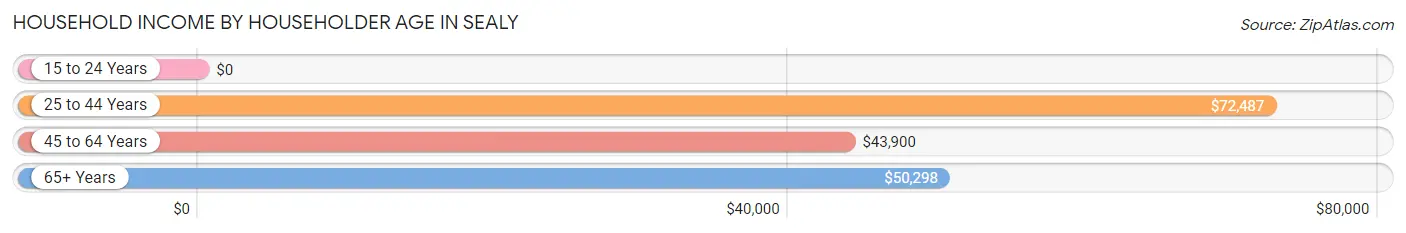
| Income Bracket | # Households | Median Income |
| 15 to 24 Years | 165 (6.0%) | $0 |
| 25 to 44 Years | 925 (33.7%) | $72,487 |
| 45 to 64 Years | 812 (29.5%) | $43,900 |
| 65+ Years | 846 (30.8%) | $50,298 |
| Total | 2,748 (100.0%) | $60,313 |
Poverty in Sealy
Income Below Poverty by Sex and Age in Sealy
With 15.9% poverty level for males and 22.4% for females among the residents of Sealy, 18 to 24 year old males and 5 year old females are the most vulnerable to poverty, with 168 males (57.0%) and 17 females (100.0%) in their respective age groups living below the poverty level.
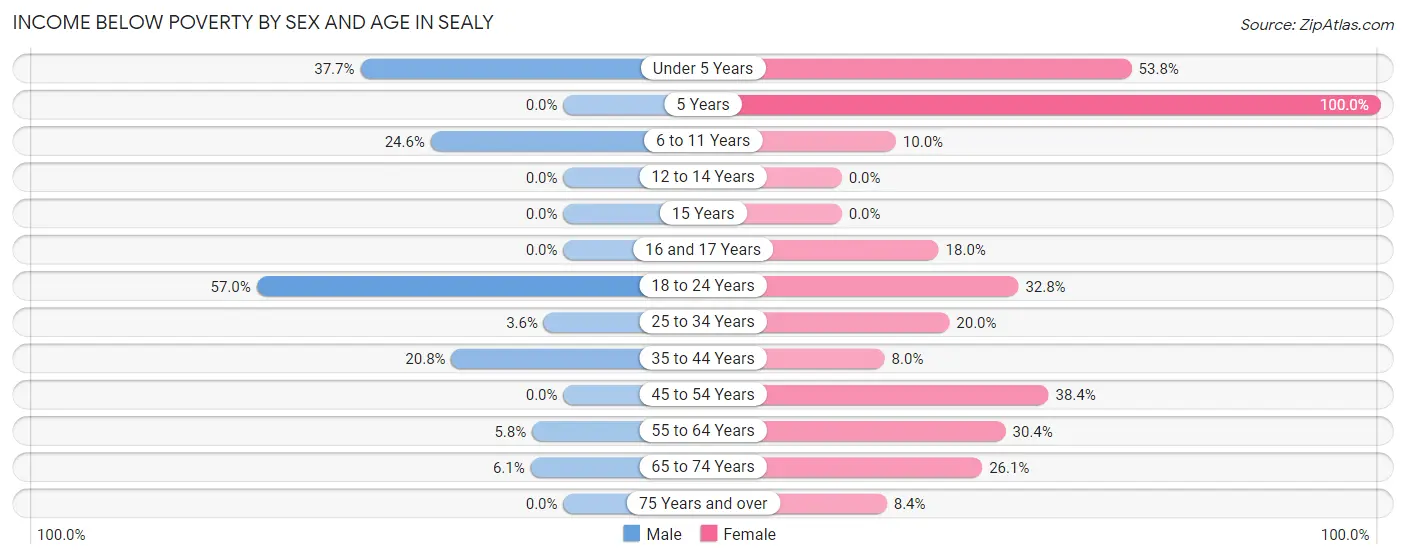
| Age Bracket | Male | Female |
| Under 5 Years | 124 (37.7%) | 92 (53.8%) |
| 5 Years | 0 (0.0%) | 17 (100.0%) |
| 6 to 11 Years | 48 (24.6%) | 23 (10.0%) |
| 12 to 14 Years | 0 (0.0%) | 0 (0.0%) |
| 15 Years | 0 (0.0%) | 0 (0.0%) |
| 16 and 17 Years | 0 (0.0%) | 16 (18.0%) |
| 18 to 24 Years | 168 (57.0%) | 141 (32.8%) |
| 25 to 34 Years | 11 (3.6%) | 134 (20.0%) |
| 35 to 44 Years | 85 (20.8%) | 30 (8.0%) |
| 45 to 54 Years | 0 (0.0%) | 104 (38.4%) |
| 55 to 64 Years | 19 (5.8%) | 156 (30.4%) |
| 65 to 74 Years | 25 (6.1%) | 86 (26.1%) |
| 75 Years and over | 0 (0.0%) | 39 (8.4%) |
| Total | 480 (15.9%) | 838 (22.4%) |
Income Above Poverty by Sex and Age in Sealy
According to the poverty statistics in Sealy, males aged 5 years and females aged 12 to 14 years are the age groups that are most secure financially, with 100.0% of males and 100.0% of females in these age groups living above the poverty line.
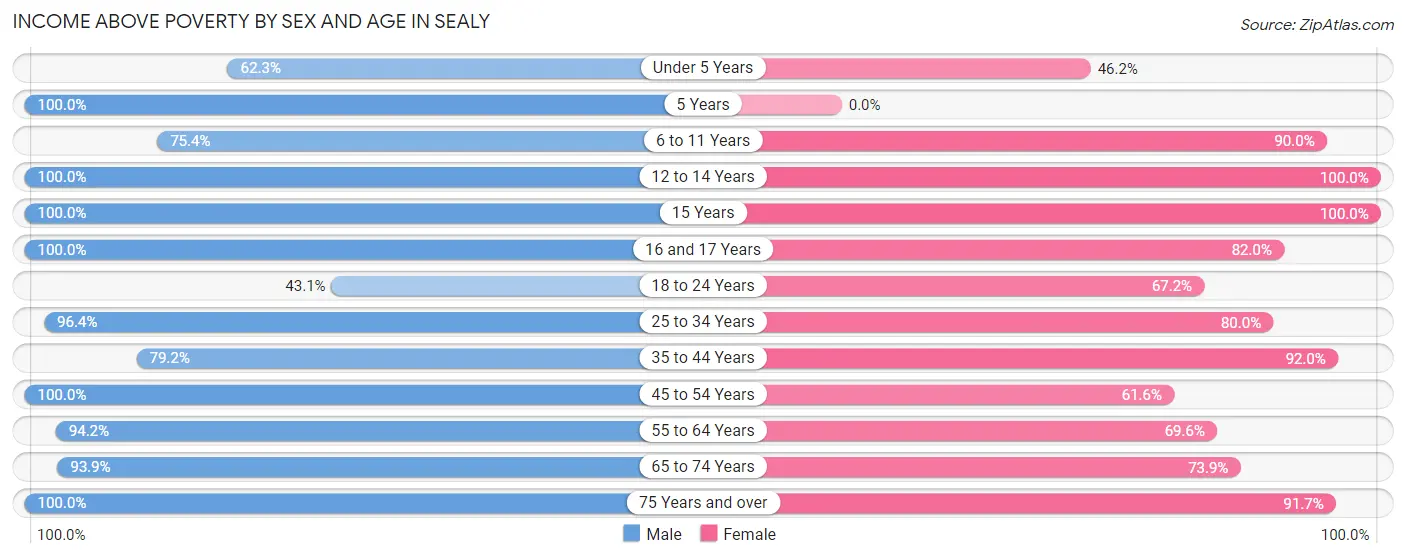
| Age Bracket | Male | Female |
| Under 5 Years | 205 (62.3%) | 79 (46.2%) |
| 5 Years | 51 (100.0%) | 0 (0.0%) |
| 6 to 11 Years | 147 (75.4%) | 206 (90.0%) |
| 12 to 14 Years | 161 (100.0%) | 143 (100.0%) |
| 15 Years | 45 (100.0%) | 40 (100.0%) |
| 16 and 17 Years | 9 (100.0%) | 73 (82.0%) |
| 18 to 24 Years | 127 (43.0%) | 289 (67.2%) |
| 25 to 34 Years | 292 (96.4%) | 537 (80.0%) |
| 35 to 44 Years | 324 (79.2%) | 347 (92.0%) |
| 45 to 54 Years | 286 (100.0%) | 167 (61.6%) |
| 55 to 64 Years | 308 (94.2%) | 357 (69.6%) |
| 65 to 74 Years | 386 (93.9%) | 244 (73.9%) |
| 75 Years and over | 191 (100.0%) | 428 (91.6%) |
| Total | 2,532 (84.1%) | 2,910 (77.6%) |
Income Below Poverty Among Married-Couple Families in Sealy
The poverty statistics for married-couple families in Sealy show that 2.5% or 37 of the total 1,453 families live below the poverty line. Families with 1 or 2 children have the highest poverty rate of 8.6%, comprising of 37 families. On the other hand, families with no children have the lowest poverty rate of 0.0%, which includes 0 families.
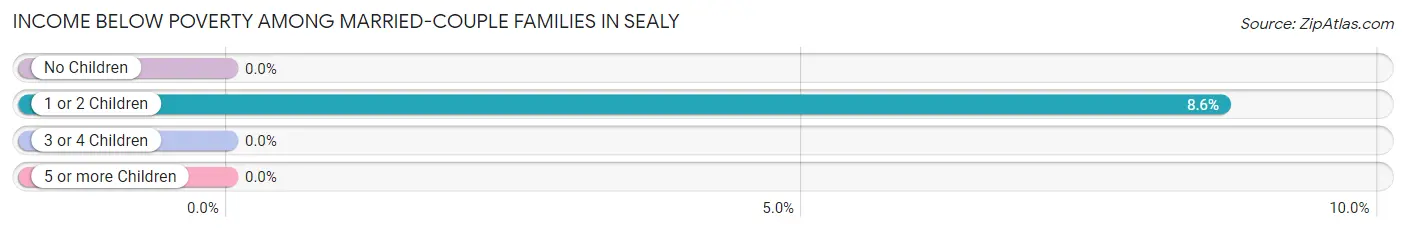
| Children | Above Poverty | Below Poverty |
| No Children | 961 (100.0%) | 0 (0.0%) |
| 1 or 2 Children | 391 (91.4%) | 37 (8.6%) |
| 3 or 4 Children | 64 (100.0%) | 0 (0.0%) |
| 5 or more Children | 0 (0.0%) | 0 (0.0%) |
| Total | 1,416 (97.5%) | 37 (2.5%) |
Income Below Poverty Among Single-Parent Households in Sealy
According to the poverty data in Sealy, 36.7% or 18 single-father households and 55.7% or 286 single-mother households are living below the poverty line. Among single-father households, those with 3 or 4 children have the highest poverty rate, with 18 households (100.0%) experiencing poverty. Likewise, among single-mother households, those with 3 or 4 children have the highest poverty rate, with 34 households (64.1%) falling below the poverty line.
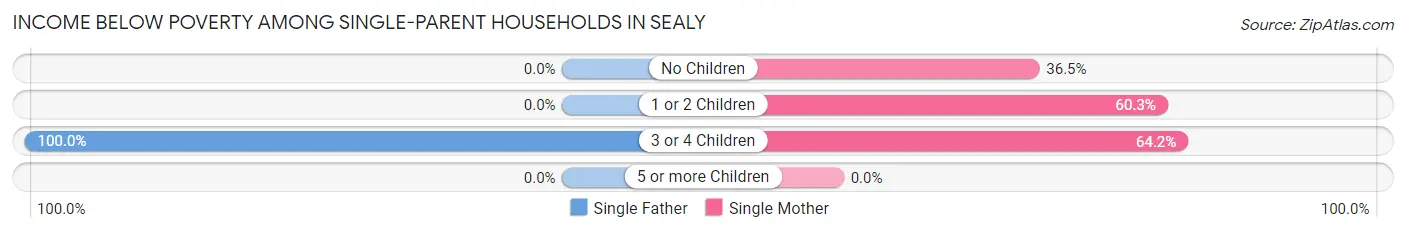
| Children | Single Father | Single Mother |
| No Children | 0 (0.0%) | 39 (36.4%) |
| 1 or 2 Children | 0 (0.0%) | 213 (60.3%) |
| 3 or 4 Children | 18 (100.0%) | 34 (64.1%) |
| 5 or more Children | 0 (0.0%) | 0 (0.0%) |
| Total | 18 (36.7%) | 286 (55.7%) |
Income Below Poverty Among Married-Couple vs Single-Parent Households in Sealy
The poverty data for Sealy shows that 37 of the married-couple family households (2.5%) and 304 of the single-parent households (54.1%) are living below the poverty level. Within the married-couple family households, those with 1 or 2 children have the highest poverty rate, with 37 households (8.6%) falling below the poverty line. Among the single-parent households, those with 3 or 4 children have the highest poverty rate, with 52 household (73.2%) living below poverty.
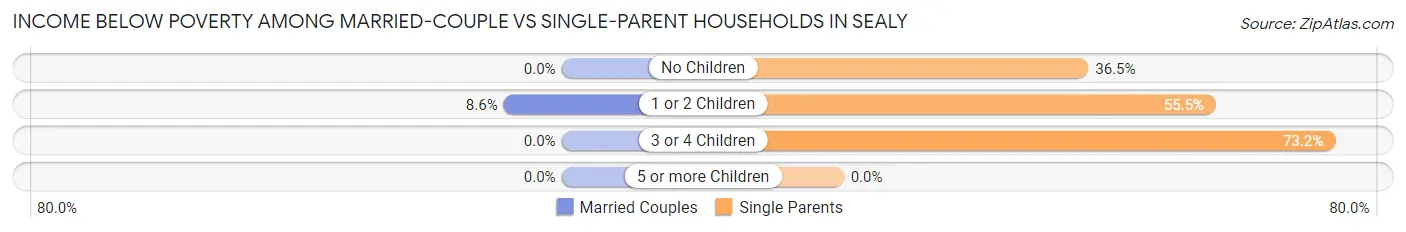
| Children | Married-Couple Families | Single-Parent Households |
| No Children | 0 (0.0%) | 39 (36.4%) |
| 1 or 2 Children | 37 (8.6%) | 213 (55.5%) |
| 3 or 4 Children | 0 (0.0%) | 52 (73.2%) |
| 5 or more Children | 0 (0.0%) | 0 (0.0%) |
| Total | 37 (2.5%) | 304 (54.1%) |
Race in Sealy
The most populous races in Sealy are White / Caucasian (5,040 | 73.7%), Hispanic or Latino (2,813 | 41.1%), and Two or more Races (695 | 10.2%).
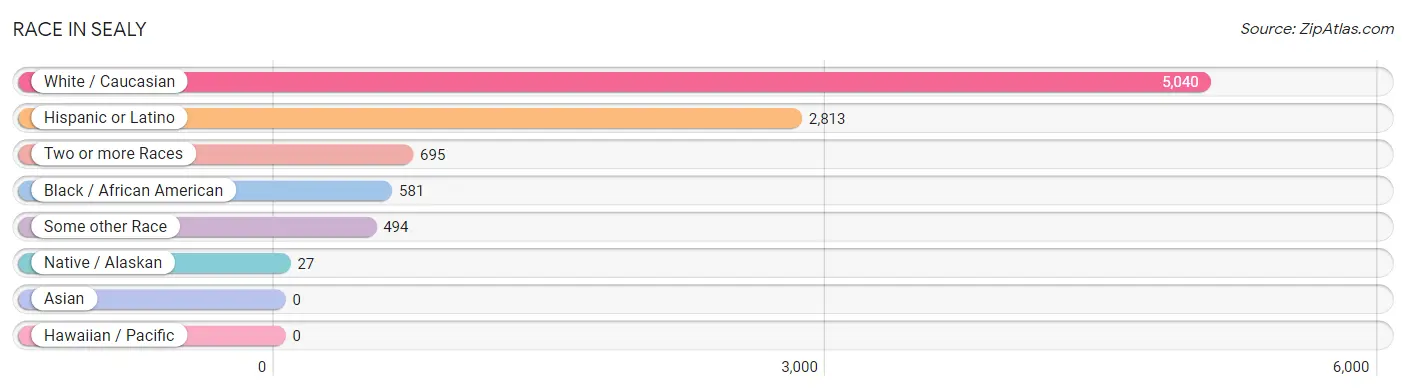
| Race | # Population | % Population |
| Asian | 0 | 0.0% |
| Black / African American | 581 | 8.5% |
| Hawaiian / Pacific | 0 | 0.0% |
| Hispanic or Latino | 2,813 | 41.1% |
| Native / Alaskan | 27 | 0.4% |
| White / Caucasian | 5,040 | 73.7% |
| Two or more Races | 695 | 10.2% |
| Some other Race | 494 | 7.2% |
| Total | 6,837 | 100.0% |
Ancestry in Sealy
The most populous ancestries reported in Sealy are Mexican (2,535 | 37.1%), German (1,024 | 15.0%), Czech (508 | 7.4%), Irish (415 | 6.1%), and English (259 | 3.8%), together accounting for 69.4% of all Sealy residents.
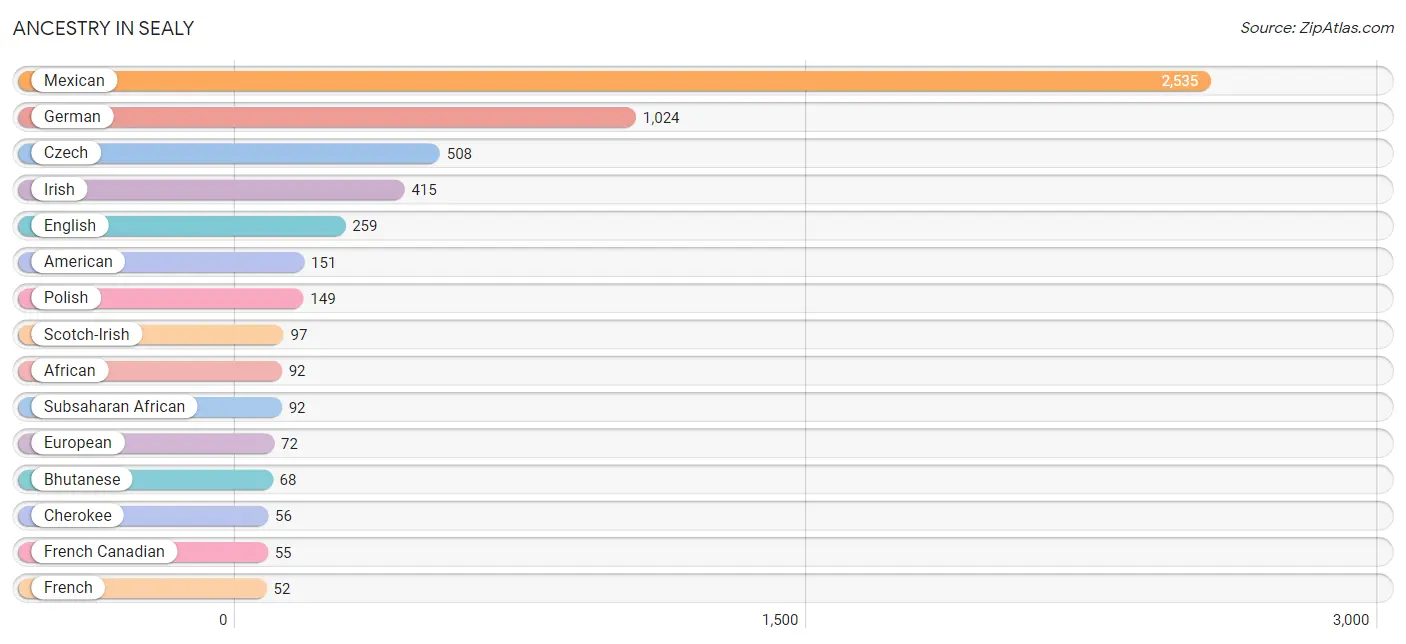
| Ancestry | # Population | % Population |
| African | 92 | 1.3% |
| American | 151 | 2.2% |
| Bhutanese | 68 | 1.0% |
| Cherokee | 56 | 0.8% |
| Choctaw | 42 | 0.6% |
| Croatian | 6 | 0.1% |
| Czech | 508 | 7.4% |
| Danish | 16 | 0.2% |
| English | 259 | 3.8% |
| European | 72 | 1.1% |
| French | 52 | 0.8% |
| French Canadian | 55 | 0.8% |
| German | 1,024 | 15.0% |
| Greek | 9 | 0.1% |
| Irish | 415 | 6.1% |
| Italian | 10 | 0.2% |
| Lithuanian | 14 | 0.2% |
| Mexican | 2,535 | 37.1% |
| Mexican American Indian | 27 | 0.4% |
| Polish | 149 | 2.2% |
| Scotch-Irish | 97 | 1.4% |
| Scottish | 13 | 0.2% |
| Subsaharan African | 92 | 1.3% |
| Swedish | 12 | 0.2% |
| Yugoslavian | 24 | 0.4% | View All 25 Rows |
Immigrants in Sealy
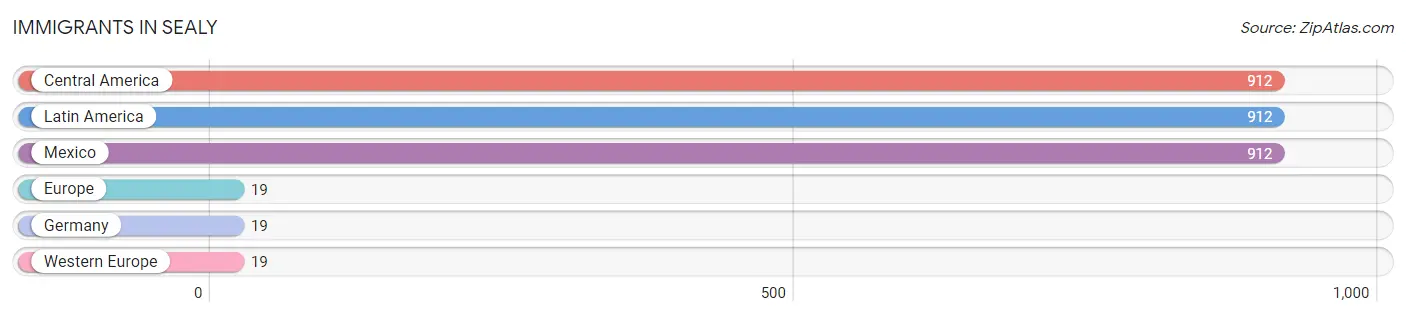
The most numerous immigrant groups reported in Sealy came from Central America (912 | 13.3%), Latin America (912 | 13.3%), Mexico (912 | 13.3%), Europe (19 | 0.3%), and Germany (19 | 0.3%), together accounting for 40.6% of all Sealy residents.
| Immigration Origin | # Population | % Population |
| Central America | 912 | 13.3% |
| Europe | 19 | 0.3% |
| Germany | 19 | 0.3% |
| Latin America | 912 | 13.3% |
| Mexico | 912 | 13.3% |
| Western Europe | 19 | 0.3% | View All 6 Rows |
Sex and Age in Sealy
Sex and Age in Sealy
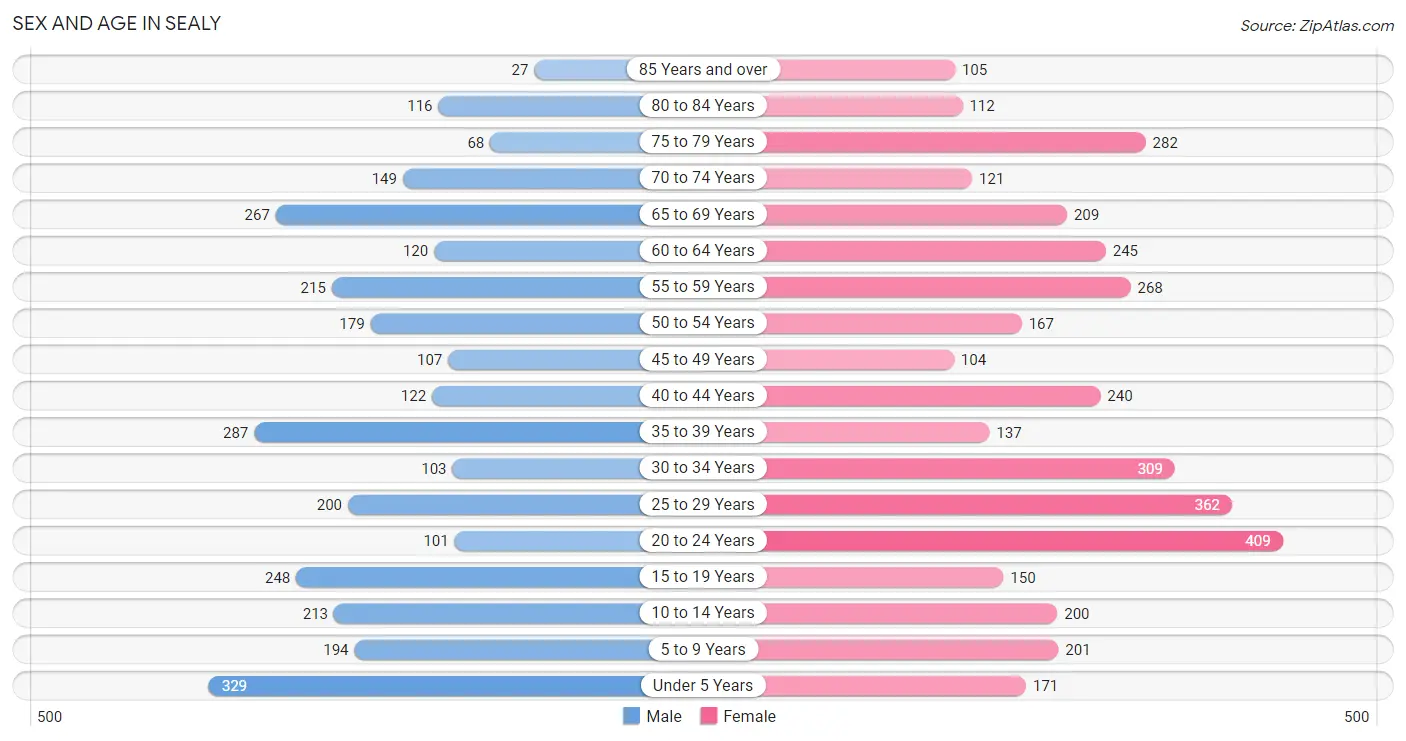
The most populous age groups in Sealy are Under 5 Years (329 | 10.8%) for men and 20 to 24 Years (409 | 10.8%) for women.
| Age Bracket | Male | Female |
| Under 5 Years | 329 (10.8%) | 171 (4.5%) |
| 5 to 9 Years | 194 (6.4%) | 201 (5.3%) |
| 10 to 14 Years | 213 (7.0%) | 200 (5.3%) |
| 15 to 19 Years | 248 (8.1%) | 150 (4.0%) |
| 20 to 24 Years | 101 (3.3%) | 409 (10.8%) |
| 25 to 29 Years | 200 (6.6%) | 362 (9.6%) |
| 30 to 34 Years | 103 (3.4%) | 309 (8.2%) |
| 35 to 39 Years | 287 (9.4%) | 137 (3.6%) |
| 40 to 44 Years | 122 (4.0%) | 240 (6.3%) |
| 45 to 49 Years | 107 (3.5%) | 104 (2.7%) |
| 50 to 54 Years | 179 (5.9%) | 167 (4.4%) |
| 55 to 59 Years | 215 (7.1%) | 268 (7.1%) |
| 60 to 64 Years | 120 (3.9%) | 245 (6.5%) |
| 65 to 69 Years | 267 (8.8%) | 209 (5.5%) |
| 70 to 74 Years | 149 (4.9%) | 121 (3.2%) |
| 75 to 79 Years | 68 (2.2%) | 282 (7.4%) |
| 80 to 84 Years | 116 (3.8%) | 112 (2.9%) |
| 85 Years and over | 27 (0.9%) | 105 (2.8%) |
| Total | 3,045 (100.0%) | 3,792 (100.0%) |
Families and Households in Sealy
Median Family Size in Sealy
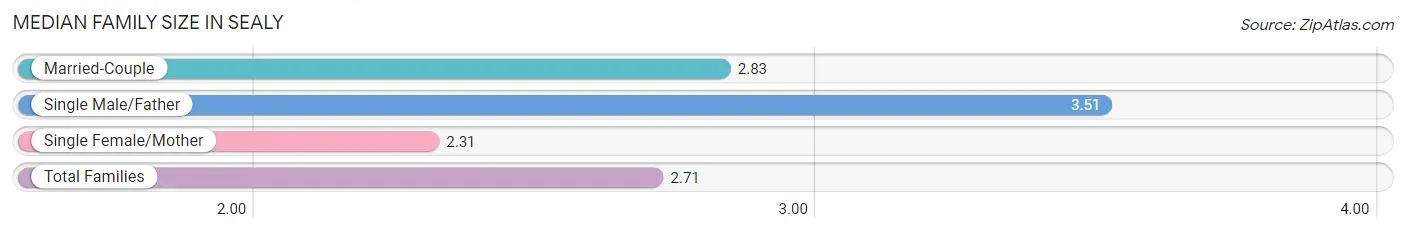
The median family size in Sealy is 2.71 persons per family, with single male/father families (49 | 2.4%) accounting for the largest median family size of 3.51 persons per family. On the other hand, single female/mother families (513 | 25.5%) represent the smallest median family size with 2.31 persons per family.
| Family Type | # Families | Family Size |
| Married-Couple | 1,453 (72.1%) | 2.83 |
| Single Male/Father | 49 (2.4%) | 3.51 |
| Single Female/Mother | 513 (25.5%) | 2.31 |
| Total Families | 2,015 (100.0%) | 2.71 |
Median Household Size in Sealy
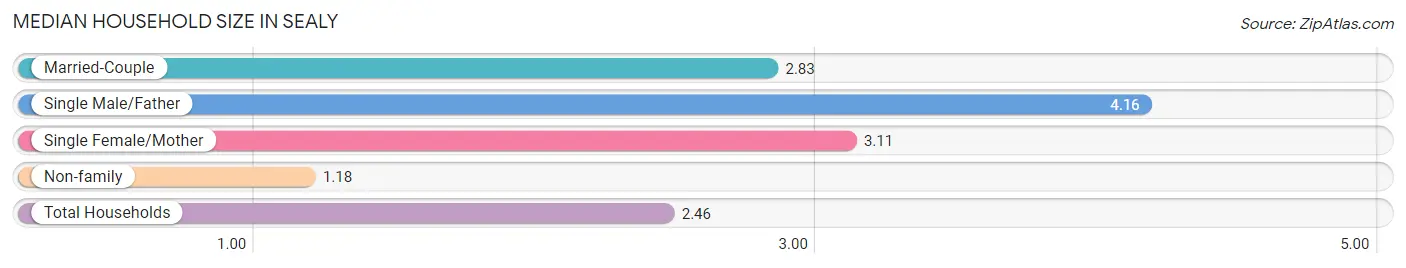
The median household size in Sealy is 2.46 persons per household, with single male/father households (49 | 1.8%) accounting for the largest median household size of 4.16 persons per household. non-family households (733 | 26.7%) represent the smallest median household size with 1.18 persons per household.
| Household Type | # Households | Household Size |
| Married-Couple | 1,453 (52.9%) | 2.83 |
| Single Male/Father | 49 (1.8%) | 4.16 |
| Single Female/Mother | 513 (18.7%) | 3.11 |
| Non-family | 733 (26.7%) | 1.18 |
| Total Households | 2,748 (100.0%) | 2.46 |
Household Size by Marriage Status in Sealy
Out of a total of 2,748 households in Sealy, 2,015 (73.3%) are family households, while 733 (26.7%) are nonfamily households. The most numerous type of family households are 2-person households, comprising 972, and the most common type of nonfamily households are 1-person households, comprising 581.
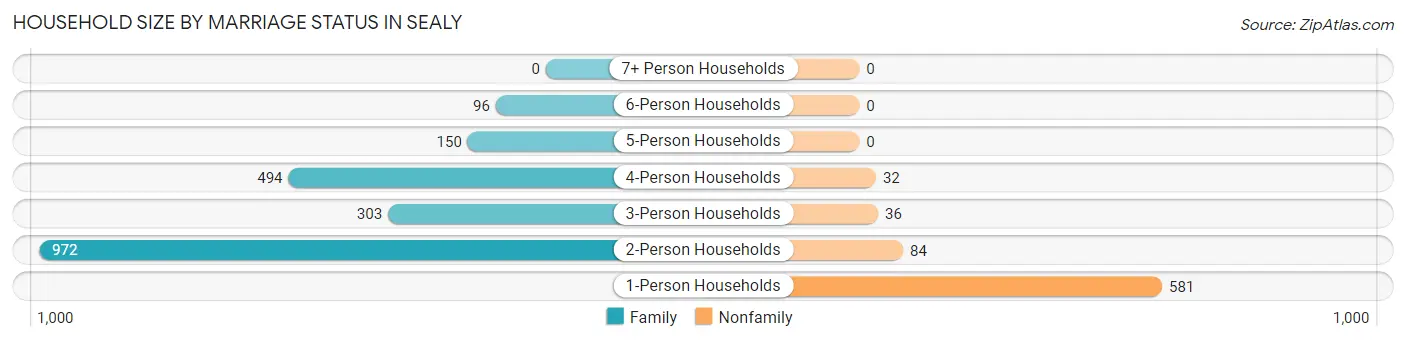
| Household Size | Family Households | Nonfamily Households |
| 1-Person Households | - | 581 (21.1%) |
| 2-Person Households | 972 (35.4%) | 84 (3.1%) |
| 3-Person Households | 303 (11.0%) | 36 (1.3%) |
| 4-Person Households | 494 (18.0%) | 32 (1.2%) |
| 5-Person Households | 150 (5.5%) | 0 (0.0%) |
| 6-Person Households | 96 (3.5%) | 0 (0.0%) |
| 7+ Person Households | 0 (0.0%) | 0 (0.0%) |
| Total | 2,015 (73.3%) | 733 (26.7%) |
Female Fertility in Sealy
Fertility by Age in Sealy
Average fertility rate in Sealy is 94.0 births per 1,000 women. Women in the age bracket of 20 to 34 years have the highest fertility rate with 154.0 births per 1,000 women. Women in the age bracket of 20 to 34 years acount for 100.0% of all women with births.
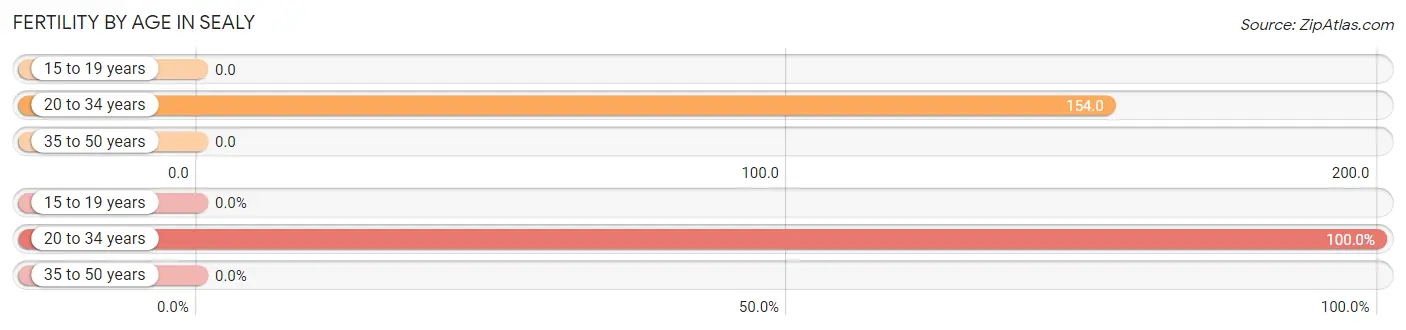
| Age Bracket | Women with Births | Births / 1,000 Women |
| 15 to 19 years | 0 (0.0%) | 0.0 |
| 20 to 34 years | 166 (100.0%) | 154.0 |
| 35 to 50 years | 0 (0.0%) | 0.0 |
| Total | 166 (100.0%) | 94.0 |
Fertility by Age by Marriage Status in Sealy
52.4% of women with births (166) in Sealy are married. The highest percentage of unmarried women with births falls into 20 to 34 years age bracket with 47.6% of them unmarried at the time of birth, while the lowest percentage of unmarried women with births belong to 20 to 34 years age bracket with 47.6% of them unmarried.
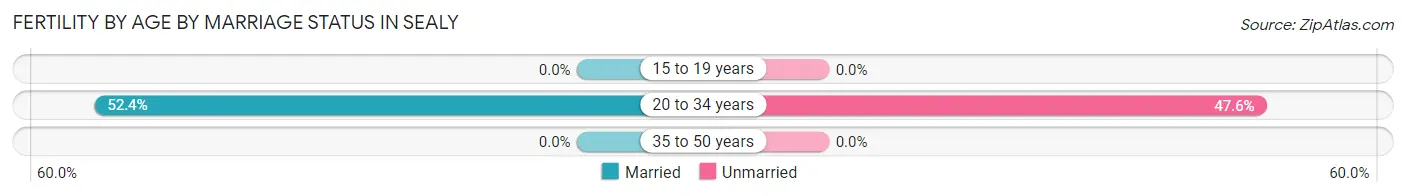
| Age Bracket | Married | Unmarried |
| 15 to 19 years | 0 (0.0%) | 0 (0.0%) |
| 20 to 34 years | 87 (52.4%) | 79 (47.6%) |
| 35 to 50 years | 0 (0.0%) | 0 (0.0%) |
| Total | 87 (52.4%) | 79 (47.6%) |
Fertility by Education in Sealy
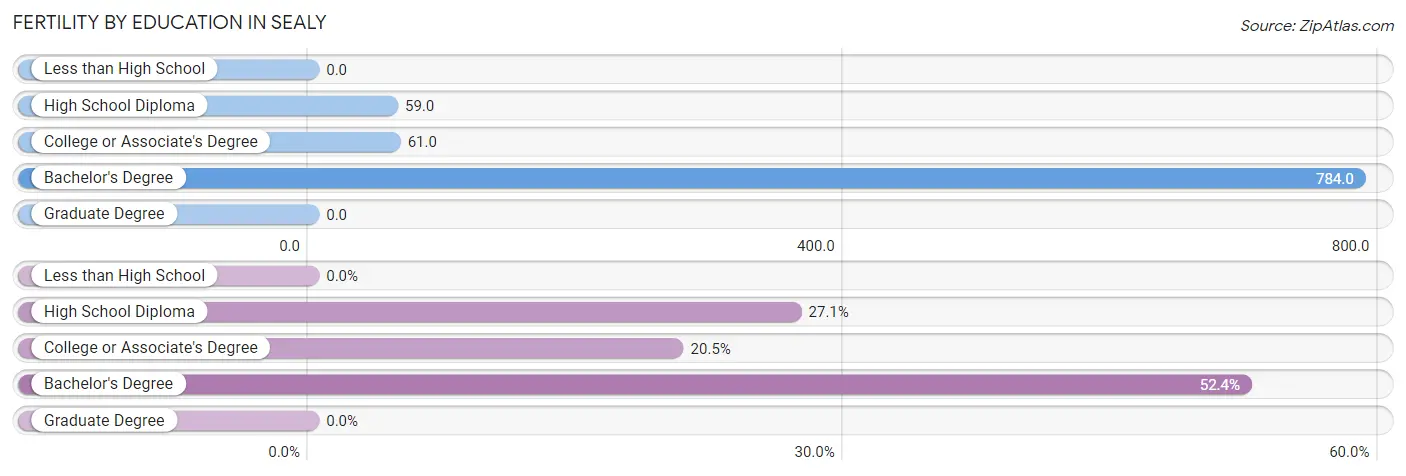
| Educational Attainment | Women with Births | Births / 1,000 Women |
| Less than High School | 0 (0.0%) | 0.0 |
| High School Diploma | 45 (27.1%) | 59.0 |
| College or Associate's Degree | 34 (20.5%) | 61.0 |
| Bachelor's Degree | 87 (52.4%) | 784.0 |
| Graduate Degree | 0 (0.0%) | 0.0 |
| Total | 166 (100.0%) | 94.0 |
Fertility by Education by Marriage Status in Sealy
47.6% of women with births in Sealy are unmarried. Women with the educational attainment of bachelor's degree are most likely to be married with 100.0% of them married at childbirth, while women with the educational attainment of high school diploma are least likely to be married with 100.0% of them unmarried at childbirth.
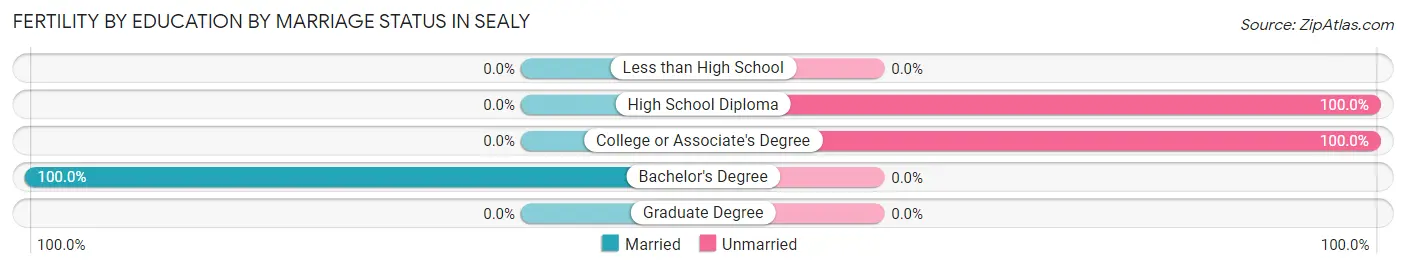
| Educational Attainment | Married | Unmarried |
| Less than High School | 0 (0.0%) | 0 (0.0%) |
| High School Diploma | 0 (0.0%) | 45 (100.0%) |
| College or Associate's Degree | 0 (0.0%) | 34 (100.0%) |
| Bachelor's Degree | 87 (100.0%) | 0 (0.0%) |
| Graduate Degree | 0 (0.0%) | 0 (0.0%) |
| Total | 87 (52.4%) | 79 (47.6%) |
Employment Characteristics in Sealy
Employment by Class of Employer in Sealy
Among the 3,197 employed individuals in Sealy, private company employees (2,537 | 79.4%), not-for-profit organizations (220 | 6.9%), and self-employed (not incorporated) (161 | 5.0%) make up the most common classes of employment.
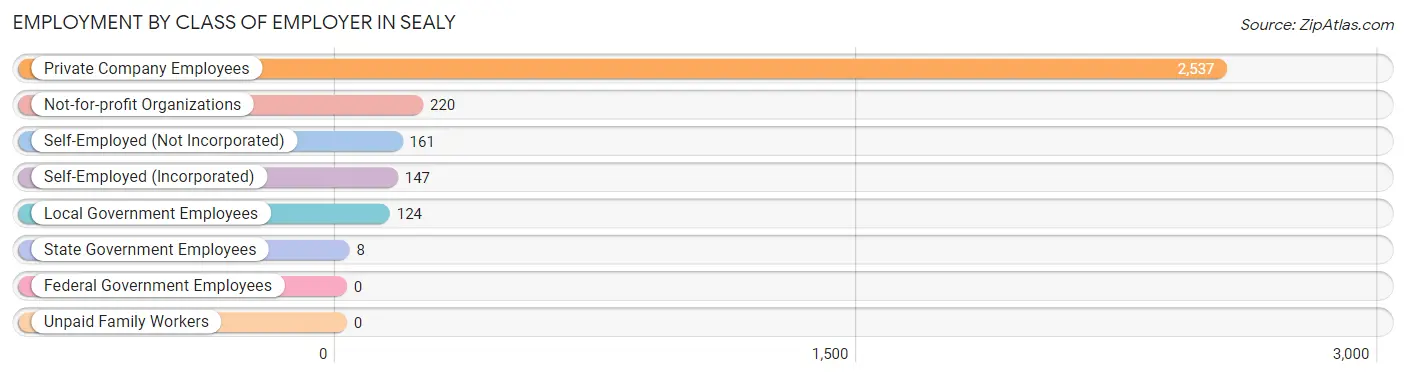
| Employer Class | # Employees | % Employees |
| Private Company Employees | 2,537 | 79.4% |
| Self-Employed (Incorporated) | 147 | 4.6% |
| Self-Employed (Not Incorporated) | 161 | 5.0% |
| Not-for-profit Organizations | 220 | 6.9% |
| Local Government Employees | 124 | 3.9% |
| State Government Employees | 8 | 0.3% |
| Federal Government Employees | 0 | 0.0% |
| Unpaid Family Workers | 0 | 0.0% |
| Total | 3,197 | 100.0% |
Employment Status by Age in Sealy
According to the labor force statistics for Sealy, out of the total population over 16 years of age (5,444), 62.7% or 3,413 individuals are in the labor force, with 5.7% or 195 of them unemployed. The age group with the highest labor force participation rate is 20 to 24 years, with 95.7% or 488 individuals in the labor force. Within the labor force, the 20 to 24 years age range has the highest percentage of unemployed individuals, with 17.0% or 83 of them being unemployed.
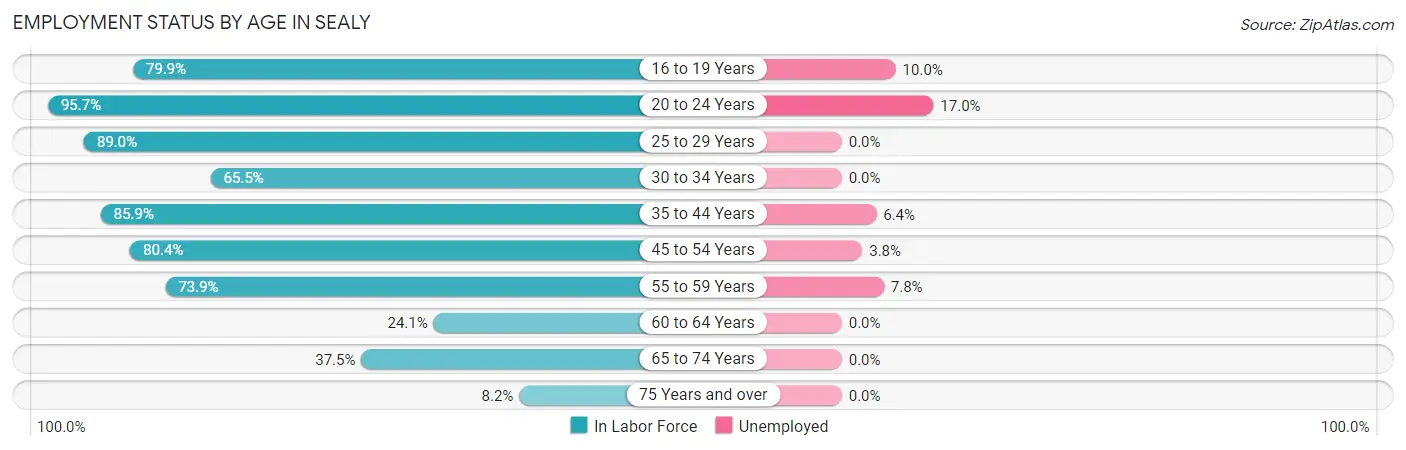
| Age Bracket | In Labor Force | Unemployed |
| 16 to 19 Years | 250 (79.9%) | 25 (10.0%) |
| 20 to 24 Years | 488 (95.7%) | 83 (17.0%) |
| 25 to 29 Years | 500 (89.0%) | 0 (0.0%) |
| 30 to 34 Years | 270 (65.5%) | 0 (0.0%) |
| 35 to 44 Years | 675 (85.9%) | 43 (6.4%) |
| 45 to 54 Years | 448 (80.4%) | 17 (3.8%) |
| 55 to 59 Years | 357 (73.9%) | 28 (7.8%) |
| 60 to 64 Years | 88 (24.1%) | 0 (0.0%) |
| 65 to 74 Years | 280 (37.5%) | 0 (0.0%) |
| 75 Years and over | 58 (8.2%) | 0 (0.0%) |
| Total | 3,413 (62.7%) | 195 (5.7%) |
Employment Status by Educational Attainment in Sealy
According to labor force statistics for Sealy, 73.9% of individuals (2,339) out of the total population between 25 and 64 years of age (3,165) are in the labor force, with 3.8% or 89 of them being unemployed. The group with the highest labor force participation rate are those with the educational attainment of college / associate degree, with 82.8% or 1,004 individuals in the labor force. Within the labor force, individuals with bachelor's degree or higher education have the highest percentage of unemployment, with 6.7% or 17 of them being unemployed.
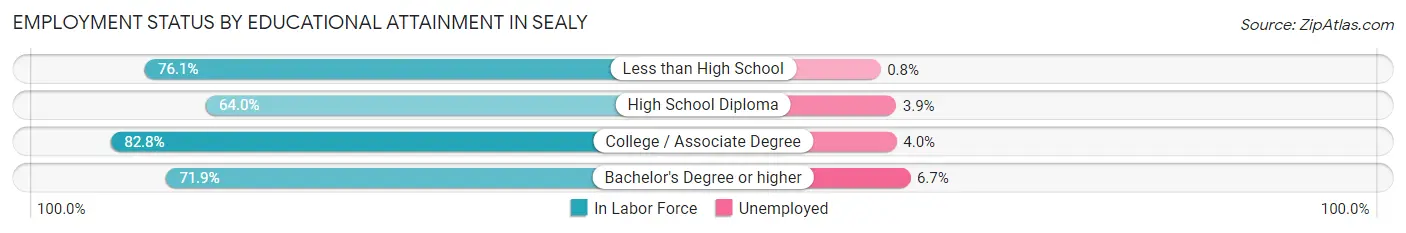
| Educational Attainment | In Labor Force | Unemployed |
| Less than High School | 359 (76.1%) | 4 (0.8%) |
| High School Diploma | 723 (64.0%) | 44 (3.9%) |
| College / Associate Degree | 1,004 (82.8%) | 48 (4.0%) |
| Bachelor's Degree or higher | 253 (71.9%) | 24 (6.7%) |
| Total | 2,339 (73.9%) | 120 (3.8%) |
Employment Occupations by Sex in Sealy
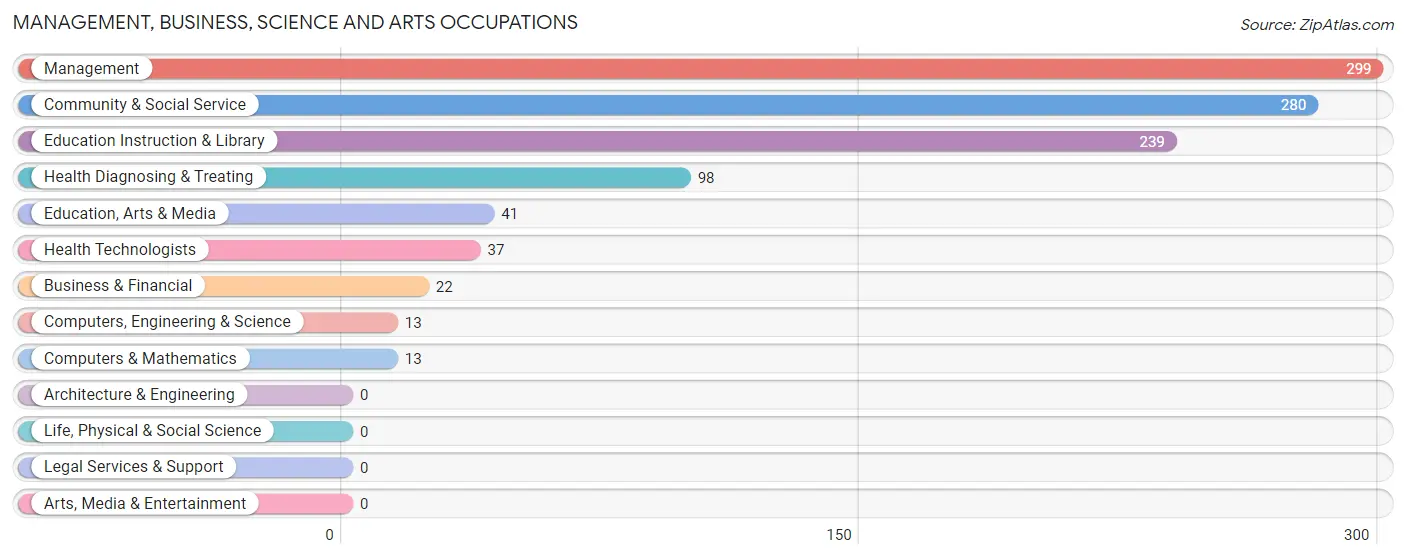
Management, Business, Science and Arts Occupations
The most common Management, Business, Science and Arts occupations in Sealy are Management (299 | 9.3%), Community & Social Service (280 | 8.7%), Education Instruction & Library (239 | 7.4%), Health Diagnosing & Treating (98 | 3.0%), and Education, Arts & Media (41 | 1.3%).
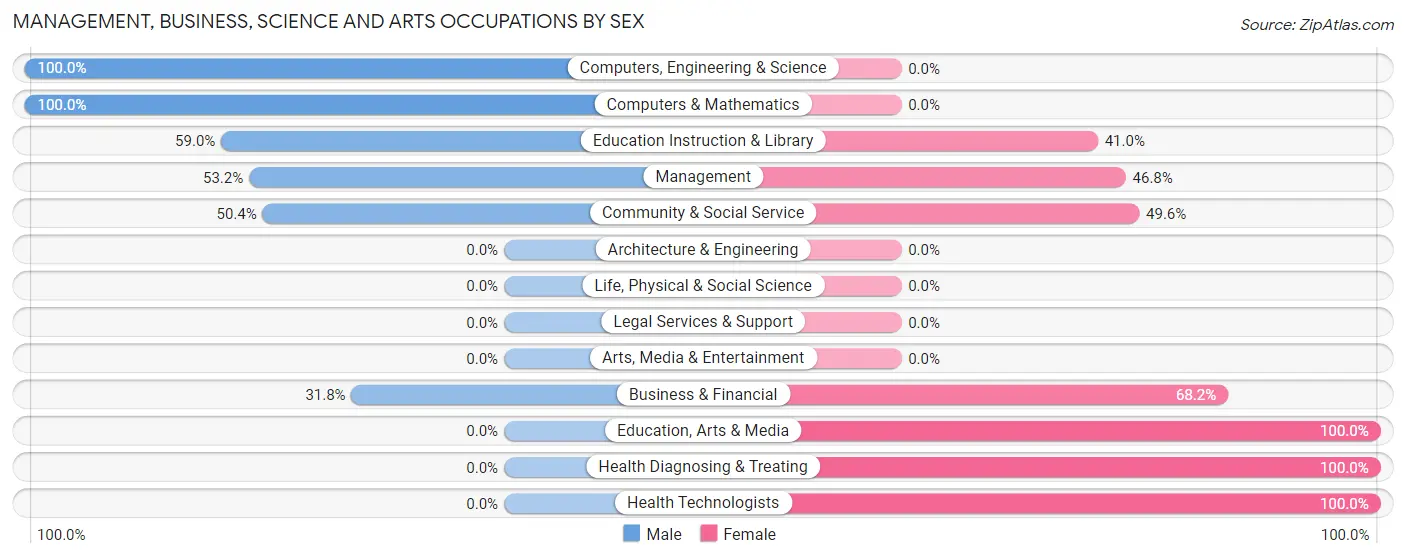
Management, Business, Science and Arts Occupations by Sex
Within the Management, Business, Science and Arts occupations in Sealy, the most male-oriented occupations are Computers, Engineering & Science (100.0%), Computers & Mathematics (100.0%), and Education Instruction & Library (59.0%), while the most female-oriented occupations are Education, Arts & Media (100.0%), Health Diagnosing & Treating (100.0%), and Health Technologists (100.0%).
| Occupation | Male | Female |
| Management | 159 (53.2%) | 140 (46.8%) |
| Business & Financial | 7 (31.8%) | 15 (68.2%) |
| Computers, Engineering & Science | 13 (100.0%) | 0 (0.0%) |
| Computers & Mathematics | 13 (100.0%) | 0 (0.0%) |
| Architecture & Engineering | 0 (0.0%) | 0 (0.0%) |
| Life, Physical & Social Science | 0 (0.0%) | 0 (0.0%) |
| Community & Social Service | 141 (50.4%) | 139 (49.6%) |
| Education, Arts & Media | 0 (0.0%) | 41 (100.0%) |
| Legal Services & Support | 0 (0.0%) | 0 (0.0%) |
| Education Instruction & Library | 141 (59.0%) | 98 (41.0%) |
| Arts, Media & Entertainment | 0 (0.0%) | 0 (0.0%) |
| Health Diagnosing & Treating | 0 (0.0%) | 98 (100.0%) |
| Health Technologists | 0 (0.0%) | 37 (100.0%) |
| Total (Category) | 320 (44.9%) | 392 (55.1%) |
| Total (Overall) | 1,482 (46.1%) | 1,736 (53.9%) |
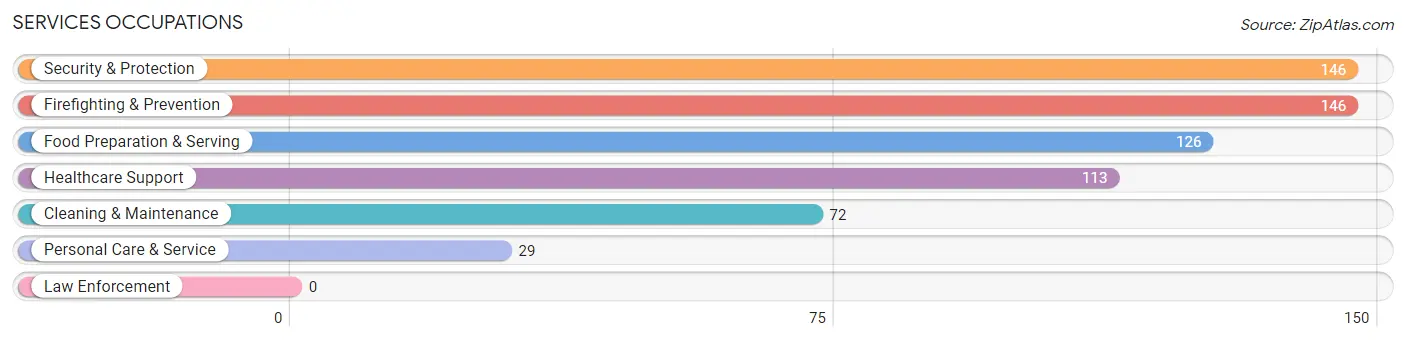
Services Occupations
The most common Services occupations in Sealy are Security & Protection (146 | 4.5%), Firefighting & Prevention (146 | 4.5%), Food Preparation & Serving (126 | 3.9%), Healthcare Support (113 | 3.5%), and Cleaning & Maintenance (72 | 2.2%).
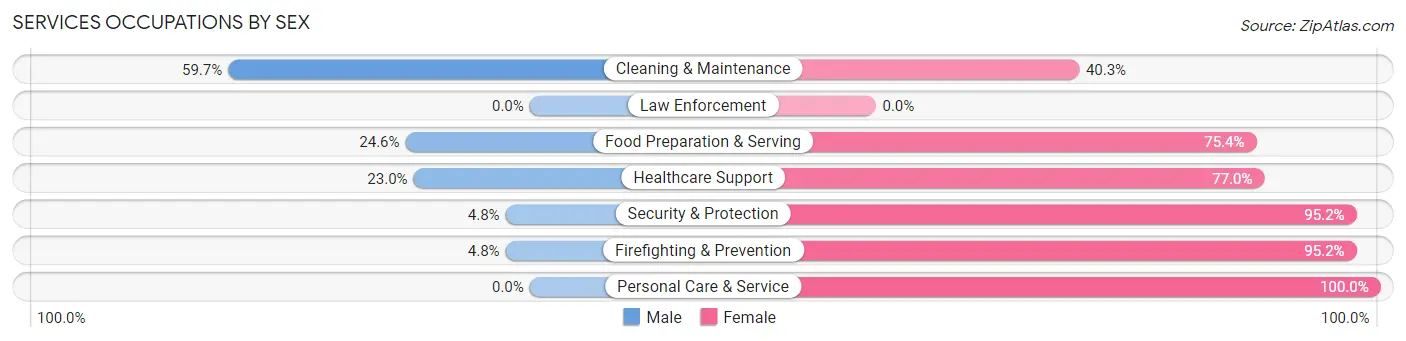
Services Occupations by Sex
Within the Services occupations in Sealy, the most male-oriented occupations are Cleaning & Maintenance (59.7%), Food Preparation & Serving (24.6%), and Healthcare Support (23.0%), while the most female-oriented occupations are Personal Care & Service (100.0%), Security & Protection (95.2%), and Firefighting & Prevention (95.2%).
| Occupation | Male | Female |
| Healthcare Support | 26 (23.0%) | 87 (77.0%) |
| Security & Protection | 7 (4.8%) | 139 (95.2%) |
| Firefighting & Prevention | 7 (4.8%) | 139 (95.2%) |
| Law Enforcement | 0 (0.0%) | 0 (0.0%) |
| Food Preparation & Serving | 31 (24.6%) | 95 (75.4%) |
| Cleaning & Maintenance | 43 (59.7%) | 29 (40.3%) |
| Personal Care & Service | 0 (0.0%) | 29 (100.0%) |
| Total (Category) | 107 (22.0%) | 379 (78.0%) |
| Total (Overall) | 1,482 (46.1%) | 1,736 (53.9%) |
Sales and Office Occupations
The most common Sales and Office occupations in Sealy are Office & Administration (493 | 15.3%), and Sales & Related (467 | 14.5%).
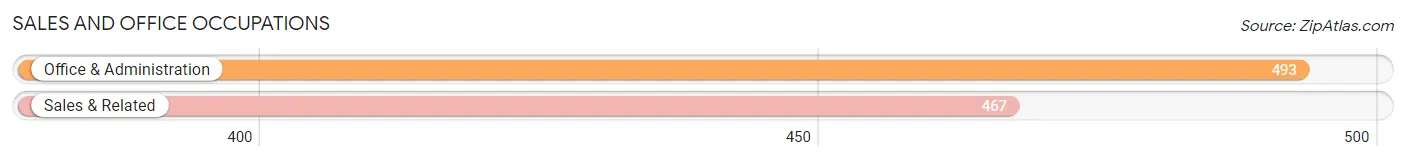
Sales and Office Occupations by Sex
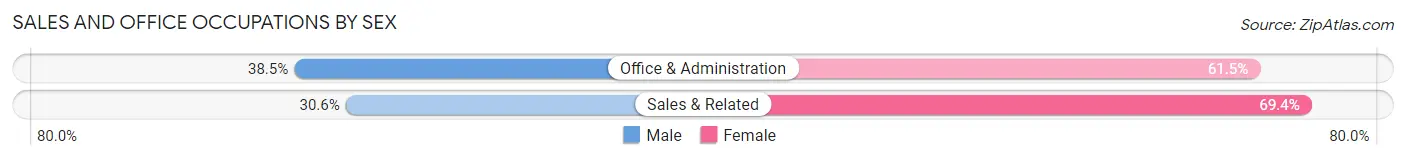
| Occupation | Male | Female |
| Sales & Related | 143 (30.6%) | 324 (69.4%) |
| Office & Administration | 190 (38.5%) | 303 (61.5%) |
| Total (Category) | 333 (34.7%) | 627 (65.3%) |
| Total (Overall) | 1,482 (46.1%) | 1,736 (53.9%) |
Natural Resources, Construction and Maintenance Occupations
The most common Natural Resources, Construction and Maintenance occupations in Sealy are Construction & Extraction (193 | 6.0%), Farming, Fishing & Forestry (51 | 1.6%), and Installation, Maintenance & Repair (33 | 1.0%).
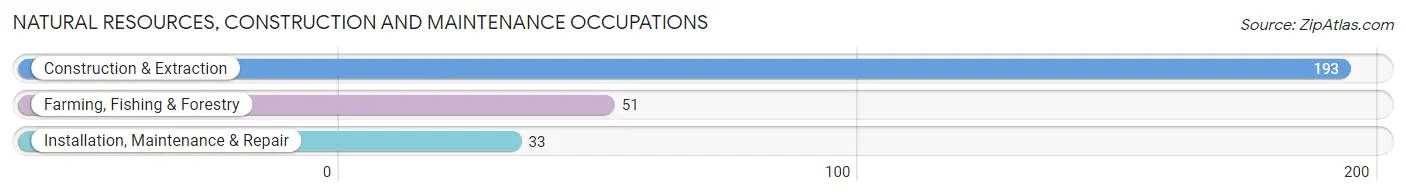
Natural Resources, Construction and Maintenance Occupations by Sex
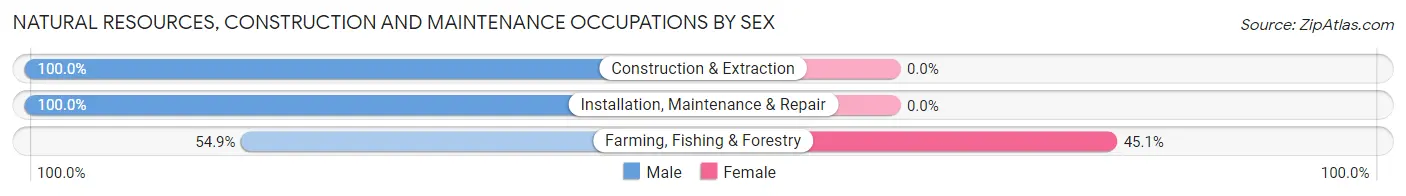
| Occupation | Male | Female |
| Farming, Fishing & Forestry | 28 (54.9%) | 23 (45.1%) |
| Construction & Extraction | 193 (100.0%) | 0 (0.0%) |
| Installation, Maintenance & Repair | 33 (100.0%) | 0 (0.0%) |
| Total (Category) | 254 (91.7%) | 23 (8.3%) |
| Total (Overall) | 1,482 (46.1%) | 1,736 (53.9%) |
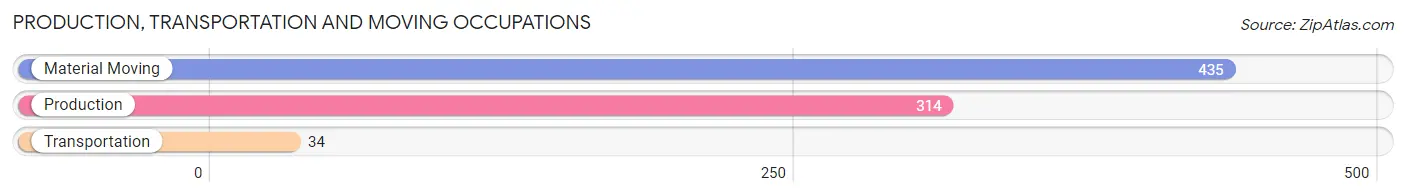
Production, Transportation and Moving Occupations
The most common Production, Transportation and Moving occupations in Sealy are Material Moving (435 | 13.5%), Production (314 | 9.8%), and Transportation (34 | 1.1%).
Production, Transportation and Moving Occupations by Sex
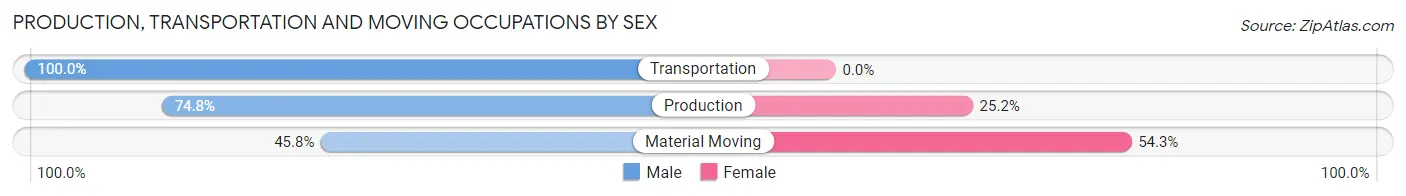
| Occupation | Male | Female |
| Production | 235 (74.8%) | 79 (25.2%) |
| Transportation | 34 (100.0%) | 0 (0.0%) |
| Material Moving | 199 (45.8%) | 236 (54.2%) |
| Total (Category) | 468 (59.8%) | 315 (40.2%) |
| Total (Overall) | 1,482 (46.1%) | 1,736 (53.9%) |
Employment Industries by Sex in Sealy
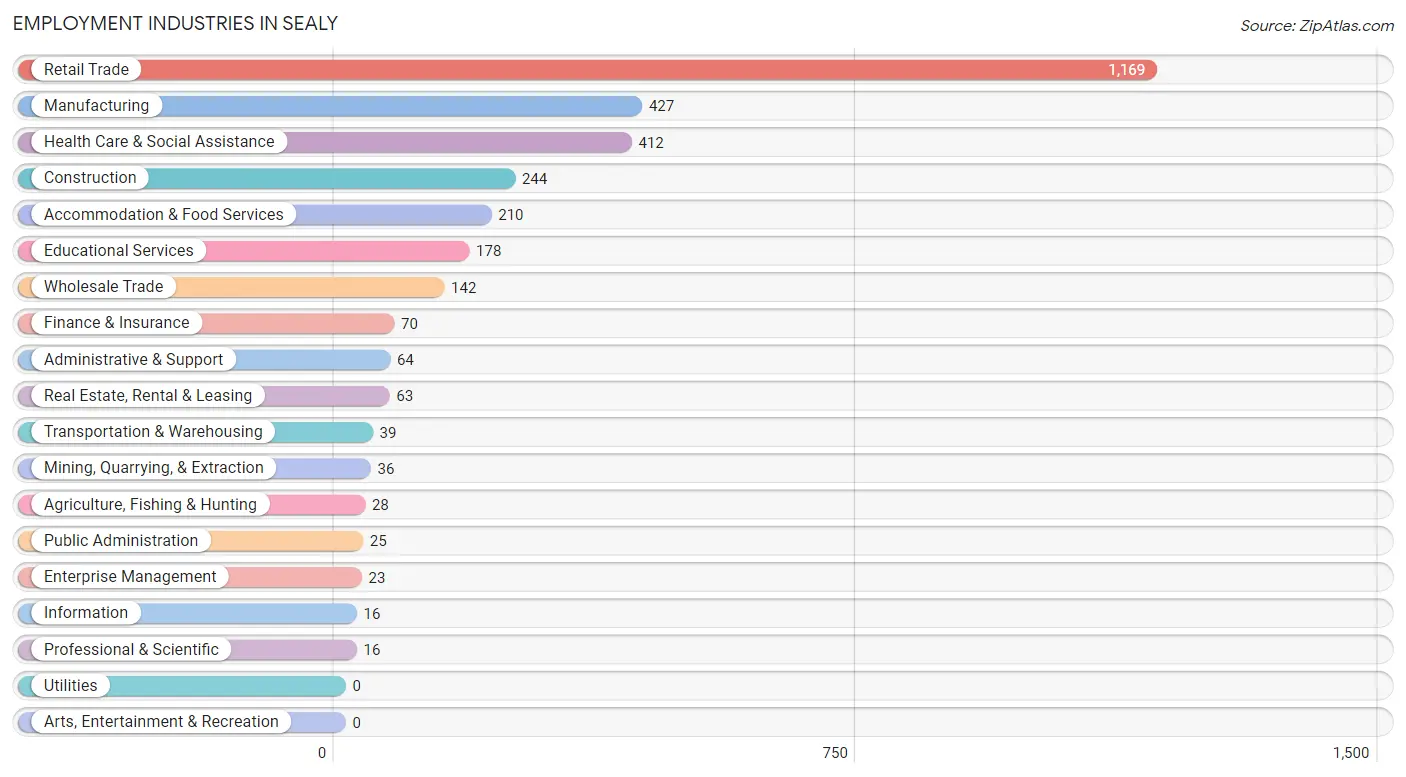
Employment Industries in Sealy
The major employment industries in Sealy include Retail Trade (1,169 | 36.3%), Manufacturing (427 | 13.3%), Health Care & Social Assistance (412 | 12.8%), Construction (244 | 7.6%), and Accommodation & Food Services (210 | 6.5%).
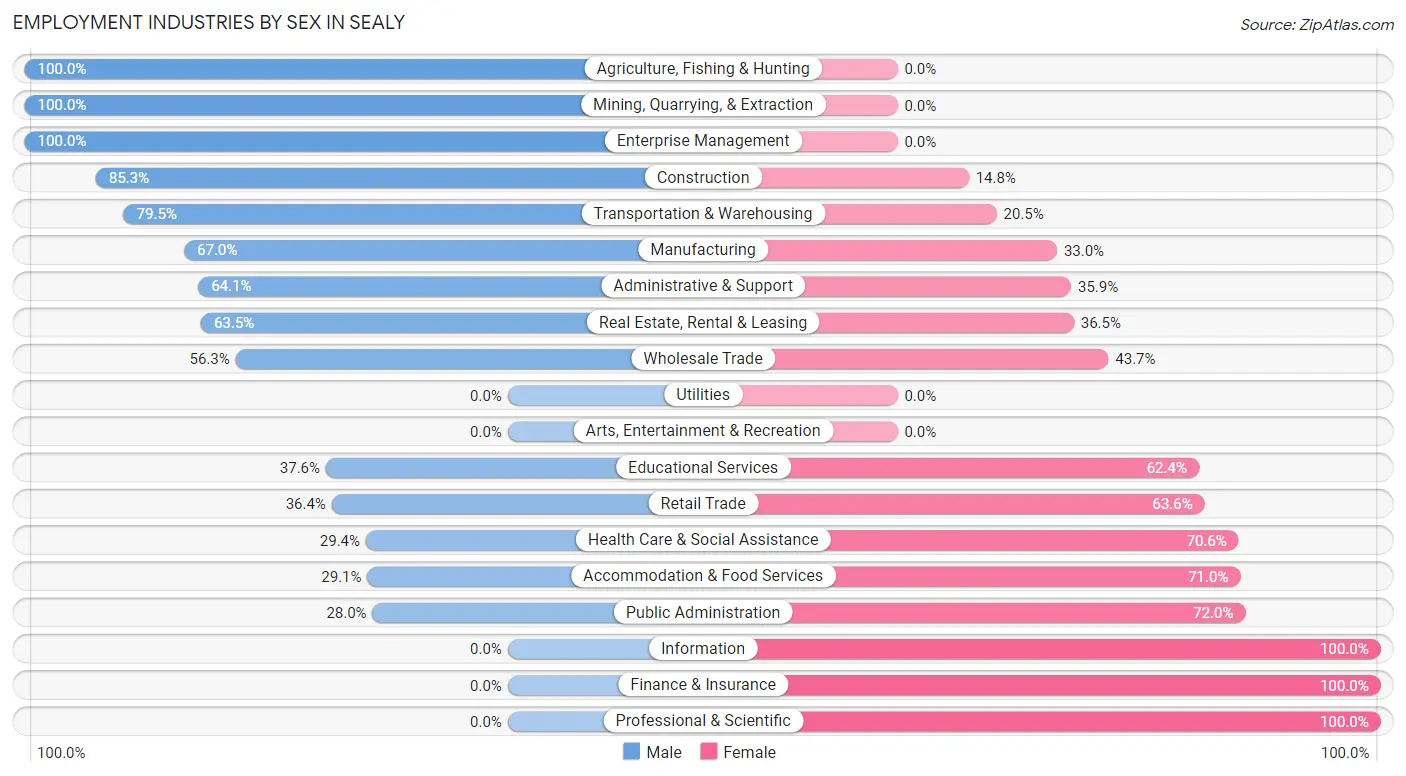
Employment Industries by Sex in Sealy
The Sealy industries that see more men than women are Agriculture, Fishing & Hunting (100.0%), Mining, Quarrying, & Extraction (100.0%), and Enterprise Management (100.0%), whereas the industries that tend to have a higher number of women are Information (100.0%), Finance & Insurance (100.0%), and Professional & Scientific (100.0%).
| Industry | Male | Female |
| Agriculture, Fishing & Hunting | 28 (100.0%) | 0 (0.0%) |
| Mining, Quarrying, & Extraction | 36 (100.0%) | 0 (0.0%) |
| Construction | 208 (85.3%) | 36 (14.7%) |
| Manufacturing | 286 (67.0%) | 141 (33.0%) |
| Wholesale Trade | 80 (56.3%) | 62 (43.7%) |
| Retail Trade | 426 (36.4%) | 743 (63.6%) |
| Transportation & Warehousing | 31 (79.5%) | 8 (20.5%) |
| Utilities | 0 (0.0%) | 0 (0.0%) |
| Information | 0 (0.0%) | 16 (100.0%) |
| Finance & Insurance | 0 (0.0%) | 70 (100.0%) |
| Real Estate, Rental & Leasing | 40 (63.5%) | 23 (36.5%) |
| Professional & Scientific | 0 (0.0%) | 16 (100.0%) |
| Enterprise Management | 23 (100.0%) | 0 (0.0%) |
| Administrative & Support | 41 (64.1%) | 23 (35.9%) |
| Educational Services | 67 (37.6%) | 111 (62.4%) |
| Health Care & Social Assistance | 121 (29.4%) | 291 (70.6%) |
| Arts, Entertainment & Recreation | 0 (0.0%) | 0 (0.0%) |
| Accommodation & Food Services | 61 (29.0%) | 149 (71.0%) |
| Public Administration | 7 (28.0%) | 18 (72.0%) |
| Total | 1,482 (46.1%) | 1,736 (53.9%) |
Education in Sealy
School Enrollment in Sealy
The most common levels of schooling among the 1,271 students in Sealy are middle school (342 | 26.9%), elementary school (262 | 20.6%), and high school (237 | 18.6%).
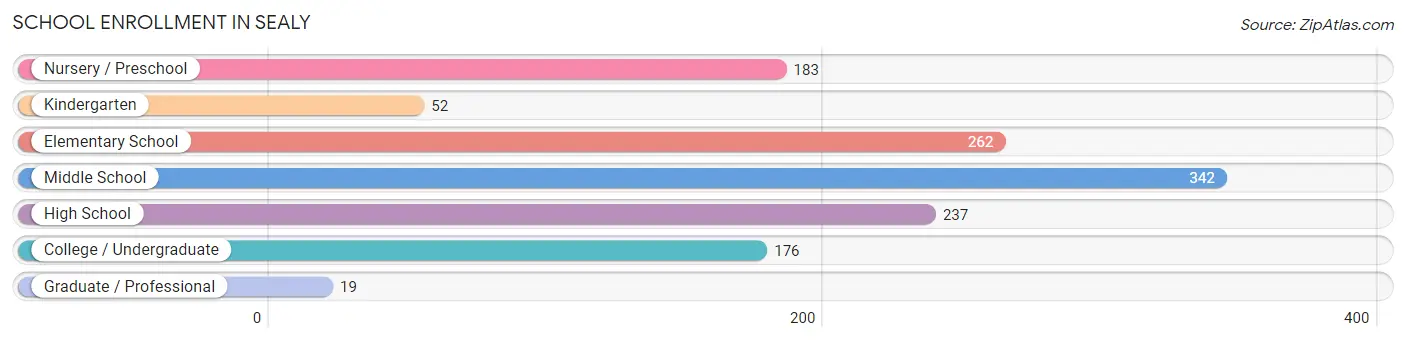
| School Level | # Students | % Students |
| Nursery / Preschool | 183 | 14.4% |
| Kindergarten | 52 | 4.1% |
| Elementary School | 262 | 20.6% |
| Middle School | 342 | 26.9% |
| High School | 237 | 18.6% |
| College / Undergraduate | 176 | 13.9% |
| Graduate / Professional | 19 | 1.5% |
| Total | 1,271 | 100.0% |
School Enrollment by Age by Funding Source in Sealy
Out of a total of 1,271 students who are enrolled in schools in Sealy, 145 (11.4%) attend a private institution, while the remaining 1,126 (88.6%) are enrolled in public schools. The age group of 20 to 24 year olds has the highest likelihood of being enrolled in private schools, with 81 (84.4% in the age bracket) enrolled. Conversely, the age group of 5 to 9 year old has the lowest likelihood of being enrolled in a private school, with 314 (100.0% in the age bracket) attending a public institution.
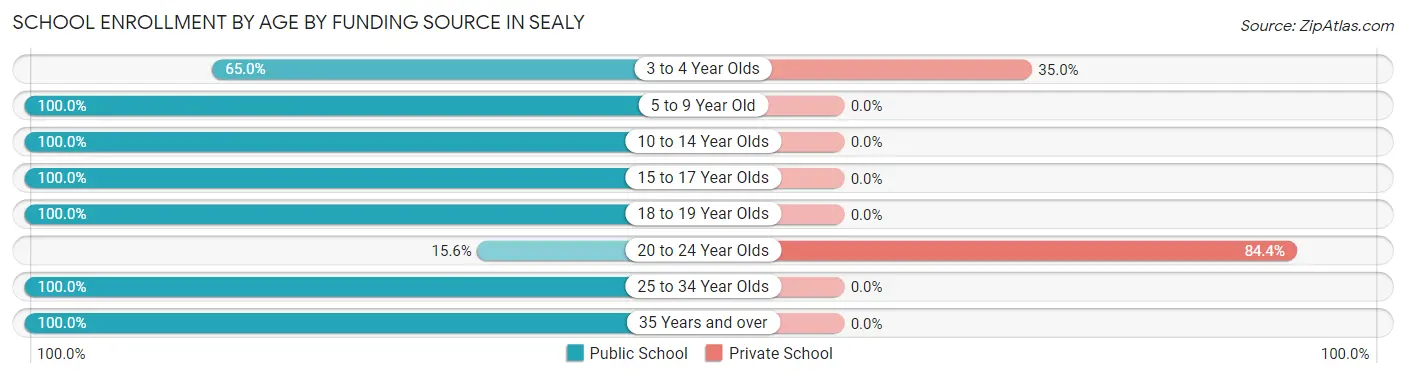
| Age Bracket | Public School | Private School |
| 3 to 4 Year Olds | 119 (65.0%) | 64 (35.0%) |
| 5 to 9 Year Old | 314 (100.0%) | 0 (0.0%) |
| 10 to 14 Year Olds | 377 (100.0%) | 0 (0.0%) |
| 15 to 17 Year Olds | 183 (100.0%) | 0 (0.0%) |
| 18 to 19 Year Olds | 19 (100.0%) | 0 (0.0%) |
| 20 to 24 Year Olds | 15 (15.6%) | 81 (84.4%) |
| 25 to 34 Year Olds | 82 (100.0%) | 0 (0.0%) |
| 35 Years and over | 17 (100.0%) | 0 (0.0%) |
| Total | 1,126 (88.6%) | 145 (11.4%) |
Educational Attainment by Field of Study in Sealy
Education (275 | 38.1%), business (194 | 26.9%), science & technology (61 | 8.5%), arts & humanities (58 | 8.0%), and physical & health sciences (31 | 4.3%) are the most common fields of study among 722 individuals in Sealy who have obtained a bachelor's degree or higher.
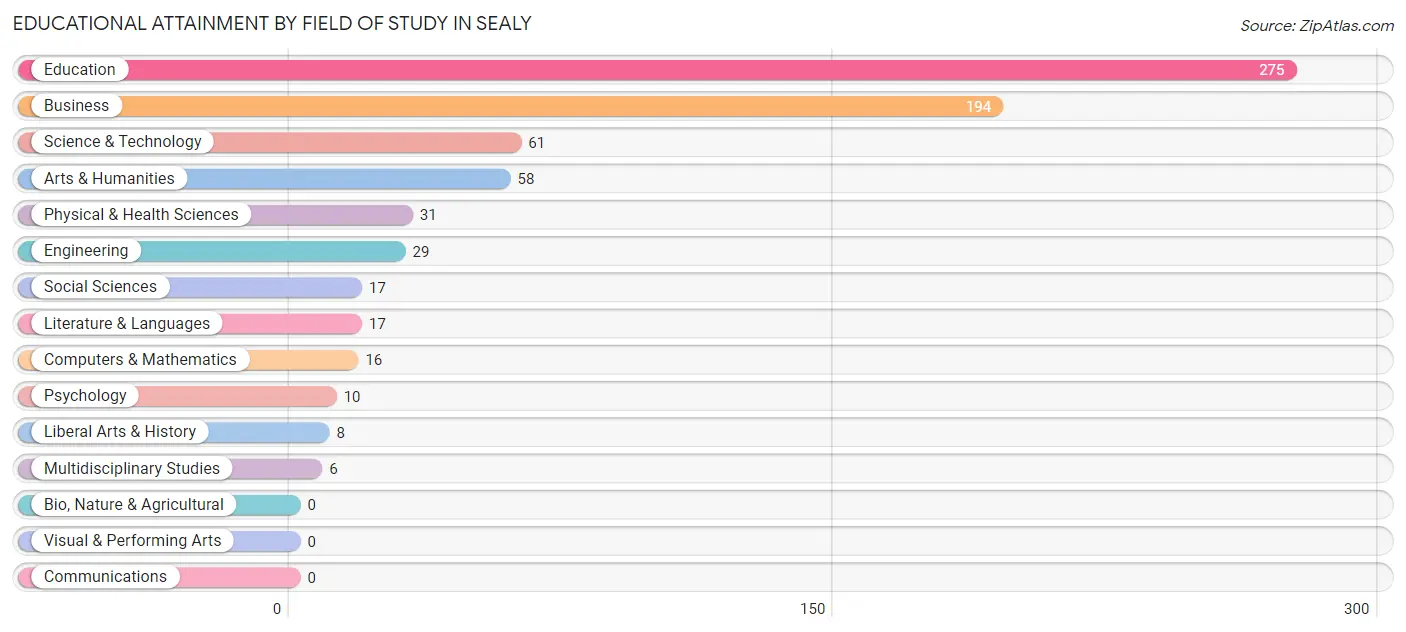
| Field of Study | # Graduates | % Graduates |
| Computers & Mathematics | 16 | 2.2% |
| Bio, Nature & Agricultural | 0 | 0.0% |
| Physical & Health Sciences | 31 | 4.3% |
| Psychology | 10 | 1.4% |
| Social Sciences | 17 | 2.4% |
| Engineering | 29 | 4.0% |
| Multidisciplinary Studies | 6 | 0.8% |
| Science & Technology | 61 | 8.5% |
| Business | 194 | 26.9% |
| Education | 275 | 38.1% |
| Literature & Languages | 17 | 2.4% |
| Liberal Arts & History | 8 | 1.1% |
| Visual & Performing Arts | 0 | 0.0% |
| Communications | 0 | 0.0% |
| Arts & Humanities | 58 | 8.0% |
| Total | 722 | 100.0% |
Transportation & Commute in Sealy
Vehicle Availability by Sex in Sealy
The most prevalent vehicle ownership categories in Sealy are males with 2 vehicles (658, accounting for 44.4%) and females with 2 vehicles (568, making up 38.4%).
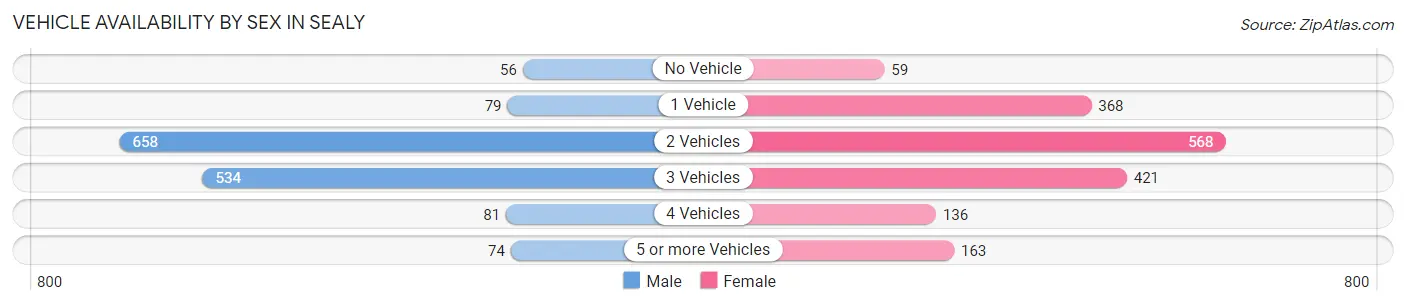
| Vehicles Available | Male | Female |
| No Vehicle | 56 (3.8%) | 59 (3.4%) |
| 1 Vehicle | 79 (5.3%) | 368 (21.5%) |
| 2 Vehicles | 658 (44.4%) | 568 (33.1%) |
| 3 Vehicles | 534 (36.0%) | 421 (24.5%) |
| 4 Vehicles | 81 (5.5%) | 136 (7.9%) |
| 5 or more Vehicles | 74 (5.0%) | 163 (9.5%) |
| Total | 1,482 (100.0%) | 1,715 (100.0%) |
Commute Time in Sealy
The most frequently occuring commute durations in Sealy are 10 to 14 minutes (772 commuters, 25.2%), 5 to 9 minutes (450 commuters, 14.7%), and 30 to 34 minutes (348 commuters, 11.3%).
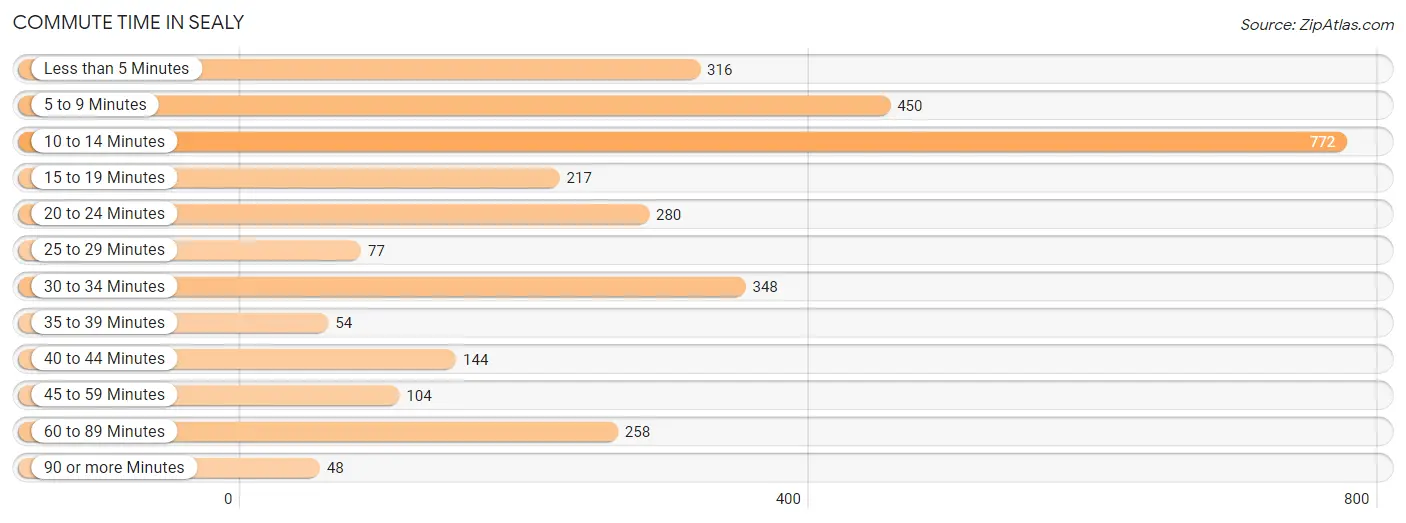
| Commute Time | # Commuters | % Commuters |
| Less than 5 Minutes | 316 | 10.3% |
| 5 to 9 Minutes | 450 | 14.7% |
| 10 to 14 Minutes | 772 | 25.2% |
| 15 to 19 Minutes | 217 | 7.1% |
| 20 to 24 Minutes | 280 | 9.1% |
| 25 to 29 Minutes | 77 | 2.5% |
| 30 to 34 Minutes | 348 | 11.3% |
| 35 to 39 Minutes | 54 | 1.8% |
| 40 to 44 Minutes | 144 | 4.7% |
| 45 to 59 Minutes | 104 | 3.4% |
| 60 to 89 Minutes | 258 | 8.4% |
| 90 or more Minutes | 48 | 1.6% |
Commute Time by Sex in Sealy
The most common commute times in Sealy are 10 to 14 minutes (369 commuters, 27.1%) for males and 10 to 14 minutes (403 commuters, 23.6%) for females.
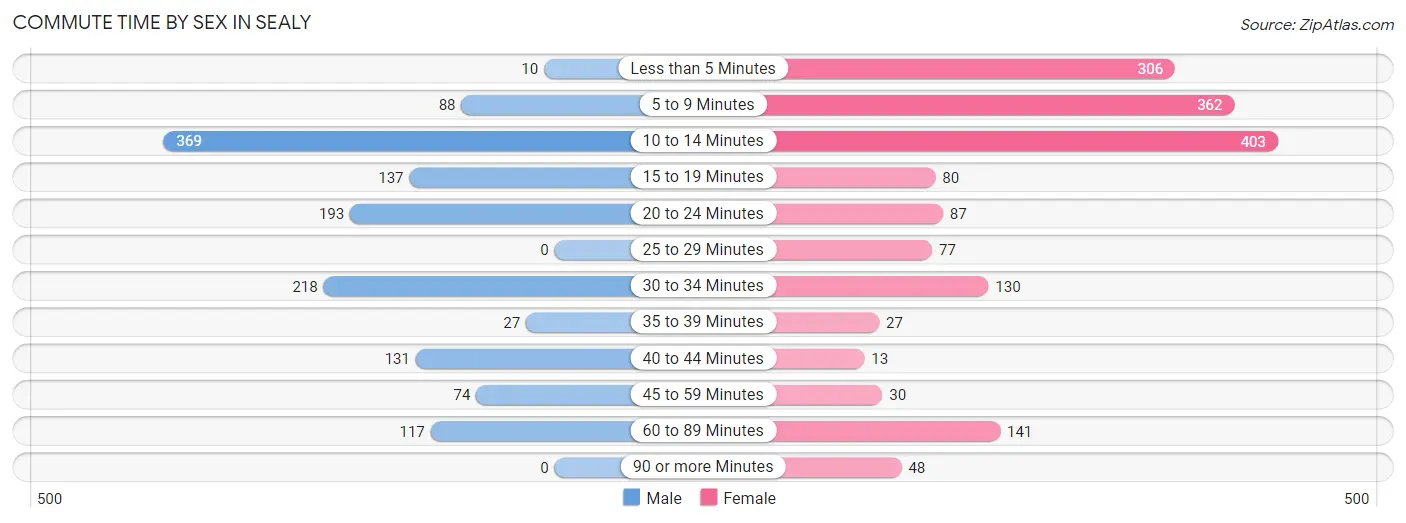
| Commute Time | Male | Female |
| Less than 5 Minutes | 10 (0.7%) | 306 (18.0%) |
| 5 to 9 Minutes | 88 (6.5%) | 362 (21.2%) |
| 10 to 14 Minutes | 369 (27.1%) | 403 (23.6%) |
| 15 to 19 Minutes | 137 (10.0%) | 80 (4.7%) |
| 20 to 24 Minutes | 193 (14.1%) | 87 (5.1%) |
| 25 to 29 Minutes | 0 (0.0%) | 77 (4.5%) |
| 30 to 34 Minutes | 218 (16.0%) | 130 (7.6%) |
| 35 to 39 Minutes | 27 (2.0%) | 27 (1.6%) |
| 40 to 44 Minutes | 131 (9.6%) | 13 (0.8%) |
| 45 to 59 Minutes | 74 (5.4%) | 30 (1.8%) |
| 60 to 89 Minutes | 117 (8.6%) | 141 (8.3%) |
| 90 or more Minutes | 0 (0.0%) | 48 (2.8%) |
Time of Departure to Work by Sex in Sealy
The most frequent times of departure to work in Sealy are 6:00 AM to 6:29 AM (338, 24.8%) for males and 12:00 PM to 3:59 PM (433, 25.4%) for females.
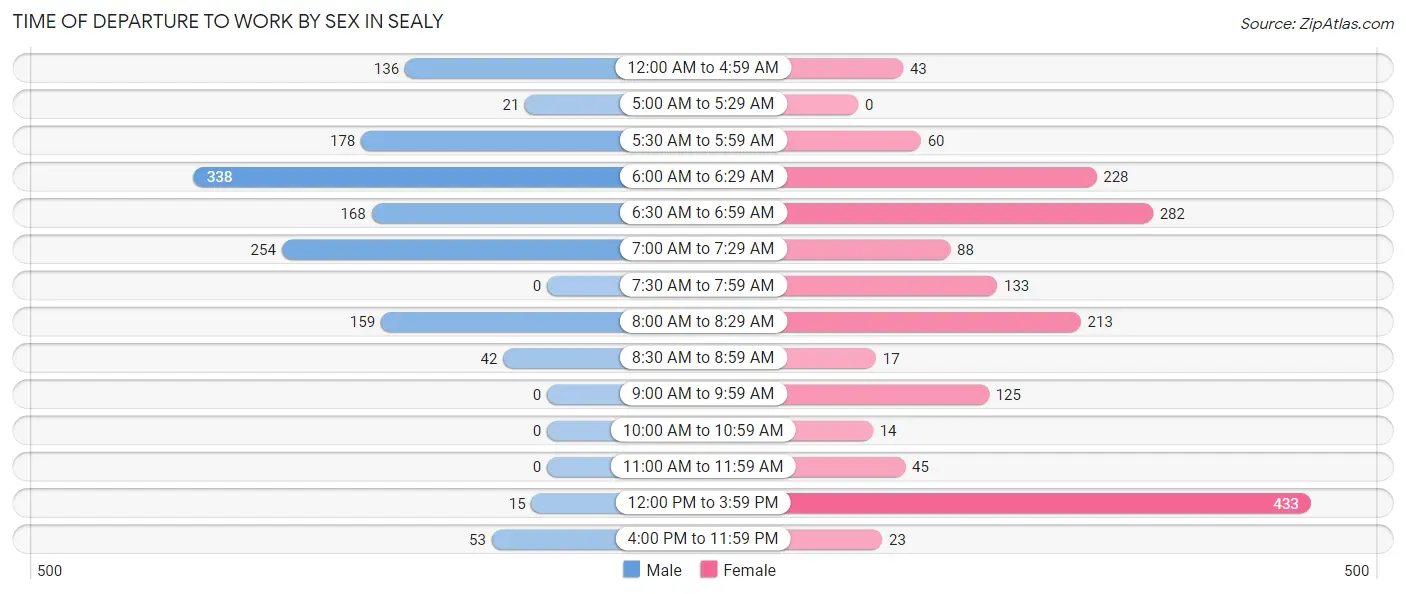
| Time of Departure | Male | Female |
| 12:00 AM to 4:59 AM | 136 (10.0%) | 43 (2.5%) |
| 5:00 AM to 5:29 AM | 21 (1.5%) | 0 (0.0%) |
| 5:30 AM to 5:59 AM | 178 (13.1%) | 60 (3.5%) |
| 6:00 AM to 6:29 AM | 338 (24.8%) | 228 (13.4%) |
| 6:30 AM to 6:59 AM | 168 (12.3%) | 282 (16.6%) |
| 7:00 AM to 7:29 AM | 254 (18.6%) | 88 (5.2%) |
| 7:30 AM to 7:59 AM | 0 (0.0%) | 133 (7.8%) |
| 8:00 AM to 8:29 AM | 159 (11.7%) | 213 (12.5%) |
| 8:30 AM to 8:59 AM | 42 (3.1%) | 17 (1.0%) |
| 9:00 AM to 9:59 AM | 0 (0.0%) | 125 (7.3%) |
| 10:00 AM to 10:59 AM | 0 (0.0%) | 14 (0.8%) |
| 11:00 AM to 11:59 AM | 0 (0.0%) | 45 (2.6%) |
| 12:00 PM to 3:59 PM | 15 (1.1%) | 433 (25.4%) |
| 4:00 PM to 11:59 PM | 53 (3.9%) | 23 (1.3%) |
| Total | 1,364 (100.0%) | 1,704 (100.0%) |
Housing Occupancy in Sealy
Occupancy by Ownership in Sealy
Of the total 2,748 dwellings in Sealy, owner-occupied units account for 2,016 (73.4%), while renter-occupied units make up 732 (26.6%).
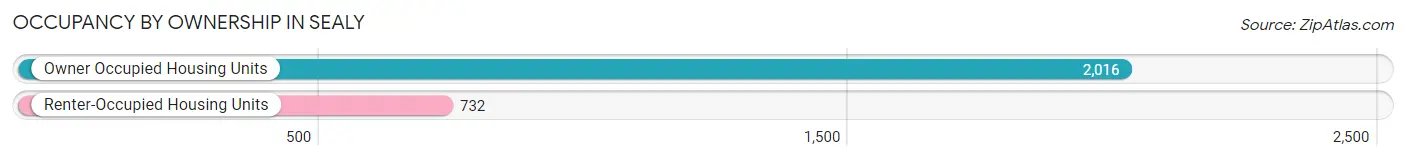
| Occupancy | # Housing Units | % Housing Units |
| Owner Occupied Housing Units | 2,016 | 73.4% |
| Renter-Occupied Housing Units | 732 | 26.6% |
| Total Occupied Housing Units | 2,748 | 100.0% |
Occupancy by Household Size in Sealy
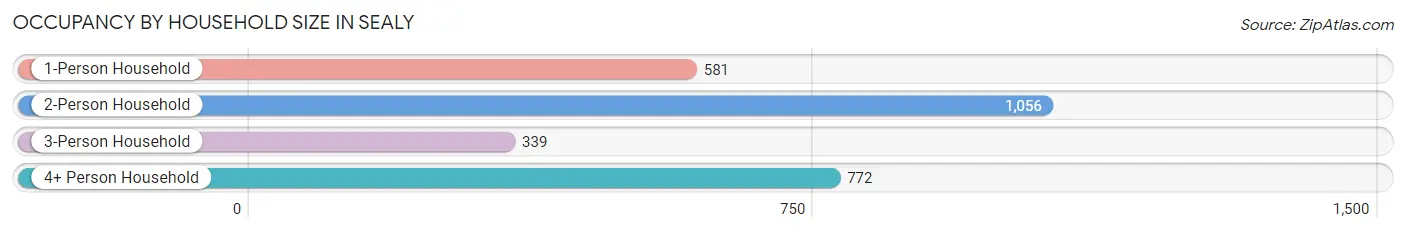
| Household Size | # Housing Units | % Housing Units |
| 1-Person Household | 581 | 21.1% |
| 2-Person Household | 1,056 | 38.4% |
| 3-Person Household | 339 | 12.3% |
| 4+ Person Household | 772 | 28.1% |
| Total Housing Units | 2,748 | 100.0% |
Occupancy by Ownership by Household Size in Sealy
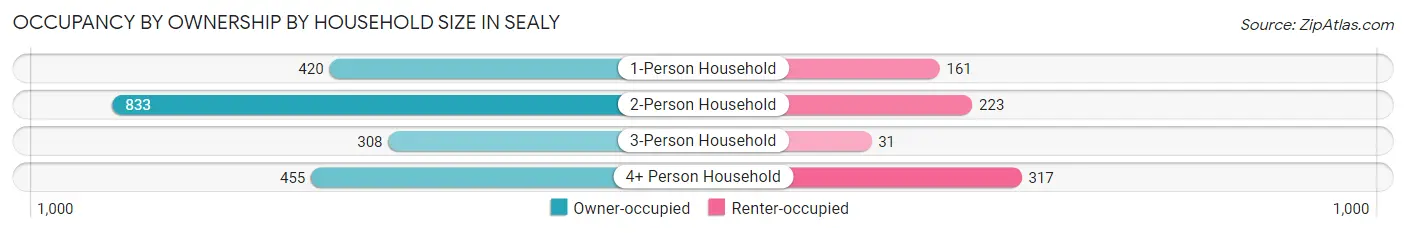
| Household Size | Owner-occupied | Renter-occupied |
| 1-Person Household | 420 (72.3%) | 161 (27.7%) |
| 2-Person Household | 833 (78.9%) | 223 (21.1%) |
| 3-Person Household | 308 (90.9%) | 31 (9.1%) |
| 4+ Person Household | 455 (58.9%) | 317 (41.1%) |
| Total Housing Units | 2,016 (73.4%) | 732 (26.6%) |
Occupancy by Educational Attainment in Sealy
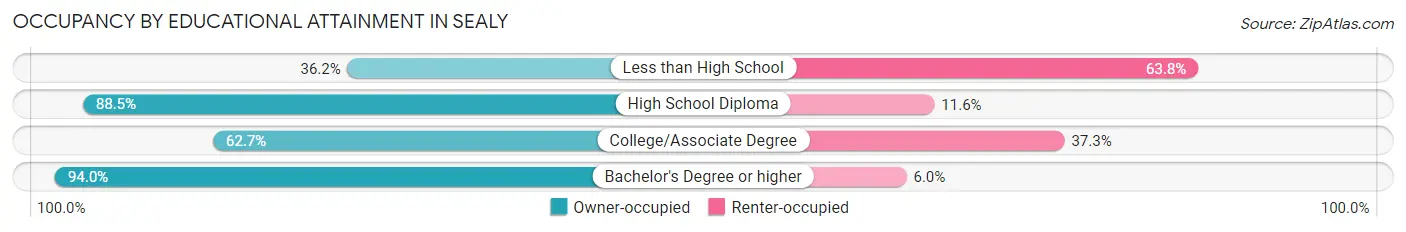
| Household Size | Owner-occupied | Renter-occupied |
| Less than High School | 149 (36.2%) | 263 (63.8%) |
| High School Diploma | 919 (88.4%) | 120 (11.6%) |
| College/Associate Degree | 542 (62.7%) | 323 (37.3%) |
| Bachelor's Degree or higher | 406 (94.0%) | 26 (6.0%) |
Occupancy by Age of Householder in Sealy
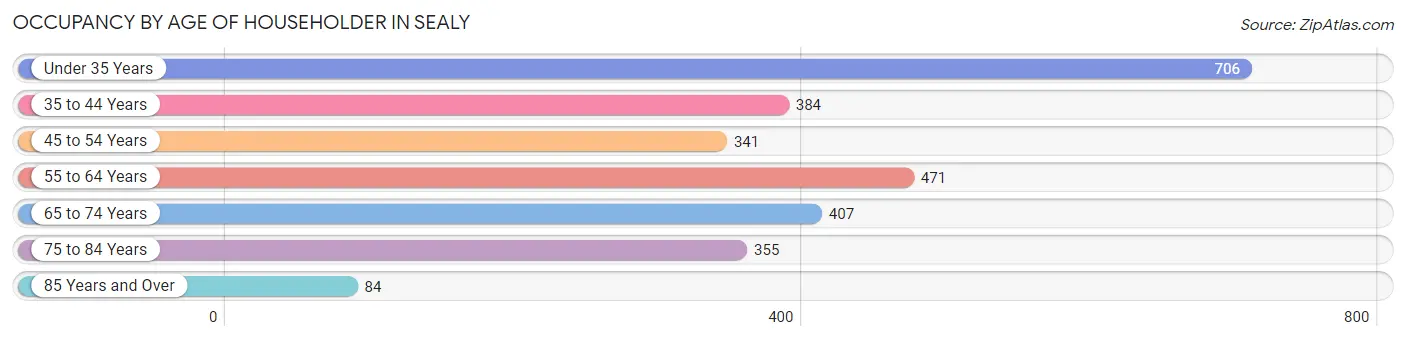
| Age Bracket | # Households | % Households |
| Under 35 Years | 706 | 25.7% |
| 35 to 44 Years | 384 | 14.0% |
| 45 to 54 Years | 341 | 12.4% |
| 55 to 64 Years | 471 | 17.1% |
| 65 to 74 Years | 407 | 14.8% |
| 75 to 84 Years | 355 | 12.9% |
| 85 Years and Over | 84 | 3.1% |
| Total | 2,748 | 100.0% |
Housing Finances in Sealy
Median Income by Occupancy in Sealy
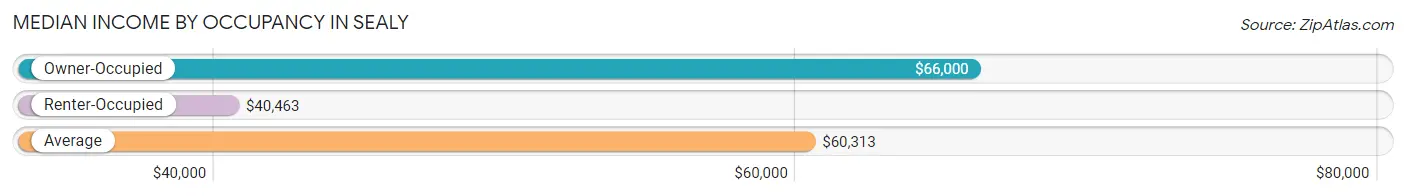
| Occupancy Type | # Households | Median Income |
| Owner-Occupied | 2,016 (73.4%) | $66,000 |
| Renter-Occupied | 732 (26.6%) | $40,463 |
| Average | 2,748 (100.0%) | $60,313 |
Occupancy by Householder Income Bracket in Sealy
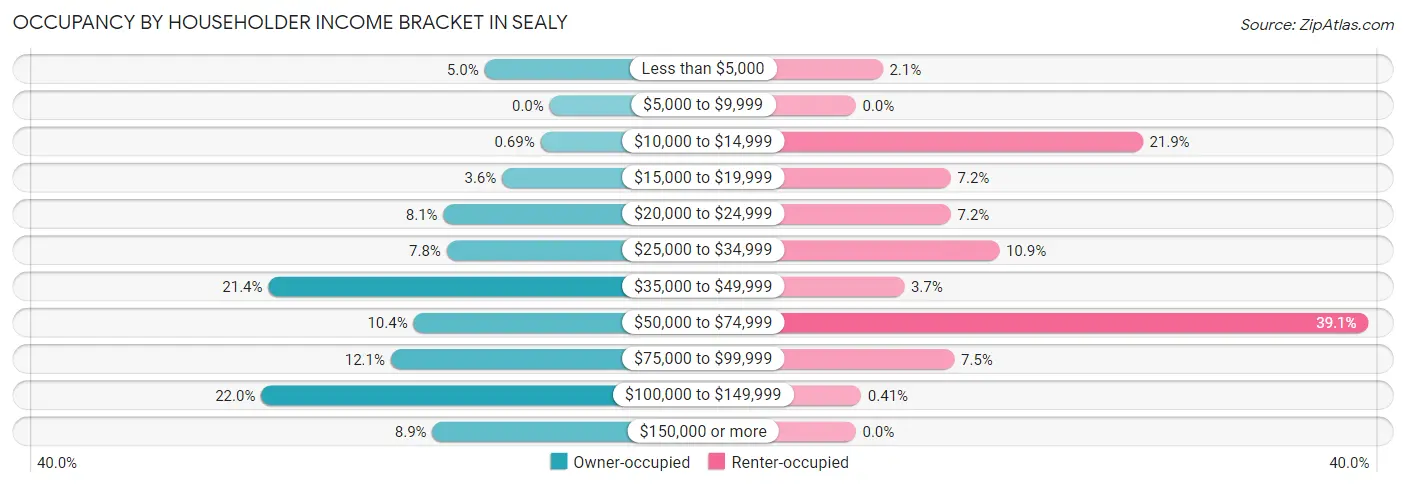
| Income Bracket | Owner-occupied | Renter-occupied |
| Less than $5,000 | 100 (5.0%) | 15 (2.1%) |
| $5,000 to $9,999 | 0 (0.0%) | 0 (0.0%) |
| $10,000 to $14,999 | 14 (0.7%) | 160 (21.9%) |
| $15,000 to $19,999 | 73 (3.6%) | 53 (7.2%) |
| $20,000 to $24,999 | 163 (8.1%) | 53 (7.2%) |
| $25,000 to $34,999 | 158 (7.8%) | 80 (10.9%) |
| $35,000 to $49,999 | 432 (21.4%) | 27 (3.7%) |
| $50,000 to $74,999 | 209 (10.4%) | 286 (39.1%) |
| $75,000 to $99,999 | 244 (12.1%) | 55 (7.5%) |
| $100,000 to $149,999 | 443 (22.0%) | 3 (0.4%) |
| $150,000 or more | 180 (8.9%) | 0 (0.0%) |
| Total | 2,016 (100.0%) | 732 (100.0%) |
Monthly Housing Cost Tiers in Sealy
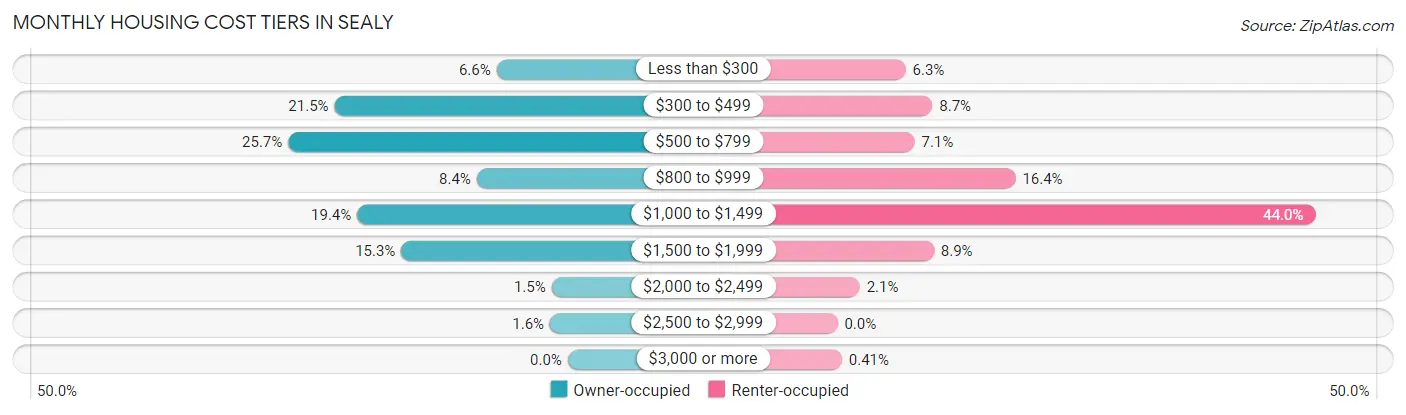
| Monthly Cost | Owner-occupied | Renter-occupied |
| Less than $300 | 132 (6.6%) | 46 (6.3%) |
| $300 to $499 | 433 (21.5%) | 64 (8.7%) |
| $500 to $799 | 519 (25.7%) | 52 (7.1%) |
| $800 to $999 | 169 (8.4%) | 120 (16.4%) |
| $1,000 to $1,499 | 391 (19.4%) | 322 (44.0%) |
| $1,500 to $1,999 | 309 (15.3%) | 65 (8.9%) |
| $2,000 to $2,499 | 30 (1.5%) | 15 (2.1%) |
| $2,500 to $2,999 | 33 (1.6%) | 0 (0.0%) |
| $3,000 or more | 0 (0.0%) | 3 (0.4%) |
| Total | 2,016 (100.0%) | 732 (100.0%) |
Physical Housing Characteristics in Sealy
Housing Structures in Sealy
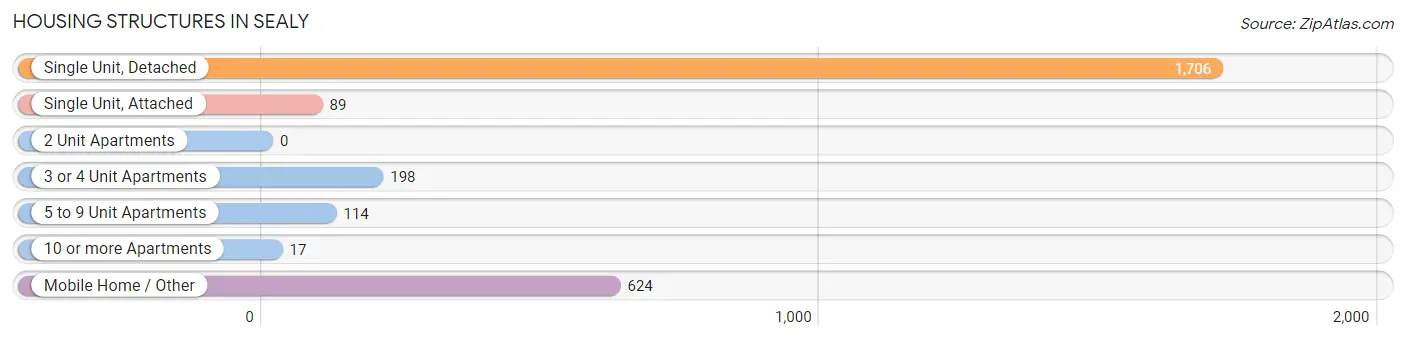
| Structure Type | # Housing Units | % Housing Units |
| Single Unit, Detached | 1,706 | 62.1% |
| Single Unit, Attached | 89 | 3.2% |
| 2 Unit Apartments | 0 | 0.0% |
| 3 or 4 Unit Apartments | 198 | 7.2% |
| 5 to 9 Unit Apartments | 114 | 4.2% |
| 10 or more Apartments | 17 | 0.6% |
| Mobile Home / Other | 624 | 22.7% |
| Total | 2,748 | 100.0% |
Housing Structures by Occupancy in Sealy
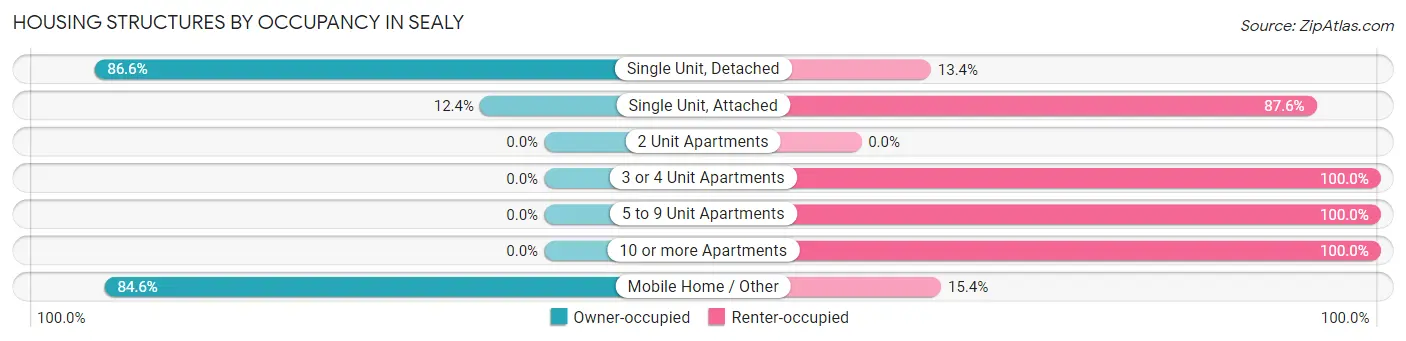
| Structure Type | Owner-occupied | Renter-occupied |
| Single Unit, Detached | 1,477 (86.6%) | 229 (13.4%) |
| Single Unit, Attached | 11 (12.4%) | 78 (87.6%) |
| 2 Unit Apartments | 0 (0.0%) | 0 (0.0%) |
| 3 or 4 Unit Apartments | 0 (0.0%) | 198 (100.0%) |
| 5 to 9 Unit Apartments | 0 (0.0%) | 114 (100.0%) |
| 10 or more Apartments | 0 (0.0%) | 17 (100.0%) |
| Mobile Home / Other | 528 (84.6%) | 96 (15.4%) |
| Total | 2,016 (73.4%) | 732 (26.6%) |
Housing Structures by Number of Rooms in Sealy
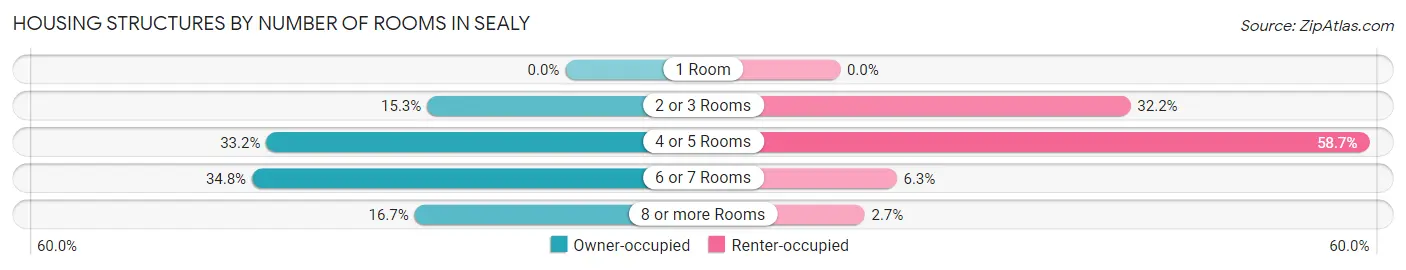
| Number of Rooms | Owner-occupied | Renter-occupied |
| 1 Room | 0 (0.0%) | 0 (0.0%) |
| 2 or 3 Rooms | 309 (15.3%) | 236 (32.2%) |
| 4 or 5 Rooms | 669 (33.2%) | 430 (58.7%) |
| 6 or 7 Rooms | 701 (34.8%) | 46 (6.3%) |
| 8 or more Rooms | 337 (16.7%) | 20 (2.7%) |
| Total | 2,016 (100.0%) | 732 (100.0%) |
Housing Structure by Heating Type in Sealy
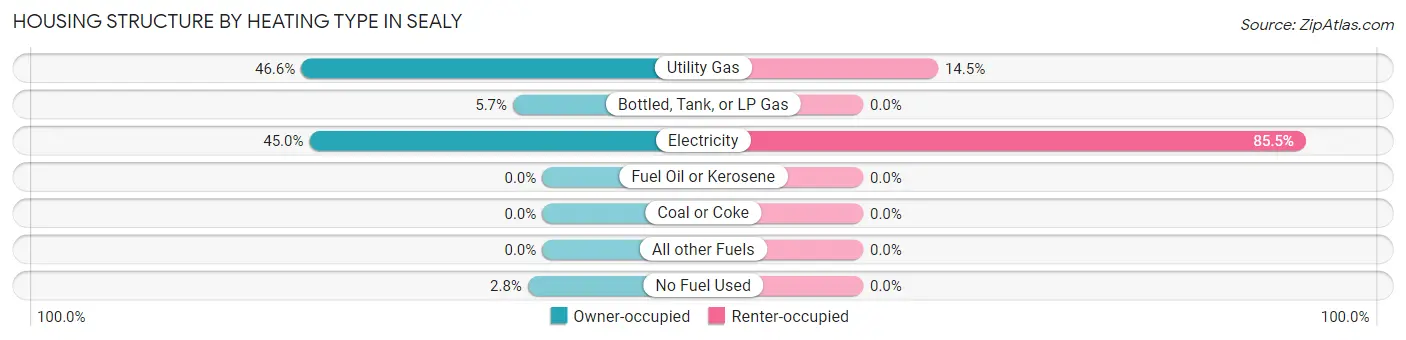
| Heating Type | Owner-occupied | Renter-occupied |
| Utility Gas | 939 (46.6%) | 106 (14.5%) |
| Bottled, Tank, or LP Gas | 114 (5.7%) | 0 (0.0%) |
| Electricity | 907 (45.0%) | 626 (85.5%) |
| Fuel Oil or Kerosene | 0 (0.0%) | 0 (0.0%) |
| Coal or Coke | 0 (0.0%) | 0 (0.0%) |
| All other Fuels | 0 (0.0%) | 0 (0.0%) |
| No Fuel Used | 56 (2.8%) | 0 (0.0%) |
| Total | 2,016 (100.0%) | 732 (100.0%) |
Household Vehicle Usage in Sealy
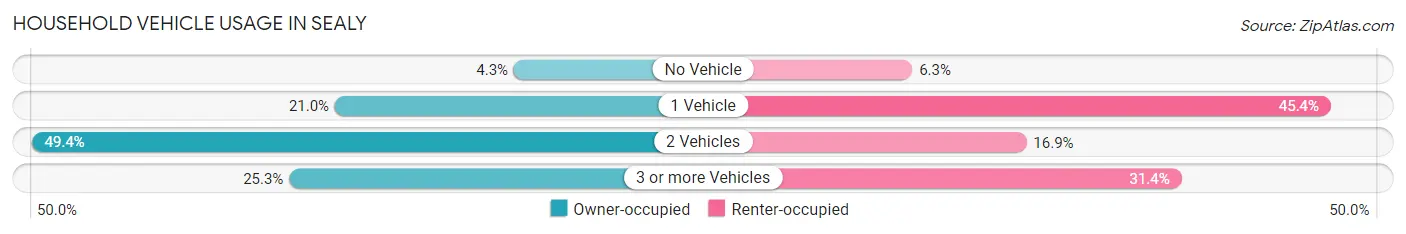
| Vehicles per Household | Owner-occupied | Renter-occupied |
| No Vehicle | 87 (4.3%) | 46 (6.3%) |
| 1 Vehicle | 424 (21.0%) | 332 (45.4%) |
| 2 Vehicles | 995 (49.4%) | 124 (16.9%) |
| 3 or more Vehicles | 510 (25.3%) | 230 (31.4%) |
| Total | 2,016 (100.0%) | 732 (100.0%) |
Real Estate & Mortgages in Sealy
Real Estate and Mortgage Overview in Sealy
| Characteristic | Without Mortgage | With Mortgage |
| Housing Units | 1,309 | 707 |
| Median Property Value | $158,400 | $217,900 |
| Median Household Income | $43,651 | $56 |
| Monthly Housing Costs | $558 | $0 |
| Real Estate Taxes | $1,536 | $8 |
Property Value by Mortgage Status in Sealy
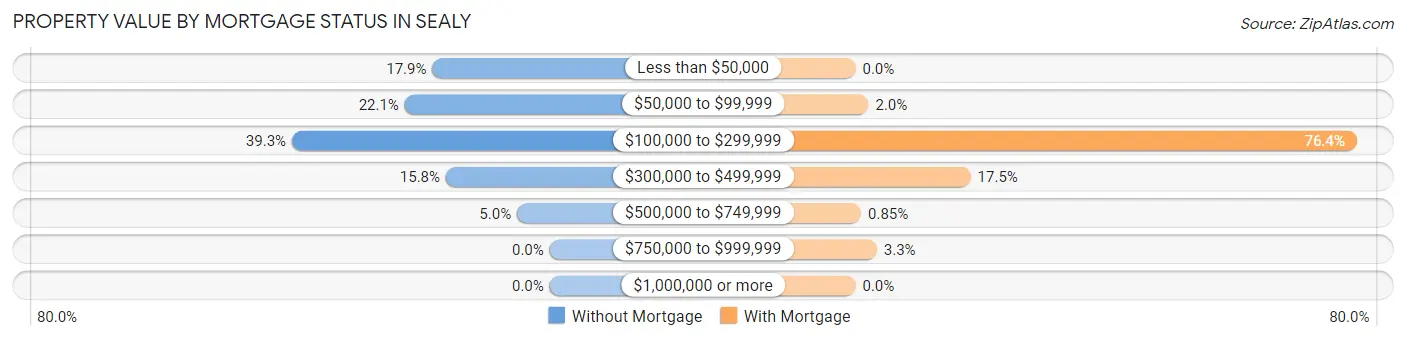
| Property Value | Without Mortgage | With Mortgage |
| Less than $50,000 | 234 (17.9%) | 0 (0.0%) |
| $50,000 to $99,999 | 289 (22.1%) | 14 (2.0%) |
| $100,000 to $299,999 | 514 (39.3%) | 540 (76.4%) |
| $300,000 to $499,999 | 207 (15.8%) | 124 (17.5%) |
| $500,000 to $749,999 | 65 (5.0%) | 6 (0.9%) |
| $750,000 to $999,999 | 0 (0.0%) | 23 (3.3%) |
| $1,000,000 or more | 0 (0.0%) | 0 (0.0%) |
| Total | 1,309 (100.0%) | 707 (100.0%) |
Household Income by Mortgage Status in Sealy
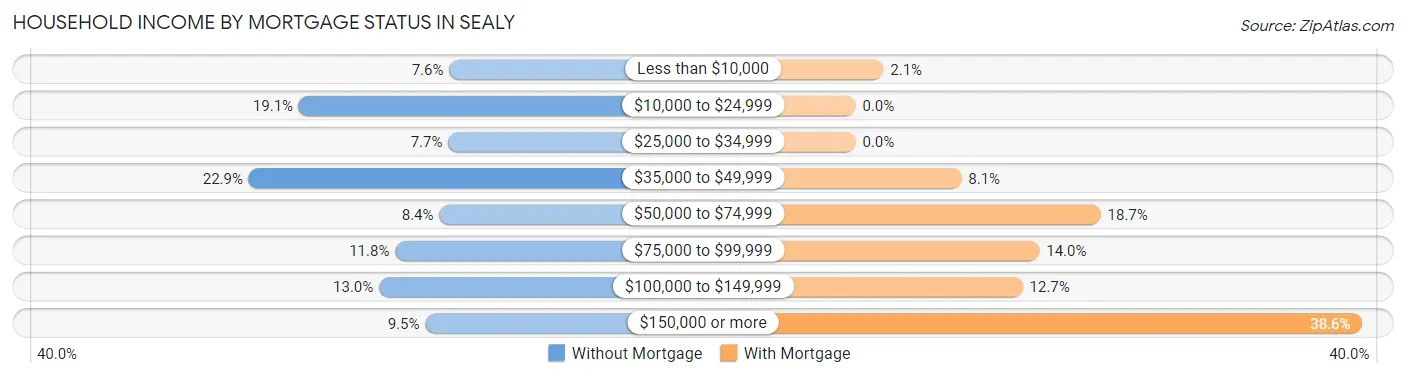
| Household Income | Without Mortgage | With Mortgage |
| Less than $10,000 | 100 (7.6%) | 15 (2.1%) |
| $10,000 to $24,999 | 250 (19.1%) | 0 (0.0%) |
| $25,000 to $34,999 | 101 (7.7%) | 0 (0.0%) |
| $35,000 to $49,999 | 300 (22.9%) | 57 (8.1%) |
| $50,000 to $74,999 | 110 (8.4%) | 132 (18.7%) |
| $75,000 to $99,999 | 154 (11.8%) | 99 (14.0%) |
| $100,000 to $149,999 | 170 (13.0%) | 90 (12.7%) |
| $150,000 or more | 124 (9.5%) | 273 (38.6%) |
| Total | 1,309 (100.0%) | 707 (100.0%) |
Property Value to Household Income Ratio in Sealy
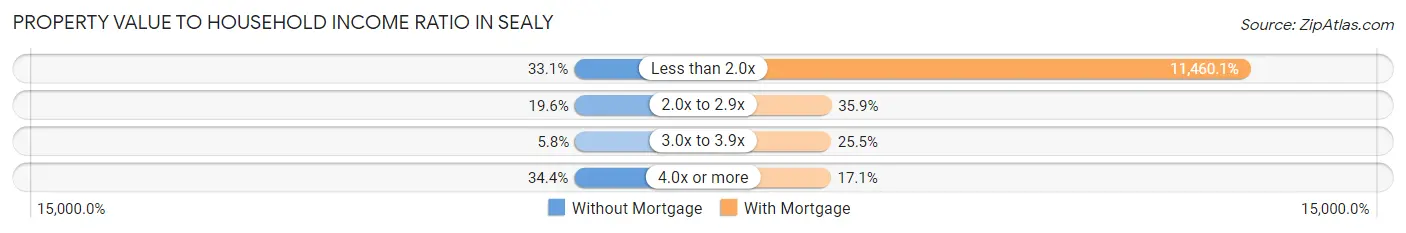
| Value-to-Income Ratio | Without Mortgage | With Mortgage |
| Less than 2.0x | 433 (33.1%) | 81,023 (11,460.1%) |
| 2.0x to 2.9x | 257 (19.6%) | 254 (35.9%) |
| 3.0x to 3.9x | 76 (5.8%) | 180 (25.5%) |
| 4.0x or more | 450 (34.4%) | 121 (17.1%) |
| Total | 1,309 (100.0%) | 707 (100.0%) |
Real Estate Taxes by Mortgage Status in Sealy
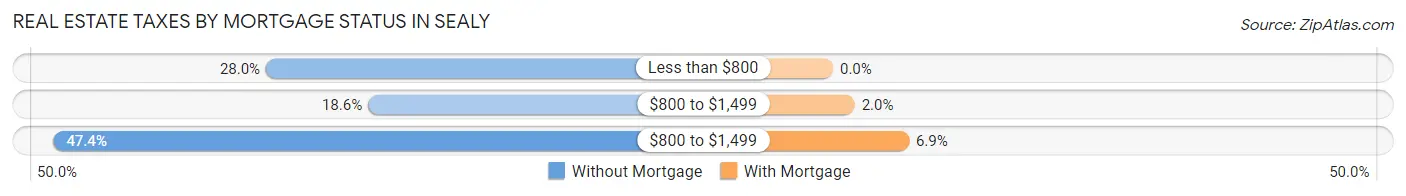
| Property Taxes | Without Mortgage | With Mortgage |
| Less than $800 | 366 (28.0%) | 0 (0.0%) |
| $800 to $1,499 | 244 (18.6%) | 14 (2.0%) |
| $800 to $1,499 | 620 (47.4%) | 49 (6.9%) |
| Total | 1,309 (100.0%) | 707 (100.0%) |
Health & Disability in Sealy
Health Insurance Coverage by Age in Sealy
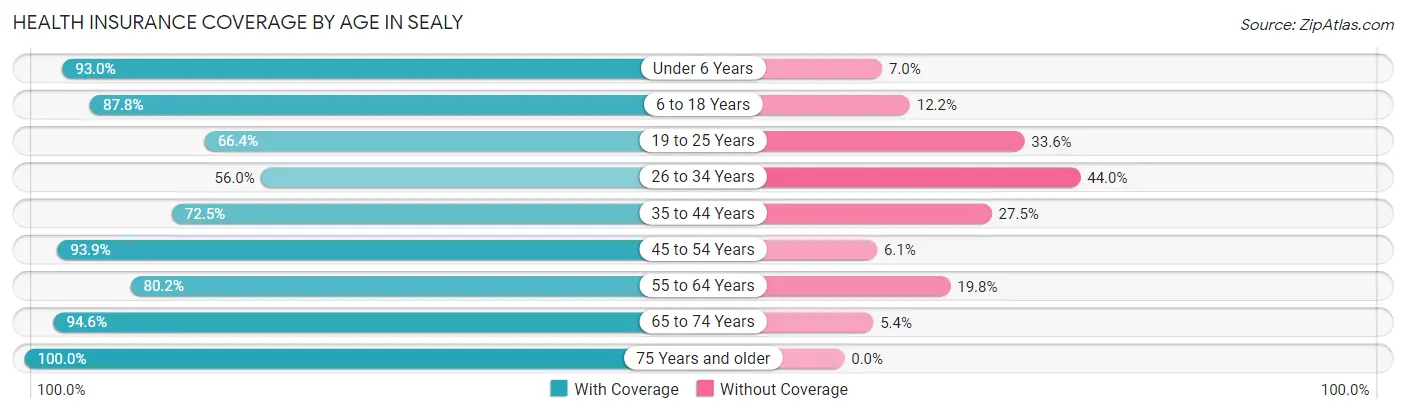
| Age Bracket | With Coverage | Without Coverage |
| Under 6 Years | 528 (93.0%) | 40 (7.0%) |
| 6 to 18 Years | 827 (87.8%) | 115 (12.2%) |
| 19 to 25 Years | 595 (66.4%) | 301 (33.6%) |
| 26 to 34 Years | 439 (56.0%) | 345 (44.0%) |
| 35 to 44 Years | 570 (72.5%) | 216 (27.5%) |
| 45 to 54 Years | 523 (93.9%) | 34 (6.1%) |
| 55 to 64 Years | 674 (80.2%) | 166 (19.8%) |
| 65 to 74 Years | 701 (94.6%) | 40 (5.4%) |
| 75 Years and older | 658 (100.0%) | 0 (0.0%) |
| Total | 5,515 (81.4%) | 1,257 (18.6%) |
Health Insurance Coverage by Citizenship Status in Sealy
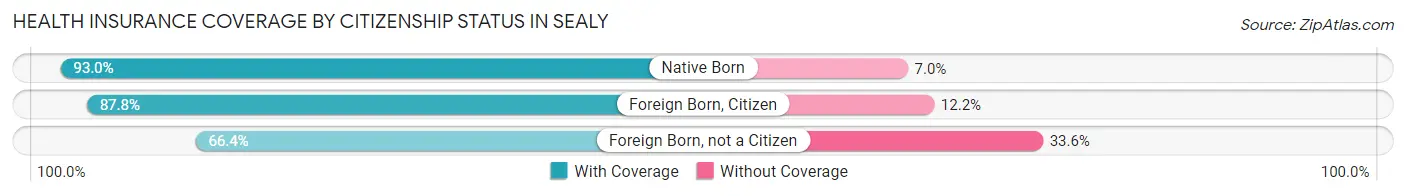
| Citizenship Status | With Coverage | Without Coverage |
| Native Born | 528 (93.0%) | 40 (7.0%) |
| Foreign Born, Citizen | 827 (87.8%) | 115 (12.2%) |
| Foreign Born, not a Citizen | 595 (66.4%) | 301 (33.6%) |
Health Insurance Coverage by Household Income in Sealy
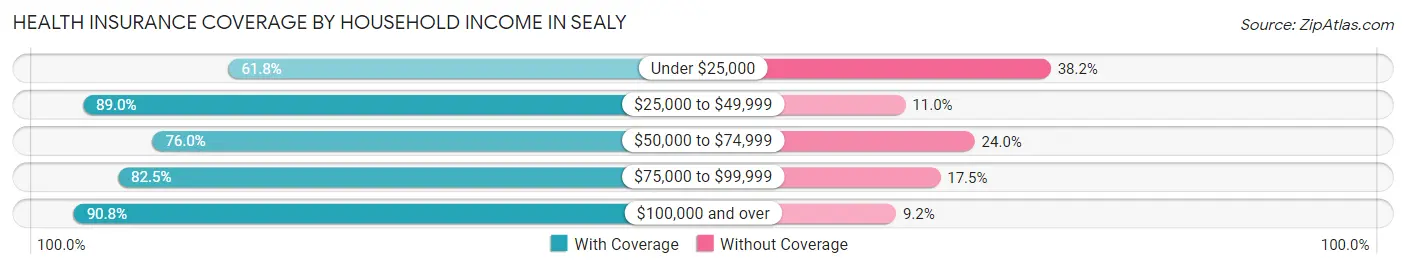
| Household Income | With Coverage | Without Coverage |
| Under $25,000 | 694 (61.8%) | 429 (38.2%) |
| $25,000 to $49,999 | 1,257 (89.0%) | 155 (11.0%) |
| $50,000 to $74,999 | 1,079 (76.0%) | 340 (24.0%) |
| $75,000 to $99,999 | 730 (82.5%) | 155 (17.5%) |
| $100,000 and over | 1,755 (90.8%) | 178 (9.2%) |
Public vs Private Health Insurance Coverage by Age in Sealy
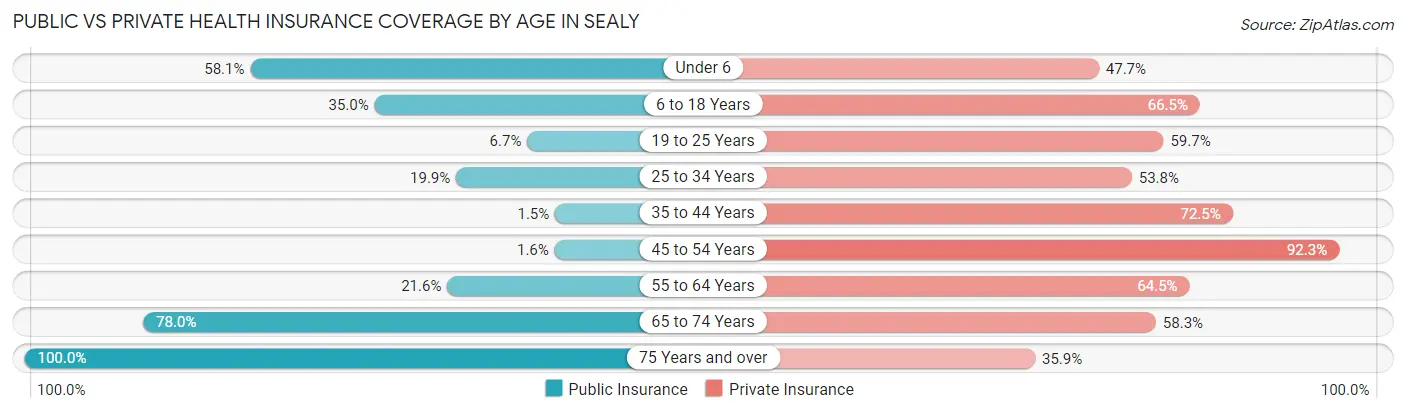
| Age Bracket | Public Insurance | Private Insurance |
| Under 6 | 330 (58.1%) | 271 (47.7%) |
| 6 to 18 Years | 330 (35.0%) | 626 (66.4%) |
| 19 to 25 Years | 60 (6.7%) | 535 (59.7%) |
| 25 to 34 Years | 156 (19.9%) | 422 (53.8%) |
| 35 to 44 Years | 12 (1.5%) | 570 (72.5%) |
| 45 to 54 Years | 9 (1.6%) | 514 (92.3%) |
| 55 to 64 Years | 181 (21.5%) | 542 (64.5%) |
| 65 to 74 Years | 578 (78.0%) | 432 (58.3%) |
| 75 Years and over | 658 (100.0%) | 236 (35.9%) |
| Total | 2,314 (34.2%) | 4,148 (61.3%) |
Disability Status by Sex by Age in Sealy
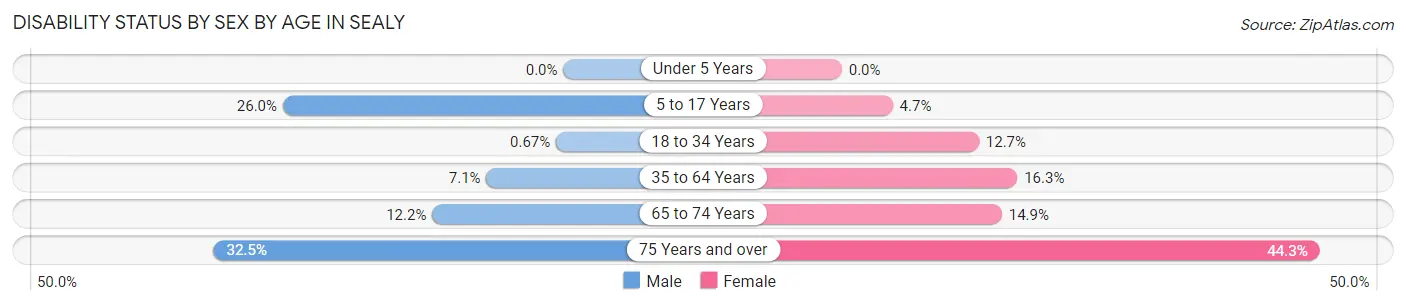
| Age Bracket | Male | Female |
| Under 5 Years | 0 (0.0%) | 0 (0.0%) |
| 5 to 17 Years | 120 (26.0%) | 25 (4.7%) |
| 18 to 34 Years | 4 (0.7%) | 140 (12.7%) |
| 35 to 64 Years | 73 (7.1%) | 189 (16.3%) |
| 65 to 74 Years | 50 (12.2%) | 49 (14.8%) |
| 75 Years and over | 62 (32.5%) | 207 (44.3%) |
Disability Class by Sex by Age in Sealy
Disability Class: Hearing Difficulty
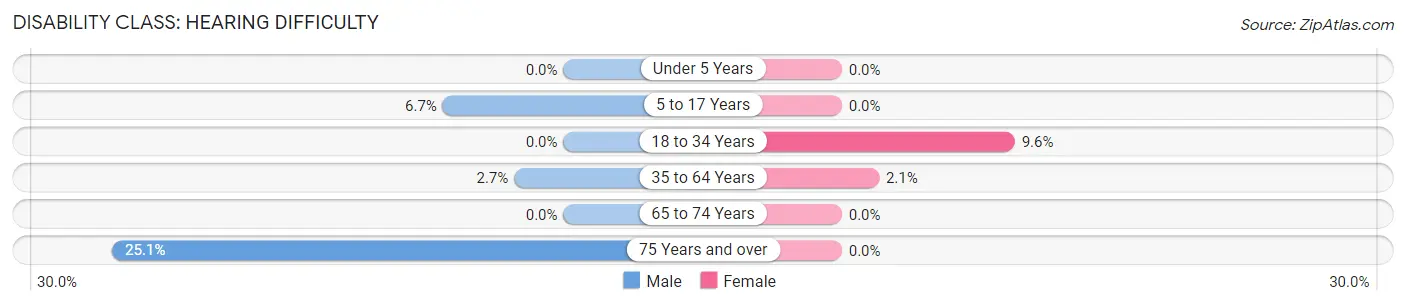
| Age Bracket | Male | Female |
| Under 5 Years | 0 (0.0%) | 0 (0.0%) |
| 5 to 17 Years | 31 (6.7%) | 0 (0.0%) |
| 18 to 34 Years | 0 (0.0%) | 106 (9.6%) |
| 35 to 64 Years | 28 (2.7%) | 24 (2.1%) |
| 65 to 74 Years | 0 (0.0%) | 0 (0.0%) |
| 75 Years and over | 48 (25.1%) | 0 (0.0%) |
Disability Class: Vision Difficulty
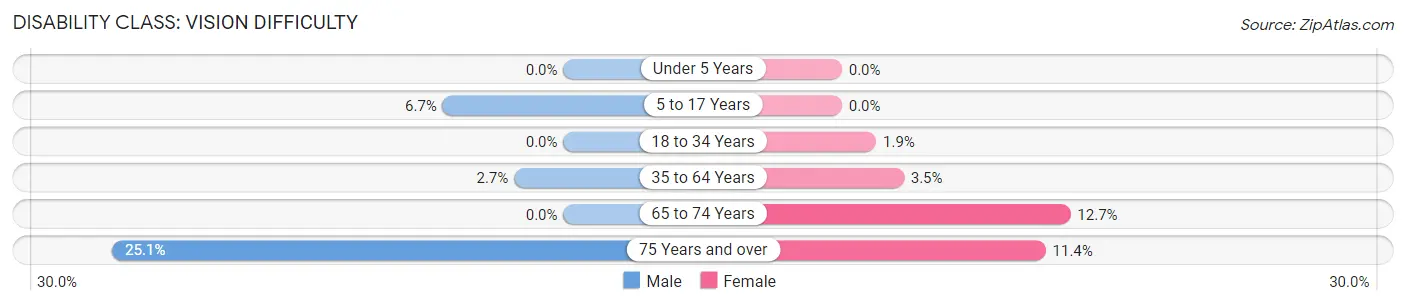
| Age Bracket | Male | Female |
| Under 5 Years | 0 (0.0%) | 0 (0.0%) |
| 5 to 17 Years | 31 (6.7%) | 0 (0.0%) |
| 18 to 34 Years | 0 (0.0%) | 21 (1.9%) |
| 35 to 64 Years | 28 (2.7%) | 40 (3.5%) |
| 65 to 74 Years | 0 (0.0%) | 42 (12.7%) |
| 75 Years and over | 48 (25.1%) | 53 (11.4%) |
Disability Class: Cognitive Difficulty
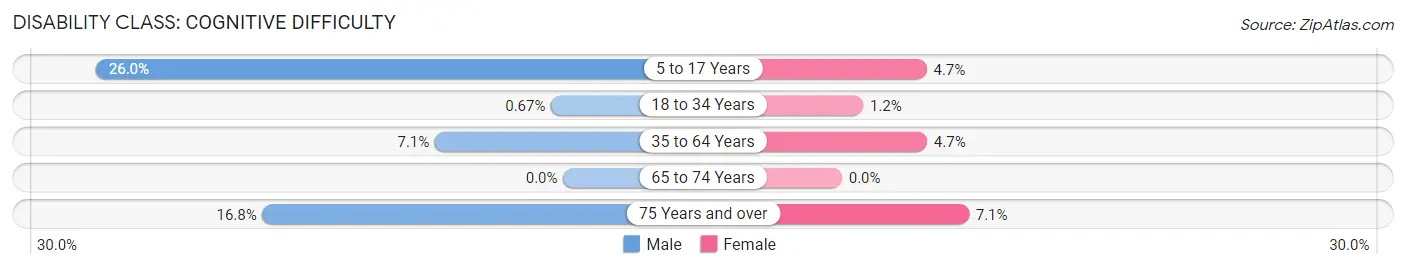
| Age Bracket | Male | Female |
| 5 to 17 Years | 120 (26.0%) | 25 (4.7%) |
| 18 to 34 Years | 4 (0.7%) | 13 (1.2%) |
| 35 to 64 Years | 73 (7.1%) | 55 (4.7%) |
| 65 to 74 Years | 0 (0.0%) | 0 (0.0%) |
| 75 Years and over | 32 (16.8%) | 33 (7.1%) |
Disability Class: Ambulatory Difficulty
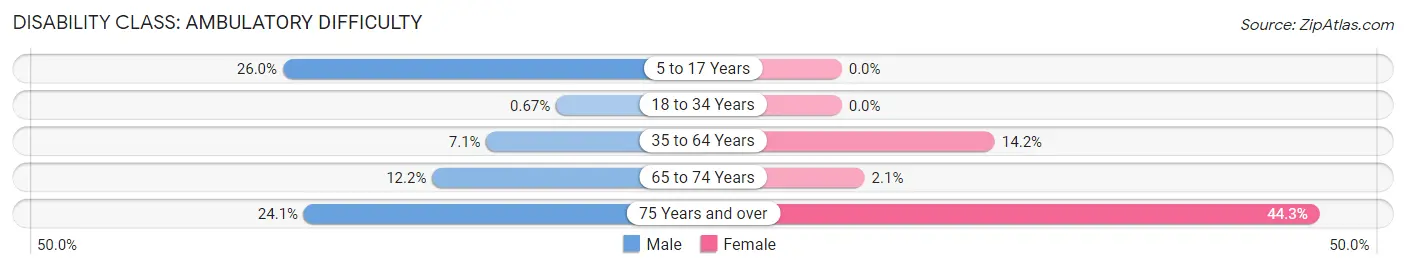
| Age Bracket | Male | Female |
| 5 to 17 Years | 120 (26.0%) | 0 (0.0%) |
| 18 to 34 Years | 4 (0.7%) | 0 (0.0%) |
| 35 to 64 Years | 73 (7.1%) | 165 (14.2%) |
| 65 to 74 Years | 50 (12.2%) | 7 (2.1%) |
| 75 Years and over | 46 (24.1%) | 207 (44.3%) |
Disability Class: Self-Care Difficulty
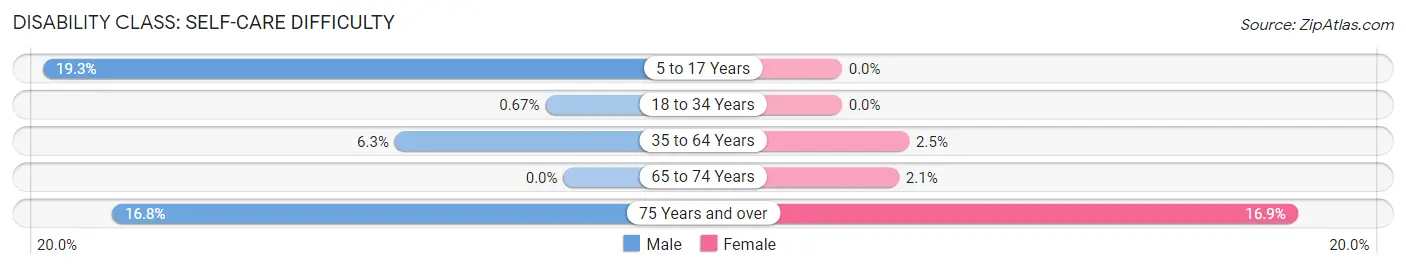
| Age Bracket | Male | Female |
| 5 to 17 Years | 89 (19.3%) | 0 (0.0%) |
| 18 to 34 Years | 4 (0.7%) | 0 (0.0%) |
| 35 to 64 Years | 64 (6.3%) | 29 (2.5%) |
| 65 to 74 Years | 0 (0.0%) | 7 (2.1%) |
| 75 Years and over | 32 (16.8%) | 79 (16.9%) |
Technology Access in Sealy
Computing Device Access in Sealy
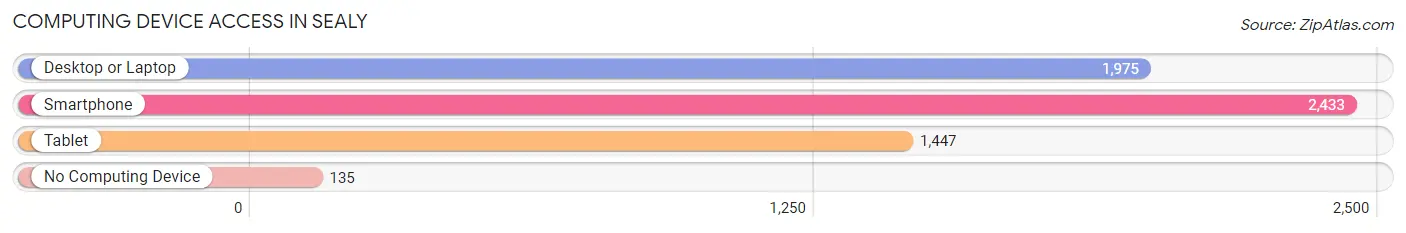
| Device Type | # Households | % Households |
| Desktop or Laptop | 1,975 | 71.9% |
| Smartphone | 2,433 | 88.5% |
| Tablet | 1,447 | 52.7% |
| No Computing Device | 135 | 4.9% |
| Total | 2,748 | 100.0% |
Internet Access in Sealy
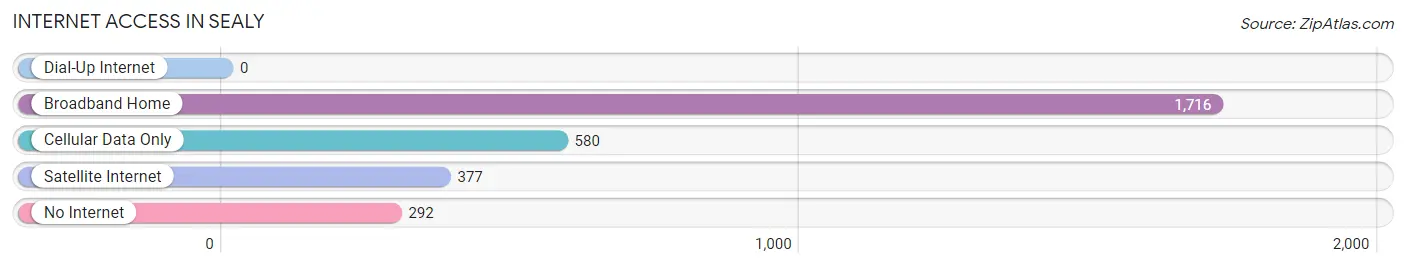
| Internet Type | # Households | % Households |
| Dial-Up Internet | 0 | 0.0% |
| Broadband Home | 1,716 | 62.5% |
| Cellular Data Only | 580 | 21.1% |
| Satellite Internet | 377 | 13.7% |
| No Internet | 292 | 10.6% |
| Total | 2,748 | 100.0% |
Sealy Summary
Sealy, Texas is a small city located in Austin County, Texas, United States. It is situated about 50 miles west of Houston and is part of the Greater Houston metropolitan area. The city was founded in 1879 and was named after the nearby Sealy family. As of the 2010 census, the population of Sealy was 6,019.
Geography
Sealy is located at the intersection of Interstate 10 and State Highway 36. It is situated in the southeastern part of Austin County, about 50 miles west of Houston. The city has a total area of 4.2 square miles, all of which is land. The terrain is mostly flat, with some rolling hills in the northern part of the city. The climate is humid subtropical, with hot summers and mild winters.
Demographics
As of the 2010 census, the population of Sealy was 6,019. The racial makeup of the city was 77.3% White, 15.2% Hispanic or Latino, 8.2% African American, 0.7% Native American, 0.4% Asian, and 2.4% from other races. The median household income was $41,945, and the median family income was $50,945.
Economy
Sealy is home to several businesses, including manufacturing, retail, and service industries. The city is also home to a number of small businesses, including restaurants, shops, and other services. The largest employers in the city are the Sealy Independent School District, the Sealy Hospital, and the Sealy Police Department.
The city is also home to a number of tourist attractions, including the Sealy Historical Museum, the Sealy Public Library, and the Sealy City Park. The city is also home to a number of festivals and events, including the Sealybration Festival, the Sealybration Parade, and the Sealybration Car Show.
History
Sealy was founded in 1879 by the Sealy family, who had moved to the area from Alabama. The city was named after the family, and the first post office was established in 1881. The city was incorporated in 1883, and the first mayor was elected in 1884.
In the early 1900s, the city experienced a period of growth, with the construction of a railroad line and the opening of several businesses. The city also became a center for cotton production, and the population grew to over 1,000 by the 1920s.
In the 1950s, the city experienced a period of decline, as the cotton industry declined and the population decreased. However, in the late 1970s, the city began to experience a period of growth, as new businesses opened and the population increased.
Today, Sealy is a small city with a population of 6,019. The city is home to a number of businesses, including manufacturing, retail, and service industries. The city is also home to a number of tourist attractions, including the Sealy Historical Museum, the Sealy Public Library, and the Sealy City Park. The city is also home to a number of festivals and events, including the Sealybration Festival, the Sealybration Parade, and the Sealybration Car Show.
Common Questions
What is Per Capita Income in Sealy?
Per Capita income in Sealy is $27,313.
What is the Median Family Income in Sealy?
Median Family Income in Sealy is $65,471.
What is the Median Household income in Sealy?
Median Household Income in Sealy is $60,313.
What is Income or Wage Gap in Sealy?
Income or Wage Gap in Sealy is 59.4%.
Women in Sealy earn 40.6 cents for every dollar earned by a man.
What is Inequality or Gini Index in Sealy?
Inequality or Gini Index in Sealy is 0.42.
What is the Total Population of Sealy?
Total Population of Sealy is 6,837.
What is the Total Male Population of Sealy?
Total Male Population of Sealy is 3,045.
What is the Total Female Population of Sealy?
Total Female Population of Sealy is 3,792.
What is the Ratio of Males per 100 Females in Sealy?
There are 80.30 Males per 100 Females in Sealy.
What is the Ratio of Females per 100 Males in Sealy?
There are 124.53 Females per 100 Males in Sealy.
What is the Median Population Age in Sealy?
Median Population Age in Sealy is 38.0 Years.
What is the Average Family Size in Sealy
Average Family Size in Sealy is 2.7 People.
What is the Average Household Size in Sealy
Average Household Size in Sealy is 2.5 People.
How Large is the Labor Force in Sealy?
There are 3,413 People in the Labor Forcein in Sealy.
What is the Percentage of People in the Labor Force in Sealy?
62.7% of People are in the Labor Force in Sealy.
What is the Unemployment Rate in Sealy?
Unemployment Rate in Sealy is 5.7%.