Seagoville, TX Map & Demographics
Seagoville Map
Seagoville Overview
$23,241
PER CAPITA INCOME
$63,181
AVG FAMILY INCOME
$65,300
AVG HOUSEHOLD INCOME
3.4%
WAGE / INCOME GAP [ % ]
96.6¢/ $1
WAGE / INCOME GAP [ $ ]
0.38
INEQUALITY / GINI INDEX
18,658
TOTAL POPULATION
10,520
MALE POPULATION
8,138
FEMALE POPULATION
129.27
MALES / 100 FEMALES
77.36
FEMALES / 100 MALES
34.6
MEDIAN AGE
3.7
AVG FAMILY SIZE
3.2
AVG HOUSEHOLD SIZE
7,722
LABOR FORCE [ PEOPLE ]
54.9%
PERCENT IN LABOR FORCE
7.3%
UNEMPLOYMENT RATE
Seagoville Zip Codes
Income in Seagoville
Income Overview in Seagoville
Per Capita Income in Seagoville is $23,241, while median incomes of families and households are $63,181 and $65,300 respectively.
| Characteristic | Number | Measure |
| Per Capita Income | 18,658 | $23,241 |
| Median Family Income | 3,807 | $63,181 |
| Mean Family Income | 3,807 | $80,132 |
| Median Household Income | 5,185 | $65,300 |
| Mean Household Income | 5,185 | $78,524 |
| Income Deficit | 3,807 | $0 |
| Wage / Income Gap (%) | 18,658 | 3.36% |
| Wage / Income Gap ($) | 18,658 | 96.64¢ per $1 |
| Gini / Inequality Index | 18,658 | 0.38 |
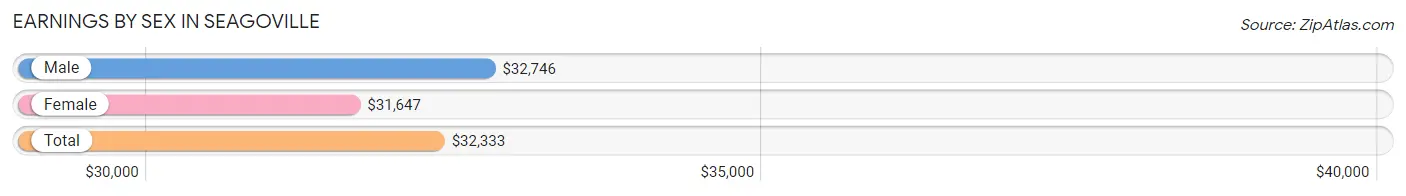
Earnings by Sex in Seagoville
Average Earnings in Seagoville are $32,333, $32,746 for men and $31,647 for women, a difference of 3.4%.
| Sex | Number | Average Earnings |
| Male | 5,750 (63.5%) | $32,746 |
| Female | 3,299 (36.5%) | $31,647 |
| Total | 9,049 (100.0%) | $32,333 |
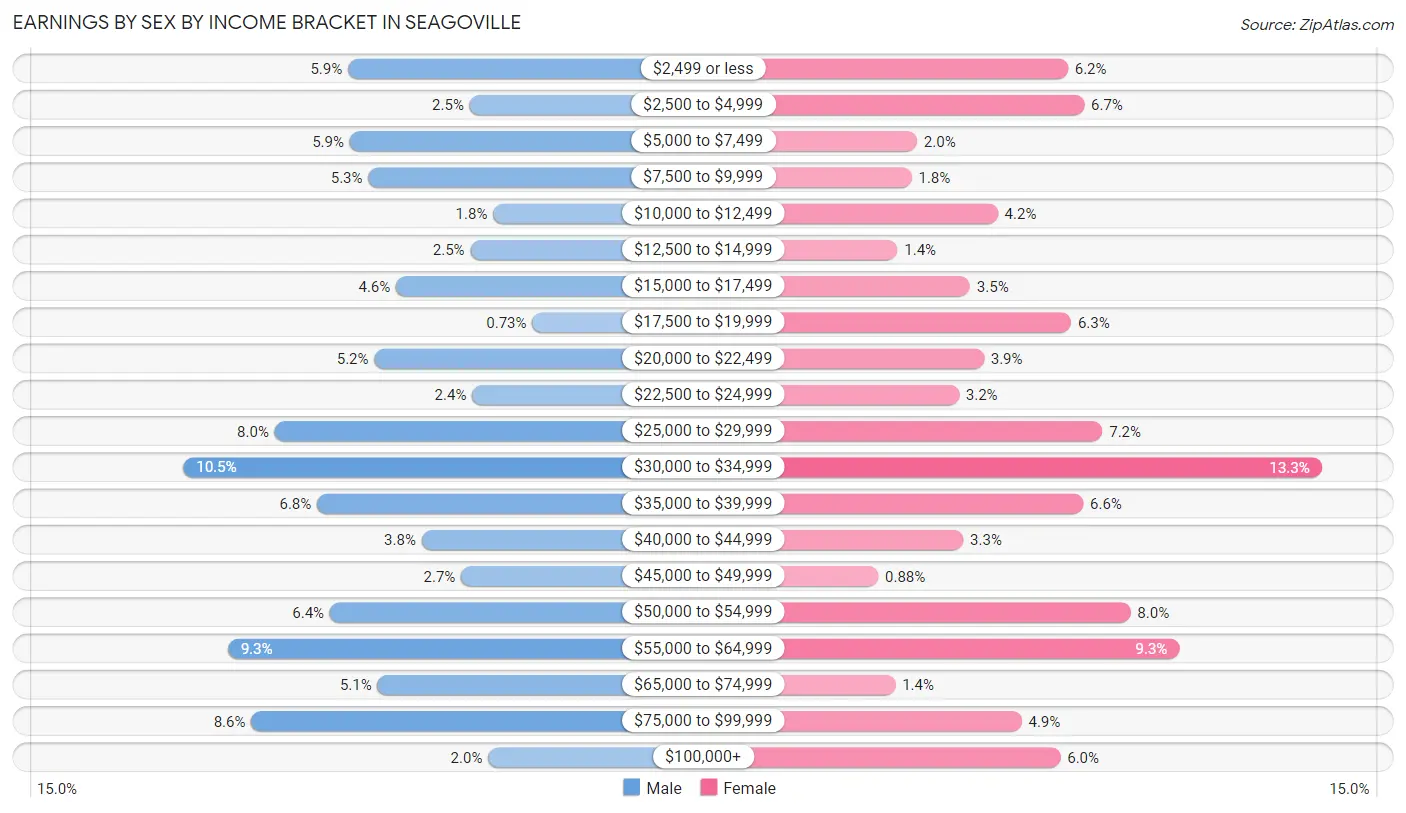
Earnings by Sex by Income Bracket in Seagoville
The most common earnings brackets in Seagoville are $30,000 to $34,999 for men (606 | 10.5%) and $30,000 to $34,999 for women (440 | 13.3%).
| Income | Male | Female |
| $2,499 or less | 340 (5.9%) | 205 (6.2%) |
| $2,500 to $4,999 | 143 (2.5%) | 220 (6.7%) |
| $5,000 to $7,499 | 337 (5.9%) | 65 (2.0%) |
| $7,500 to $9,999 | 307 (5.3%) | 60 (1.8%) |
| $10,000 to $12,499 | 105 (1.8%) | 140 (4.2%) |
| $12,500 to $14,999 | 142 (2.5%) | 47 (1.4%) |
| $15,000 to $17,499 | 262 (4.6%) | 114 (3.5%) |
| $17,500 to $19,999 | 42 (0.7%) | 208 (6.3%) |
| $20,000 to $22,499 | 297 (5.2%) | 127 (3.8%) |
| $22,500 to $24,999 | 139 (2.4%) | 104 (3.2%) |
| $25,000 to $29,999 | 458 (8.0%) | 237 (7.2%) |
| $30,000 to $34,999 | 606 (10.5%) | 440 (13.3%) |
| $35,000 to $39,999 | 390 (6.8%) | 219 (6.6%) |
| $40,000 to $44,999 | 221 (3.8%) | 108 (3.3%) |
| $45,000 to $49,999 | 157 (2.7%) | 29 (0.9%) |
| $50,000 to $54,999 | 369 (6.4%) | 263 (8.0%) |
| $55,000 to $64,999 | 534 (9.3%) | 308 (9.3%) |
| $65,000 to $74,999 | 292 (5.1%) | 45 (1.4%) |
| $75,000 to $99,999 | 496 (8.6%) | 162 (4.9%) |
| $100,000+ | 113 (2.0%) | 198 (6.0%) |
| Total | 5,750 (100.0%) | 3,299 (100.0%) |
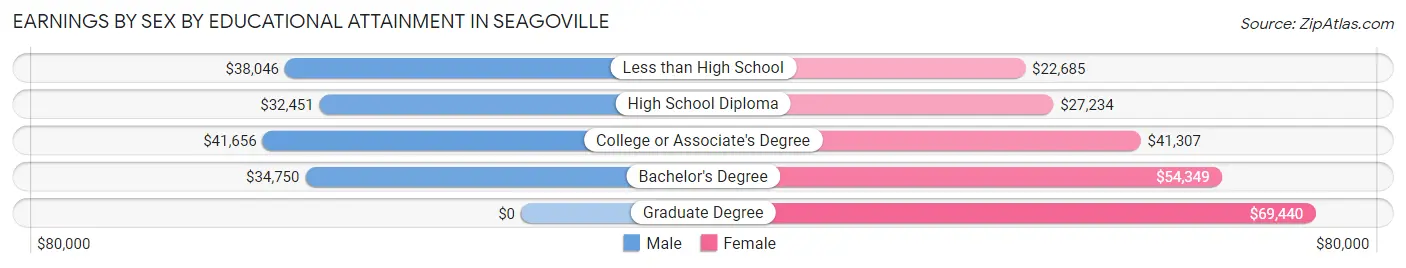
Earnings by Sex by Educational Attainment in Seagoville
Average earnings in Seagoville are $35,207 for men and $33,548 for women, a difference of 4.7%. Men with an educational attainment of college or associate's degree enjoy the highest average annual earnings of $41,656, while those with high school diploma education earn the least with $32,451. Women with an educational attainment of graduate degree earn the most with the average annual earnings of $69,440, while those with less than high school education have the smallest earnings of $22,685.
| Educational Attainment | Male Income | Female Income |
| Less than High School | $38,046 | $22,685 |
| High School Diploma | $32,451 | $27,234 |
| College or Associate's Degree | $41,656 | $41,307 |
| Bachelor's Degree | $34,750 | $54,349 |
| Graduate Degree | - | - |
| Total | $35,207 | $33,548 |
Family Income in Seagoville
Family Income Brackets in Seagoville
According to the Seagoville family income data, there are 853 families falling into the $50,000 to $74,999 income range, which is the most common income bracket and makes up 22.4% of all families. Conversely, the $10,000 to $14,999 income bracket is the least frequent group with only 65 families (1.7%) belonging to this category.
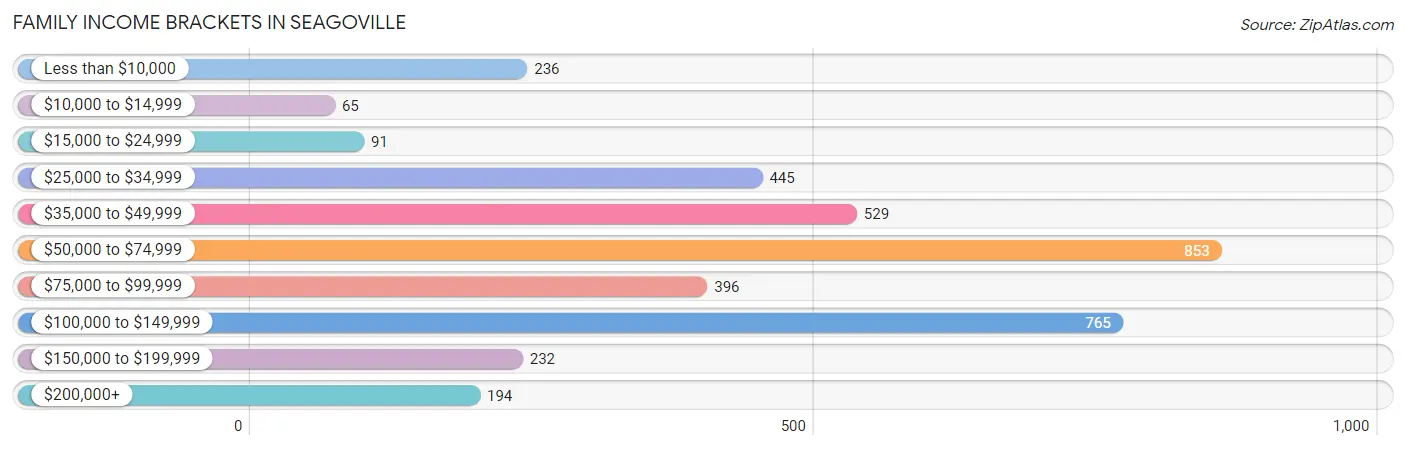
| Income Bracket | # Families | % Families |
| Less than $10,000 | 236 | 6.2% |
| $10,000 to $14,999 | 65 | 1.7% |
| $15,000 to $24,999 | 91 | 2.4% |
| $25,000 to $34,999 | 445 | 11.7% |
| $35,000 to $49,999 | 529 | 13.9% |
| $50,000 to $74,999 | 853 | 22.4% |
| $75,000 to $99,999 | 396 | 10.4% |
| $100,000 to $149,999 | 765 | 20.1% |
| $150,000 to $199,999 | 232 | 6.1% |
| $200,000+ | 194 | 5.1% |
Family Income by Famaliy Size in Seagoville
6-person families (282 | 7.4%) account for the highest median family income in Seagoville with $101,250 per family, while 2-person families (1,361 | 35.7%) have the highest median income of $35,016 per family member.
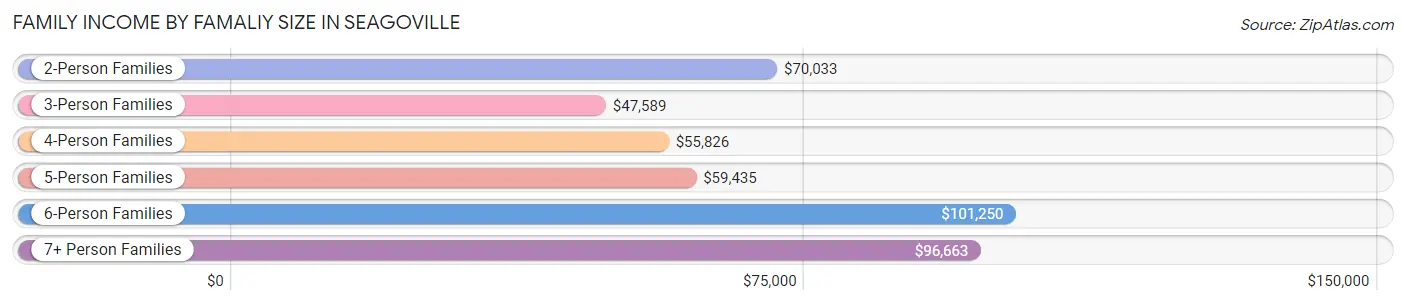
| Income Bracket | # Families | Median Income |
| 2-Person Families | 1,361 (35.7%) | $70,033 |
| 3-Person Families | 921 (24.2%) | $47,589 |
| 4-Person Families | 643 (16.9%) | $55,826 |
| 5-Person Families | 409 (10.7%) | $59,435 |
| 6-Person Families | 282 (7.4%) | $101,250 |
| 7+ Person Families | 191 (5.0%) | $96,663 |
| Total | 3,807 (100.0%) | $63,181 |
Family Income by Number of Earners in Seagoville
The median family income in Seagoville is $63,181, with families comprising 3+ earners (591) having the highest median family income of $117,068, while families with no earners (401) have the lowest median family income of $36,612, accounting for 15.5% and 10.5% of families, respectively.
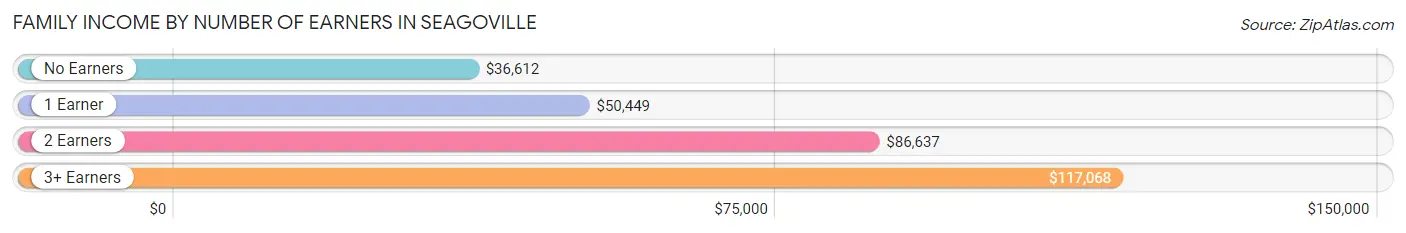
| Number of Earners | # Families | Median Income |
| No Earners | 401 (10.5%) | $36,612 |
| 1 Earner | 1,550 (40.7%) | $50,449 |
| 2 Earners | 1,265 (33.2%) | $86,637 |
| 3+ Earners | 591 (15.5%) | $117,068 |
| Total | 3,807 (100.0%) | $63,181 |
Household Income in Seagoville
Household Income Brackets in Seagoville
With 1,296 households falling in the category, the $50,000 to $74,999 income range is the most frequent in Seagoville, accounting for 25.0% of all households. In contrast, only 197 households (3.8%) fall into the $200,000+ income bracket, making it the least populous group.
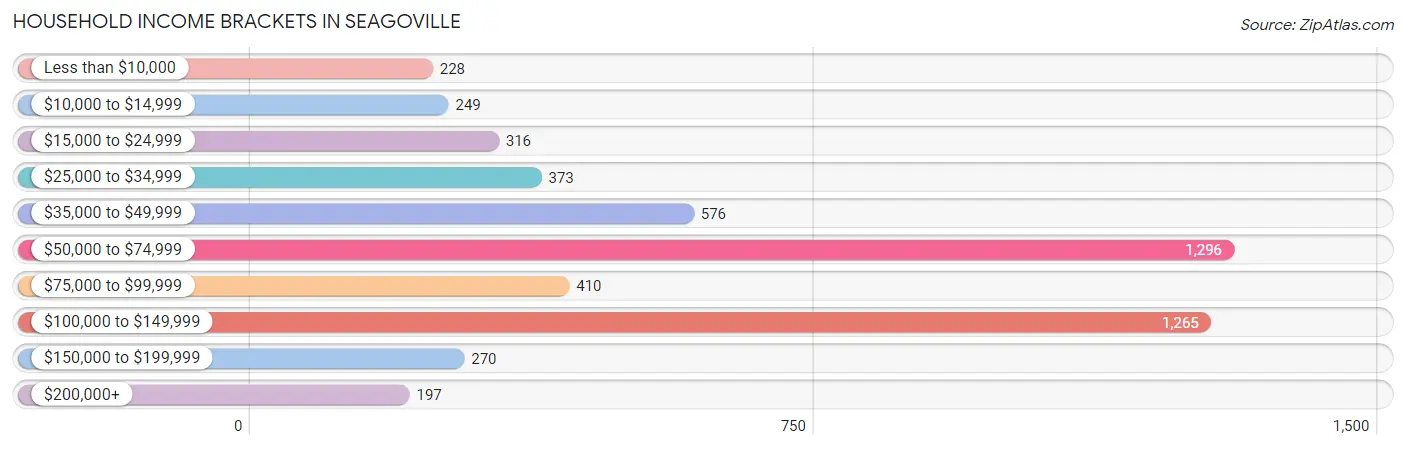
| Income Bracket | # Households | % Households |
| Less than $10,000 | 228 | 4.4% |
| $10,000 to $14,999 | 249 | 4.8% |
| $15,000 to $24,999 | 316 | 6.1% |
| $25,000 to $34,999 | 373 | 7.2% |
| $35,000 to $49,999 | 576 | 11.1% |
| $50,000 to $74,999 | 1,296 | 25.0% |
| $75,000 to $99,999 | 410 | 7.9% |
| $100,000 to $149,999 | 1,265 | 24.4% |
| $150,000 to $199,999 | 270 | 5.2% |
| $200,000+ | 197 | 3.8% |
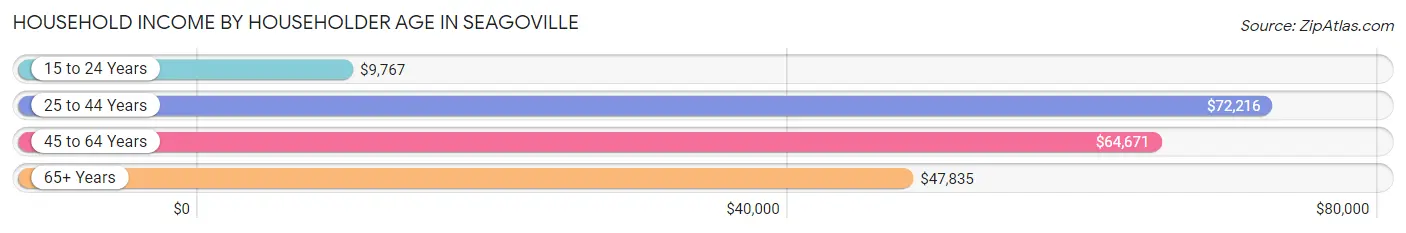
Household Income by Householder Age in Seagoville
The median household income in Seagoville is $65,300, with the highest median household income of $72,216 found in the 25 to 44 years age bracket for the primary householder. A total of 2,074 households (40.0%) fall into this category. Meanwhile, the 15 to 24 years age bracket for the primary householder has the lowest median household income of $9,767, with 204 households (3.9%) in this group.
| Income Bracket | # Households | Median Income |
| 15 to 24 Years | 204 (3.9%) | $9,767 |
| 25 to 44 Years | 2,074 (40.0%) | $72,216 |
| 45 to 64 Years | 1,841 (35.5%) | $64,671 |
| 65+ Years | 1,066 (20.6%) | $47,835 |
| Total | 5,185 (100.0%) | $65,300 |
Poverty in Seagoville
Income Below Poverty by Sex and Age in Seagoville
With 12.8% poverty level for males and 15.5% for females among the residents of Seagoville, under 5 year old males and 5 year old females are the most vulnerable to poverty, with 369 males (37.5%) and 120 females (51.9%) in their respective age groups living below the poverty level.
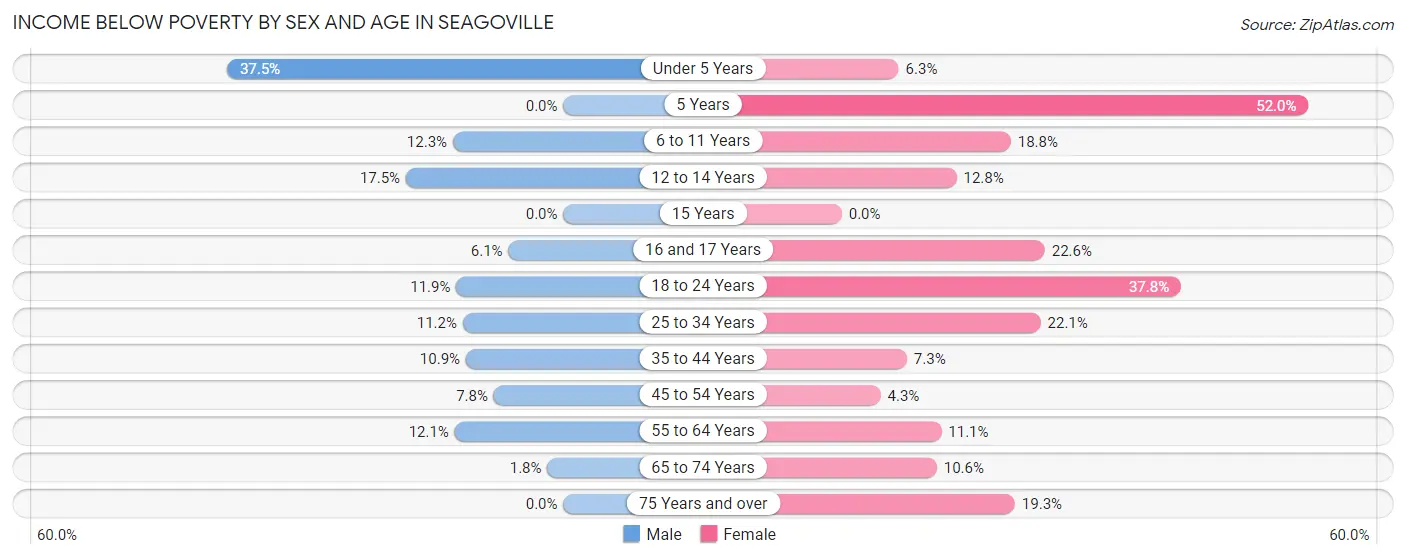
| Age Bracket | Male | Female |
| Under 5 Years | 369 (37.5%) | 40 (6.3%) |
| 5 Years | 0 (0.0%) | 120 (51.9%) |
| 6 to 11 Years | 114 (12.3%) | 159 (18.8%) |
| 12 to 14 Years | 34 (17.5%) | 52 (12.8%) |
| 15 Years | 0 (0.0%) | 0 (0.0%) |
| 16 and 17 Years | 24 (6.1%) | 45 (22.6%) |
| 18 to 24 Years | 101 (11.9%) | 241 (37.8%) |
| 25 to 34 Years | 140 (11.2%) | 244 (22.1%) |
| 35 to 44 Years | 160 (10.8%) | 77 (7.2%) |
| 45 to 54 Years | 69 (7.7%) | 38 (4.3%) |
| 55 to 64 Years | 80 (12.1%) | 71 (11.1%) |
| 65 to 74 Years | 10 (1.8%) | 89 (10.6%) |
| 75 Years and over | 0 (0.0%) | 80 (19.3%) |
| Total | 1,101 (12.8%) | 1,256 (15.5%) |
Income Above Poverty by Sex and Age in Seagoville
According to the poverty statistics in Seagoville, males aged 5 years and females aged 15 years are the age groups that are most secure financially, with 100.0% of males and 100.0% of females in these age groups living above the poverty line.
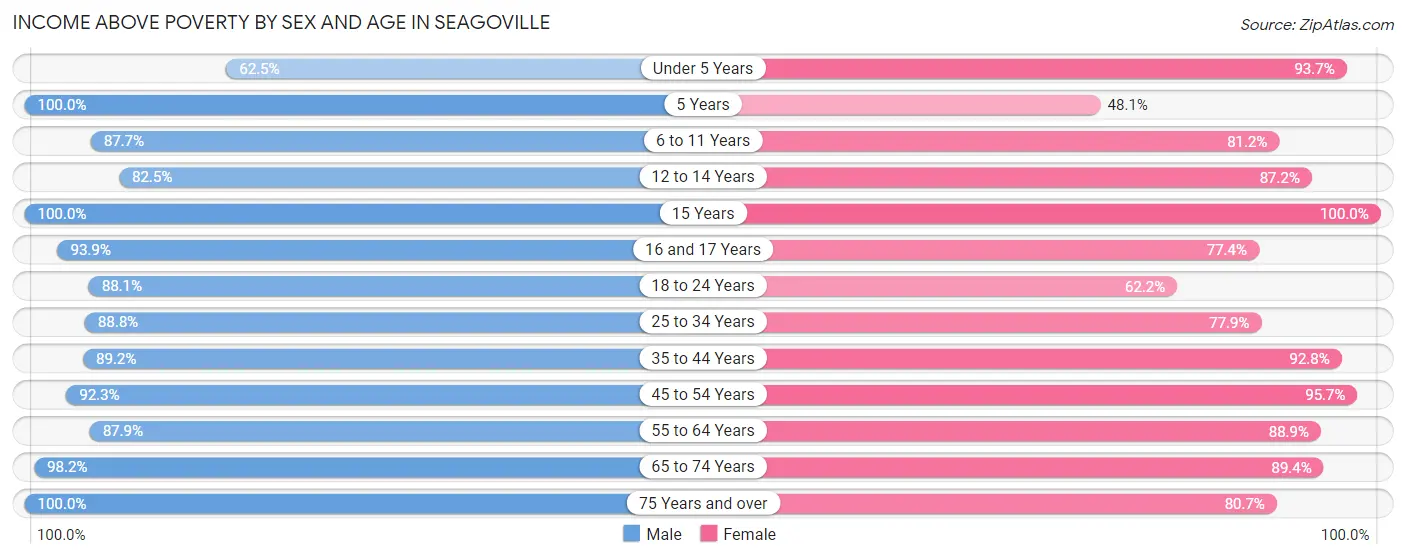
| Age Bracket | Male | Female |
| Under 5 Years | 616 (62.5%) | 592 (93.7%) |
| 5 Years | 81 (100.0%) | 111 (48.0%) |
| 6 to 11 Years | 813 (87.7%) | 686 (81.2%) |
| 12 to 14 Years | 160 (82.5%) | 355 (87.2%) |
| 15 Years | 70 (100.0%) | 201 (100.0%) |
| 16 and 17 Years | 368 (93.9%) | 154 (77.4%) |
| 18 to 24 Years | 746 (88.1%) | 397 (62.2%) |
| 25 to 34 Years | 1,110 (88.8%) | 858 (77.9%) |
| 35 to 44 Years | 1,314 (89.1%) | 985 (92.7%) |
| 45 to 54 Years | 821 (92.2%) | 841 (95.7%) |
| 55 to 64 Years | 581 (87.9%) | 569 (88.9%) |
| 65 to 74 Years | 553 (98.2%) | 752 (89.4%) |
| 75 Years and over | 257 (100.0%) | 335 (80.7%) |
| Total | 7,490 (87.2%) | 6,836 (84.5%) |
Income Below Poverty Among Married-Couple Families in Seagoville
The poverty statistics for married-couple families in Seagoville show that 6.8% or 148 of the total 2,174 families live below the poverty line. Families with 5 or more children have the highest poverty rate of 100.0%, comprising of 23 families. On the other hand, families with no children have the lowest poverty rate of 1.0%, which includes 10 families.
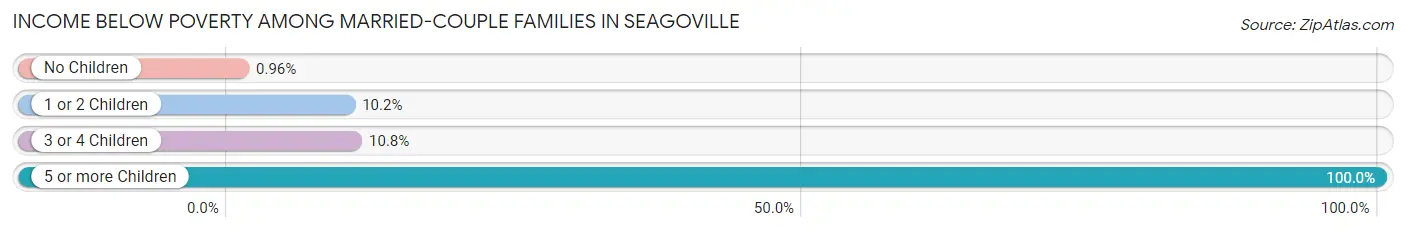
| Children | Above Poverty | Below Poverty |
| No Children | 1,033 (99.0%) | 10 (1.0%) |
| 1 or 2 Children | 704 (89.8%) | 80 (10.2%) |
| 3 or 4 Children | 289 (89.2%) | 35 (10.8%) |
| 5 or more Children | 0 (0.0%) | 23 (100.0%) |
| Total | 2,026 (93.2%) | 148 (6.8%) |
Income Below Poverty Among Single-Parent Households in Seagoville
According to the poverty data in Seagoville, 10.0% or 74 single-father households and 22.0% or 197 single-mother households are living below the poverty line. Among single-father households, those with no children have the highest poverty rate, with 74 households (42.8%) experiencing poverty. Likewise, among single-mother households, those with 3 or 4 children have the highest poverty rate, with 94 households (81.7%) falling below the poverty line.
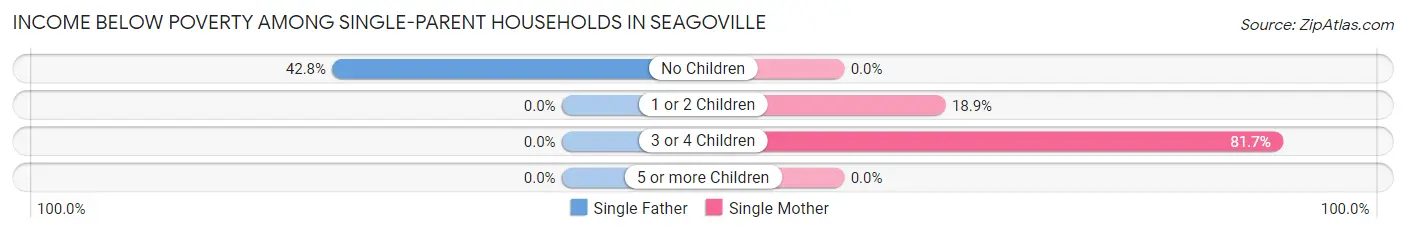
| Children | Single Father | Single Mother |
| No Children | 74 (42.8%) | 0 (0.0%) |
| 1 or 2 Children | 0 (0.0%) | 103 (18.9%) |
| 3 or 4 Children | 0 (0.0%) | 94 (81.7%) |
| 5 or more Children | 0 (0.0%) | 0 (0.0%) |
| Total | 74 (10.0%) | 197 (22.0%) |
Income Below Poverty Among Married-Couple vs Single-Parent Households in Seagoville
The poverty data for Seagoville shows that 148 of the married-couple family households (6.8%) and 271 of the single-parent households (16.6%) are living below the poverty level. Within the married-couple family households, those with 5 or more children have the highest poverty rate, with 23 households (100.0%) falling below the poverty line. Among the single-parent households, those with 3 or 4 children have the highest poverty rate, with 94 household (51.6%) living below poverty.
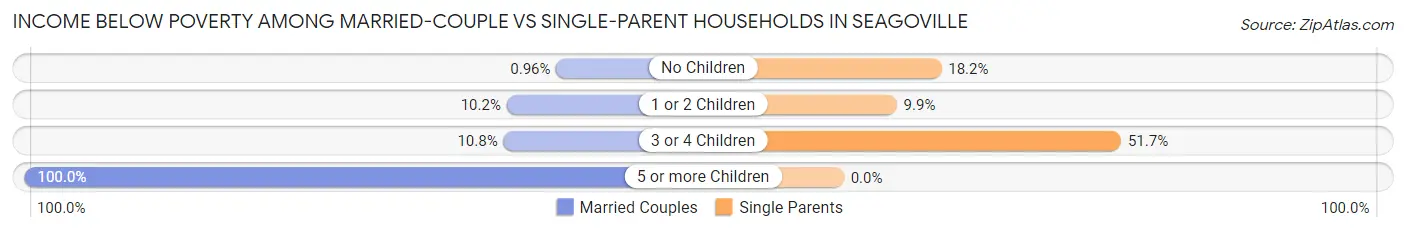
| Children | Married-Couple Families | Single-Parent Households |
| No Children | 10 (1.0%) | 74 (18.2%) |
| 1 or 2 Children | 80 (10.2%) | 103 (9.9%) |
| 3 or 4 Children | 35 (10.8%) | 94 (51.6%) |
| 5 or more Children | 23 (100.0%) | 0 (0.0%) |
| Total | 148 (6.8%) | 271 (16.6%) |
Race in Seagoville
The most populous races in Seagoville are Hispanic or Latino (9,923 | 53.2%), White / Caucasian (9,745 | 52.2%), and Black / African American (3,193 | 17.1%).
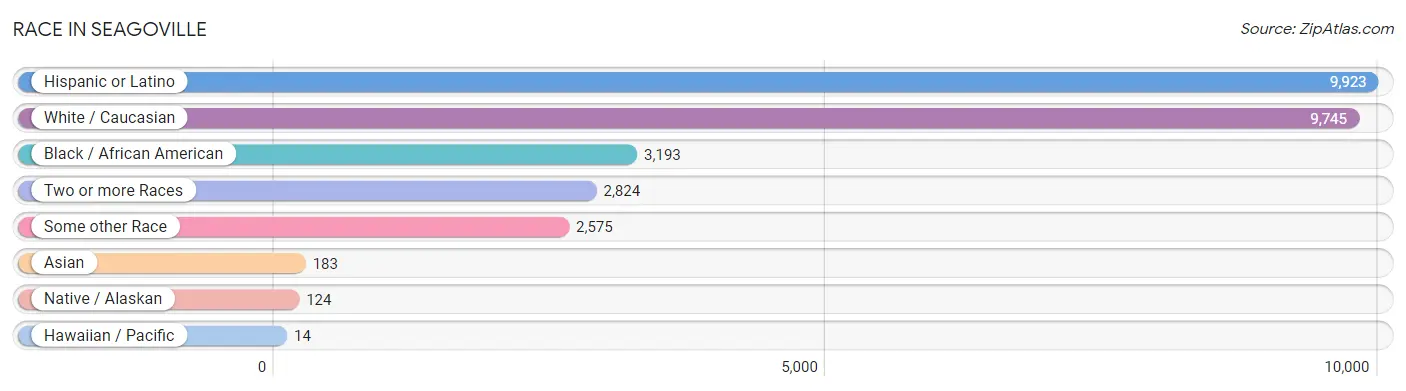
| Race | # Population | % Population |
| Asian | 183 | 1.0% |
| Black / African American | 3,193 | 17.1% |
| Hawaiian / Pacific | 14 | 0.1% |
| Hispanic or Latino | 9,923 | 53.2% |
| Native / Alaskan | 124 | 0.7% |
| White / Caucasian | 9,745 | 52.2% |
| Two or more Races | 2,824 | 15.1% |
| Some other Race | 2,575 | 13.8% |
| Total | 18,658 | 100.0% |
Ancestry in Seagoville
The most populous ancestries reported in Seagoville are Mexican (8,862 | 47.5%), American (943 | 5.1%), English (525 | 2.8%), Central American (502 | 2.7%), and German (476 | 2.5%), together accounting for 60.6% of all Seagoville residents.
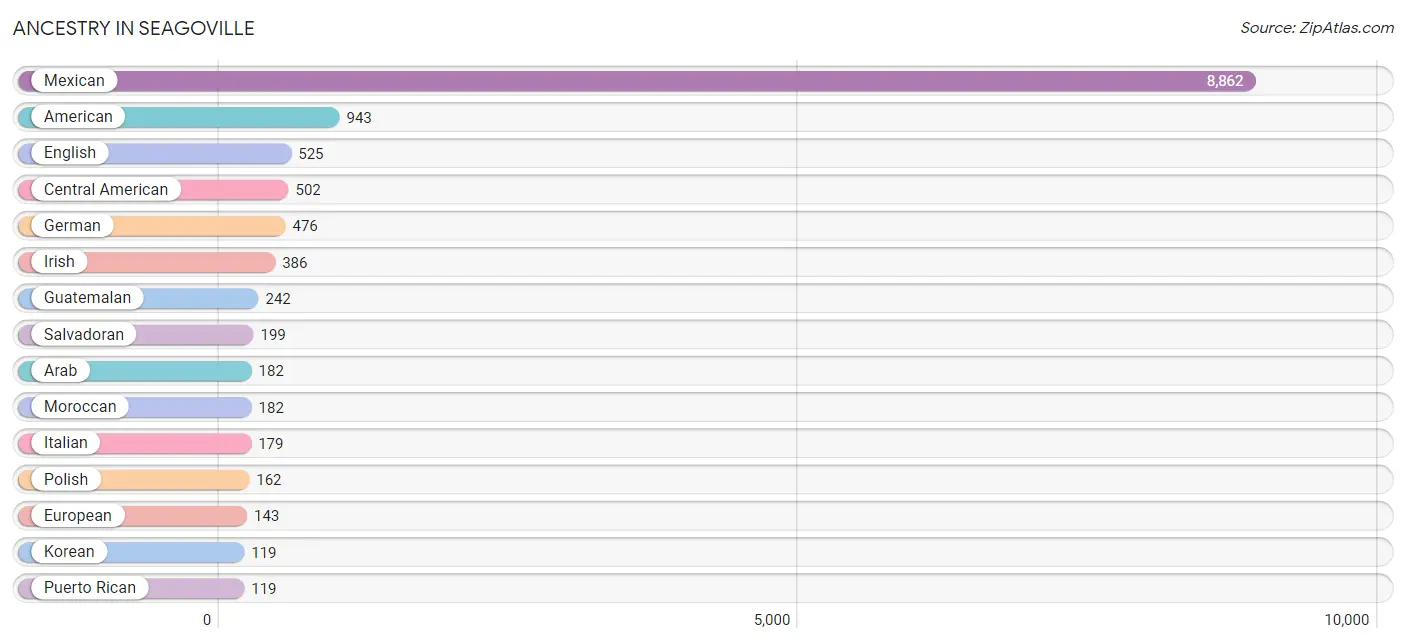
| Ancestry | # Population | % Population |
| African | 10 | 0.1% |
| American | 943 | 5.1% |
| Apache | 30 | 0.2% |
| Arab | 182 | 1.0% |
| Bhutanese | 36 | 0.2% |
| British | 97 | 0.5% |
| Central American | 502 | 2.7% |
| Cherokee | 26 | 0.1% |
| Chickasaw | 21 | 0.1% |
| Cuban | 30 | 0.2% |
| English | 525 | 2.8% |
| European | 143 | 0.8% |
| French | 10 | 0.1% |
| French Canadian | 65 | 0.4% |
| German | 476 | 2.5% |
| Guatemalan | 242 | 1.3% |
| Honduran | 37 | 0.2% |
| Hungarian | 12 | 0.1% |
| Irish | 386 | 2.1% |
| Italian | 179 | 1.0% |
| Korean | 119 | 0.6% |
| Liberian | 23 | 0.1% |
| Mexican | 8,862 | 47.5% |
| Moroccan | 182 | 1.0% |
| Nicaraguan | 24 | 0.1% |
| Polish | 162 | 0.9% |
| Puerto Rican | 119 | 0.6% |
| Salvadoran | 199 | 1.1% |
| Scotch-Irish | 52 | 0.3% |
| Scottish | 111 | 0.6% |
| Seminole | 8 | 0.0% |
| Spaniard | 11 | 0.1% |
| Sri Lankan | 17 | 0.1% |
| Subsaharan African | 33 | 0.2% |
| Welsh | 15 | 0.1% | View All 35 Rows |
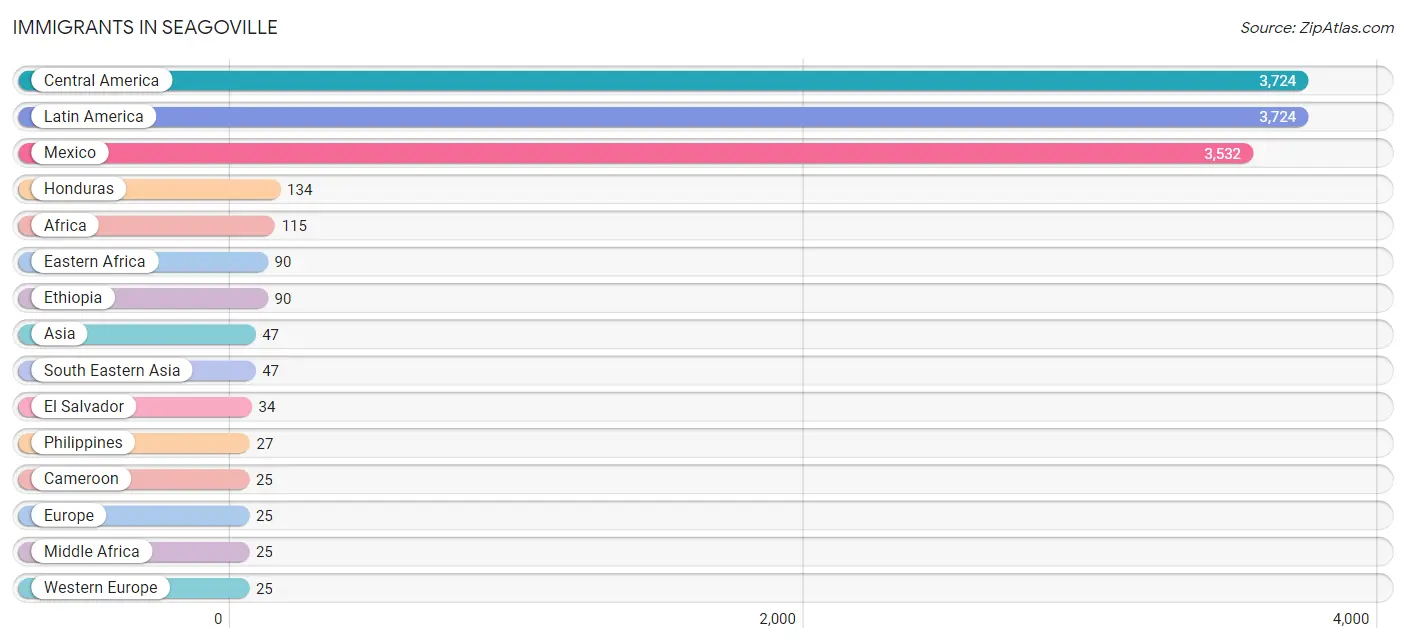
Immigrants in Seagoville
The most numerous immigrant groups reported in Seagoville came from Central America (3,724 | 20.0%), Latin America (3,724 | 20.0%), Mexico (3,532 | 18.9%), Honduras (134 | 0.7%), and Africa (115 | 0.6%), together accounting for 60.2% of all Seagoville residents.
| Immigration Origin | # Population | % Population |
| Africa | 115 | 0.6% |
| Asia | 47 | 0.3% |
| Cameroon | 25 | 0.1% |
| Central America | 3,724 | 20.0% |
| Eastern Africa | 90 | 0.5% |
| El Salvador | 34 | 0.2% |
| Ethiopia | 90 | 0.5% |
| Europe | 25 | 0.1% |
| Germany | 15 | 0.1% |
| Honduras | 134 | 0.7% |
| Latin America | 3,724 | 20.0% |
| Mexico | 3,532 | 18.9% |
| Middle Africa | 25 | 0.1% |
| Netherlands | 10 | 0.1% |
| Nicaragua | 24 | 0.1% |
| Philippines | 27 | 0.1% |
| South Eastern Asia | 47 | 0.3% |
| Vietnam | 20 | 0.1% |
| Western Europe | 25 | 0.1% | View All 19 Rows |
Sex and Age in Seagoville
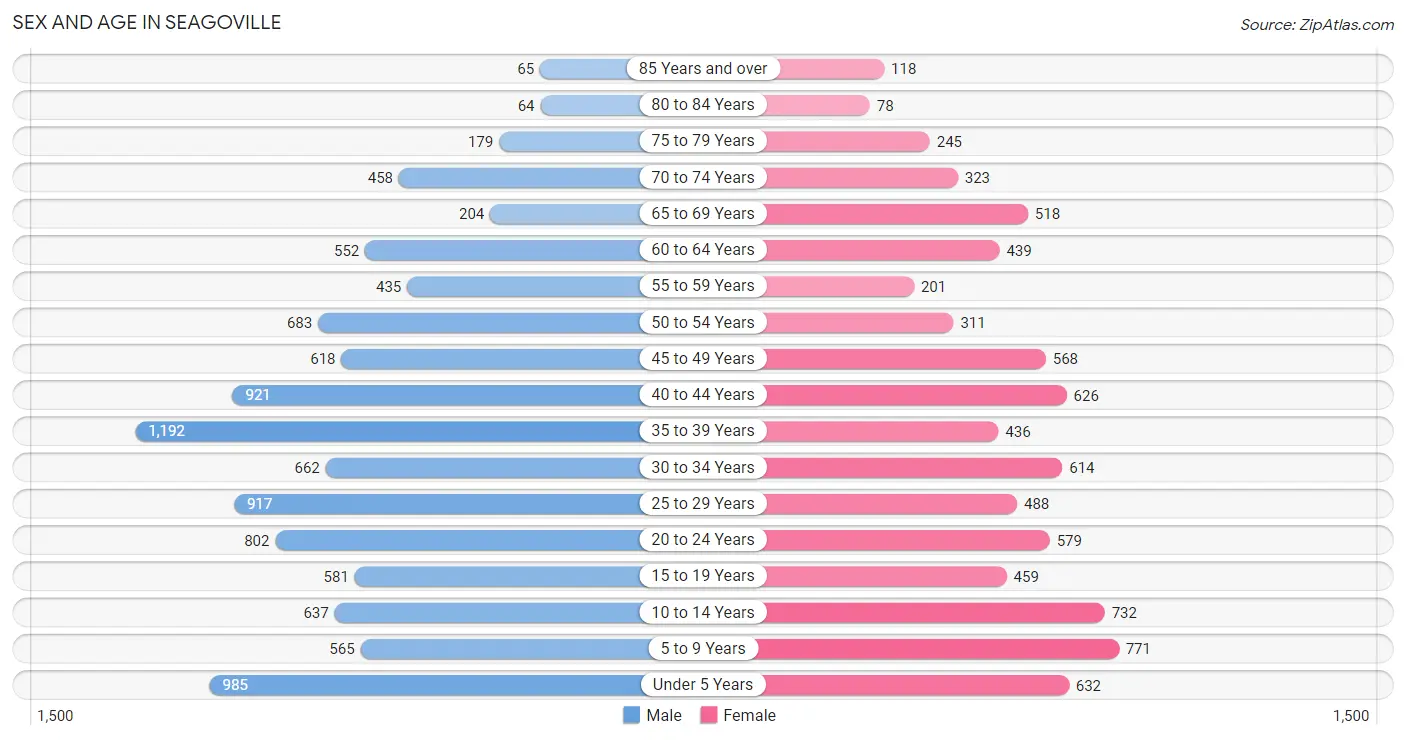
Sex and Age in Seagoville
The most populous age groups in Seagoville are 35 to 39 Years (1,192 | 11.3%) for men and 5 to 9 Years (771 | 9.5%) for women.
| Age Bracket | Male | Female |
| Under 5 Years | 985 (9.4%) | 632 (7.8%) |
| 5 to 9 Years | 565 (5.4%) | 771 (9.5%) |
| 10 to 14 Years | 637 (6.1%) | 732 (9.0%) |
| 15 to 19 Years | 581 (5.5%) | 459 (5.6%) |
| 20 to 24 Years | 802 (7.6%) | 579 (7.1%) |
| 25 to 29 Years | 917 (8.7%) | 488 (6.0%) |
| 30 to 34 Years | 662 (6.3%) | 614 (7.5%) |
| 35 to 39 Years | 1,192 (11.3%) | 436 (5.4%) |
| 40 to 44 Years | 921 (8.7%) | 626 (7.7%) |
| 45 to 49 Years | 618 (5.9%) | 568 (7.0%) |
| 50 to 54 Years | 683 (6.5%) | 311 (3.8%) |
| 55 to 59 Years | 435 (4.1%) | 201 (2.5%) |
| 60 to 64 Years | 552 (5.2%) | 439 (5.4%) |
| 65 to 69 Years | 204 (1.9%) | 518 (6.4%) |
| 70 to 74 Years | 458 (4.3%) | 323 (4.0%) |
| 75 to 79 Years | 179 (1.7%) | 245 (3.0%) |
| 80 to 84 Years | 64 (0.6%) | 78 (1.0%) |
| 85 Years and over | 65 (0.6%) | 118 (1.5%) |
| Total | 10,520 (100.0%) | 8,138 (100.0%) |
Families and Households in Seagoville
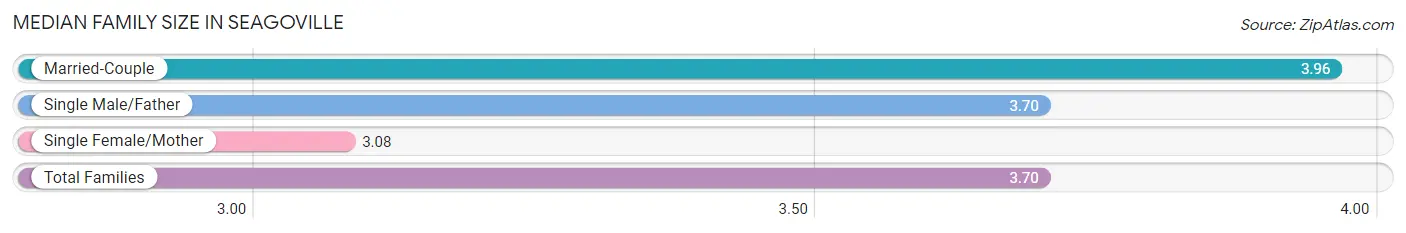
Median Family Size in Seagoville
The median family size in Seagoville is 3.70 persons per family, with married-couple families (2,174 | 57.1%) accounting for the largest median family size of 3.96 persons per family. On the other hand, single female/mother families (895 | 23.5%) represent the smallest median family size with 3.08 persons per family.
| Family Type | # Families | Family Size |
| Married-Couple | 2,174 (57.1%) | 3.96 |
| Single Male/Father | 738 (19.4%) | 3.70 |
| Single Female/Mother | 895 (23.5%) | 3.08 |
| Total Families | 3,807 (100.0%) | 3.70 |
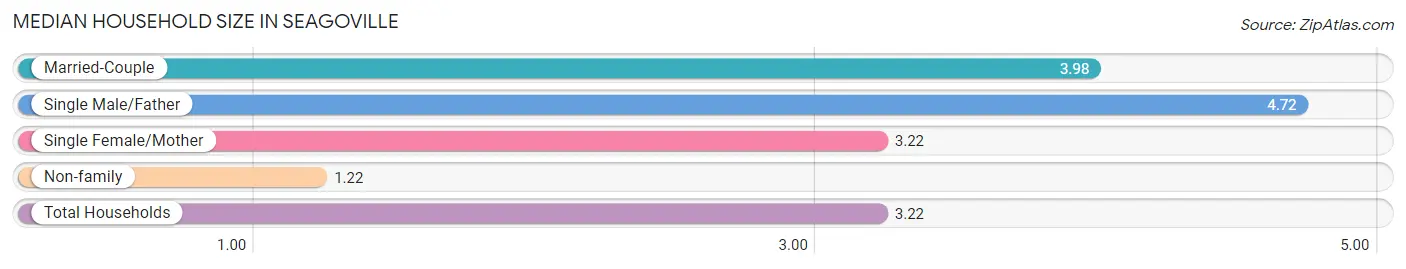
Median Household Size in Seagoville
The median household size in Seagoville is 3.22 persons per household, with single male/father households (738 | 14.2%) accounting for the largest median household size of 4.72 persons per household. non-family households (1,378 | 26.6%) represent the smallest median household size with 1.22 persons per household.
| Household Type | # Households | Household Size |
| Married-Couple | 2,174 (41.9%) | 3.98 |
| Single Male/Father | 738 (14.2%) | 4.72 |
| Single Female/Mother | 895 (17.3%) | 3.22 |
| Non-family | 1,378 (26.6%) | 1.22 |
| Total Households | 5,185 (100.0%) | 3.22 |
Household Size by Marriage Status in Seagoville
Out of a total of 5,185 households in Seagoville, 3,807 (73.4%) are family households, while 1,378 (26.6%) are nonfamily households. The most numerous type of family households are 2-person households, comprising 1,128, and the most common type of nonfamily households are 1-person households, comprising 1,081.
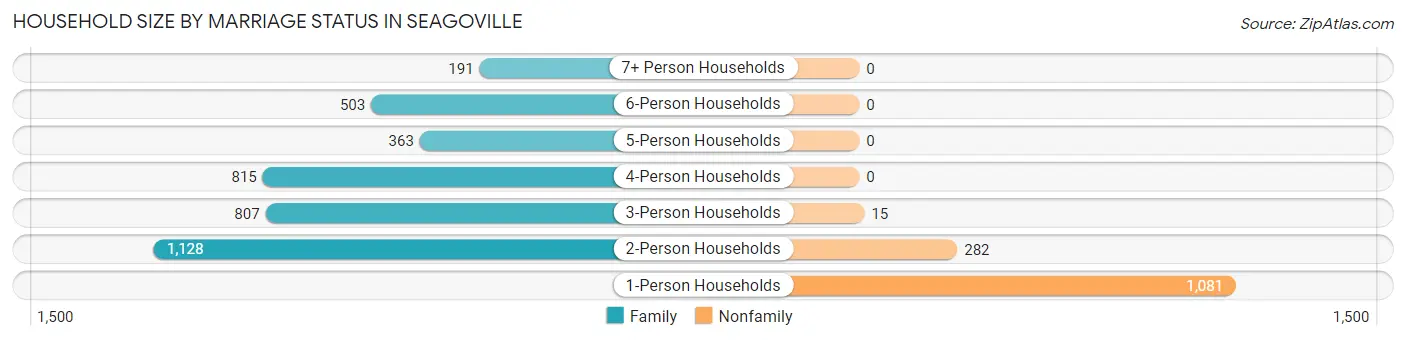
| Household Size | Family Households | Nonfamily Households |
| 1-Person Households | - | 1,081 (20.8%) |
| 2-Person Households | 1,128 (21.8%) | 282 (5.4%) |
| 3-Person Households | 807 (15.6%) | 15 (0.3%) |
| 4-Person Households | 815 (15.7%) | 0 (0.0%) |
| 5-Person Households | 363 (7.0%) | 0 (0.0%) |
| 6-Person Households | 503 (9.7%) | 0 (0.0%) |
| 7+ Person Households | 191 (3.7%) | 0 (0.0%) |
| Total | 3,807 (73.4%) | 1,378 (26.6%) |
Female Fertility in Seagoville
Fertility by Age in Seagoville
Average fertility rate in Seagoville is 41.0 births per 1,000 women. Women in the age bracket of 20 to 34 years have the highest fertility rate with 93.0 births per 1,000 women. Women in the age bracket of 20 to 34 years acount for 100.0% of all women with births.
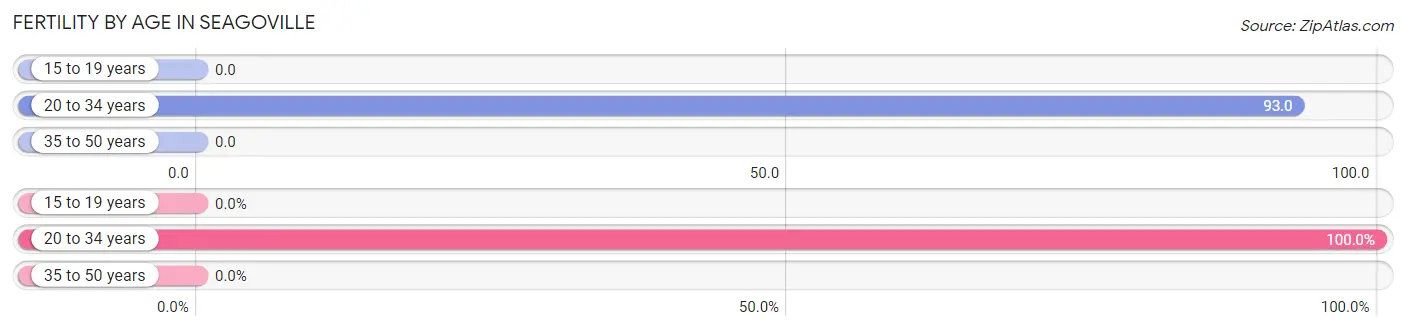
| Age Bracket | Women with Births | Births / 1,000 Women |
| 15 to 19 years | 0 (0.0%) | 0.0 |
| 20 to 34 years | 156 (100.0%) | 93.0 |
| 35 to 50 years | 0 (0.0%) | 0.0 |
| Total | 156 (100.0%) | 41.0 |
Fertility by Age by Marriage Status in Seagoville
57.1% of women with births (156) in Seagoville are married. The highest percentage of unmarried women with births falls into 20 to 34 years age bracket with 42.9% of them unmarried at the time of birth, while the lowest percentage of unmarried women with births belong to 20 to 34 years age bracket with 42.9% of them unmarried.
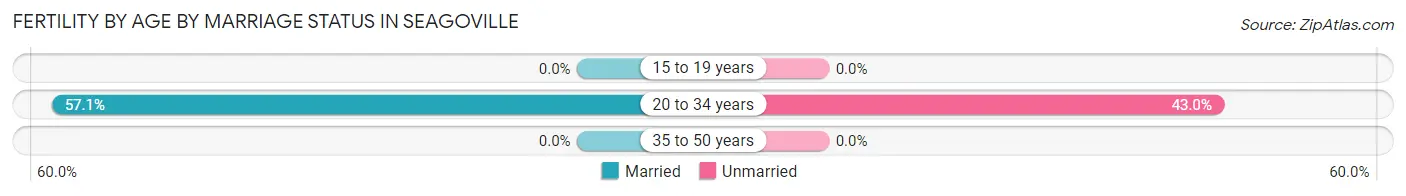
| Age Bracket | Married | Unmarried |
| 15 to 19 years | 0 (0.0%) | 0 (0.0%) |
| 20 to 34 years | 89 (57.1%) | 67 (42.9%) |
| 35 to 50 years | 0 (0.0%) | 0 (0.0%) |
| Total | 89 (57.1%) | 67 (42.9%) |
Fertility by Education in Seagoville
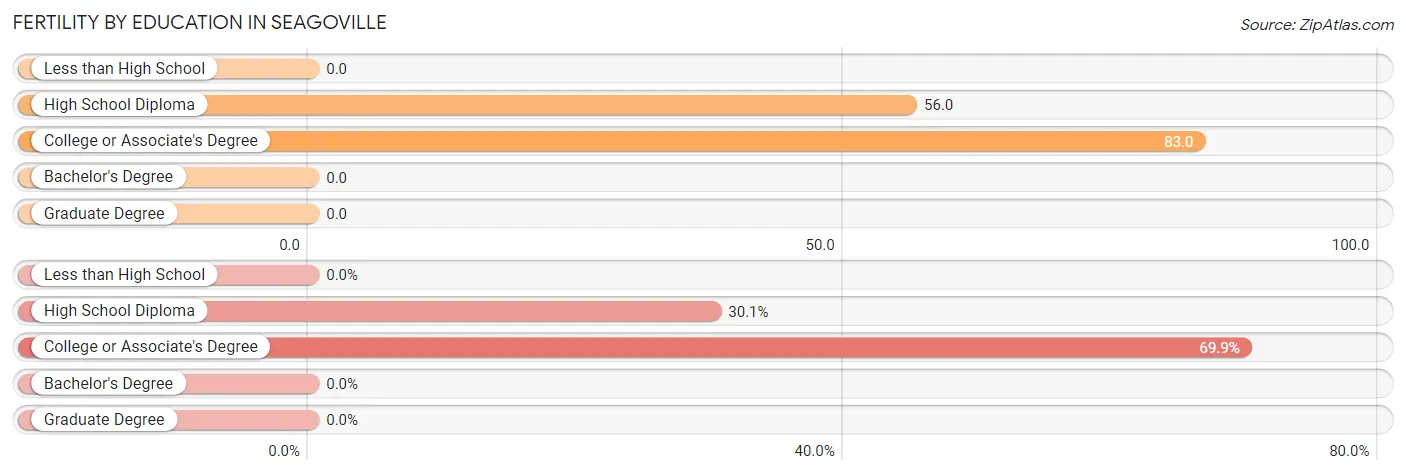
| Educational Attainment | Women with Births | Births / 1,000 Women |
| Less than High School | 0 (0.0%) | 0.0 |
| High School Diploma | 47 (30.1%) | 56.0 |
| College or Associate's Degree | 109 (69.9%) | 83.0 |
| Bachelor's Degree | 0 (0.0%) | 0.0 |
| Graduate Degree | 0 (0.0%) | 0.0 |
| Total | 156 (100.0%) | 41.0 |
Fertility by Education by Marriage Status in Seagoville
42.9% of women with births in Seagoville are unmarried. Women with the educational attainment of high school diploma are most likely to be married with 100.0% of them married at childbirth, while women with the educational attainment of college or associate's degree are least likely to be married with 61.5% of them unmarried at childbirth.
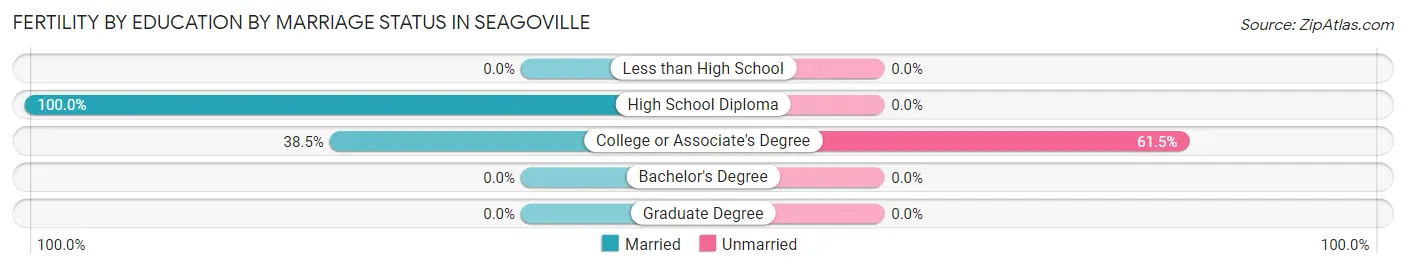
| Educational Attainment | Married | Unmarried |
| Less than High School | 0 (0.0%) | 0 (0.0%) |
| High School Diploma | 47 (100.0%) | 0 (0.0%) |
| College or Associate's Degree | 42 (38.5%) | 67 (61.5%) |
| Bachelor's Degree | 0 (0.0%) | 0 (0.0%) |
| Graduate Degree | 0 (0.0%) | 0 (0.0%) |
| Total | 89 (57.1%) | 67 (42.9%) |
Employment Characteristics in Seagoville
Employment by Class of Employer in Seagoville
Among the 6,900 employed individuals in Seagoville, private company employees (5,124 | 74.3%), local government employees (554 | 8.0%), and self-employed (not incorporated) (477 | 6.9%) make up the most common classes of employment.
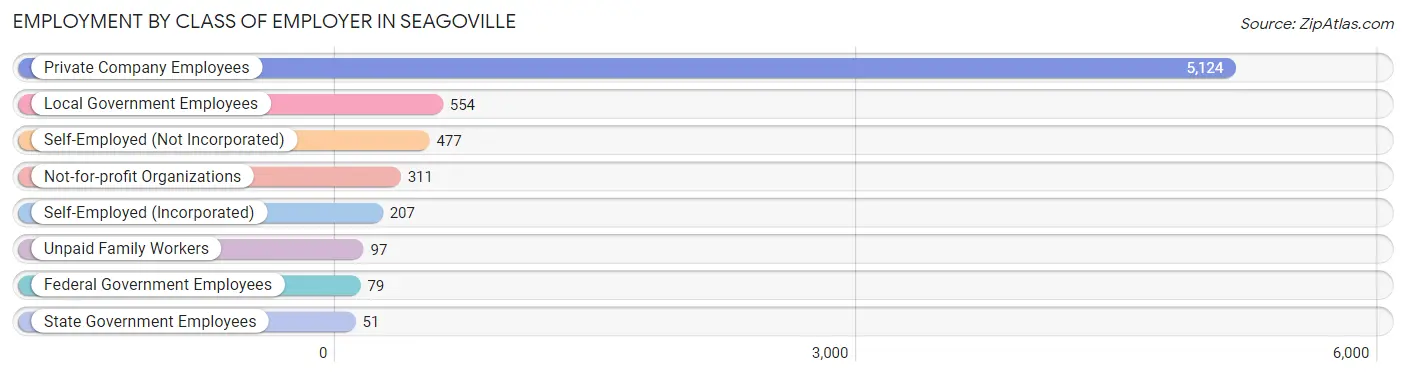
| Employer Class | # Employees | % Employees |
| Private Company Employees | 5,124 | 74.3% |
| Self-Employed (Incorporated) | 207 | 3.0% |
| Self-Employed (Not Incorporated) | 477 | 6.9% |
| Not-for-profit Organizations | 311 | 4.5% |
| Local Government Employees | 554 | 8.0% |
| State Government Employees | 51 | 0.7% |
| Federal Government Employees | 79 | 1.1% |
| Unpaid Family Workers | 97 | 1.4% |
| Total | 6,900 | 100.0% |
Employment Status by Age in Seagoville
According to the labor force statistics for Seagoville, out of the total population over 16 years of age (14,065), 54.9% or 7,722 individuals are in the labor force, with 7.3% or 564 of them unemployed. The age group with the highest labor force participation rate is 25 to 29 years, with 80.9% or 1,137 individuals in the labor force. Within the labor force, the 20 to 24 years age range has the highest percentage of unemployed individuals, with 24.8% or 201 of them being unemployed.
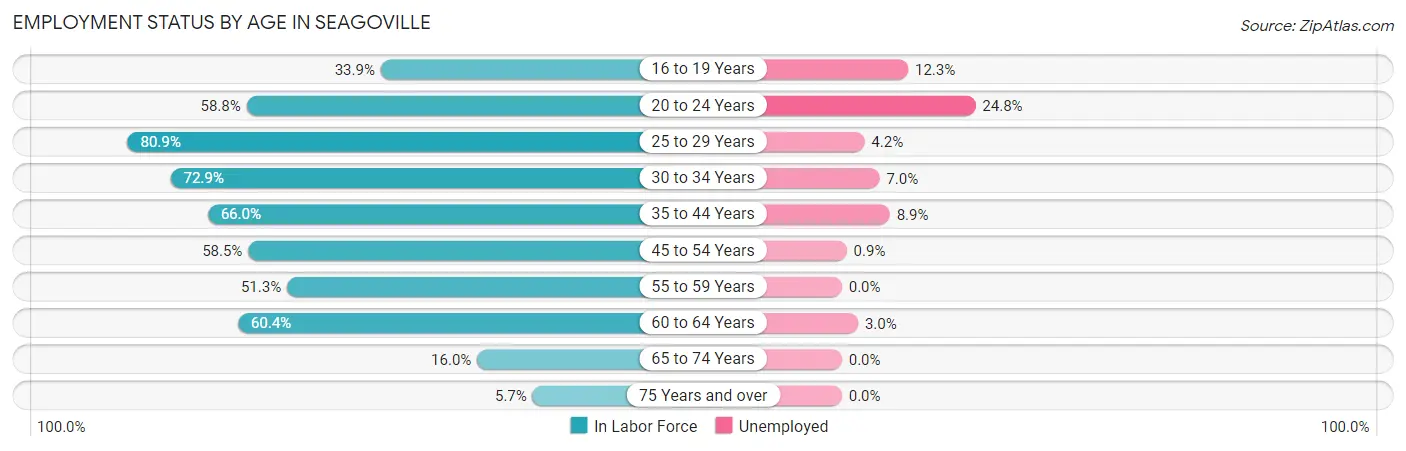
| Age Bracket | In Labor Force | Unemployed |
| 16 to 19 Years | 261 (33.9%) | 32 (12.3%) |
| 20 to 24 Years | 812 (58.8%) | 201 (24.8%) |
| 25 to 29 Years | 1,137 (80.9%) | 48 (4.2%) |
| 30 to 34 Years | 930 (72.9%) | 65 (7.0%) |
| 35 to 44 Years | 2,096 (66.0%) | 187 (8.9%) |
| 45 to 54 Years | 1,275 (58.5%) | 11 (0.9%) |
| 55 to 59 Years | 326 (51.3%) | 0 (0.0%) |
| 60 to 64 Years | 599 (60.4%) | 18 (3.0%) |
| 65 to 74 Years | 240 (16.0%) | 0 (0.0%) |
| 75 Years and over | 43 (5.7%) | 0 (0.0%) |
| Total | 7,722 (54.9%) | 564 (7.3%) |
Employment Status by Educational Attainment in Seagoville
According to labor force statistics for Seagoville, 65.8% of individuals (6,358) out of the total population between 25 and 64 years of age (9,663) are in the labor force, with 5.2% or 331 of them being unemployed. The group with the highest labor force participation rate are those with the educational attainment of high school diploma, with 66.4% or 2,042 individuals in the labor force. Within the labor force, individuals with high school diploma education have the highest percentage of unemployment, with 9.9% or 202 of them being unemployed.
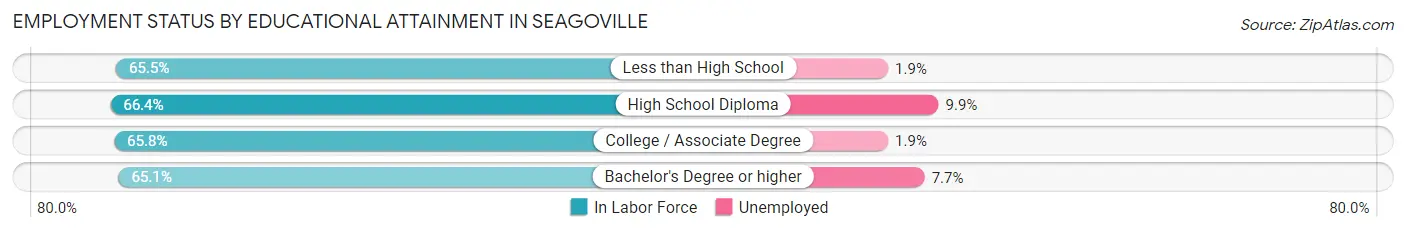
| Educational Attainment | In Labor Force | Unemployed |
| Less than High School | 1,759 (65.5%) | 51 (1.9%) |
| High School Diploma | 2,042 (66.4%) | 305 (9.9%) |
| College / Associate Degree | 1,775 (65.8%) | 51 (1.9%) |
| Bachelor's Degree or higher | 784 (65.1%) | 93 (7.7%) |
| Total | 6,358 (65.8%) | 502 (5.2%) |
Employment Occupations by Sex in Seagoville
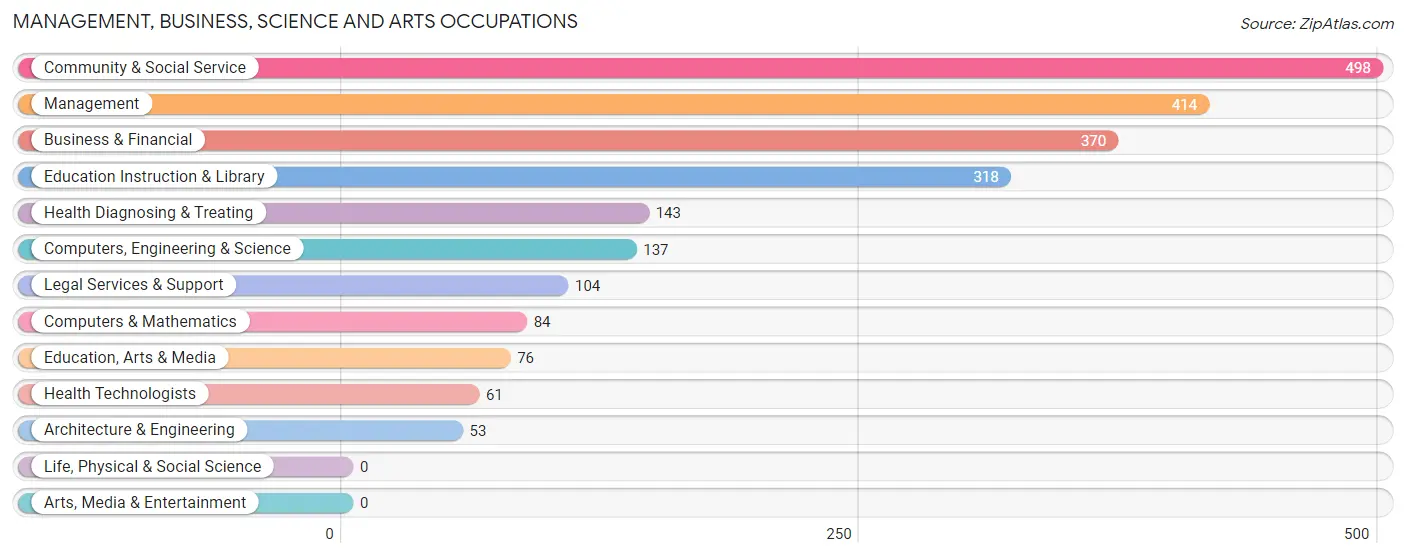
Management, Business, Science and Arts Occupations
The most common Management, Business, Science and Arts occupations in Seagoville are Community & Social Service (498 | 7.0%), Management (414 | 5.8%), Business & Financial (370 | 5.2%), Education Instruction & Library (318 | 4.4%), and Health Diagnosing & Treating (143 | 2.0%).
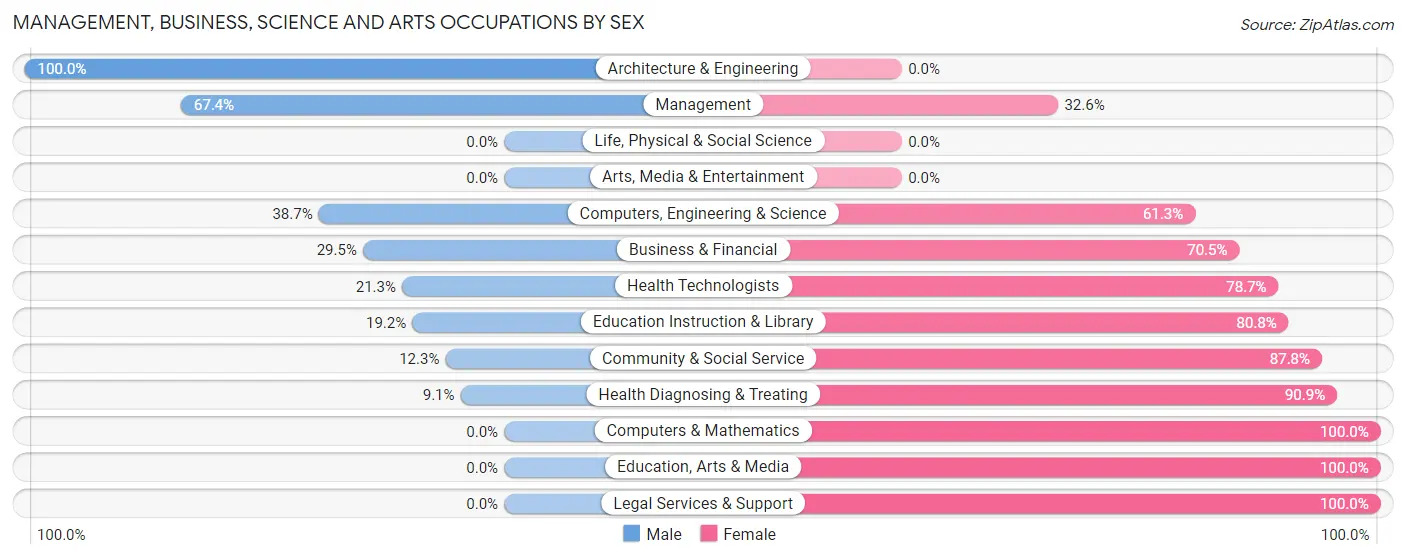
Management, Business, Science and Arts Occupations by Sex
Within the Management, Business, Science and Arts occupations in Seagoville, the most male-oriented occupations are Architecture & Engineering (100.0%), Management (67.4%), and Computers, Engineering & Science (38.7%), while the most female-oriented occupations are Computers & Mathematics (100.0%), Education, Arts & Media (100.0%), and Legal Services & Support (100.0%).
| Occupation | Male | Female |
| Management | 279 (67.4%) | 135 (32.6%) |
| Business & Financial | 109 (29.5%) | 261 (70.5%) |
| Computers, Engineering & Science | 53 (38.7%) | 84 (61.3%) |
| Computers & Mathematics | 0 (0.0%) | 84 (100.0%) |
| Architecture & Engineering | 53 (100.0%) | 0 (0.0%) |
| Life, Physical & Social Science | 0 (0.0%) | 0 (0.0%) |
| Community & Social Service | 61 (12.2%) | 437 (87.7%) |
| Education, Arts & Media | 0 (0.0%) | 76 (100.0%) |
| Legal Services & Support | 0 (0.0%) | 104 (100.0%) |
| Education Instruction & Library | 61 (19.2%) | 257 (80.8%) |
| Arts, Media & Entertainment | 0 (0.0%) | 0 (0.0%) |
| Health Diagnosing & Treating | 13 (9.1%) | 130 (90.9%) |
| Health Technologists | 13 (21.3%) | 48 (78.7%) |
| Total (Category) | 515 (33.0%) | 1,047 (67.0%) |
| Total (Overall) | 4,263 (59.6%) | 2,894 (40.4%) |
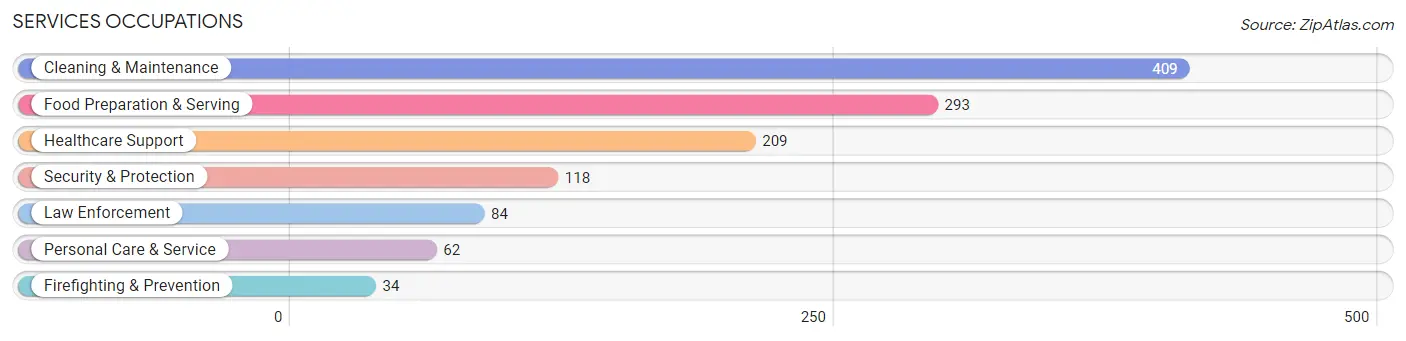
Services Occupations
The most common Services occupations in Seagoville are Cleaning & Maintenance (409 | 5.7%), Food Preparation & Serving (293 | 4.1%), Healthcare Support (209 | 2.9%), Security & Protection (118 | 1.7%), and Law Enforcement (84 | 1.2%).
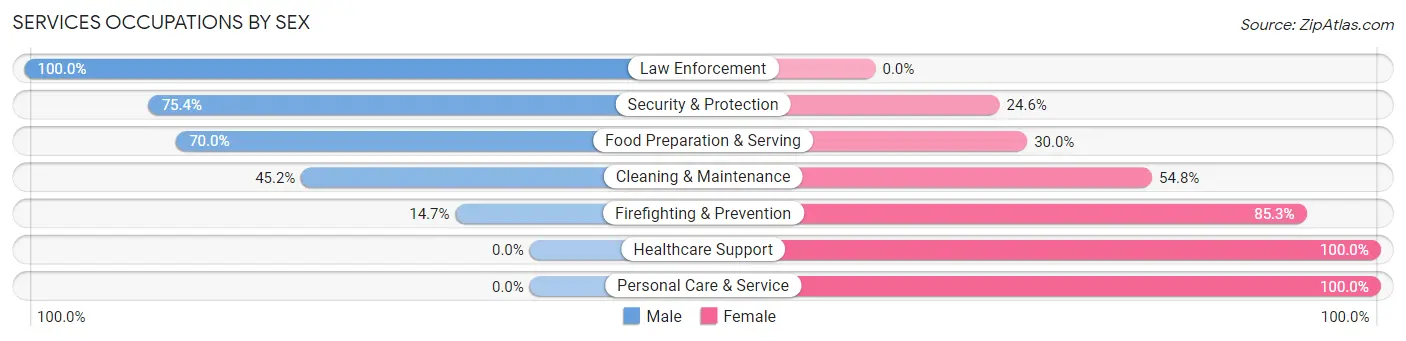
Services Occupations by Sex
Within the Services occupations in Seagoville, the most male-oriented occupations are Law Enforcement (100.0%), Security & Protection (75.4%), and Food Preparation & Serving (70.0%), while the most female-oriented occupations are Healthcare Support (100.0%), Personal Care & Service (100.0%), and Firefighting & Prevention (85.3%).
| Occupation | Male | Female |
| Healthcare Support | 0 (0.0%) | 209 (100.0%) |
| Security & Protection | 89 (75.4%) | 29 (24.6%) |
| Firefighting & Prevention | 5 (14.7%) | 29 (85.3%) |
| Law Enforcement | 84 (100.0%) | 0 (0.0%) |
| Food Preparation & Serving | 205 (70.0%) | 88 (30.0%) |
| Cleaning & Maintenance | 185 (45.2%) | 224 (54.8%) |
| Personal Care & Service | 0 (0.0%) | 62 (100.0%) |
| Total (Category) | 479 (43.9%) | 612 (56.1%) |
| Total (Overall) | 4,263 (59.6%) | 2,894 (40.4%) |
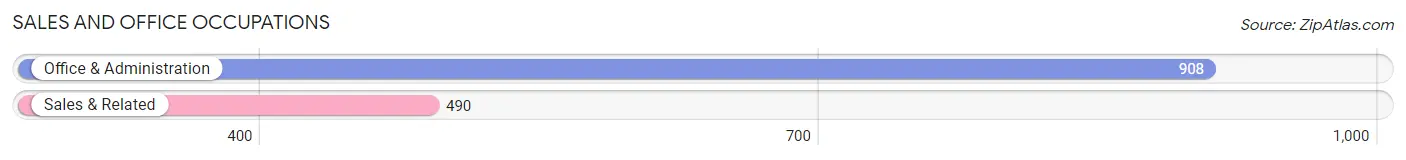
Sales and Office Occupations
The most common Sales and Office occupations in Seagoville are Office & Administration (908 | 12.7%), and Sales & Related (490 | 6.9%).
Sales and Office Occupations by Sex
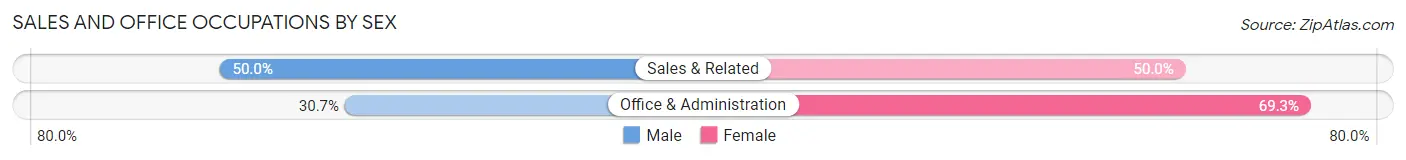
| Occupation | Male | Female |
| Sales & Related | 245 (50.0%) | 245 (50.0%) |
| Office & Administration | 279 (30.7%) | 629 (69.3%) |
| Total (Category) | 524 (37.5%) | 874 (62.5%) |
| Total (Overall) | 4,263 (59.6%) | 2,894 (40.4%) |
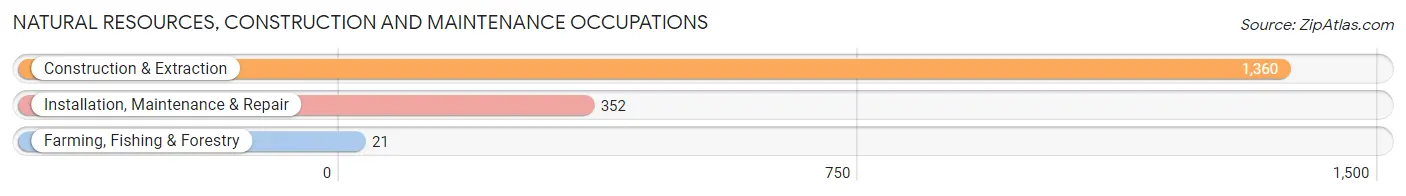
Natural Resources, Construction and Maintenance Occupations
The most common Natural Resources, Construction and Maintenance occupations in Seagoville are Construction & Extraction (1,360 | 19.0%), Installation, Maintenance & Repair (352 | 4.9%), and Farming, Fishing & Forestry (21 | 0.3%).
Natural Resources, Construction and Maintenance Occupations by Sex
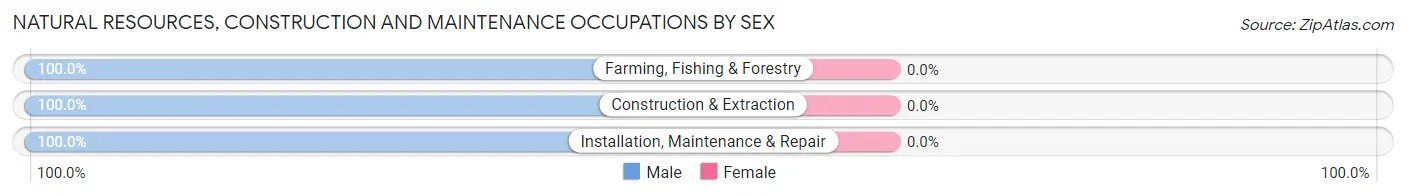
| Occupation | Male | Female |
| Farming, Fishing & Forestry | 21 (100.0%) | 0 (0.0%) |
| Construction & Extraction | 1,360 (100.0%) | 0 (0.0%) |
| Installation, Maintenance & Repair | 352 (100.0%) | 0 (0.0%) |
| Total (Category) | 1,733 (100.0%) | 0 (0.0%) |
| Total (Overall) | 4,263 (59.6%) | 2,894 (40.4%) |
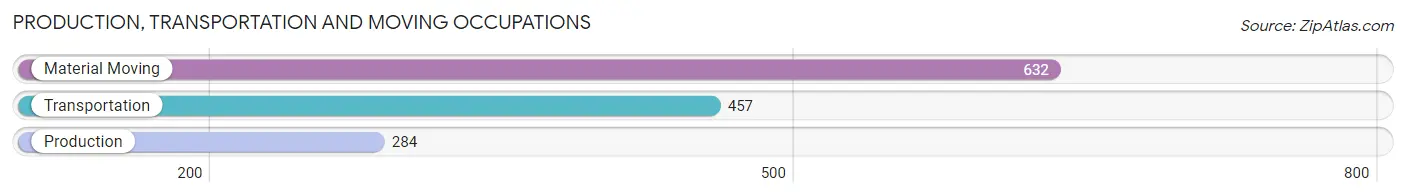
Production, Transportation and Moving Occupations
The most common Production, Transportation and Moving occupations in Seagoville are Material Moving (632 | 8.8%), Transportation (457 | 6.4%), and Production (284 | 4.0%).
Production, Transportation and Moving Occupations by Sex
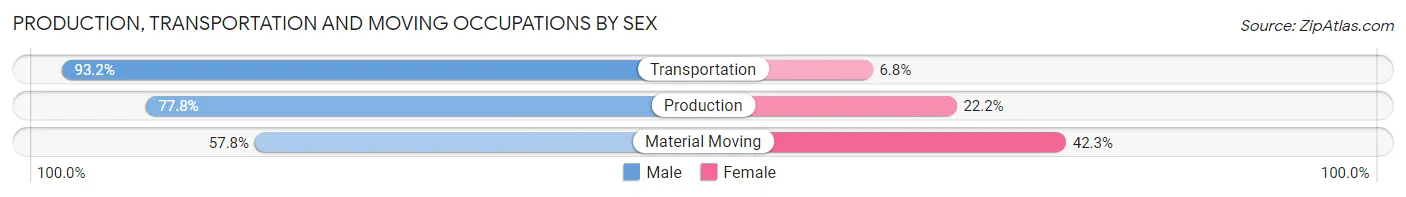
| Occupation | Male | Female |
| Production | 221 (77.8%) | 63 (22.2%) |
| Transportation | 426 (93.2%) | 31 (6.8%) |
| Material Moving | 365 (57.8%) | 267 (42.2%) |
| Total (Category) | 1,012 (73.7%) | 361 (26.3%) |
| Total (Overall) | 4,263 (59.6%) | 2,894 (40.4%) |
Employment Industries by Sex in Seagoville
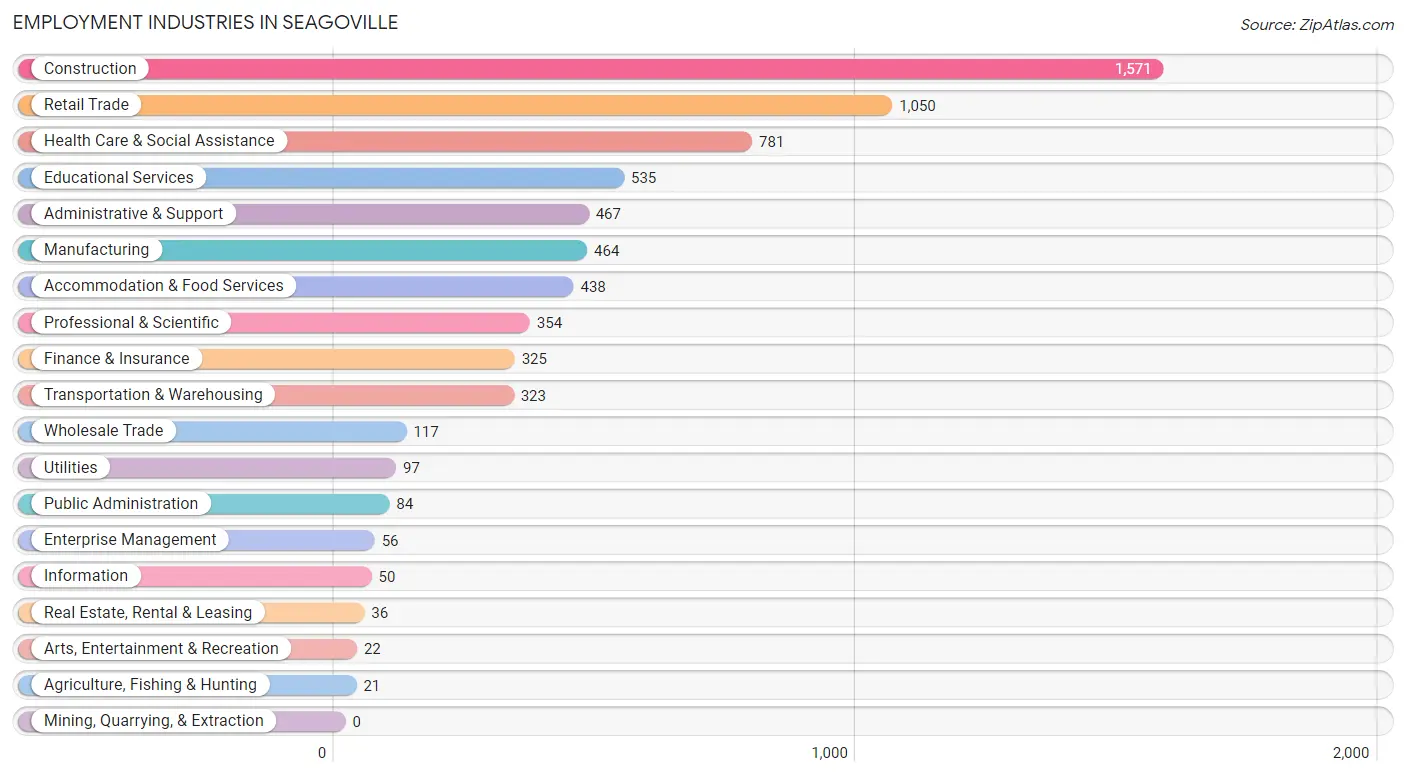
Employment Industries in Seagoville
The major employment industries in Seagoville include Construction (1,571 | 22.0%), Retail Trade (1,050 | 14.7%), Health Care & Social Assistance (781 | 10.9%), Educational Services (535 | 7.5%), and Administrative & Support (467 | 6.5%).
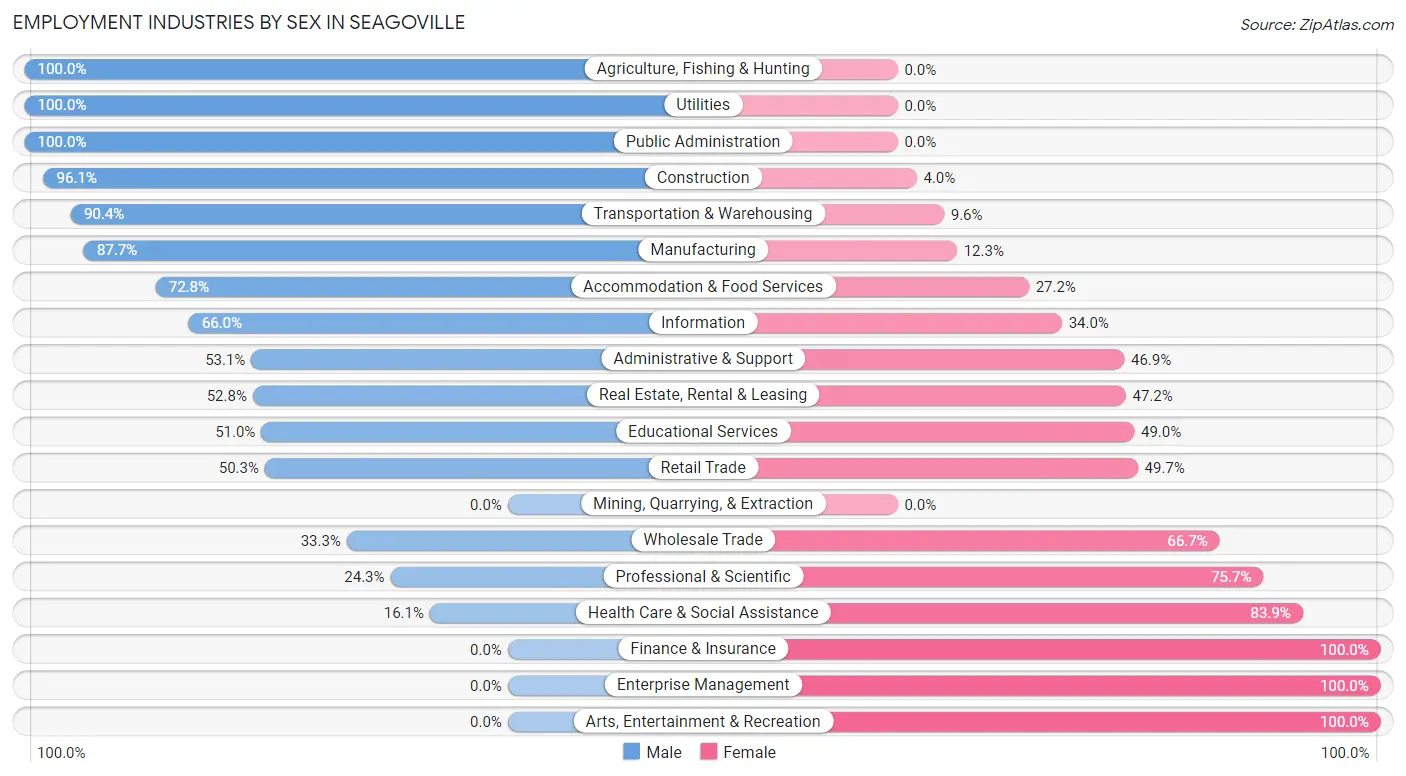
Employment Industries by Sex in Seagoville
The Seagoville industries that see more men than women are Agriculture, Fishing & Hunting (100.0%), Utilities (100.0%), and Public Administration (100.0%), whereas the industries that tend to have a higher number of women are Finance & Insurance (100.0%), Enterprise Management (100.0%), and Arts, Entertainment & Recreation (100.0%).
| Industry | Male | Female |
| Agriculture, Fishing & Hunting | 21 (100.0%) | 0 (0.0%) |
| Mining, Quarrying, & Extraction | 0 (0.0%) | 0 (0.0%) |
| Construction | 1,509 (96.1%) | 62 (4.0%) |
| Manufacturing | 407 (87.7%) | 57 (12.3%) |
| Wholesale Trade | 39 (33.3%) | 78 (66.7%) |
| Retail Trade | 528 (50.3%) | 522 (49.7%) |
| Transportation & Warehousing | 292 (90.4%) | 31 (9.6%) |
| Utilities | 97 (100.0%) | 0 (0.0%) |
| Information | 33 (66.0%) | 17 (34.0%) |
| Finance & Insurance | 0 (0.0%) | 325 (100.0%) |
| Real Estate, Rental & Leasing | 19 (52.8%) | 17 (47.2%) |
| Professional & Scientific | 86 (24.3%) | 268 (75.7%) |
| Enterprise Management | 0 (0.0%) | 56 (100.0%) |
| Administrative & Support | 248 (53.1%) | 219 (46.9%) |
| Educational Services | 273 (51.0%) | 262 (49.0%) |
| Health Care & Social Assistance | 126 (16.1%) | 655 (83.9%) |
| Arts, Entertainment & Recreation | 0 (0.0%) | 22 (100.0%) |
| Accommodation & Food Services | 319 (72.8%) | 119 (27.2%) |
| Public Administration | 84 (100.0%) | 0 (0.0%) |
| Total | 4,263 (59.6%) | 2,894 (40.4%) |
Education in Seagoville
School Enrollment in Seagoville
The most common levels of schooling among the 4,656 students in Seagoville are middle school (1,084 | 23.3%), elementary school (1,070 | 23.0%), and high school (1,025 | 22.0%).
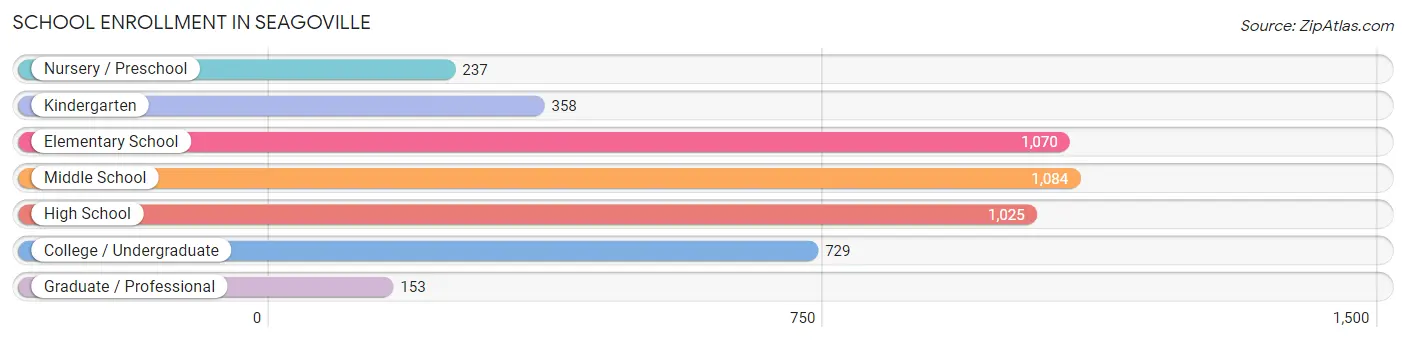
| School Level | # Students | % Students |
| Nursery / Preschool | 237 | 5.1% |
| Kindergarten | 358 | 7.7% |
| Elementary School | 1,070 | 23.0% |
| Middle School | 1,084 | 23.3% |
| High School | 1,025 | 22.0% |
| College / Undergraduate | 729 | 15.7% |
| Graduate / Professional | 153 | 3.3% |
| Total | 4,656 | 100.0% |
School Enrollment by Age by Funding Source in Seagoville
Out of a total of 4,656 students who are enrolled in schools in Seagoville, 307 (6.6%) attend a private institution, while the remaining 4,349 (93.4%) are enrolled in public schools. The age group of 25 to 34 year olds has the highest likelihood of being enrolled in private schools, with 102 (61.1% in the age bracket) enrolled. Conversely, the age group of 20 to 24 year olds has the lowest likelihood of being enrolled in a private school, with 481 (100.0% in the age bracket) attending a public institution.
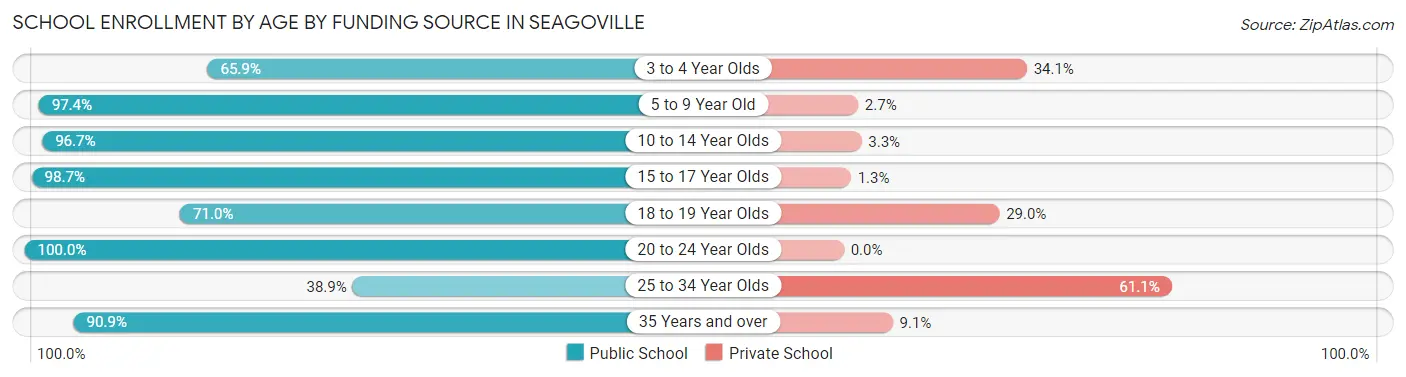
| Age Bracket | Public School | Private School |
| 3 to 4 Year Olds | 116 (65.9%) | 60 (34.1%) |
| 5 to 9 Year Old | 1,213 (97.4%) | 33 (2.6%) |
| 10 to 14 Year Olds | 1,324 (96.7%) | 45 (3.3%) |
| 15 to 17 Year Olds | 825 (98.7%) | 11 (1.3%) |
| 18 to 19 Year Olds | 76 (71.0%) | 31 (29.0%) |
| 20 to 24 Year Olds | 481 (100.0%) | 0 (0.0%) |
| 25 to 34 Year Olds | 65 (38.9%) | 102 (61.1%) |
| 35 Years and over | 249 (90.9%) | 25 (9.1%) |
| Total | 4,349 (93.4%) | 307 (6.6%) |
Educational Attainment by Field of Study in Seagoville
Business (521 | 34.5%), education (267 | 17.7%), arts & humanities (184 | 12.2%), science & technology (134 | 8.9%), and social sciences (68 | 4.5%) are the most common fields of study among 1,508 individuals in Seagoville who have obtained a bachelor's degree or higher.
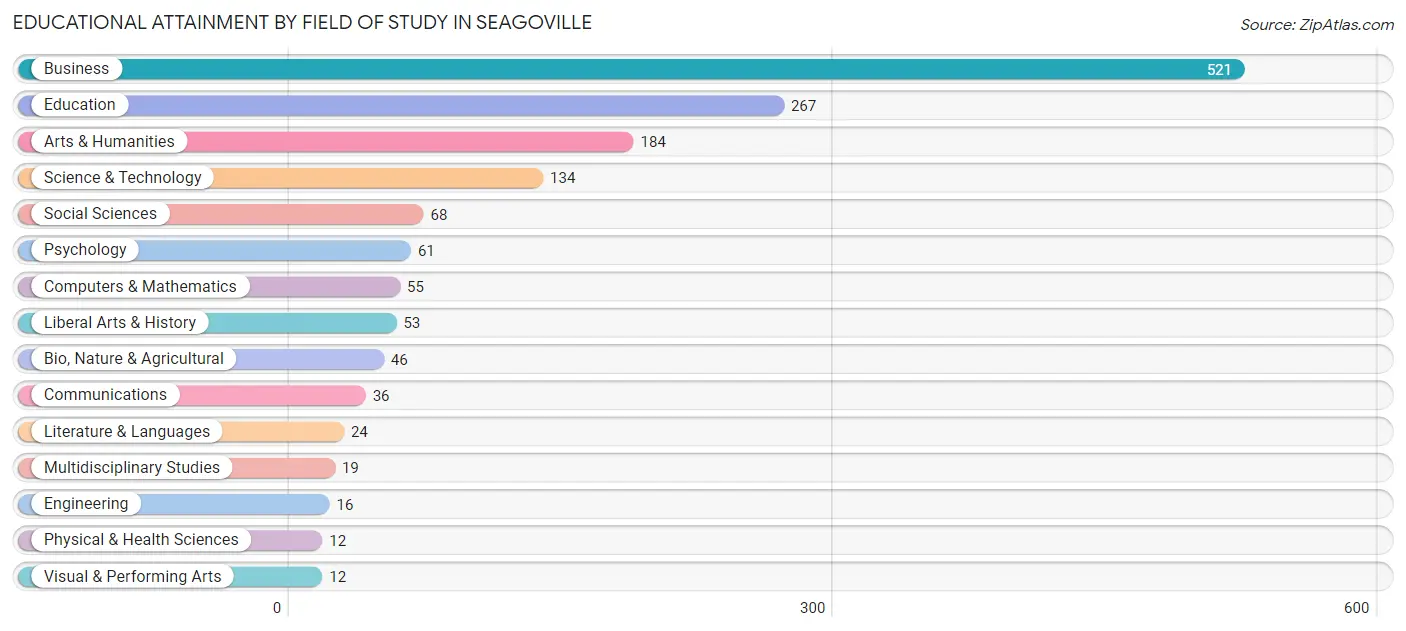
| Field of Study | # Graduates | % Graduates |
| Computers & Mathematics | 55 | 3.6% |
| Bio, Nature & Agricultural | 46 | 3.0% |
| Physical & Health Sciences | 12 | 0.8% |
| Psychology | 61 | 4.1% |
| Social Sciences | 68 | 4.5% |
| Engineering | 16 | 1.1% |
| Multidisciplinary Studies | 19 | 1.3% |
| Science & Technology | 134 | 8.9% |
| Business | 521 | 34.5% |
| Education | 267 | 17.7% |
| Literature & Languages | 24 | 1.6% |
| Liberal Arts & History | 53 | 3.5% |
| Visual & Performing Arts | 12 | 0.8% |
| Communications | 36 | 2.4% |
| Arts & Humanities | 184 | 12.2% |
| Total | 1,508 | 100.0% |
Transportation & Commute in Seagoville
Vehicle Availability by Sex in Seagoville
The most prevalent vehicle ownership categories in Seagoville are males with 2 vehicles (1,708, accounting for 40.2%) and females with 2 vehicles (1,084, making up 64.4%).
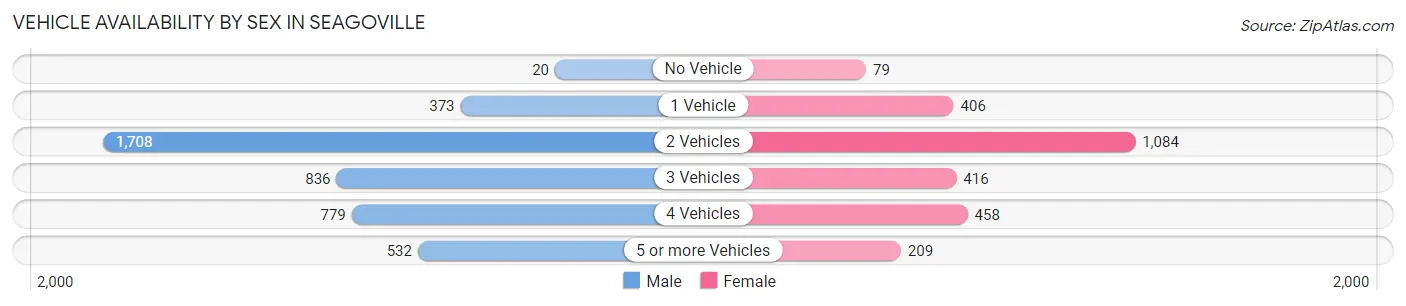
| Vehicles Available | Male | Female |
| No Vehicle | 20 (0.5%) | 79 (3.0%) |
| 1 Vehicle | 373 (8.8%) | 406 (15.3%) |
| 2 Vehicles | 1,708 (40.2%) | 1,084 (40.9%) |
| 3 Vehicles | 836 (19.7%) | 416 (15.7%) |
| 4 Vehicles | 779 (18.3%) | 458 (17.3%) |
| 5 or more Vehicles | 532 (12.5%) | 209 (7.9%) |
| Total | 4,248 (100.0%) | 2,652 (100.0%) |
Commute Time in Seagoville
The most frequently occuring commute durations in Seagoville are 45 to 59 minutes (1,143 commuters, 18.1%), 30 to 34 minutes (1,061 commuters, 16.8%), and 60 to 89 minutes (1,005 commuters, 16.0%).
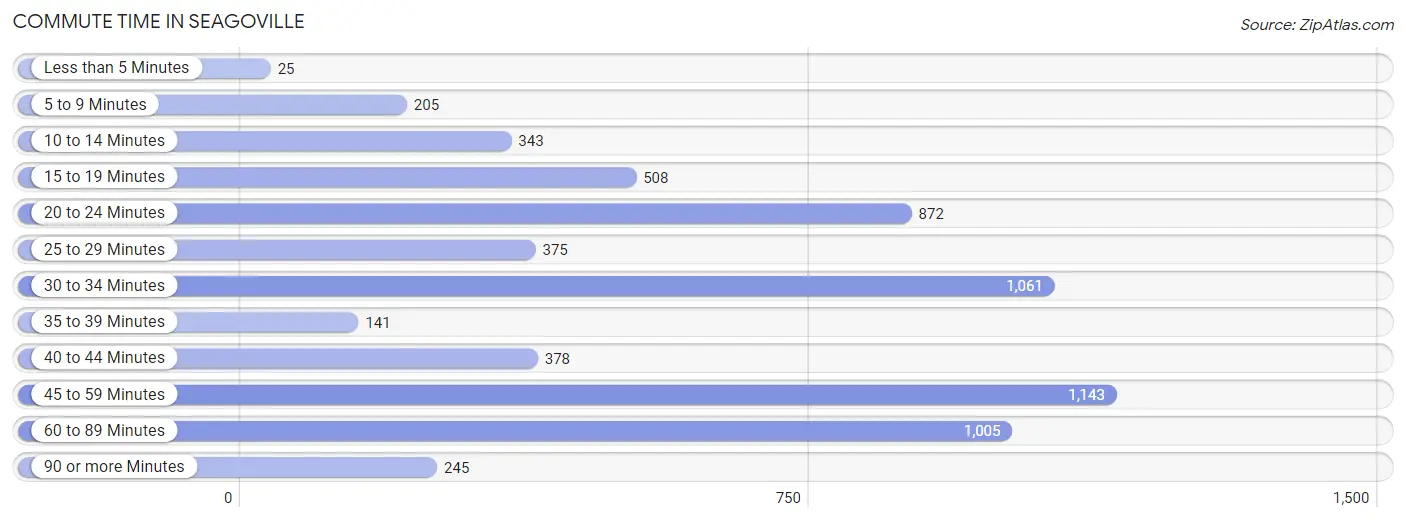
| Commute Time | # Commuters | % Commuters |
| Less than 5 Minutes | 25 | 0.4% |
| 5 to 9 Minutes | 205 | 3.3% |
| 10 to 14 Minutes | 343 | 5.4% |
| 15 to 19 Minutes | 508 | 8.1% |
| 20 to 24 Minutes | 872 | 13.8% |
| 25 to 29 Minutes | 375 | 5.9% |
| 30 to 34 Minutes | 1,061 | 16.8% |
| 35 to 39 Minutes | 141 | 2.2% |
| 40 to 44 Minutes | 378 | 6.0% |
| 45 to 59 Minutes | 1,143 | 18.1% |
| 60 to 89 Minutes | 1,005 | 16.0% |
| 90 or more Minutes | 245 | 3.9% |
Commute Time by Sex in Seagoville
The most common commute times in Seagoville are 45 to 59 minutes (741 commuters, 18.6%) for males and 15 to 19 minutes (422 commuters, 18.2%) for females.
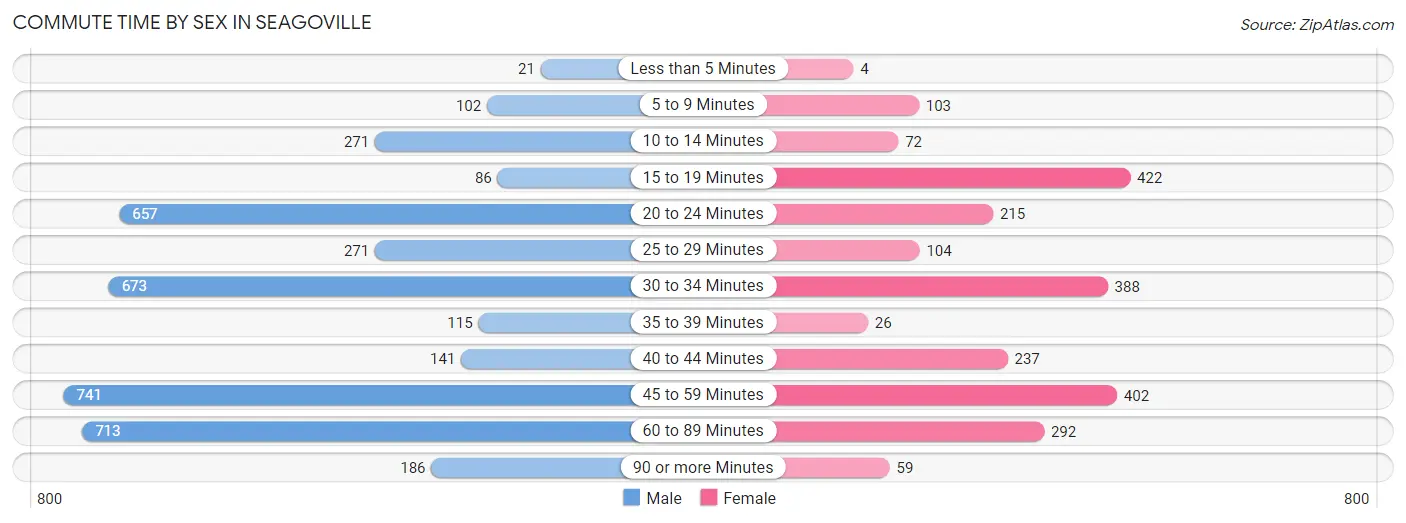
| Commute Time | Male | Female |
| Less than 5 Minutes | 21 (0.5%) | 4 (0.2%) |
| 5 to 9 Minutes | 102 (2.6%) | 103 (4.4%) |
| 10 to 14 Minutes | 271 (6.8%) | 72 (3.1%) |
| 15 to 19 Minutes | 86 (2.2%) | 422 (18.2%) |
| 20 to 24 Minutes | 657 (16.5%) | 215 (9.2%) |
| 25 to 29 Minutes | 271 (6.8%) | 104 (4.5%) |
| 30 to 34 Minutes | 673 (16.9%) | 388 (16.7%) |
| 35 to 39 Minutes | 115 (2.9%) | 26 (1.1%) |
| 40 to 44 Minutes | 141 (3.5%) | 237 (10.2%) |
| 45 to 59 Minutes | 741 (18.6%) | 402 (17.3%) |
| 60 to 89 Minutes | 713 (17.9%) | 292 (12.6%) |
| 90 or more Minutes | 186 (4.7%) | 59 (2.5%) |
Time of Departure to Work by Sex in Seagoville
The most frequent times of departure to work in Seagoville are 12:00 AM to 4:59 AM (556, 14.0%) for males and 5:30 AM to 5:59 AM (433, 18.6%) for females.
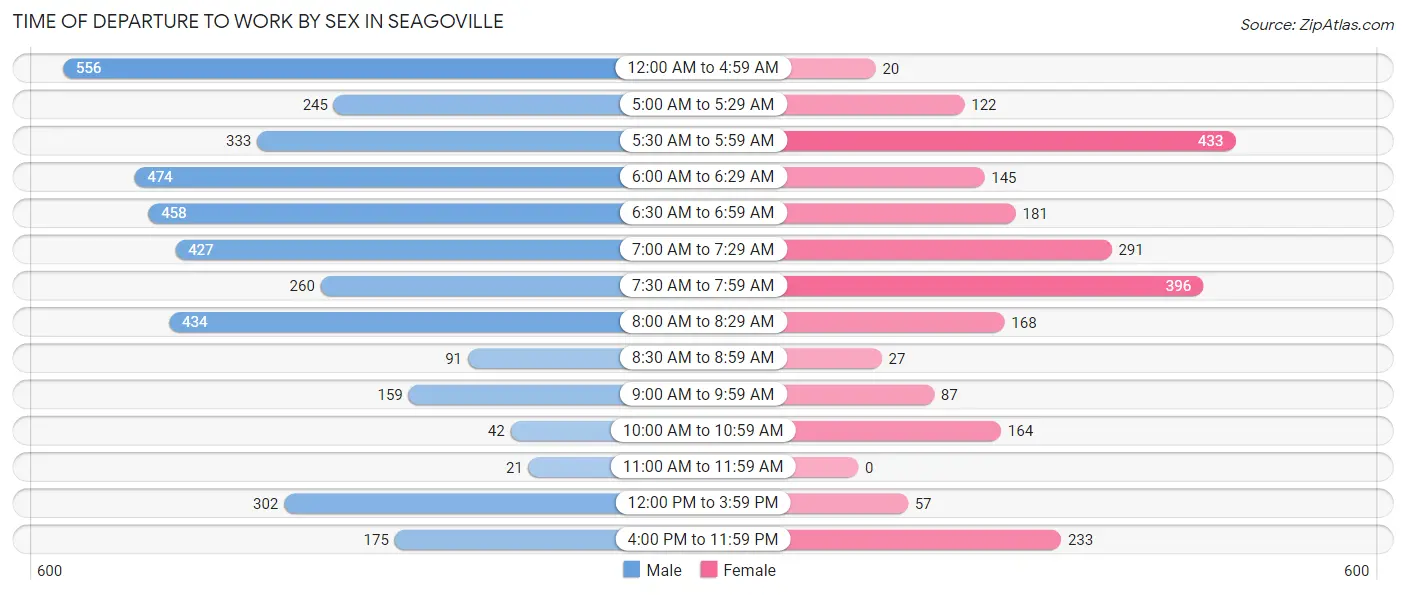
| Time of Departure | Male | Female |
| 12:00 AM to 4:59 AM | 556 (14.0%) | 20 (0.9%) |
| 5:00 AM to 5:29 AM | 245 (6.2%) | 122 (5.2%) |
| 5:30 AM to 5:59 AM | 333 (8.4%) | 433 (18.6%) |
| 6:00 AM to 6:29 AM | 474 (11.9%) | 145 (6.2%) |
| 6:30 AM to 6:59 AM | 458 (11.5%) | 181 (7.8%) |
| 7:00 AM to 7:29 AM | 427 (10.7%) | 291 (12.5%) |
| 7:30 AM to 7:59 AM | 260 (6.5%) | 396 (17.0%) |
| 8:00 AM to 8:29 AM | 434 (10.9%) | 168 (7.2%) |
| 8:30 AM to 8:59 AM | 91 (2.3%) | 27 (1.2%) |
| 9:00 AM to 9:59 AM | 159 (4.0%) | 87 (3.7%) |
| 10:00 AM to 10:59 AM | 42 (1.1%) | 164 (7.1%) |
| 11:00 AM to 11:59 AM | 21 (0.5%) | 0 (0.0%) |
| 12:00 PM to 3:59 PM | 302 (7.6%) | 57 (2.5%) |
| 4:00 PM to 11:59 PM | 175 (4.4%) | 233 (10.0%) |
| Total | 3,977 (100.0%) | 2,324 (100.0%) |
Housing Occupancy in Seagoville
Occupancy by Ownership in Seagoville
Of the total 5,185 dwellings in Seagoville, owner-occupied units account for 3,963 (76.4%), while renter-occupied units make up 1,222 (23.6%).
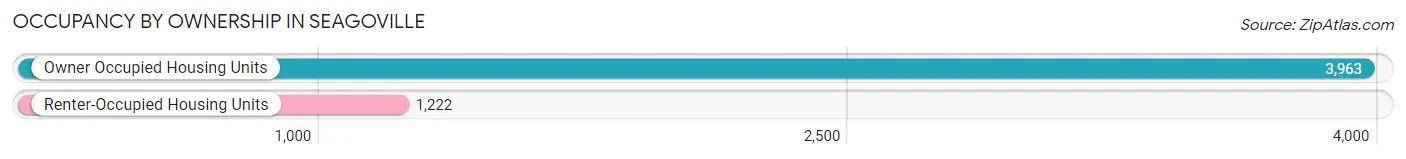
| Occupancy | # Housing Units | % Housing Units |
| Owner Occupied Housing Units | 3,963 | 76.4% |
| Renter-Occupied Housing Units | 1,222 | 23.6% |
| Total Occupied Housing Units | 5,185 | 100.0% |
Occupancy by Household Size in Seagoville
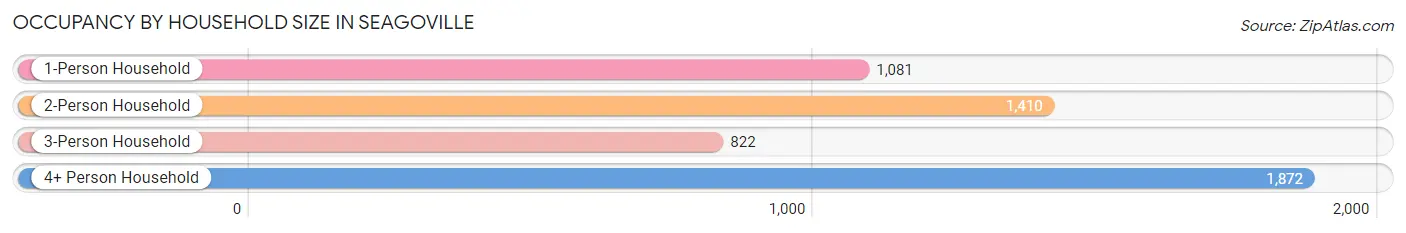
| Household Size | # Housing Units | % Housing Units |
| 1-Person Household | 1,081 | 20.8% |
| 2-Person Household | 1,410 | 27.2% |
| 3-Person Household | 822 | 15.9% |
| 4+ Person Household | 1,872 | 36.1% |
| Total Housing Units | 5,185 | 100.0% |
Occupancy by Ownership by Household Size in Seagoville
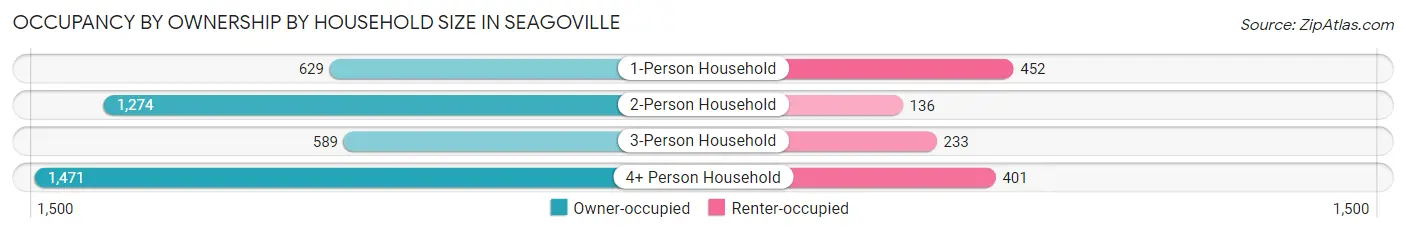
| Household Size | Owner-occupied | Renter-occupied |
| 1-Person Household | 629 (58.2%) | 452 (41.8%) |
| 2-Person Household | 1,274 (90.3%) | 136 (9.7%) |
| 3-Person Household | 589 (71.7%) | 233 (28.3%) |
| 4+ Person Household | 1,471 (78.6%) | 401 (21.4%) |
| Total Housing Units | 3,963 (76.4%) | 1,222 (23.6%) |
Occupancy by Educational Attainment in Seagoville
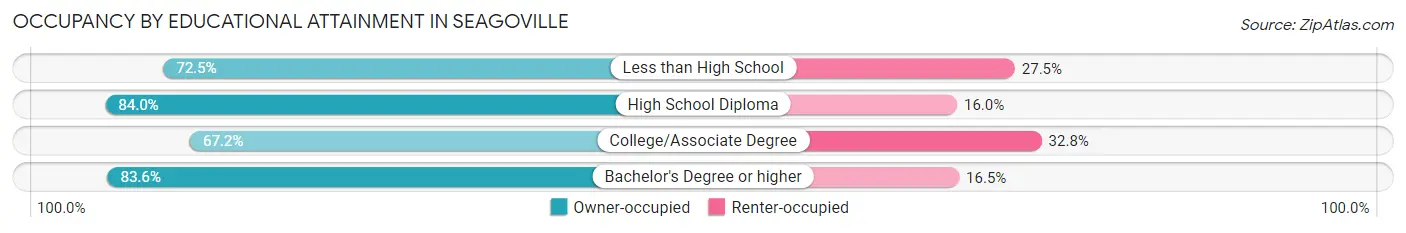
| Household Size | Owner-occupied | Renter-occupied |
| Less than High School | 688 (72.5%) | 261 (27.5%) |
| High School Diploma | 1,524 (84.0%) | 291 (16.0%) |
| College/Associate Degree | 1,116 (67.2%) | 545 (32.8%) |
| Bachelor's Degree or higher | 635 (83.6%) | 125 (16.5%) |
Occupancy by Age of Householder in Seagoville
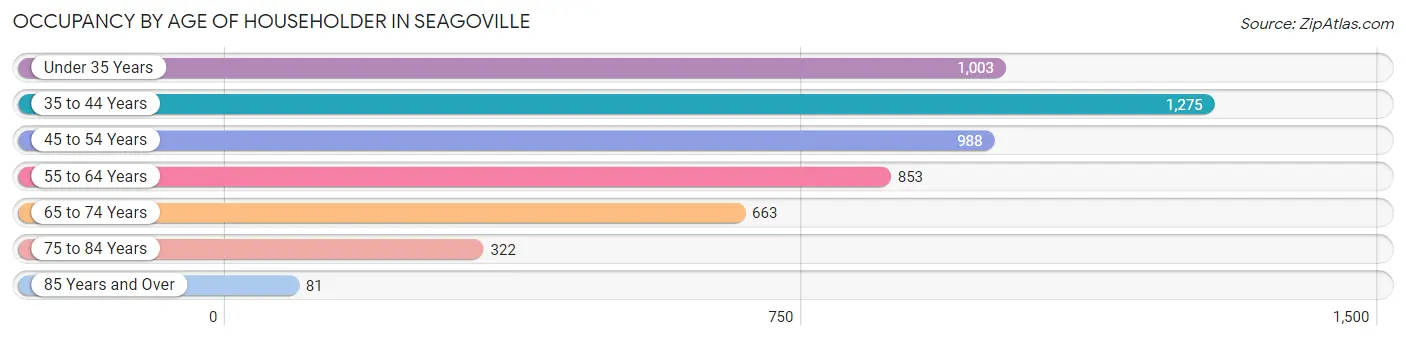
| Age Bracket | # Households | % Households |
| Under 35 Years | 1,003 | 19.3% |
| 35 to 44 Years | 1,275 | 24.6% |
| 45 to 54 Years | 988 | 19.1% |
| 55 to 64 Years | 853 | 16.5% |
| 65 to 74 Years | 663 | 12.8% |
| 75 to 84 Years | 322 | 6.2% |
| 85 Years and Over | 81 | 1.6% |
| Total | 5,185 | 100.0% |
Housing Finances in Seagoville
Median Income by Occupancy in Seagoville
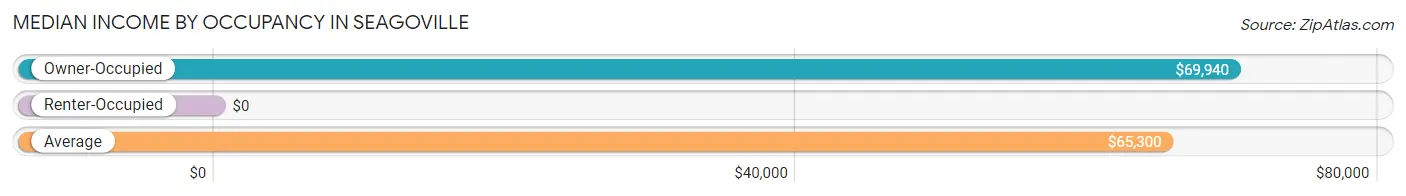
| Occupancy Type | # Households | Median Income |
| Owner-Occupied | 3,963 (76.4%) | $69,940 |
| Renter-Occupied | 1,222 (23.6%) | $0 |
| Average | 5,185 (100.0%) | $65,300 |
Occupancy by Householder Income Bracket in Seagoville
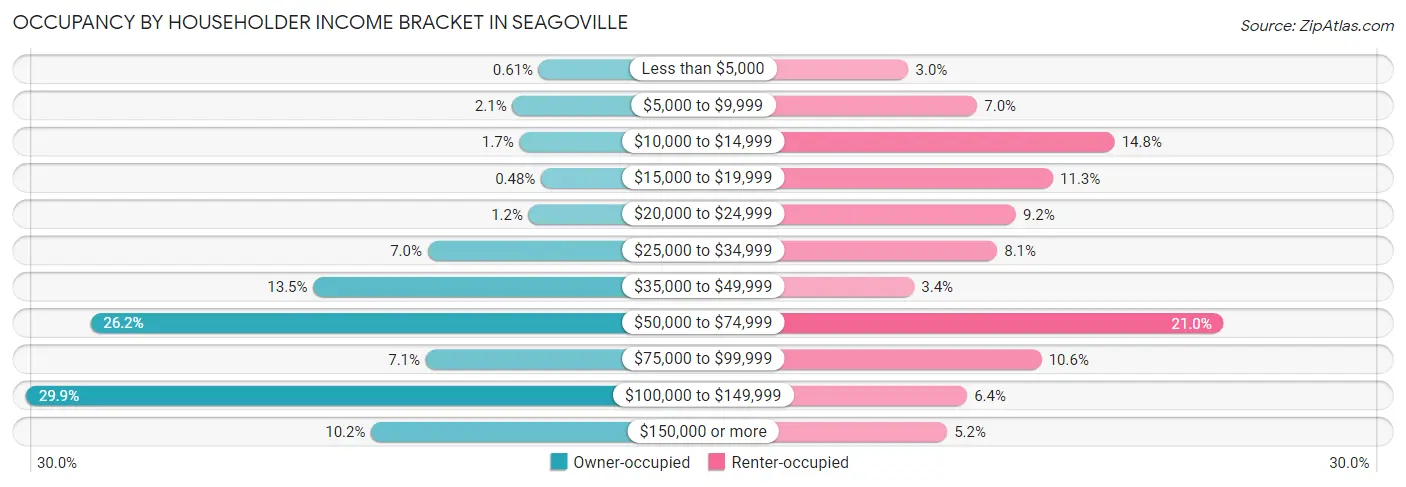
| Income Bracket | Owner-occupied | Renter-occupied |
| Less than $5,000 | 24 (0.6%) | 37 (3.0%) |
| $5,000 to $9,999 | 84 (2.1%) | 85 (7.0%) |
| $10,000 to $14,999 | 68 (1.7%) | 181 (14.8%) |
| $15,000 to $19,999 | 19 (0.5%) | 138 (11.3%) |
| $20,000 to $24,999 | 47 (1.2%) | 112 (9.2%) |
| $25,000 to $34,999 | 276 (7.0%) | 99 (8.1%) |
| $35,000 to $49,999 | 535 (13.5%) | 41 (3.4%) |
| $50,000 to $74,999 | 1,040 (26.2%) | 257 (21.0%) |
| $75,000 to $99,999 | 280 (7.1%) | 130 (10.6%) |
| $100,000 to $149,999 | 1,186 (29.9%) | 78 (6.4%) |
| $150,000 or more | 404 (10.2%) | 64 (5.2%) |
| Total | 3,963 (100.0%) | 1,222 (100.0%) |
Monthly Housing Cost Tiers in Seagoville
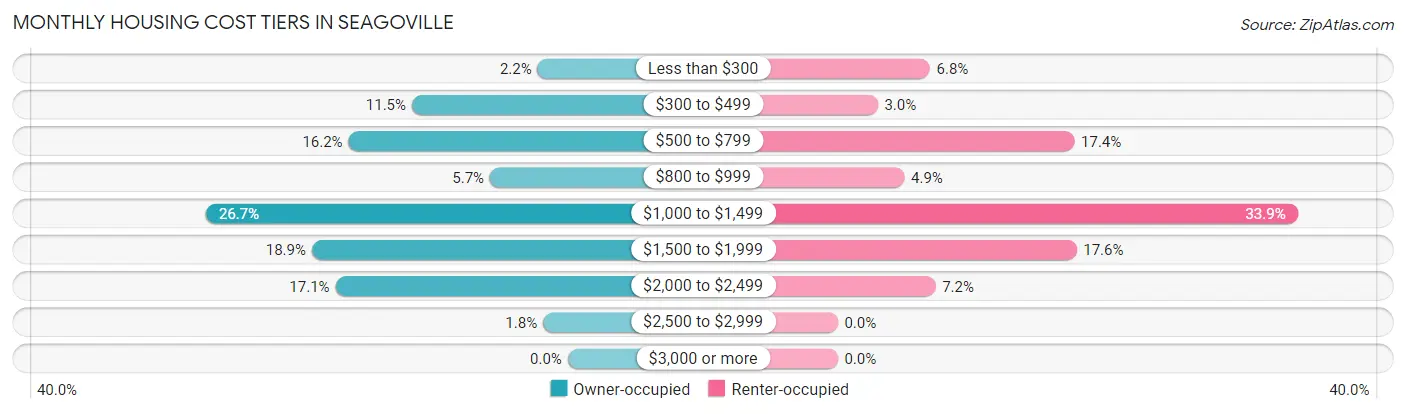
| Monthly Cost | Owner-occupied | Renter-occupied |
| Less than $300 | 88 (2.2%) | 83 (6.8%) |
| $300 to $499 | 455 (11.5%) | 36 (2.9%) |
| $500 to $799 | 640 (16.2%) | 213 (17.4%) |
| $800 to $999 | 227 (5.7%) | 60 (4.9%) |
| $1,000 to $1,499 | 1,056 (26.7%) | 414 (33.9%) |
| $1,500 to $1,999 | 747 (18.9%) | 215 (17.6%) |
| $2,000 to $2,499 | 678 (17.1%) | 88 (7.2%) |
| $2,500 to $2,999 | 72 (1.8%) | 0 (0.0%) |
| $3,000 or more | 0 (0.0%) | 0 (0.0%) |
| Total | 3,963 (100.0%) | 1,222 (100.0%) |
Physical Housing Characteristics in Seagoville
Housing Structures in Seagoville
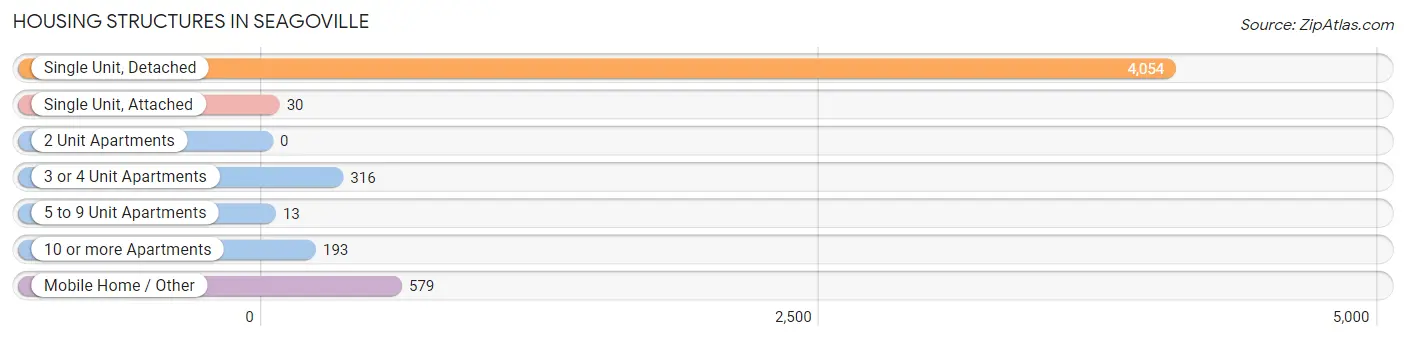
| Structure Type | # Housing Units | % Housing Units |
| Single Unit, Detached | 4,054 | 78.2% |
| Single Unit, Attached | 30 | 0.6% |
| 2 Unit Apartments | 0 | 0.0% |
| 3 or 4 Unit Apartments | 316 | 6.1% |
| 5 to 9 Unit Apartments | 13 | 0.3% |
| 10 or more Apartments | 193 | 3.7% |
| Mobile Home / Other | 579 | 11.2% |
| Total | 5,185 | 100.0% |
Housing Structures by Occupancy in Seagoville
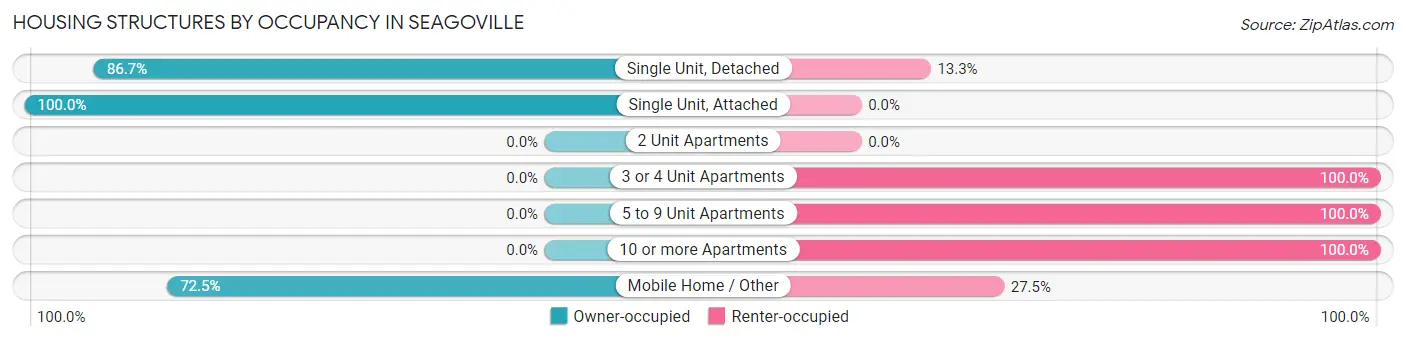
| Structure Type | Owner-occupied | Renter-occupied |
| Single Unit, Detached | 3,513 (86.7%) | 541 (13.3%) |
| Single Unit, Attached | 30 (100.0%) | 0 (0.0%) |
| 2 Unit Apartments | 0 (0.0%) | 0 (0.0%) |
| 3 or 4 Unit Apartments | 0 (0.0%) | 316 (100.0%) |
| 5 to 9 Unit Apartments | 0 (0.0%) | 13 (100.0%) |
| 10 or more Apartments | 0 (0.0%) | 193 (100.0%) |
| Mobile Home / Other | 420 (72.5%) | 159 (27.5%) |
| Total | 3,963 (76.4%) | 1,222 (23.6%) |
Housing Structures by Number of Rooms in Seagoville
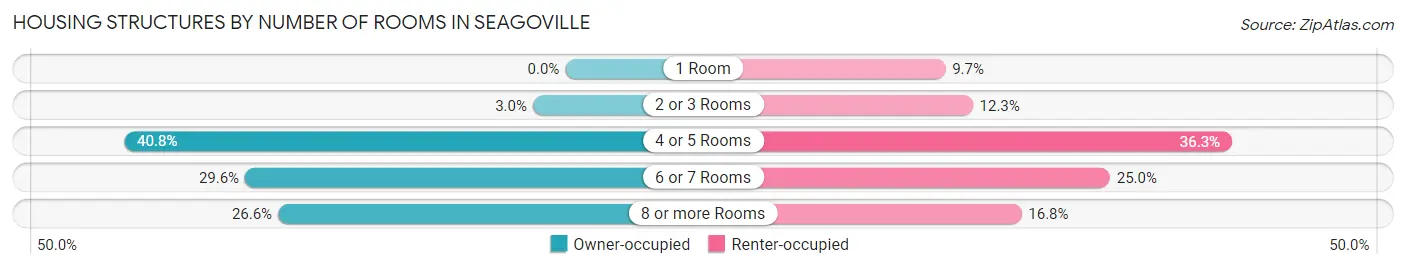
| Number of Rooms | Owner-occupied | Renter-occupied |
| 1 Room | 0 (0.0%) | 119 (9.7%) |
| 2 or 3 Rooms | 119 (3.0%) | 150 (12.3%) |
| 4 or 5 Rooms | 1,617 (40.8%) | 443 (36.2%) |
| 6 or 7 Rooms | 1,174 (29.6%) | 305 (25.0%) |
| 8 or more Rooms | 1,053 (26.6%) | 205 (16.8%) |
| Total | 3,963 (100.0%) | 1,222 (100.0%) |
Housing Structure by Heating Type in Seagoville
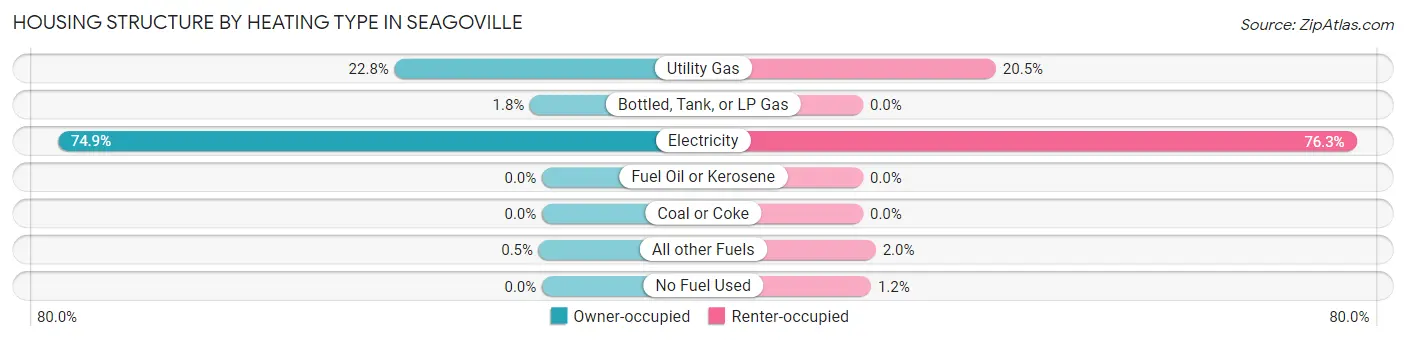
| Heating Type | Owner-occupied | Renter-occupied |
| Utility Gas | 903 (22.8%) | 251 (20.5%) |
| Bottled, Tank, or LP Gas | 73 (1.8%) | 0 (0.0%) |
| Electricity | 2,967 (74.9%) | 932 (76.3%) |
| Fuel Oil or Kerosene | 0 (0.0%) | 0 (0.0%) |
| Coal or Coke | 0 (0.0%) | 0 (0.0%) |
| All other Fuels | 20 (0.5%) | 24 (2.0%) |
| No Fuel Used | 0 (0.0%) | 15 (1.2%) |
| Total | 3,963 (100.0%) | 1,222 (100.0%) |
Household Vehicle Usage in Seagoville
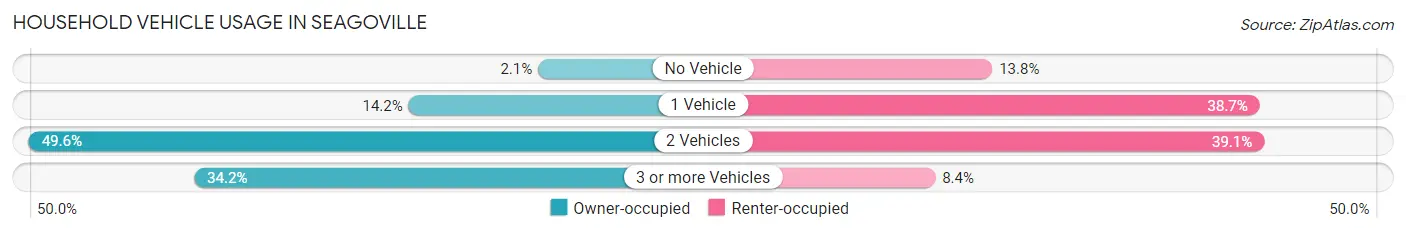
| Vehicles per Household | Owner-occupied | Renter-occupied |
| No Vehicle | 82 (2.1%) | 168 (13.8%) |
| 1 Vehicle | 561 (14.2%) | 473 (38.7%) |
| 2 Vehicles | 1,966 (49.6%) | 478 (39.1%) |
| 3 or more Vehicles | 1,354 (34.2%) | 103 (8.4%) |
| Total | 3,963 (100.0%) | 1,222 (100.0%) |
Real Estate & Mortgages in Seagoville
Real Estate and Mortgage Overview in Seagoville
| Characteristic | Without Mortgage | With Mortgage |
| Housing Units | 1,373 | 2,590 |
| Median Property Value | $163,600 | $206,600 |
| Median Household Income | $59,641 | $202 |
| Monthly Housing Costs | $619 | $0 |
| Real Estate Taxes | $1,959 | $200 |
Property Value by Mortgage Status in Seagoville
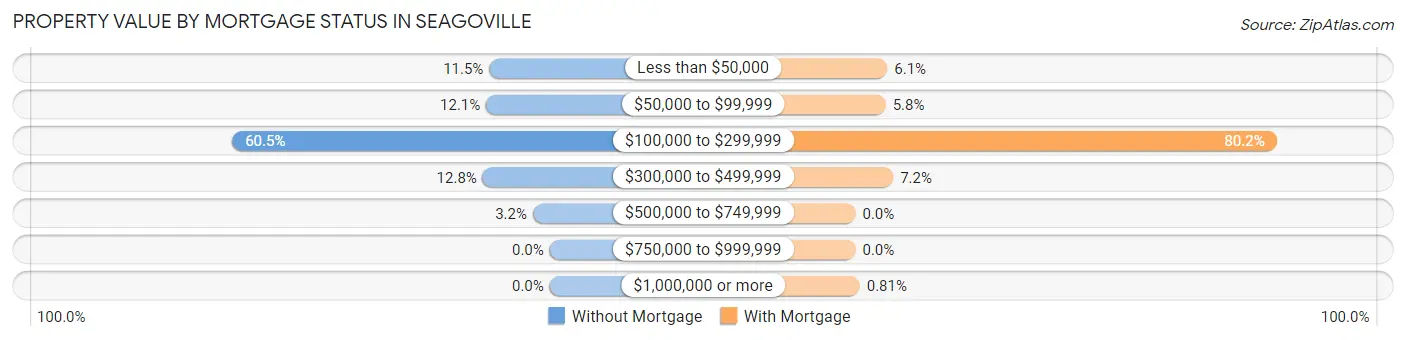
| Property Value | Without Mortgage | With Mortgage |
| Less than $50,000 | 158 (11.5%) | 157 (6.1%) |
| $50,000 to $99,999 | 166 (12.1%) | 149 (5.8%) |
| $100,000 to $299,999 | 830 (60.5%) | 2,077 (80.2%) |
| $300,000 to $499,999 | 175 (12.8%) | 186 (7.2%) |
| $500,000 to $749,999 | 44 (3.2%) | 0 (0.0%) |
| $750,000 to $999,999 | 0 (0.0%) | 0 (0.0%) |
| $1,000,000 or more | 0 (0.0%) | 21 (0.8%) |
| Total | 1,373 (100.0%) | 2,590 (100.0%) |
Household Income by Mortgage Status in Seagoville
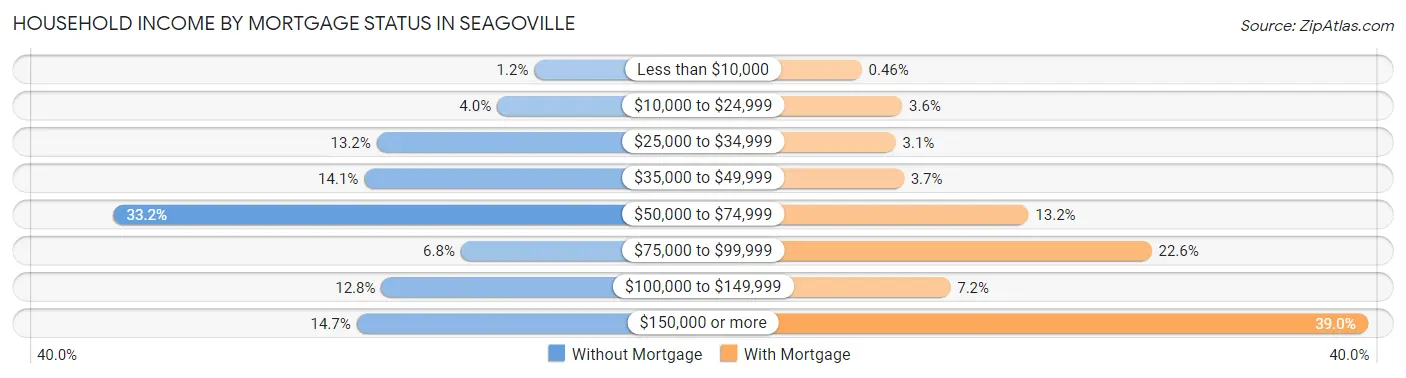
| Household Income | Without Mortgage | With Mortgage |
| Less than $10,000 | 16 (1.2%) | 12 (0.5%) |
| $10,000 to $24,999 | 55 (4.0%) | 92 (3.5%) |
| $25,000 to $34,999 | 181 (13.2%) | 79 (3.0%) |
| $35,000 to $49,999 | 194 (14.1%) | 95 (3.7%) |
| $50,000 to $74,999 | 456 (33.2%) | 341 (13.2%) |
| $75,000 to $99,999 | 93 (6.8%) | 584 (22.6%) |
| $100,000 to $149,999 | 176 (12.8%) | 187 (7.2%) |
| $150,000 or more | 202 (14.7%) | 1,010 (39.0%) |
| Total | 1,373 (100.0%) | 2,590 (100.0%) |
Property Value to Household Income Ratio in Seagoville
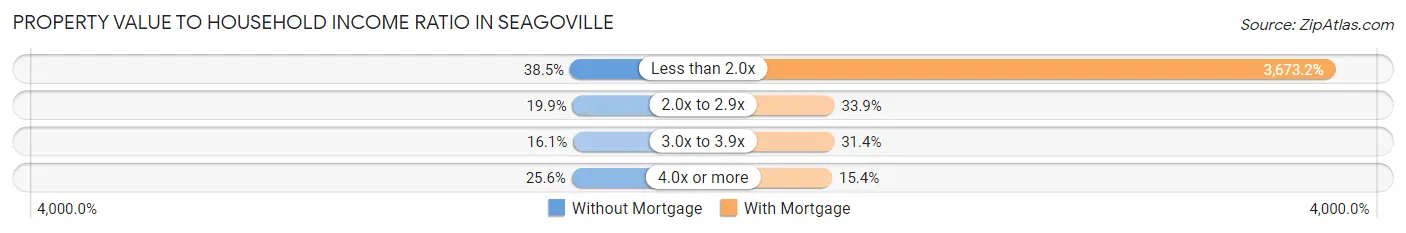
| Value-to-Income Ratio | Without Mortgage | With Mortgage |
| Less than 2.0x | 528 (38.5%) | 95,135 (3,673.2%) |
| 2.0x to 2.9x | 273 (19.9%) | 879 (33.9%) |
| 3.0x to 3.9x | 221 (16.1%) | 812 (31.4%) |
| 4.0x or more | 351 (25.6%) | 398 (15.4%) |
| Total | 1,373 (100.0%) | 2,590 (100.0%) |
Real Estate Taxes by Mortgage Status in Seagoville
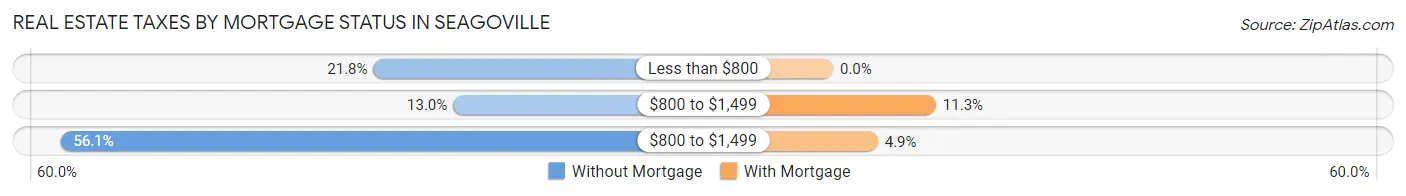
| Property Taxes | Without Mortgage | With Mortgage |
| Less than $800 | 299 (21.8%) | 0 (0.0%) |
| $800 to $1,499 | 179 (13.0%) | 292 (11.3%) |
| $800 to $1,499 | 770 (56.1%) | 127 (4.9%) |
| Total | 1,373 (100.0%) | 2,590 (100.0%) |
Health & Disability in Seagoville
Health Insurance Coverage by Age in Seagoville
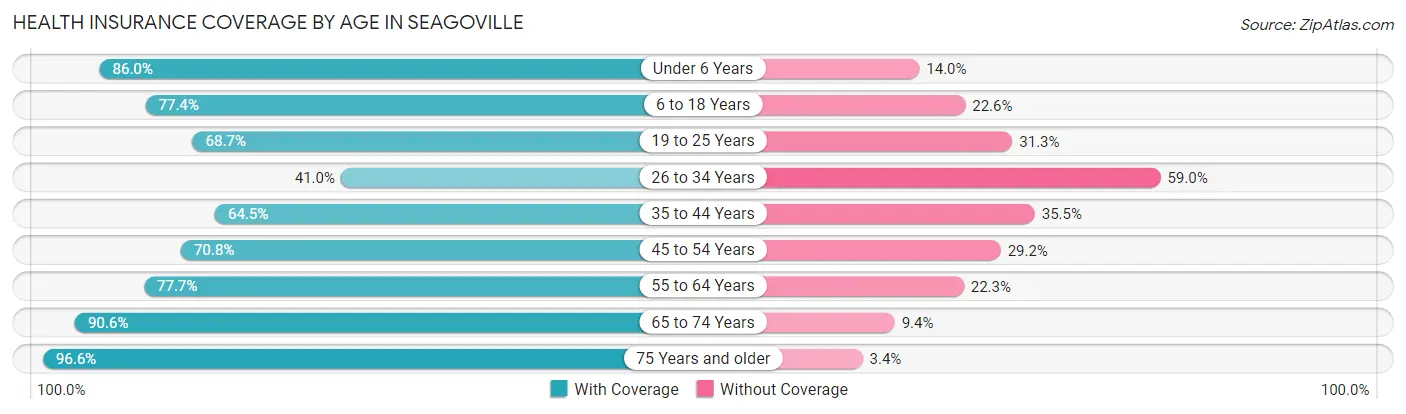
| Age Bracket | With Coverage | Without Coverage |
| Under 6 Years | 1,659 (86.0%) | 270 (14.0%) |
| 6 to 18 Years | 2,597 (77.4%) | 757 (22.6%) |
| 19 to 25 Years | 1,091 (68.7%) | 498 (31.3%) |
| 26 to 34 Years | 882 (41.0%) | 1,267 (59.0%) |
| 35 to 44 Years | 1,635 (64.5%) | 901 (35.5%) |
| 45 to 54 Years | 1,253 (70.8%) | 516 (29.2%) |
| 55 to 64 Years | 1,011 (77.7%) | 290 (22.3%) |
| 65 to 74 Years | 1,272 (90.6%) | 132 (9.4%) |
| 75 Years and older | 649 (96.6%) | 23 (3.4%) |
| Total | 12,049 (72.1%) | 4,654 (27.9%) |
Health Insurance Coverage by Citizenship Status in Seagoville
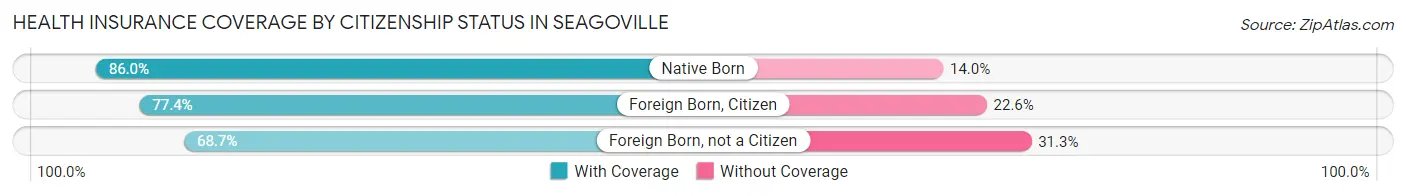
| Citizenship Status | With Coverage | Without Coverage |
| Native Born | 1,659 (86.0%) | 270 (14.0%) |
| Foreign Born, Citizen | 2,597 (77.4%) | 757 (22.6%) |
| Foreign Born, not a Citizen | 1,091 (68.7%) | 498 (31.3%) |
Health Insurance Coverage by Household Income in Seagoville
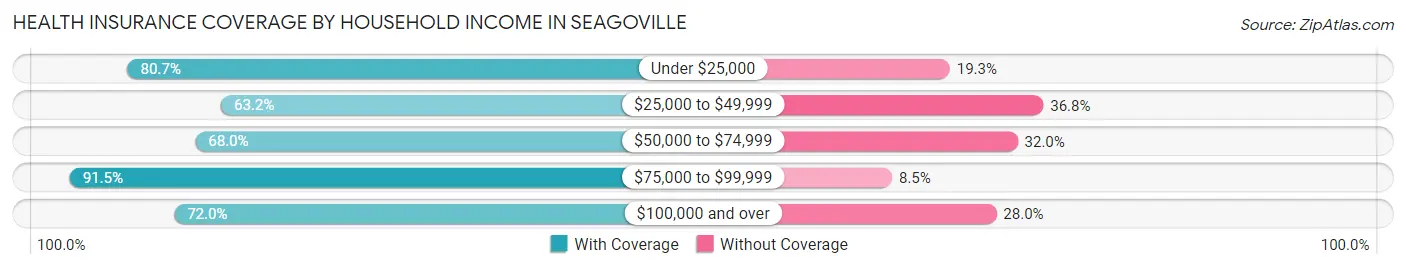
| Household Income | With Coverage | Without Coverage |
| Under $25,000 | 1,514 (80.7%) | 362 (19.3%) |
| $25,000 to $49,999 | 1,684 (63.2%) | 981 (36.8%) |
| $50,000 to $74,999 | 2,743 (68.0%) | 1,291 (32.0%) |
| $75,000 to $99,999 | 1,209 (91.5%) | 112 (8.5%) |
| $100,000 and over | 4,899 (72.0%) | 1,908 (28.0%) |
Public vs Private Health Insurance Coverage by Age in Seagoville
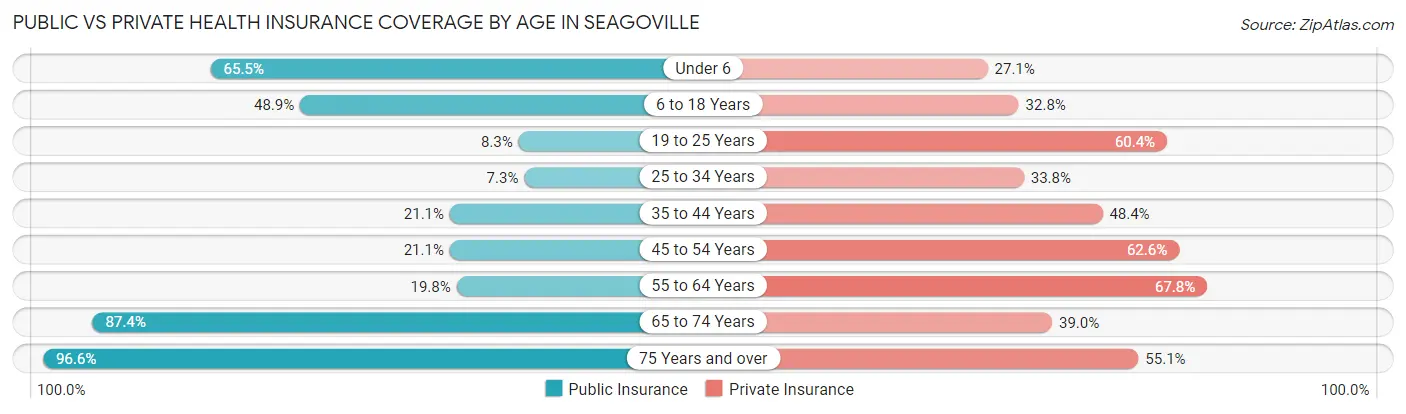
| Age Bracket | Public Insurance | Private Insurance |
| Under 6 | 1,263 (65.5%) | 522 (27.1%) |
| 6 to 18 Years | 1,639 (48.9%) | 1,101 (32.8%) |
| 19 to 25 Years | 132 (8.3%) | 959 (60.4%) |
| 25 to 34 Years | 156 (7.3%) | 726 (33.8%) |
| 35 to 44 Years | 534 (21.1%) | 1,227 (48.4%) |
| 45 to 54 Years | 373 (21.1%) | 1,107 (62.6%) |
| 55 to 64 Years | 258 (19.8%) | 882 (67.8%) |
| 65 to 74 Years | 1,227 (87.4%) | 548 (39.0%) |
| 75 Years and over | 649 (96.6%) | 370 (55.1%) |
| Total | 6,231 (37.3%) | 7,442 (44.6%) |
Disability Status by Sex by Age in Seagoville
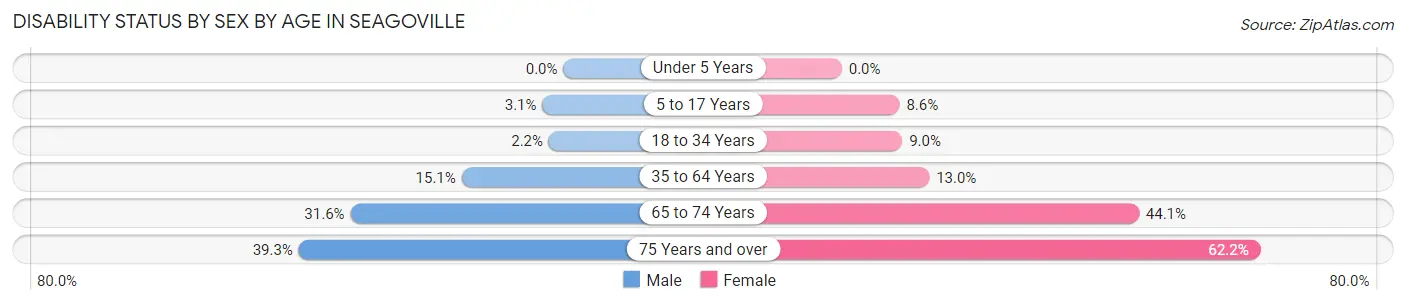
| Age Bracket | Male | Female |
| Under 5 Years | 0 (0.0%) | 0 (0.0%) |
| 5 to 17 Years | 52 (3.1%) | 163 (8.6%) |
| 18 to 34 Years | 45 (2.1%) | 156 (9.0%) |
| 35 to 64 Years | 457 (15.1%) | 335 (13.0%) |
| 65 to 74 Years | 178 (31.6%) | 371 (44.1%) |
| 75 Years and over | 101 (39.3%) | 258 (62.2%) |
Disability Class by Sex by Age in Seagoville
Disability Class: Hearing Difficulty
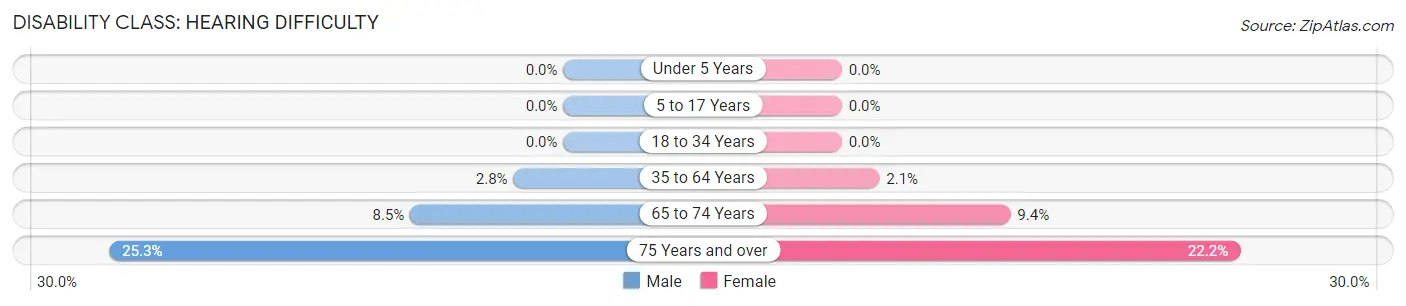
| Age Bracket | Male | Female |
| Under 5 Years | 0 (0.0%) | 0 (0.0%) |
| 5 to 17 Years | 0 (0.0%) | 0 (0.0%) |
| 18 to 34 Years | 0 (0.0%) | 0 (0.0%) |
| 35 to 64 Years | 84 (2.8%) | 54 (2.1%) |
| 65 to 74 Years | 48 (8.5%) | 79 (9.4%) |
| 75 Years and over | 65 (25.3%) | 92 (22.2%) |
Disability Class: Vision Difficulty
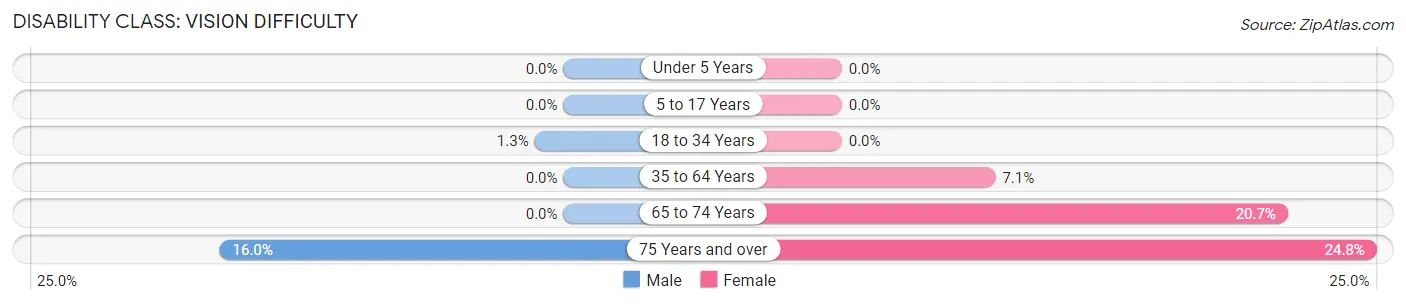
| Age Bracket | Male | Female |
| Under 5 Years | 0 (0.0%) | 0 (0.0%) |
| 5 to 17 Years | 0 (0.0%) | 0 (0.0%) |
| 18 to 34 Years | 28 (1.3%) | 0 (0.0%) |
| 35 to 64 Years | 0 (0.0%) | 184 (7.1%) |
| 65 to 74 Years | 0 (0.0%) | 174 (20.7%) |
| 75 Years and over | 41 (16.0%) | 103 (24.8%) |
Disability Class: Cognitive Difficulty
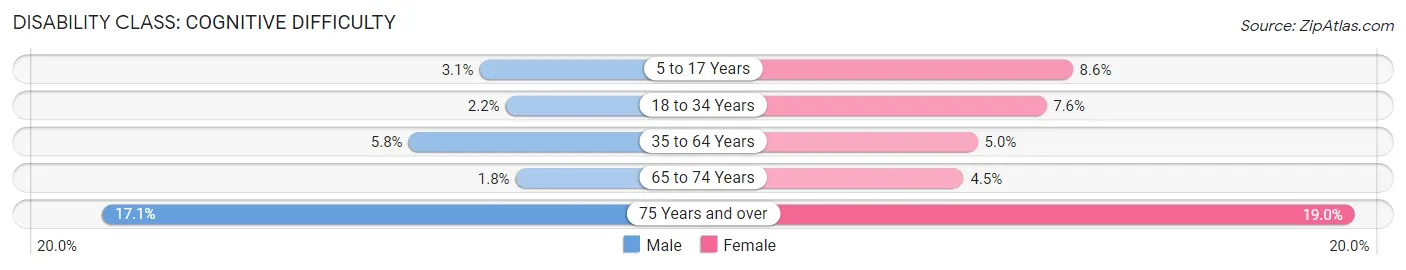
| Age Bracket | Male | Female |
| 5 to 17 Years | 52 (3.1%) | 163 (8.6%) |
| 18 to 34 Years | 45 (2.1%) | 132 (7.6%) |
| 35 to 64 Years | 174 (5.8%) | 130 (5.0%) |
| 65 to 74 Years | 10 (1.8%) | 38 (4.5%) |
| 75 Years and over | 44 (17.1%) | 79 (19.0%) |
Disability Class: Ambulatory Difficulty
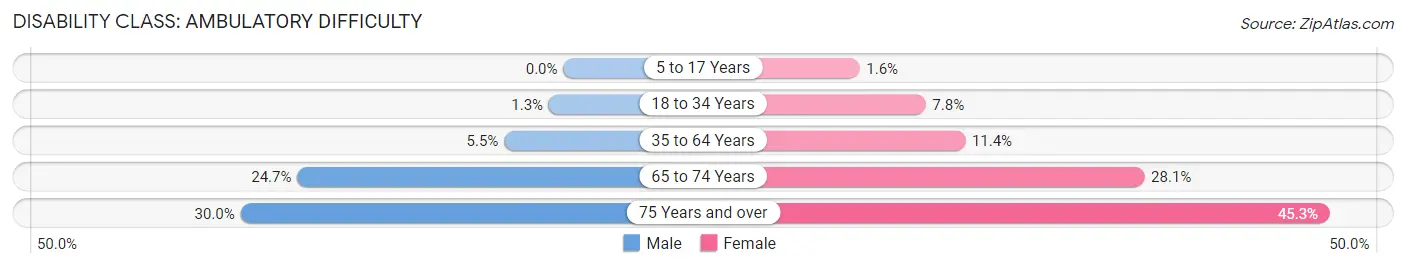
| Age Bracket | Male | Female |
| 5 to 17 Years | 0 (0.0%) | 31 (1.6%) |
| 18 to 34 Years | 28 (1.3%) | 135 (7.8%) |
| 35 to 64 Years | 166 (5.5%) | 295 (11.4%) |
| 65 to 74 Years | 139 (24.7%) | 236 (28.1%) |
| 75 Years and over | 77 (30.0%) | 188 (45.3%) |
Disability Class: Self-Care Difficulty
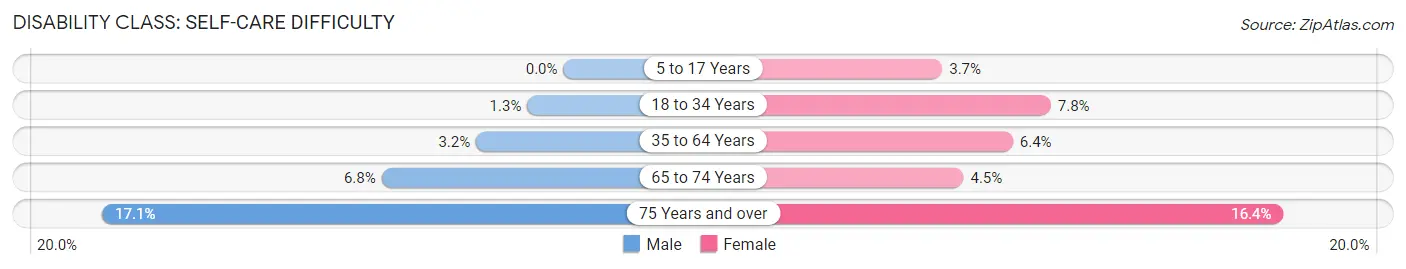
| Age Bracket | Male | Female |
| 5 to 17 Years | 0 (0.0%) | 71 (3.7%) |
| 18 to 34 Years | 28 (1.3%) | 135 (7.8%) |
| 35 to 64 Years | 98 (3.2%) | 164 (6.4%) |
| 65 to 74 Years | 38 (6.8%) | 38 (4.5%) |
| 75 Years and over | 44 (17.1%) | 68 (16.4%) |
Technology Access in Seagoville
Computing Device Access in Seagoville
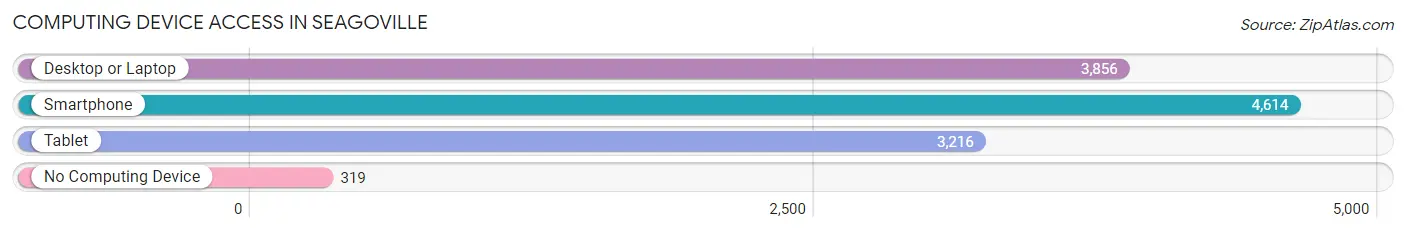
| Device Type | # Households | % Households |
| Desktop or Laptop | 3,856 | 74.4% |
| Smartphone | 4,614 | 89.0% |
| Tablet | 3,216 | 62.0% |
| No Computing Device | 319 | 6.1% |
| Total | 5,185 | 100.0% |
Internet Access in Seagoville
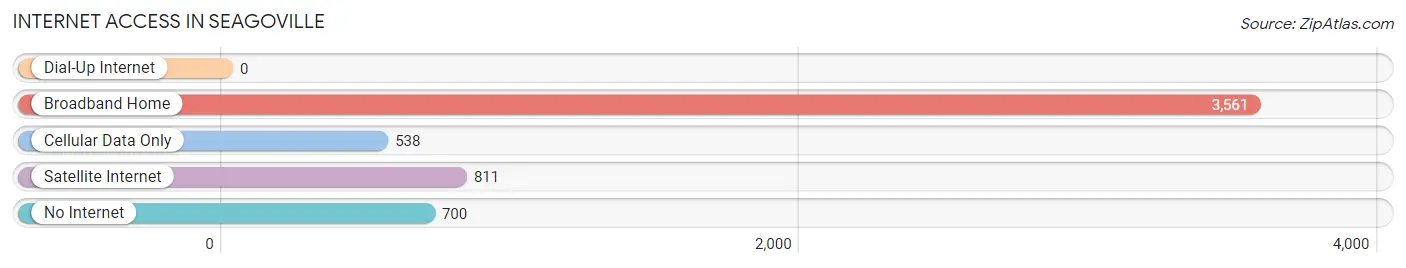
| Internet Type | # Households | % Households |
| Dial-Up Internet | 0 | 0.0% |
| Broadband Home | 3,561 | 68.7% |
| Cellular Data Only | 538 | 10.4% |
| Satellite Internet | 811 | 15.6% |
| No Internet | 700 | 13.5% |
| Total | 5,185 | 100.0% |
Seagoville Summary
Seagoville is a city located in Dallas County, Texas, United States. It is located in the southeastern part of the county, approximately 15 miles southeast of downtown Dallas. The population was 14,835 at the 2010 census.
History
The area that is now Seagoville was first settled in the 1840s by a group of settlers from Tennessee. The settlement was originally known as Muddy Creek, but was later renamed Seagoville in honor of the Seago family, who were among the first settlers.
The city was officially incorporated in 1945. During the 1950s and 1960s, Seagoville experienced a period of rapid growth, as the city became a popular destination for those seeking affordable housing.
Geography
Seagoville is located at 32°38'25" North, 96°31'17" West (32.6403, -96.5214). According to the United States Census Bureau, the city has a total area of 5.2 square miles, all of it land.
Economy
Seagoville is home to a variety of businesses, including manufacturing, retail, and service industries. The city is also home to several large employers, including the Seagoville Federal Correctional Institution, which employs over 1,000 people.
Demographics
As of the 2010 census, there were 14,835 people, 4,945 households, and 3,541 families residing in the city. The population density was 2,867.2 people per square mile. The racial makeup of the city was 68.2% White, 16.2% African American, 0.7% Native American, 0.7% Asian, 0.1% Pacific Islander, 11.3% from other races, and 2.9% from two or more races. Hispanic or Latino of any race were 24.3% of the population.
The median income for a household in the city was $37,945, and the median income for a family was $45,945. The per capita income for the city was $17,845. About 16.2% of families and 19.2% of the population were below the poverty line, including 25.2% of those under age 18 and 11.2% of those age 65 or over.
Common Questions
What is Per Capita Income in Seagoville?
Per Capita income in Seagoville is $23,241.
What is the Median Family Income in Seagoville?
Median Family Income in Seagoville is $63,181.
What is the Median Household income in Seagoville?
Median Household Income in Seagoville is $65,300.
What is Income or Wage Gap in Seagoville?
Income or Wage Gap in Seagoville is 3.4%.
Women in Seagoville earn 96.6 cents for every dollar earned by a man.
What is Inequality or Gini Index in Seagoville?
Inequality or Gini Index in Seagoville is 0.38.
What is the Total Population of Seagoville?
Total Population of Seagoville is 18,658.
What is the Total Male Population of Seagoville?
Total Male Population of Seagoville is 10,520.
What is the Total Female Population of Seagoville?
Total Female Population of Seagoville is 8,138.
What is the Ratio of Males per 100 Females in Seagoville?
There are 129.27 Males per 100 Females in Seagoville.
What is the Ratio of Females per 100 Males in Seagoville?
There are 77.36 Females per 100 Males in Seagoville.
What is the Median Population Age in Seagoville?
Median Population Age in Seagoville is 34.6 Years.
What is the Average Family Size in Seagoville
Average Family Size in Seagoville is 3.7 People.
What is the Average Household Size in Seagoville
Average Household Size in Seagoville is 3.2 People.
How Large is the Labor Force in Seagoville?
There are 7,722 People in the Labor Forcein in Seagoville.
What is the Percentage of People in the Labor Force in Seagoville?
54.9% of People are in the Labor Force in Seagoville.
What is the Unemployment Rate in Seagoville?
Unemployment Rate in Seagoville is 7.3%.